Wagon Wheel, AZ Map & Demographics
Wagon Wheel Map
Wagon Wheel Overview
$30,306
PER CAPITA INCOME
$74,276
AVG FAMILY INCOME
$54,354
AVG HOUSEHOLD INCOME
62.9%
WAGE / INCOME GAP [ % ]
37.1¢/ $1
WAGE / INCOME GAP [ $ ]
0.35
INEQUALITY / GINI INDEX
1,406
TOTAL POPULATION
633
MALE POPULATION
773
FEMALE POPULATION
81.89
MALES / 100 FEMALES
122.12
FEMALES / 100 MALES
58.3
MEDIAN AGE
2.6
AVG FAMILY SIZE
2.1
AVG HOUSEHOLD SIZE
673
LABOR FORCE [ PEOPLE ]
47.9%
PERCENT IN LABOR FORCE
3.1%
UNEMPLOYMENT RATE
Income in Wagon Wheel
Income Overview in Wagon Wheel
Per Capita Income in Wagon Wheel is $30,306, while median incomes of families and households are $74,276 and $54,354 respectively.
| Characteristic | Number | Measure |
| Per Capita Income | 1,406 | $30,306 |
| Median Family Income | 436 | $74,276 |
| Mean Family Income | 436 | $81,610 |
| Median Household Income | 643 | $54,354 |
| Mean Household Income | 643 | $64,183 |
| Income Deficit | 436 | $0 |
| Wage / Income Gap (%) | 1,406 | 62.87% |
| Wage / Income Gap ($) | 1,406 | 37.13¢ per $1 |
| Gini / Inequality Index | 1,406 | 0.35 |
Earnings by Sex in Wagon Wheel
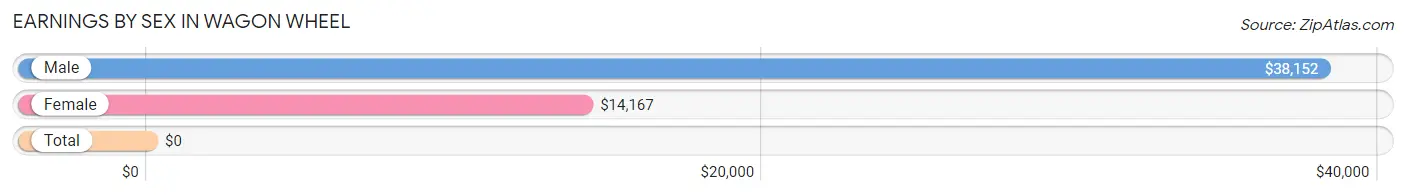
| Sex | Number | Average Earnings |
| Male | 344 (46.1%) | $38,152 |
| Female | 402 (53.9%) | $14,167 |
| Total | 746 (100.0%) | $0 |
Earnings by Sex by Income Bracket in Wagon Wheel
The most common earnings brackets in Wagon Wheel are $2,499 or less for men (68 | 19.8%) and $12,500 to $14,999 for women (153 | 38.1%).
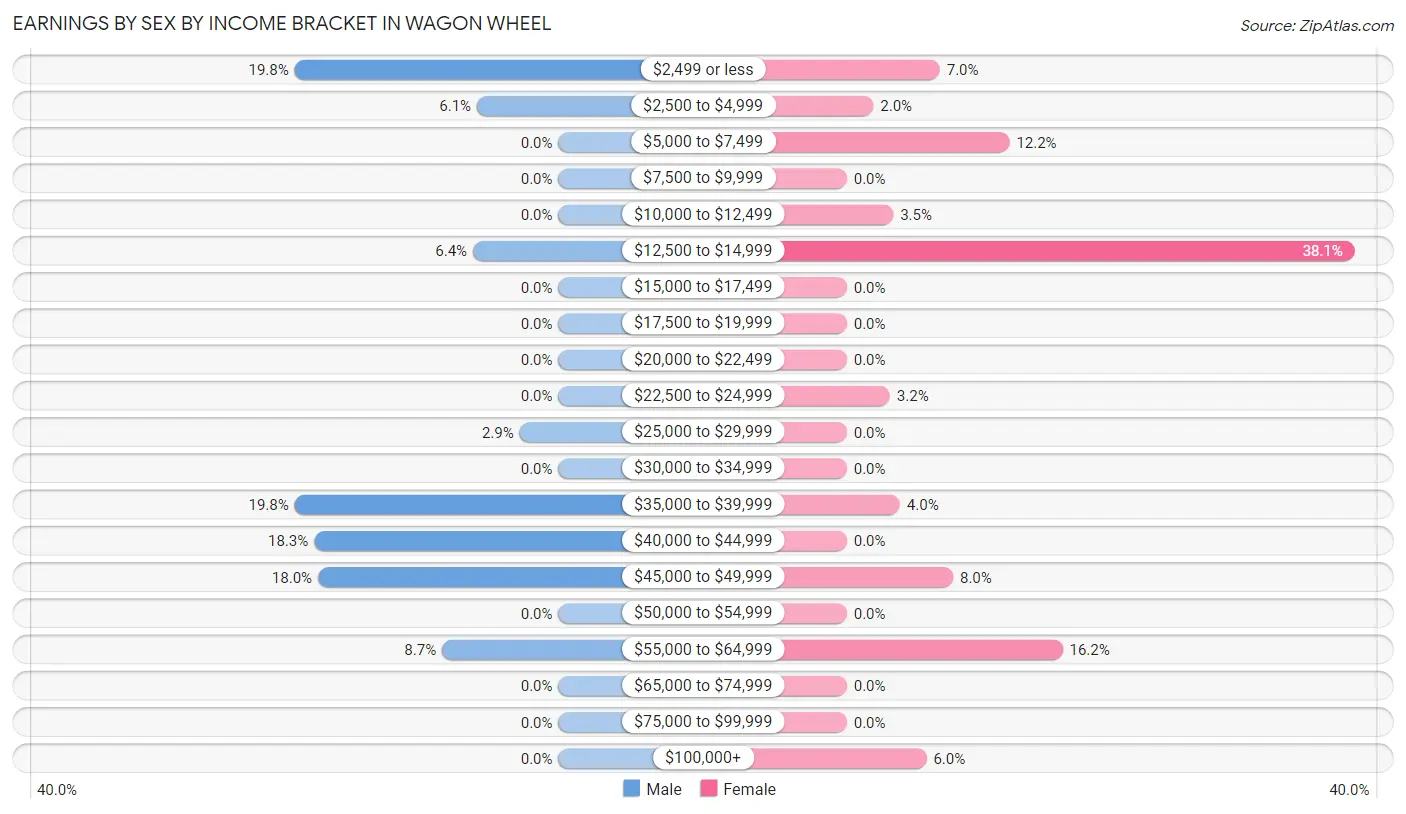
| Income | Male | Female |
| $2,499 or less | 68 (19.8%) | 28 (7.0%) |
| $2,500 to $4,999 | 21 (6.1%) | 8 (2.0%) |
| $5,000 to $7,499 | 0 (0.0%) | 49 (12.2%) |
| $7,500 to $9,999 | 0 (0.0%) | 0 (0.0%) |
| $10,000 to $12,499 | 0 (0.0%) | 14 (3.5%) |
| $12,500 to $14,999 | 22 (6.4%) | 153 (38.1%) |
| $15,000 to $17,499 | 0 (0.0%) | 0 (0.0%) |
| $17,500 to $19,999 | 0 (0.0%) | 0 (0.0%) |
| $20,000 to $22,499 | 0 (0.0%) | 0 (0.0%) |
| $22,500 to $24,999 | 0 (0.0%) | 13 (3.2%) |
| $25,000 to $29,999 | 10 (2.9%) | 0 (0.0%) |
| $30,000 to $34,999 | 0 (0.0%) | 0 (0.0%) |
| $35,000 to $39,999 | 68 (19.8%) | 16 (4.0%) |
| $40,000 to $44,999 | 63 (18.3%) | 0 (0.0%) |
| $45,000 to $49,999 | 62 (18.0%) | 32 (8.0%) |
| $50,000 to $54,999 | 0 (0.0%) | 0 (0.0%) |
| $55,000 to $64,999 | 30 (8.7%) | 65 (16.2%) |
| $65,000 to $74,999 | 0 (0.0%) | 0 (0.0%) |
| $75,000 to $99,999 | 0 (0.0%) | 0 (0.0%) |
| $100,000+ | 0 (0.0%) | 24 (6.0%) |
| Total | 344 (100.0%) | 402 (100.0%) |
Earnings by Sex by Educational Attainment in Wagon Wheel
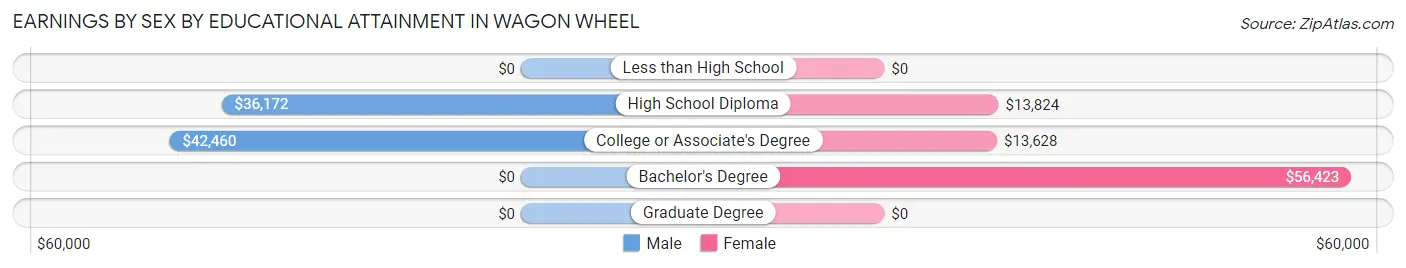
| Educational Attainment | Male Income | Female Income |
| Less than High School | - | - |
| High School Diploma | $36,172 | $13,824 |
| College or Associate's Degree | $42,460 | $13,628 |
| Bachelor's Degree | - | - |
| Graduate Degree | - | - |
| Total | $39,728 | $0 |
Family Income in Wagon Wheel
Family Income Brackets in Wagon Wheel
According to the Wagon Wheel family income data, there are 168 families falling into the $50,000 to $74,999 income range, which is the most common income bracket and makes up 38.5% of all families.
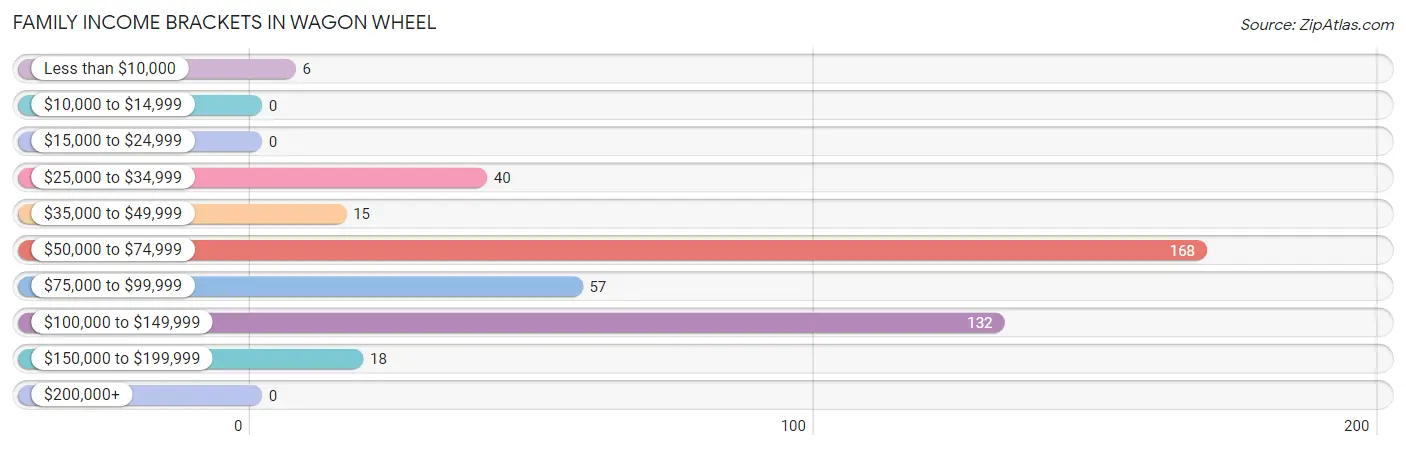
| Income Bracket | # Families | % Families |
| Less than $10,000 | 6 | 1.4% |
| $10,000 to $14,999 | 0 | 0.0% |
| $15,000 to $24,999 | 0 | 0.0% |
| $25,000 to $34,999 | 40 | 9.2% |
| $35,000 to $49,999 | 15 | 3.4% |
| $50,000 to $74,999 | 168 | 38.5% |
| $75,000 to $99,999 | 57 | 13.1% |
| $100,000 to $149,999 | 132 | 30.3% |
| $150,000 to $199,999 | 18 | 4.1% |
| $200,000+ | 0 | 0.0% |
Family Income by Famaliy Size in Wagon Wheel
3-person families (153 | 35.1%) account for the highest median family income in Wagon Wheel with $74,076 per family, while 2-person families (256 | 58.7%) have the highest median income of $36,160 per family member.
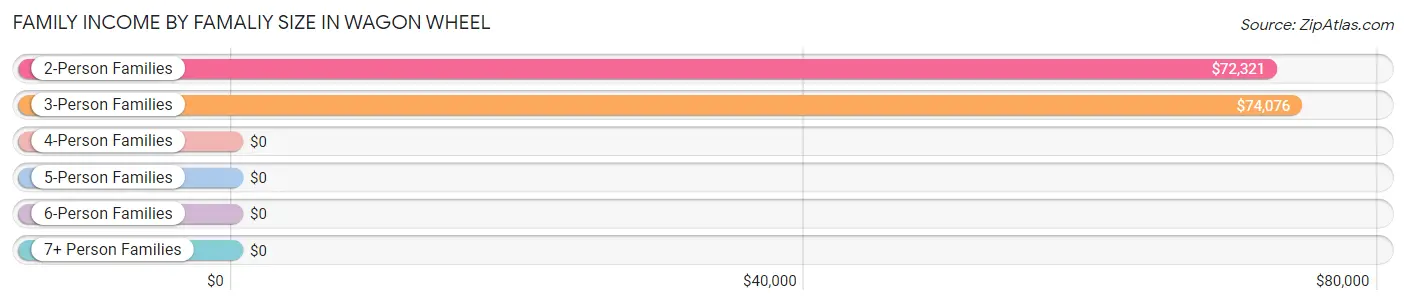
| Income Bracket | # Families | Median Income |
| 2-Person Families | 256 (58.7%) | $72,321 |
| 3-Person Families | 153 (35.1%) | $74,076 |
| 4-Person Families | 27 (6.2%) | $0 |
| 5-Person Families | 0 (0.0%) | $0 |
| 6-Person Families | 0 (0.0%) | $0 |
| 7+ Person Families | 0 (0.0%) | $0 |
| Total | 436 (100.0%) | $74,276 |
Family Income by Number of Earners in Wagon Wheel
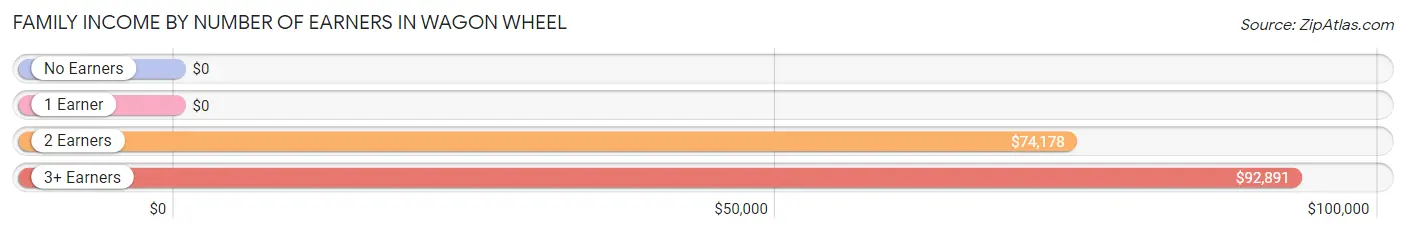
| Number of Earners | # Families | Median Income |
| No Earners | 84 (19.3%) | $0 |
| 1 Earner | 104 (23.8%) | $0 |
| 2 Earners | 199 (45.6%) | $74,178 |
| 3+ Earners | 49 (11.2%) | $92,891 |
| Total | 436 (100.0%) | $74,276 |
Household Income in Wagon Wheel
Household Income Brackets in Wagon Wheel
With 193 households falling in the category, the $50,000 to $74,999 income range is the most frequent in Wagon Wheel, accounting for 30.0% of all households.
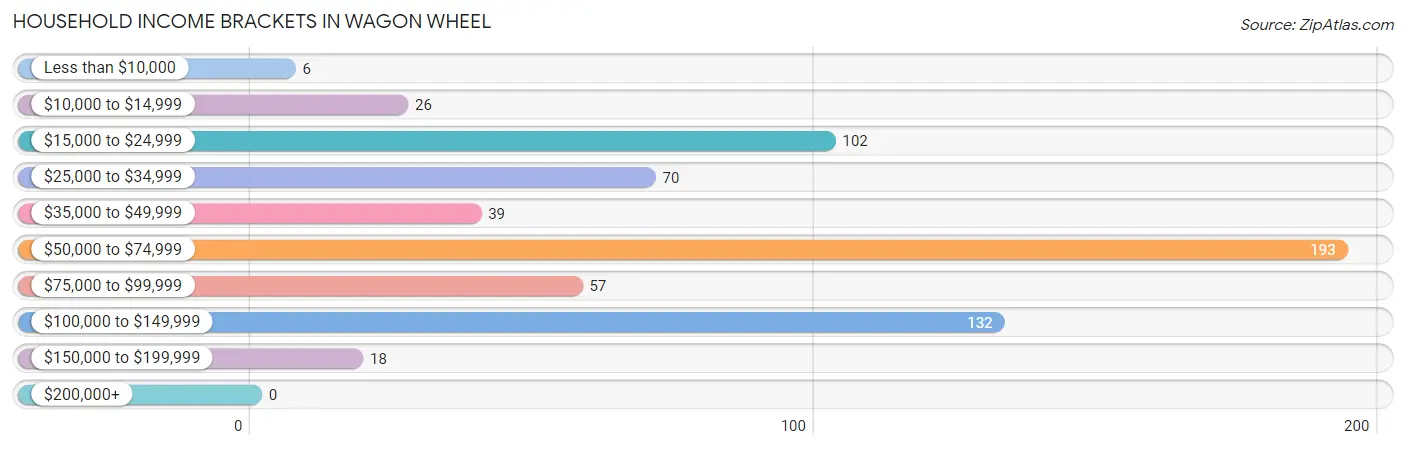
| Income Bracket | # Households | % Households |
| Less than $10,000 | 6 | 0.9% |
| $10,000 to $14,999 | 26 | 4.0% |
| $15,000 to $24,999 | 102 | 15.9% |
| $25,000 to $34,999 | 70 | 10.9% |
| $35,000 to $49,999 | 39 | 6.1% |
| $50,000 to $74,999 | 193 | 30.0% |
| $75,000 to $99,999 | 57 | 8.9% |
| $100,000 to $149,999 | 132 | 20.5% |
| $150,000 to $199,999 | 18 | 2.8% |
| $200,000+ | 0 | 0.0% |
Household Income by Householder Age in Wagon Wheel
The median household income in Wagon Wheel is $54,354, with the highest median household income of $64,886 found in the 45 to 64 years age bracket for the primary householder. A total of 332 households (51.6%) fall into this category.
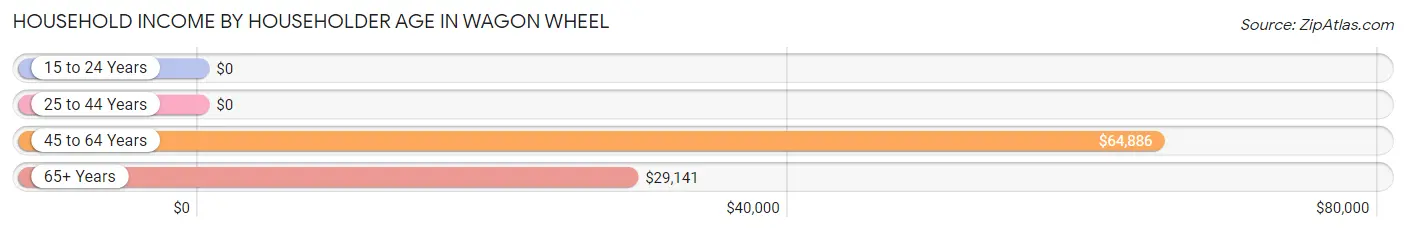
| Income Bracket | # Households | Median Income |
| 15 to 24 Years | 0 (0.0%) | $0 |
| 25 to 44 Years | 0 (0.0%) | $0 |
| 45 to 64 Years | 332 (51.6%) | $64,886 |
| 65+ Years | 311 (48.4%) | $29,141 |
| Total | 643 (100.0%) | $54,354 |
Poverty in Wagon Wheel
Income Below Poverty by Sex and Age in Wagon Wheel
With 5.5% poverty level for males and 1.6% for females among the residents of Wagon Wheel, 75 year old and over males and 65 to 74 year old females are the most vulnerable to poverty, with 22 males (39.3%) and 7 females (4.2%) in their respective age groups living below the poverty level.
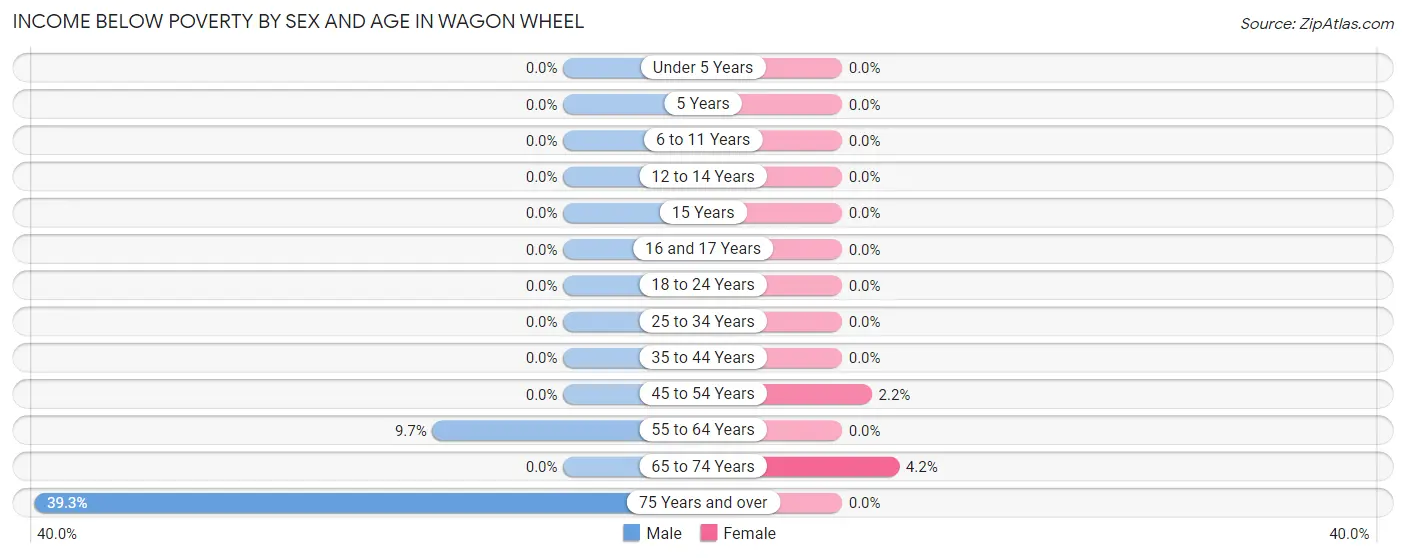
| Age Bracket | Male | Female |
| Under 5 Years | 0 (0.0%) | 0 (0.0%) |
| 5 Years | 0 (0.0%) | 0 (0.0%) |
| 6 to 11 Years | 0 (0.0%) | 0 (0.0%) |
| 12 to 14 Years | 0 (0.0%) | 0 (0.0%) |
| 15 Years | 0 (0.0%) | 0 (0.0%) |
| 16 and 17 Years | 0 (0.0%) | 0 (0.0%) |
| 18 to 24 Years | 0 (0.0%) | 0 (0.0%) |
| 25 to 34 Years | 0 (0.0%) | 0 (0.0%) |
| 35 to 44 Years | 0 (0.0%) | 0 (0.0%) |
| 45 to 54 Years | 0 (0.0%) | 5 (2.2%) |
| 55 to 64 Years | 10 (9.7%) | 0 (0.0%) |
| 65 to 74 Years | 0 (0.0%) | 7 (4.2%) |
| 75 Years and over | 22 (39.3%) | 0 (0.0%) |
| Total | 32 (5.5%) | 12 (1.6%) |
Income Above Poverty by Sex and Age in Wagon Wheel
According to the poverty statistics in Wagon Wheel, males aged 18 to 24 years and females aged 16 and 17 years are the age groups that are most secure financially, with 100.0% of males and 100.0% of females in these age groups living above the poverty line.
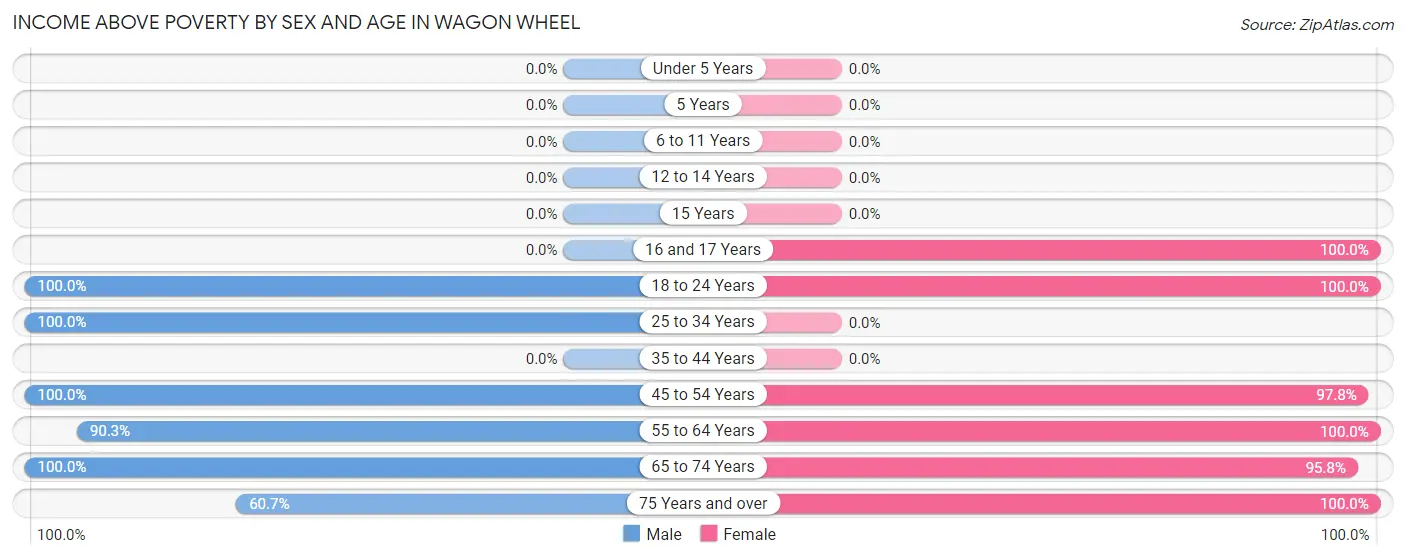
| Age Bracket | Male | Female |
| Under 5 Years | 0 (0.0%) | 0 (0.0%) |
| 5 Years | 0 (0.0%) | 0 (0.0%) |
| 6 to 11 Years | 0 (0.0%) | 0 (0.0%) |
| 12 to 14 Years | 0 (0.0%) | 0 (0.0%) |
| 15 Years | 0 (0.0%) | 0 (0.0%) |
| 16 and 17 Years | 0 (0.0%) | 71 (100.0%) |
| 18 to 24 Years | 29 (100.0%) | 86 (100.0%) |
| 25 to 34 Years | 60 (100.0%) | 0 (0.0%) |
| 35 to 44 Years | 0 (0.0%) | 0 (0.0%) |
| 45 to 54 Years | 191 (100.0%) | 221 (97.8%) |
| 55 to 64 Years | 93 (90.3%) | 107 (100.0%) |
| 65 to 74 Years | 147 (100.0%) | 158 (95.8%) |
| 75 Years and over | 34 (60.7%) | 101 (100.0%) |
| Total | 554 (94.5%) | 744 (98.4%) |
Income Below Poverty Among Married-Couple Families in Wagon Wheel
The poverty statistics for married-couple families in Wagon Wheel show that 1.4% or 6 of the total 436 families live below the poverty line. Families with no children have the highest poverty rate of 1.7%, comprising of 6 families. On the other hand, families with 1 or 2 children have the lowest poverty rate of 0.0%, which includes 0 families.
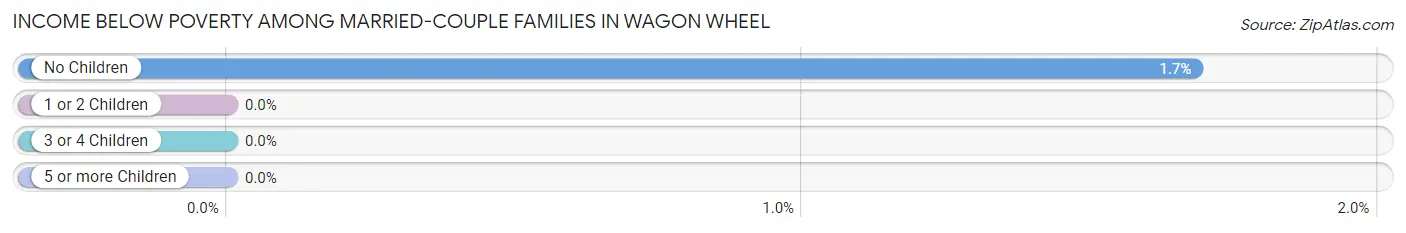
| Children | Above Poverty | Below Poverty |
| No Children | 351 (98.3%) | 6 (1.7%) |
| 1 or 2 Children | 79 (100.0%) | 0 (0.0%) |
| 3 or 4 Children | 0 (0.0%) | 0 (0.0%) |
| 5 or more Children | 0 (0.0%) | 0 (0.0%) |
| Total | 430 (98.6%) | 6 (1.4%) |
Income Below Poverty Among Single-Parent Households in Wagon Wheel
| Children | Single Father | Single Mother |
| No Children | 0 (0.0%) | 0 (0.0%) |
| 1 or 2 Children | 0 (0.0%) | 0 (0.0%) |
| 3 or 4 Children | 0 (0.0%) | 0 (0.0%) |
| 5 or more Children | 0 (0.0%) | 0 (0.0%) |
| Total | 0 (0.0%) | 0 (0.0%) |
Income Below Poverty Among Married-Couple vs Single-Parent Households in Wagon Wheel
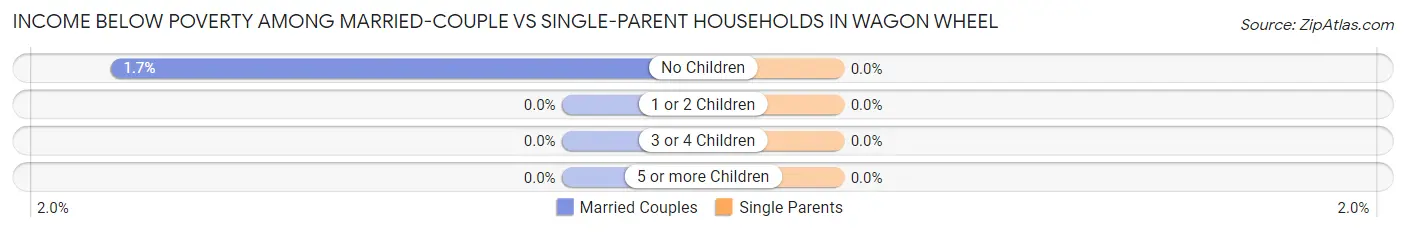
| Children | Married-Couple Families | Single-Parent Households |
| No Children | 6 (1.7%) | 0 (0.0%) |
| 1 or 2 Children | 0 (0.0%) | 0 (0.0%) |
| 3 or 4 Children | 0 (0.0%) | 0 (0.0%) |
| 5 or more Children | 0 (0.0%) | 0 (0.0%) |
| Total | 6 (1.4%) | 0 (0.0%) |
Race in Wagon Wheel
The most populous races in Wagon Wheel are White / Caucasian (1,232 | 87.6%), Hispanic or Latino (155 | 11.0%), and Two or more Races (110 | 7.8%).
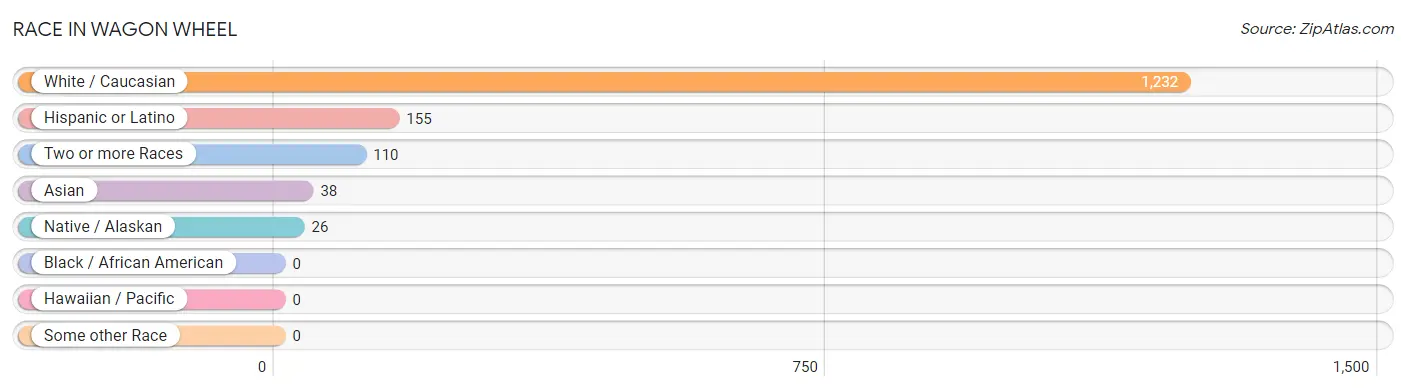
| Race | # Population | % Population |
| Asian | 38 | 2.7% |
| Black / African American | 0 | 0.0% |
| Hawaiian / Pacific | 0 | 0.0% |
| Hispanic or Latino | 155 | 11.0% |
| Native / Alaskan | 26 | 1.8% |
| White / Caucasian | 1,232 | 87.6% |
| Two or more Races | 110 | 7.8% |
| Some other Race | 0 | 0.0% |
| Total | 1,406 | 100.0% |
Ancestry in Wagon Wheel
The most populous ancestries reported in Wagon Wheel are German (553 | 39.3%), English (287 | 20.4%), Mexican (155 | 11.0%), Irish (143 | 10.2%), and American (125 | 8.9%), together accounting for 89.8% of all Wagon Wheel residents.
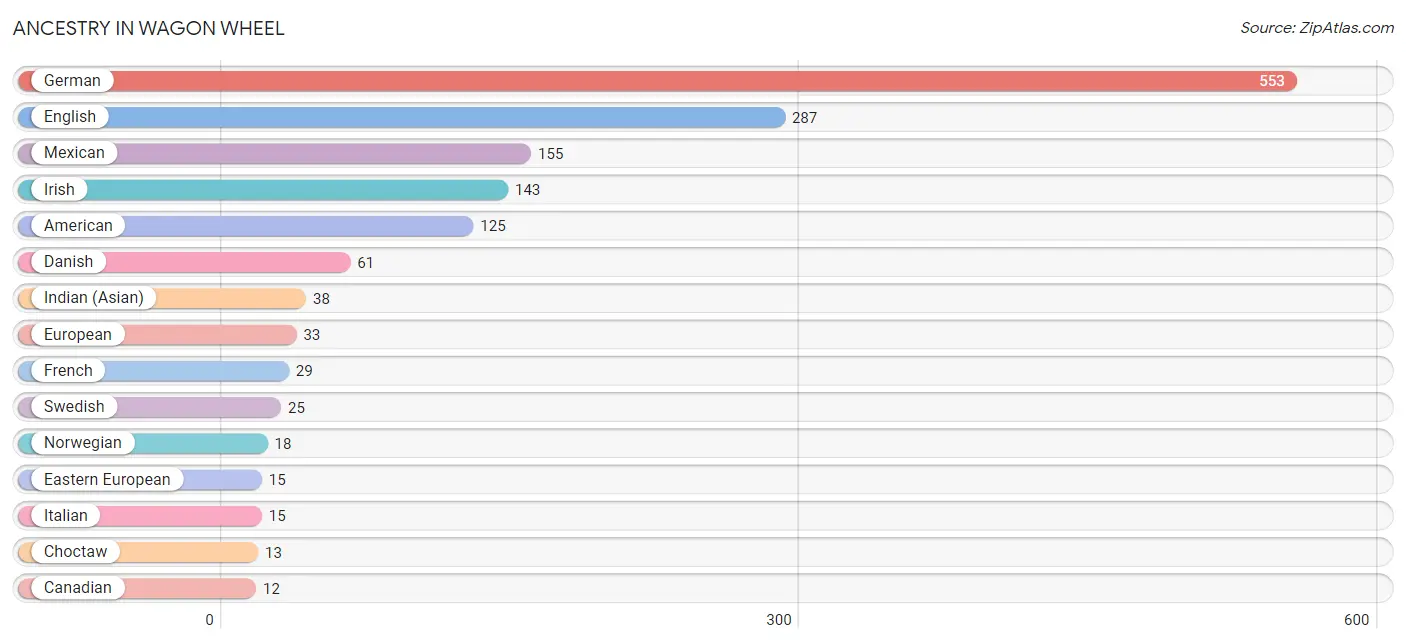
| Ancestry | # Population | % Population |
| American | 125 | 8.9% |
| Canadian | 12 | 0.9% |
| Cherokee | 10 | 0.7% |
| Chippewa | 12 | 0.9% |
| Choctaw | 13 | 0.9% |
| Danish | 61 | 4.3% |
| Eastern European | 15 | 1.1% |
| English | 287 | 20.4% |
| European | 33 | 2.4% |
| French | 29 | 2.1% |
| German | 553 | 39.3% |
| Indian (Asian) | 38 | 2.7% |
| Irish | 143 | 10.2% |
| Italian | 15 | 1.1% |
| Mexican | 155 | 11.0% |
| Navajo | 1 | 0.1% |
| Norwegian | 18 | 1.3% |
| Swedish | 25 | 1.8% |
| Welsh | 10 | 0.7% | View All 19 Rows |
Immigrants in Wagon Wheel
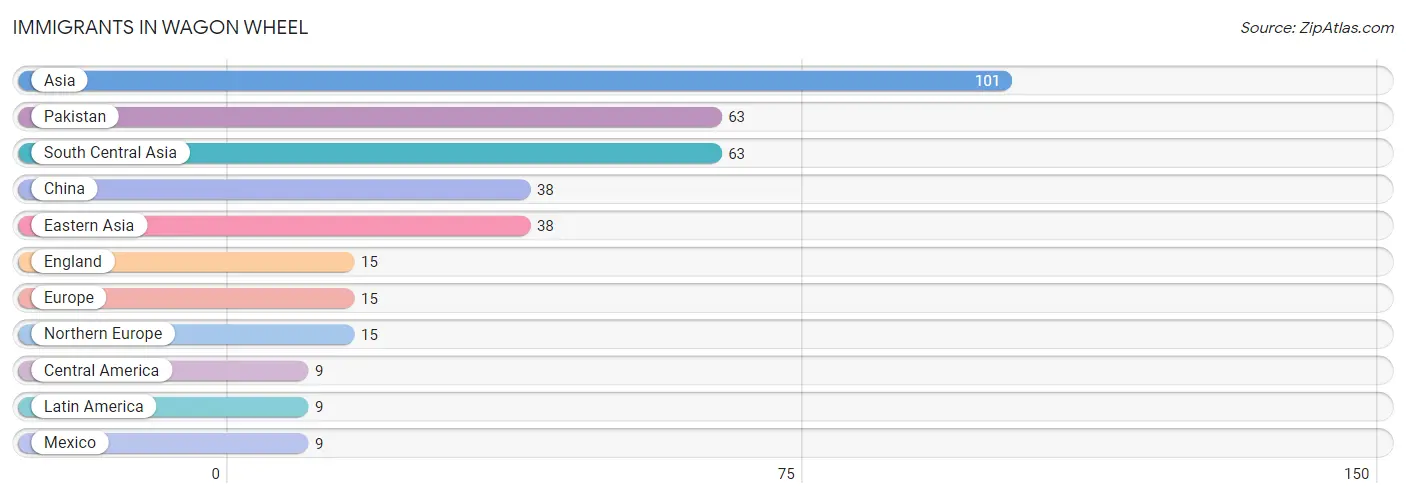
The most numerous immigrant groups reported in Wagon Wheel came from Asia (101 | 7.2%), Pakistan (63 | 4.5%), South Central Asia (63 | 4.5%), China (38 | 2.7%), and Eastern Asia (38 | 2.7%), together accounting for 21.5% of all Wagon Wheel residents.
| Immigration Origin | # Population | % Population |
| Asia | 101 | 7.2% |
| Central America | 9 | 0.6% |
| China | 38 | 2.7% |
| Eastern Asia | 38 | 2.7% |
| England | 15 | 1.1% |
| Europe | 15 | 1.1% |
| Latin America | 9 | 0.6% |
| Mexico | 9 | 0.6% |
| Northern Europe | 15 | 1.1% |
| Pakistan | 63 | 4.5% |
| South Central Asia | 63 | 4.5% | View All 11 Rows |
Sex and Age in Wagon Wheel
Sex and Age in Wagon Wheel
The most populous age groups in Wagon Wheel are 50 to 54 Years (115 | 18.2%) for men and 50 to 54 Years (150 | 19.4%) for women.
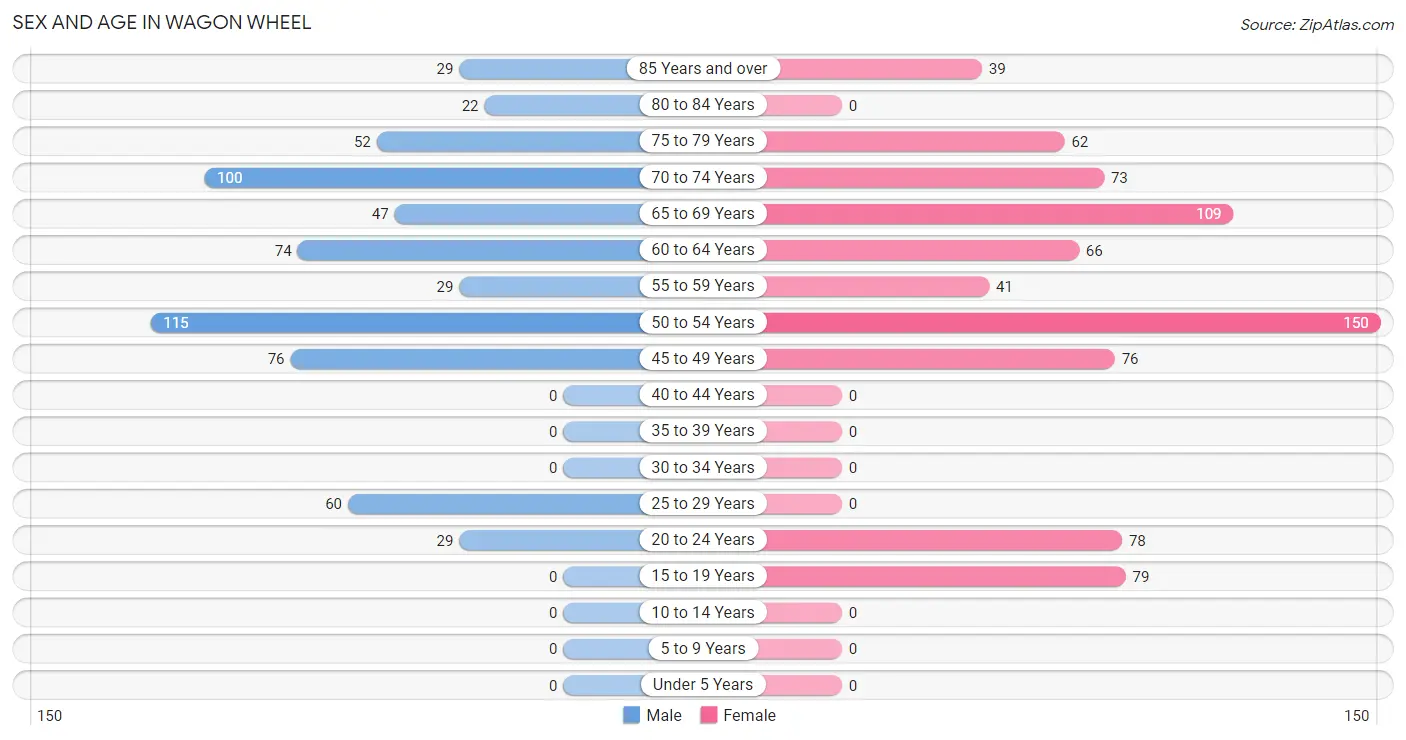
| Age Bracket | Male | Female |
| Under 5 Years | 0 (0.0%) | 0 (0.0%) |
| 5 to 9 Years | 0 (0.0%) | 0 (0.0%) |
| 10 to 14 Years | 0 (0.0%) | 0 (0.0%) |
| 15 to 19 Years | 0 (0.0%) | 79 (10.2%) |
| 20 to 24 Years | 29 (4.6%) | 78 (10.1%) |
| 25 to 29 Years | 60 (9.5%) | 0 (0.0%) |
| 30 to 34 Years | 0 (0.0%) | 0 (0.0%) |
| 35 to 39 Years | 0 (0.0%) | 0 (0.0%) |
| 40 to 44 Years | 0 (0.0%) | 0 (0.0%) |
| 45 to 49 Years | 76 (12.0%) | 76 (9.8%) |
| 50 to 54 Years | 115 (18.2%) | 150 (19.4%) |
| 55 to 59 Years | 29 (4.6%) | 41 (5.3%) |
| 60 to 64 Years | 74 (11.7%) | 66 (8.5%) |
| 65 to 69 Years | 47 (7.4%) | 109 (14.1%) |
| 70 to 74 Years | 100 (15.8%) | 73 (9.4%) |
| 75 to 79 Years | 52 (8.2%) | 62 (8.0%) |
| 80 to 84 Years | 22 (3.5%) | 0 (0.0%) |
| 85 Years and over | 29 (4.6%) | 39 (5.1%) |
| Total | 633 (100.0%) | 773 (100.0%) |
Families and Households in Wagon Wheel
Median Family Size in Wagon Wheel
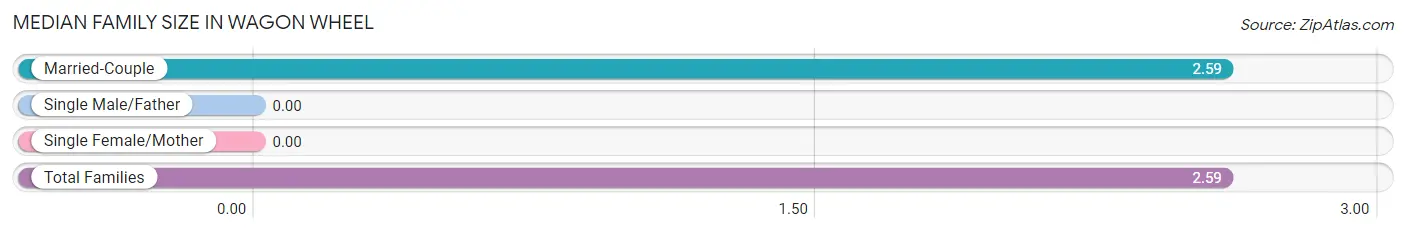
| Family Type | # Families | Family Size |
| Married-Couple | 436 (100.0%) | 2.59 |
| Single Male/Father | 0 (0.0%) | - |
| Single Female/Mother | 0 (0.0%) | - |
| Total Families | 436 (100.0%) | 2.59 |
Median Household Size in Wagon Wheel
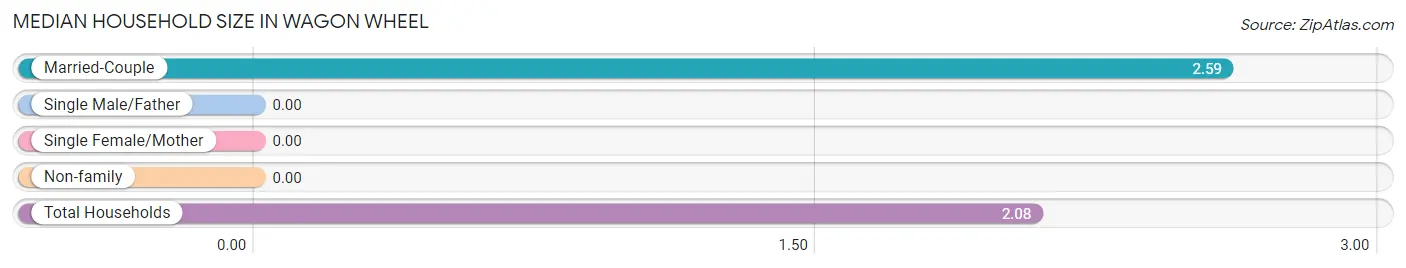
| Household Type | # Households | Household Size |
| Married-Couple | 436 (67.8%) | 2.59 |
| Single Male/Father | 0 (0.0%) | - |
| Single Female/Mother | 0 (0.0%) | - |
| Non-family | 207 (32.2%) | - |
| Total Households | 643 (100.0%) | 2.08 |
Household Size by Marriage Status in Wagon Wheel
Out of a total of 643 households in Wagon Wheel, 436 (67.8%) are family households, while 207 (32.2%) are nonfamily households. The most numerous type of family households are 2-person households, comprising 256, and the most common type of nonfamily households are 1-person households, comprising 207.
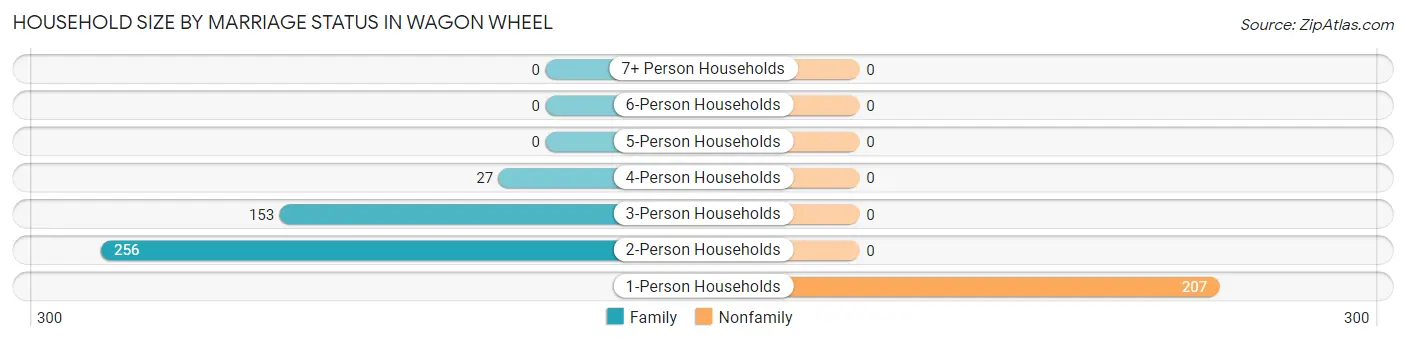
| Household Size | Family Households | Nonfamily Households |
| 1-Person Households | - | 207 (32.2%) |
| 2-Person Households | 256 (39.8%) | 0 (0.0%) |
| 3-Person Households | 153 (23.8%) | 0 (0.0%) |
| 4-Person Households | 27 (4.2%) | 0 (0.0%) |
| 5-Person Households | 0 (0.0%) | 0 (0.0%) |
| 6-Person Households | 0 (0.0%) | 0 (0.0%) |
| 7+ Person Households | 0 (0.0%) | 0 (0.0%) |
| Total | 436 (67.8%) | 207 (32.2%) |
Female Fertility in Wagon Wheel
Fertility by Age in Wagon Wheel
| Age Bracket | Women with Births | Births / 1,000 Women |
| 15 to 19 years | 0 (0.0%) | 0.0 |
| 20 to 34 years | 0 (0.0%) | 0.0 |
| 35 to 50 years | 0 (0.0%) | 0.0 |
| Total | 0 (0.0%) | 0.0 |
Fertility by Age by Marriage Status in Wagon Wheel
| Age Bracket | Married | Unmarried |
| 15 to 19 years | 0 (0.0%) | 0 (0.0%) |
| 20 to 34 years | 0 (0.0%) | 0 (0.0%) |
| 35 to 50 years | 0 (0.0%) | 0 (0.0%) |
| Total | 0 (0.0%) | 0 (0.0%) |
Fertility by Education in Wagon Wheel
| Educational Attainment | Women with Births | Births / 1,000 Women |
| Less than High School | 0 (0.0%) | 0.0 |
| High School Diploma | 0 (0.0%) | 0.0 |
| College or Associate's Degree | 0 (0.0%) | 0.0 |
| Bachelor's Degree | 0 (0.0%) | 0.0 |
| Graduate Degree | 0 (0.0%) | 0.0 |
| Total | 0 (0.0%) | 0.0 |
Fertility by Education by Marriage Status in Wagon Wheel
| Educational Attainment | Married | Unmarried |
| Less than High School | 0 (0.0%) | 0 (0.0%) |
| High School Diploma | 0 (0.0%) | 0 (0.0%) |
| College or Associate's Degree | 0 (0.0%) | 0 (0.0%) |
| Bachelor's Degree | 0 (0.0%) | 0 (0.0%) |
| Graduate Degree | 0 (0.0%) | 0 (0.0%) |
| Total | 0 (0.0%) | 0 (0.0%) |
Employment Characteristics in Wagon Wheel
Employment by Class of Employer in Wagon Wheel
Among the 618 employed individuals in Wagon Wheel, private company employees (387 | 62.6%), self-employed (not incorporated) (121 | 19.6%), and not-for-profit organizations (47 | 7.6%) make up the most common classes of employment.
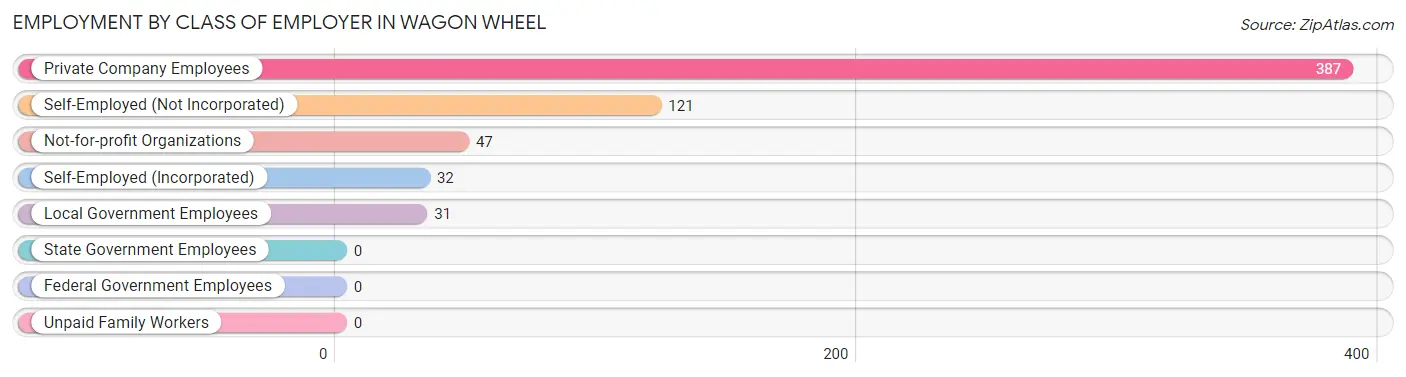
| Employer Class | # Employees | % Employees |
| Private Company Employees | 387 | 62.6% |
| Self-Employed (Incorporated) | 32 | 5.2% |
| Self-Employed (Not Incorporated) | 121 | 19.6% |
| Not-for-profit Organizations | 47 | 7.6% |
| Local Government Employees | 31 | 5.0% |
| State Government Employees | 0 | 0.0% |
| Federal Government Employees | 0 | 0.0% |
| Unpaid Family Workers | 0 | 0.0% |
| Total | 618 | 100.0% |
Employment Status by Age in Wagon Wheel
According to the labor force statistics for Wagon Wheel, out of the total population over 16 years of age (1,406), 47.9% or 673 individuals are in the labor force, with 3.1% or 21 of them unemployed. The age group with the highest labor force participation rate is 20 to 24 years, with 100.0% or 107 individuals in the labor force. Within the labor force, the 25 to 29 years age range has the highest percentage of unemployed individuals, with 100.0% or 21 of them being unemployed.
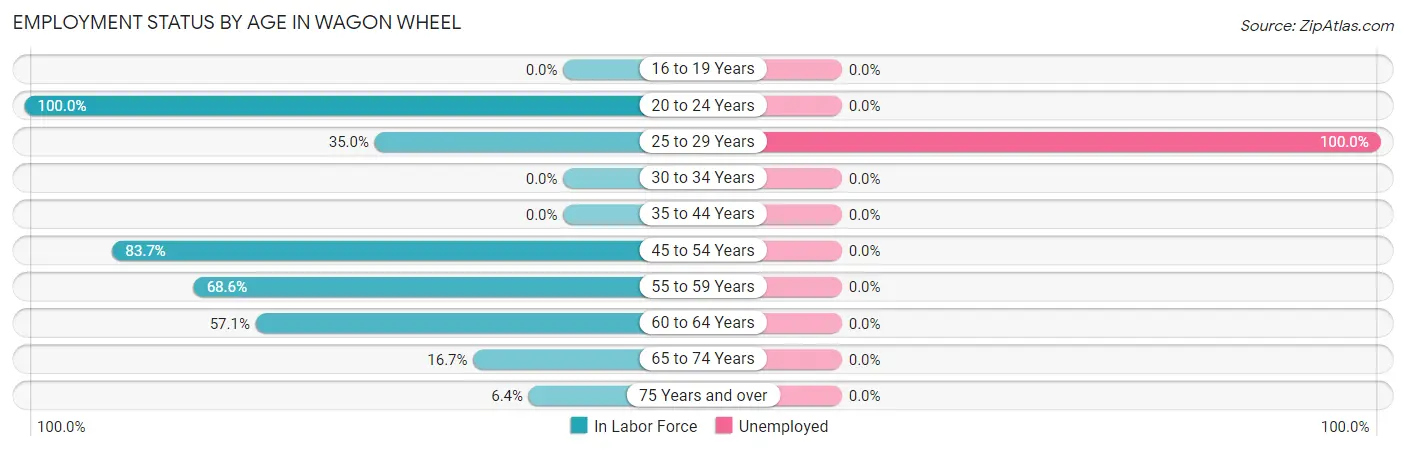
| Age Bracket | In Labor Force | Unemployed |
| 16 to 19 Years | 0 (0.0%) | 0 (0.0%) |
| 20 to 24 Years | 107 (100.0%) | 0 (0.0%) |
| 25 to 29 Years | 21 (35.0%) | 21 (100.0%) |
| 30 to 34 Years | 0 (0.0%) | 0 (0.0%) |
| 35 to 44 Years | 0 (0.0%) | 0 (0.0%) |
| 45 to 54 Years | 349 (83.7%) | 0 (0.0%) |
| 55 to 59 Years | 48 (68.6%) | 0 (0.0%) |
| 60 to 64 Years | 80 (57.1%) | 0 (0.0%) |
| 65 to 74 Years | 55 (16.7%) | 0 (0.0%) |
| 75 Years and over | 13 (6.4%) | 0 (0.0%) |
| Total | 673 (47.9%) | 21 (3.1%) |
Employment Status by Educational Attainment in Wagon Wheel
According to labor force statistics for Wagon Wheel, 72.5% of individuals (498) out of the total population between 25 and 64 years of age (687) are in the labor force, with 4.2% or 21 of them being unemployed. The group with the highest labor force participation rate are those with the educational attainment of high school diploma, with 100.0% or 143 individuals in the labor force. Within the labor force, individuals with bachelor's degree or higher education have the highest percentage of unemployment, with 11.8% or 21 of them being unemployed.
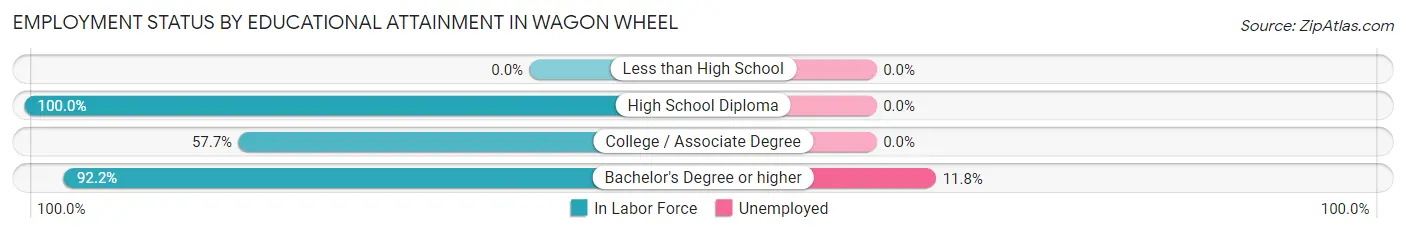
| Educational Attainment | In Labor Force | Unemployed |
| Less than High School | 0 (0.0%) | 0 (0.0%) |
| High School Diploma | 143 (100.0%) | 0 (0.0%) |
| College / Associate Degree | 177 (57.7%) | 0 (0.0%) |
| Bachelor's Degree or higher | 178 (92.2%) | 23 (11.8%) |
| Total | 498 (72.5%) | 29 (4.2%) |
Employment Occupations by Sex in Wagon Wheel
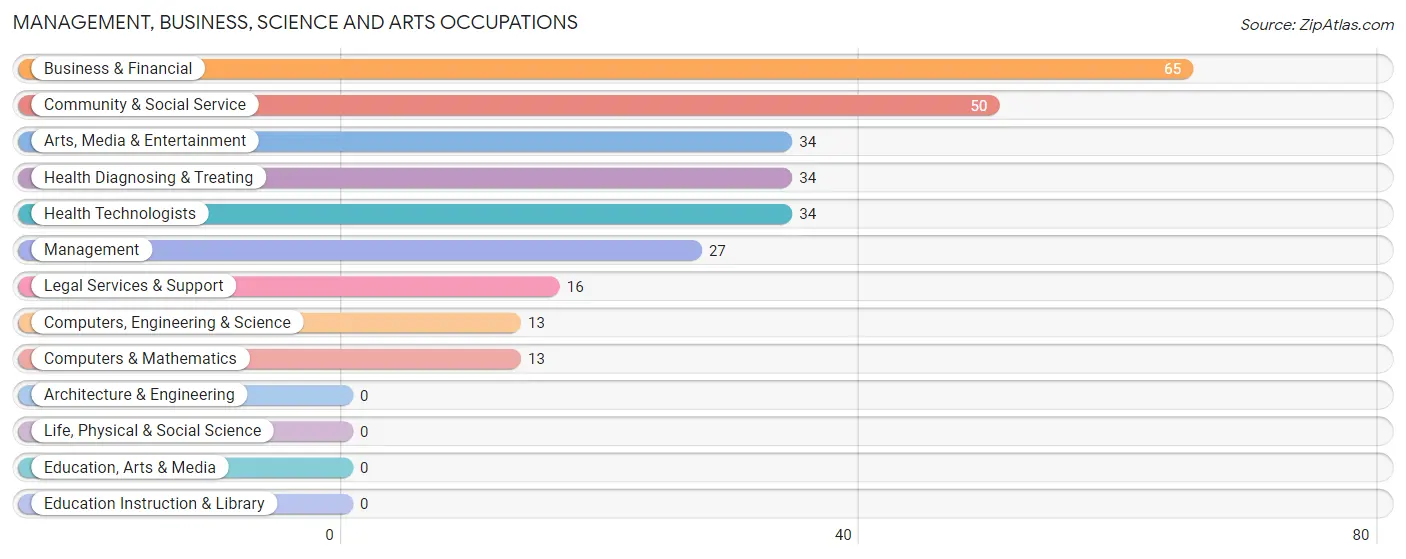
Management, Business, Science and Arts Occupations
The most common Management, Business, Science and Arts occupations in Wagon Wheel are Business & Financial (65 | 10.0%), Community & Social Service (50 | 7.7%), Arts, Media & Entertainment (34 | 5.2%), Health Diagnosing & Treating (34 | 5.2%), and Health Technologists (34 | 5.2%).
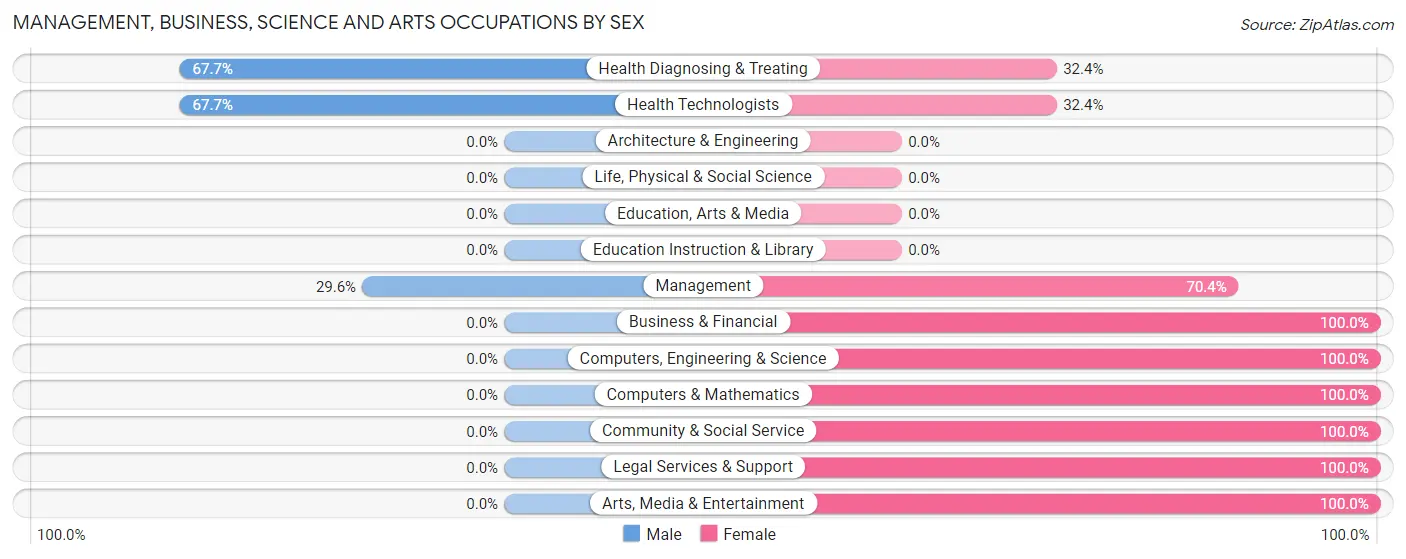
Management, Business, Science and Arts Occupations by Sex
Within the Management, Business, Science and Arts occupations in Wagon Wheel, the most male-oriented occupations are Health Diagnosing & Treating (67.6%), Health Technologists (67.6%), and Management (29.6%), while the most female-oriented occupations are Business & Financial (100.0%), Computers, Engineering & Science (100.0%), and Computers & Mathematics (100.0%).
| Occupation | Male | Female |
| Management | 8 (29.6%) | 19 (70.4%) |
| Business & Financial | 0 (0.0%) | 65 (100.0%) |
| Computers, Engineering & Science | 0 (0.0%) | 13 (100.0%) |
| Computers & Mathematics | 0 (0.0%) | 13 (100.0%) |
| Architecture & Engineering | 0 (0.0%) | 0 (0.0%) |
| Life, Physical & Social Science | 0 (0.0%) | 0 (0.0%) |
| Community & Social Service | 0 (0.0%) | 50 (100.0%) |
| Education, Arts & Media | 0 (0.0%) | 0 (0.0%) |
| Legal Services & Support | 0 (0.0%) | 16 (100.0%) |
| Education Instruction & Library | 0 (0.0%) | 0 (0.0%) |
| Arts, Media & Entertainment | 0 (0.0%) | 34 (100.0%) |
| Health Diagnosing & Treating | 23 (67.6%) | 11 (32.4%) |
| Health Technologists | 23 (67.6%) | 11 (32.4%) |
| Total (Category) | 31 (16.4%) | 158 (83.6%) |
| Total (Overall) | 323 (49.5%) | 329 (50.5%) |
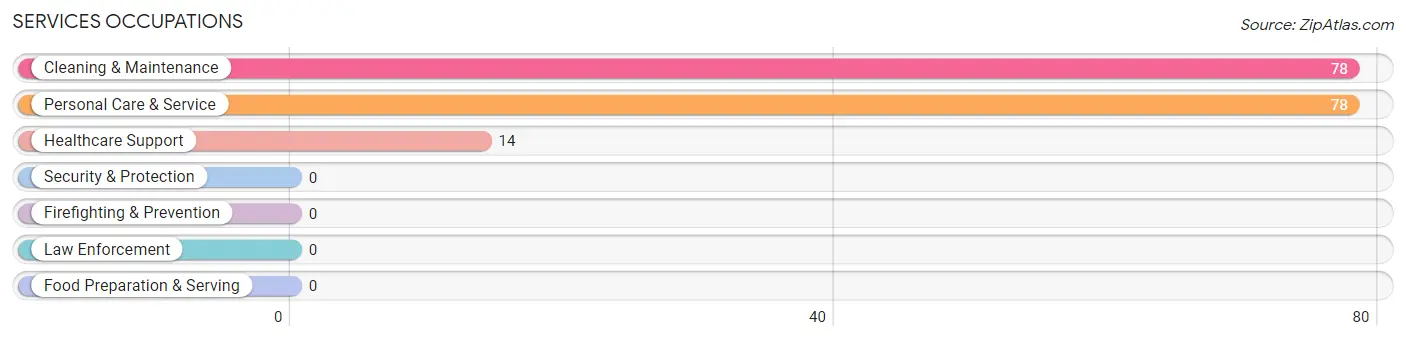
Services Occupations
The most common Services occupations in Wagon Wheel are Cleaning & Maintenance (78 | 12.0%), Personal Care & Service (78 | 12.0%), and Healthcare Support (14 | 2.1%).
Services Occupations by Sex
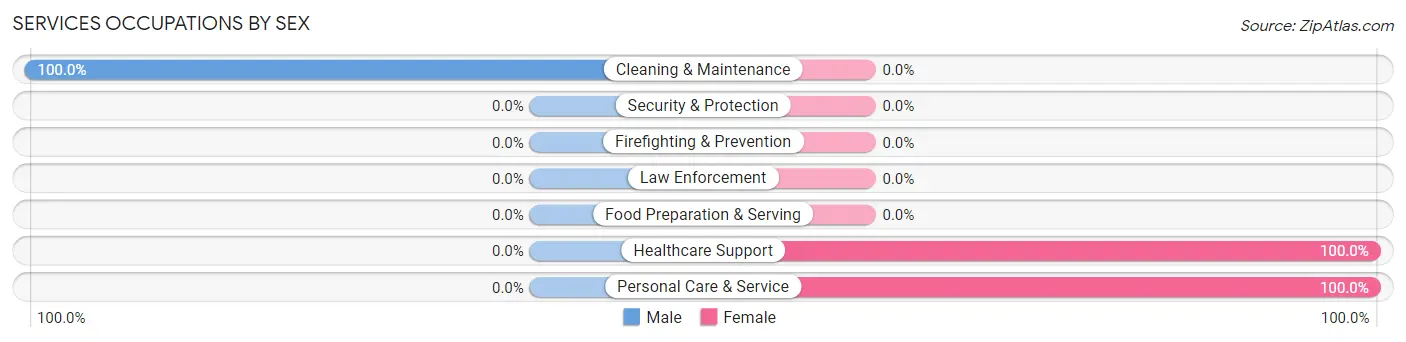
| Occupation | Male | Female |
| Healthcare Support | 0 (0.0%) | 14 (100.0%) |
| Security & Protection | 0 (0.0%) | 0 (0.0%) |
| Firefighting & Prevention | 0 (0.0%) | 0 (0.0%) |
| Law Enforcement | 0 (0.0%) | 0 (0.0%) |
| Food Preparation & Serving | 0 (0.0%) | 0 (0.0%) |
| Cleaning & Maintenance | 78 (100.0%) | 0 (0.0%) |
| Personal Care & Service | 0 (0.0%) | 78 (100.0%) |
| Total (Category) | 78 (45.9%) | 92 (54.1%) |
| Total (Overall) | 323 (49.5%) | 329 (50.5%) |
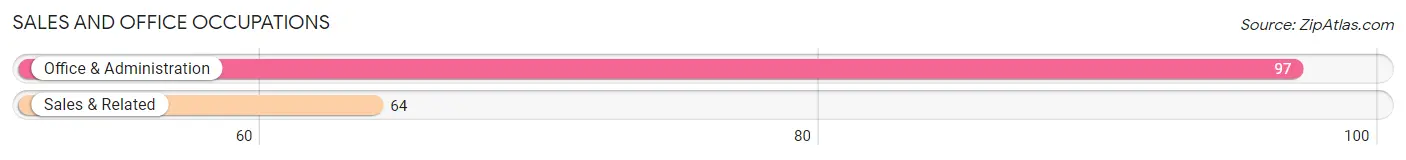
Sales and Office Occupations
The most common Sales and Office occupations in Wagon Wheel are Office & Administration (97 | 14.9%), and Sales & Related (64 | 9.8%).
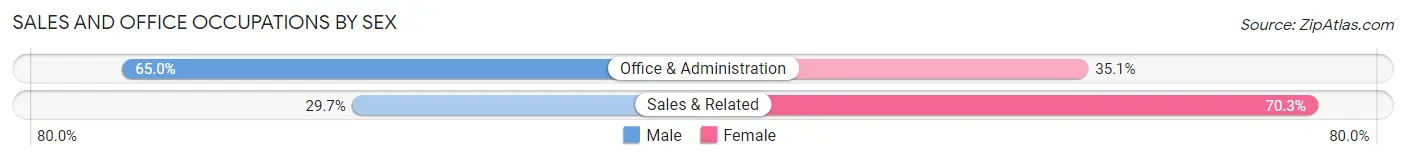
Sales and Office Occupations by Sex
| Occupation | Male | Female |
| Sales & Related | 19 (29.7%) | 45 (70.3%) |
| Office & Administration | 63 (64.9%) | 34 (35.0%) |
| Total (Category) | 82 (50.9%) | 79 (49.1%) |
| Total (Overall) | 323 (49.5%) | 329 (50.5%) |
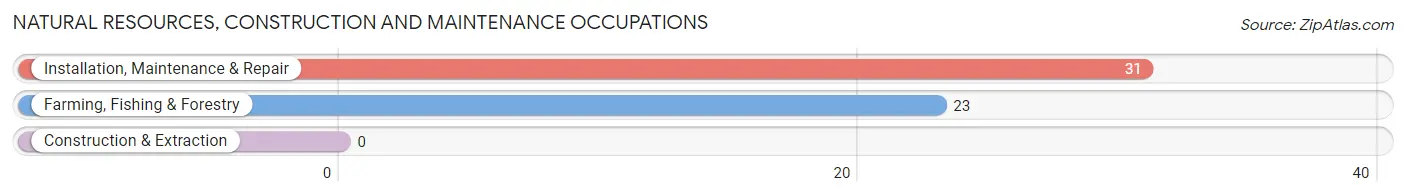
Natural Resources, Construction and Maintenance Occupations
The most common Natural Resources, Construction and Maintenance occupations in Wagon Wheel are Installation, Maintenance & Repair (31 | 4.8%), and Farming, Fishing & Forestry (23 | 3.5%).
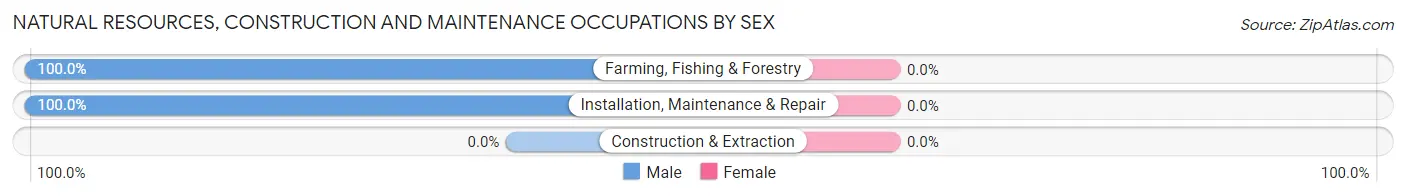
Natural Resources, Construction and Maintenance Occupations by Sex
| Occupation | Male | Female |
| Farming, Fishing & Forestry | 23 (100.0%) | 0 (0.0%) |
| Construction & Extraction | 0 (0.0%) | 0 (0.0%) |
| Installation, Maintenance & Repair | 31 (100.0%) | 0 (0.0%) |
| Total (Category) | 54 (100.0%) | 0 (0.0%) |
| Total (Overall) | 323 (49.5%) | 329 (50.5%) |
Production, Transportation and Moving Occupations
The most common Production, Transportation and Moving occupations in Wagon Wheel are , and Material Moving (78 | 12.0%).
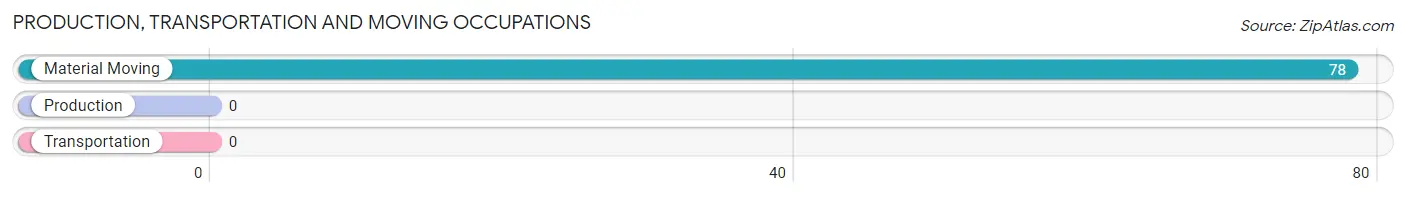
Production, Transportation and Moving Occupations by Sex
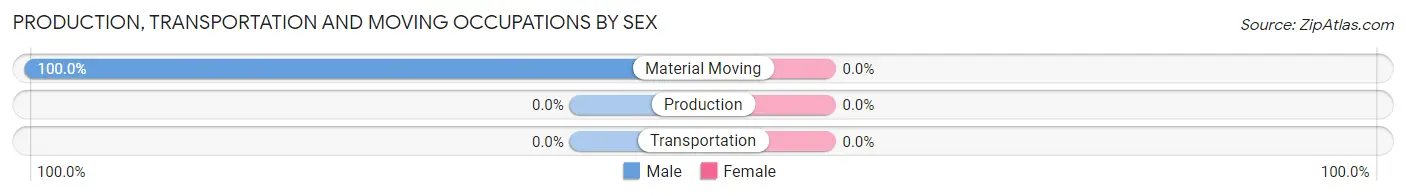
| Occupation | Male | Female |
| Production | 0 (0.0%) | 0 (0.0%) |
| Transportation | 0 (0.0%) | 0 (0.0%) |
| Material Moving | 78 (100.0%) | 0 (0.0%) |
| Total (Category) | 78 (100.0%) | 0 (0.0%) |
| Total (Overall) | 323 (49.5%) | 329 (50.5%) |
Employment Industries by Sex in Wagon Wheel
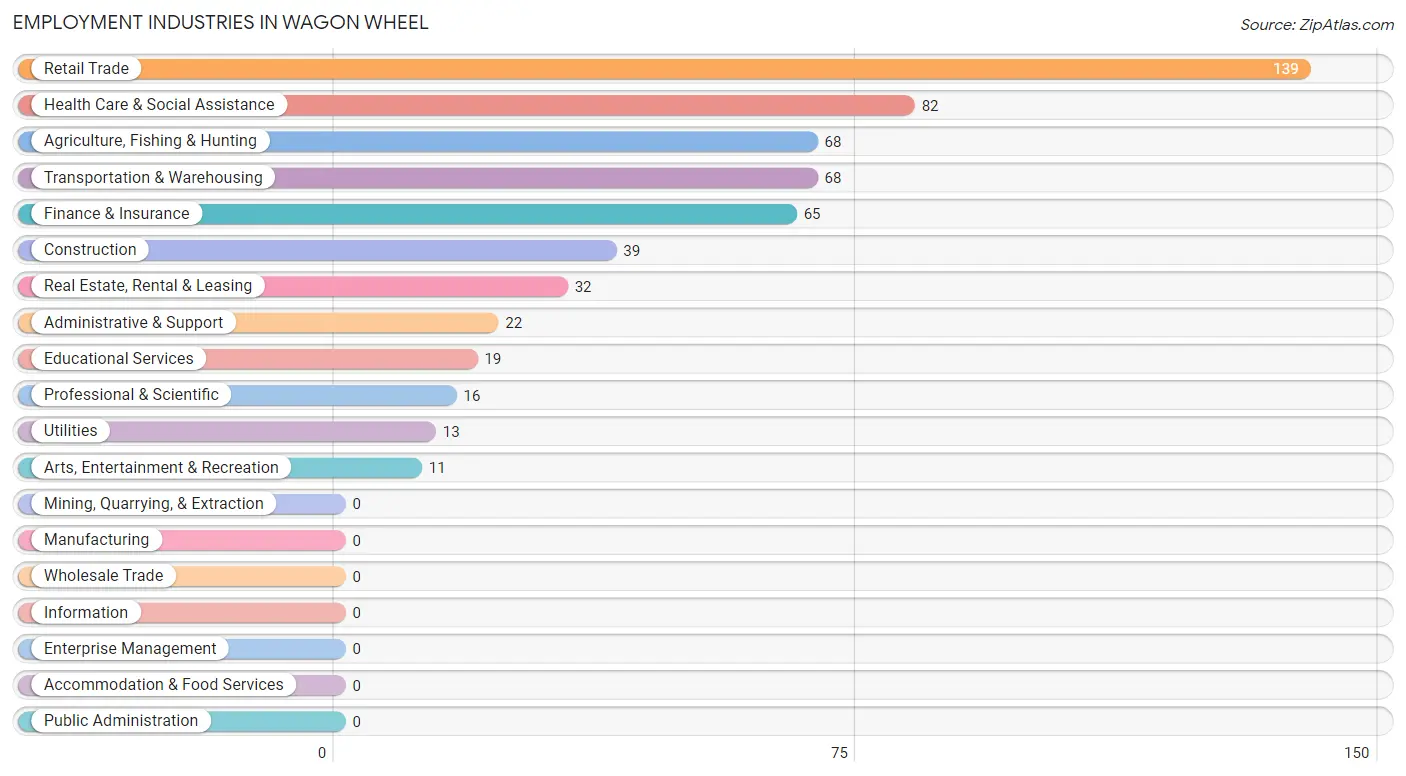
Employment Industries in Wagon Wheel
The major employment industries in Wagon Wheel include Retail Trade (139 | 21.3%), Health Care & Social Assistance (82 | 12.6%), Agriculture, Fishing & Hunting (68 | 10.4%), Transportation & Warehousing (68 | 10.4%), and Finance & Insurance (65 | 10.0%).
Employment Industries by Sex in Wagon Wheel
The Wagon Wheel industries that see more men than women are Agriculture, Fishing & Hunting (100.0%), Construction (100.0%), and Transportation & Warehousing (100.0%), whereas the industries that tend to have a higher number of women are Utilities (100.0%), Finance & Insurance (100.0%), and Real Estate, Rental & Leasing (100.0%).
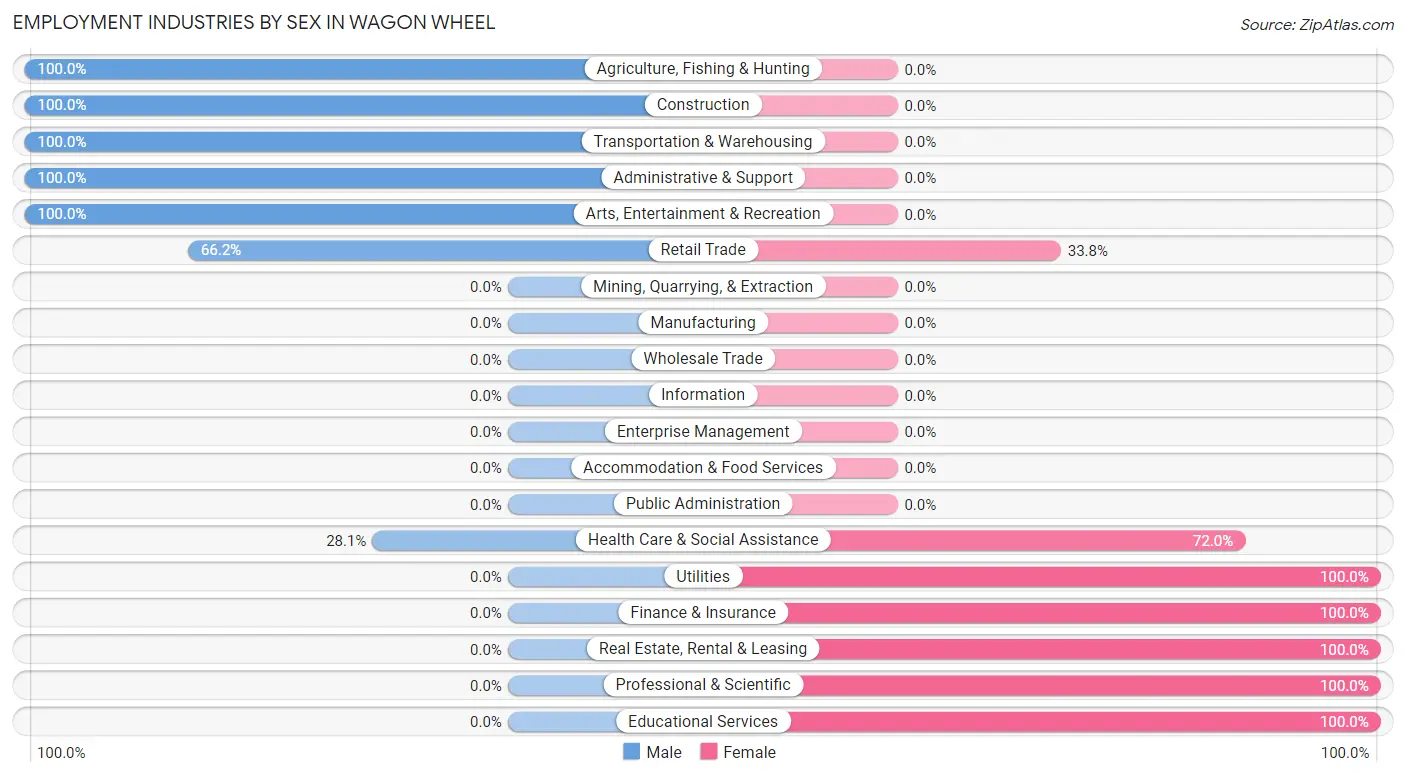
| Industry | Male | Female |
| Agriculture, Fishing & Hunting | 68 (100.0%) | 0 (0.0%) |
| Mining, Quarrying, & Extraction | 0 (0.0%) | 0 (0.0%) |
| Construction | 39 (100.0%) | 0 (0.0%) |
| Manufacturing | 0 (0.0%) | 0 (0.0%) |
| Wholesale Trade | 0 (0.0%) | 0 (0.0%) |
| Retail Trade | 92 (66.2%) | 47 (33.8%) |
| Transportation & Warehousing | 68 (100.0%) | 0 (0.0%) |
| Utilities | 0 (0.0%) | 13 (100.0%) |
| Information | 0 (0.0%) | 0 (0.0%) |
| Finance & Insurance | 0 (0.0%) | 65 (100.0%) |
| Real Estate, Rental & Leasing | 0 (0.0%) | 32 (100.0%) |
| Professional & Scientific | 0 (0.0%) | 16 (100.0%) |
| Enterprise Management | 0 (0.0%) | 0 (0.0%) |
| Administrative & Support | 22 (100.0%) | 0 (0.0%) |
| Educational Services | 0 (0.0%) | 19 (100.0%) |
| Health Care & Social Assistance | 23 (28.1%) | 59 (72.0%) |
| Arts, Entertainment & Recreation | 11 (100.0%) | 0 (0.0%) |
| Accommodation & Food Services | 0 (0.0%) | 0 (0.0%) |
| Public Administration | 0 (0.0%) | 0 (0.0%) |
| Total | 323 (49.5%) | 329 (50.5%) |
Education in Wagon Wheel
School Enrollment in Wagon Wheel
The most common levels of schooling among the 143 students in Wagon Wheel are high school (79 | 55.2%), graduate / professional (33 | 23.1%), and college / undergraduate (31 | 21.7%).
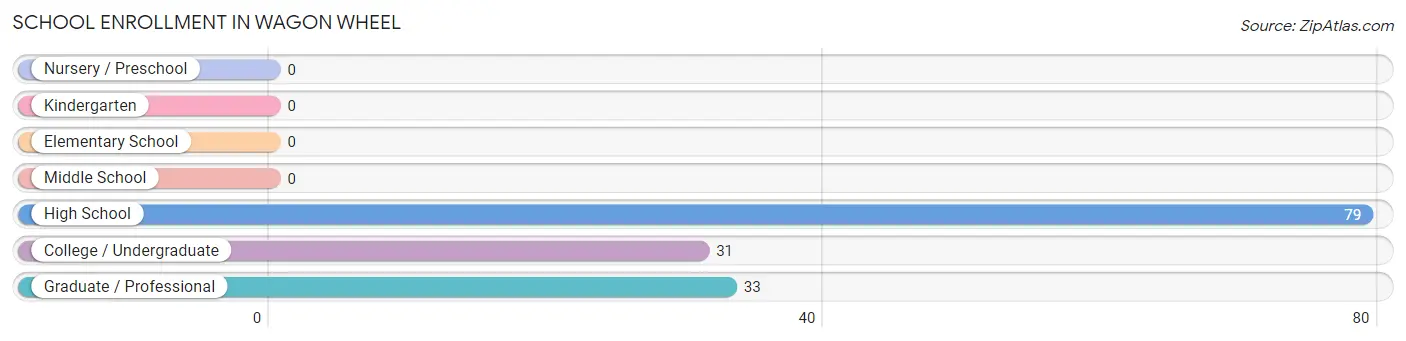
| School Level | # Students | % Students |
| Nursery / Preschool | 0 | 0.0% |
| Kindergarten | 0 | 0.0% |
| Elementary School | 0 | 0.0% |
| Middle School | 0 | 0.0% |
| High School | 79 | 55.2% |
| College / Undergraduate | 31 | 21.7% |
| Graduate / Professional | 33 | 23.1% |
| Total | 143 | 100.0% |
School Enrollment by Age by Funding Source in Wagon Wheel
Out of a total of 143 students who are enrolled in schools in Wagon Wheel, 31 (21.7%) attend a private institution, while the remaining 112 (78.3%) are enrolled in public schools. The age group of 35 years and over has the highest likelihood of being enrolled in private schools, with 31 (48.4% in the age bracket) enrolled. Conversely, the age group of 15 to 17 year olds has the lowest likelihood of being enrolled in a private school, with 71 (100.0% in the age bracket) attending a public institution.
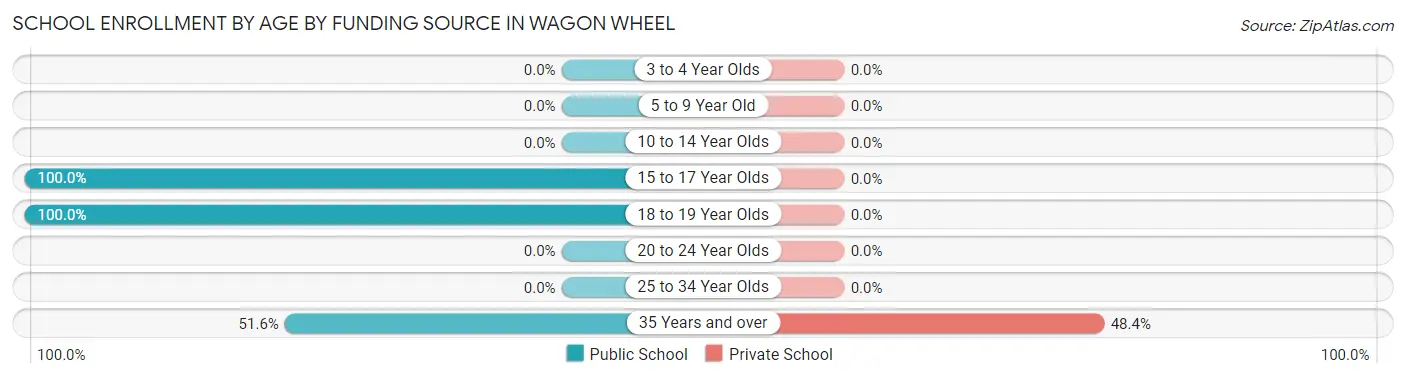
| Age Bracket | Public School | Private School |
| 3 to 4 Year Olds | 0 (0.0%) | 0 (0.0%) |
| 5 to 9 Year Old | 0 (0.0%) | 0 (0.0%) |
| 10 to 14 Year Olds | 0 (0.0%) | 0 (0.0%) |
| 15 to 17 Year Olds | 71 (100.0%) | 0 (0.0%) |
| 18 to 19 Year Olds | 8 (100.0%) | 0 (0.0%) |
| 20 to 24 Year Olds | 0 (0.0%) | 0 (0.0%) |
| 25 to 34 Year Olds | 0 (0.0%) | 0 (0.0%) |
| 35 Years and over | 33 (51.6%) | 31 (48.4%) |
| Total | 112 (78.3%) | 31 (21.7%) |
Educational Attainment by Field of Study in Wagon Wheel
Liberal arts & history (93 | 20.9%), computers & mathematics (90 | 20.2%), science & technology (88 | 19.8%), visual & performing arts (68 | 15.3%), and business (34 | 7.6%) are the most common fields of study among 445 individuals in Wagon Wheel who have obtained a bachelor's degree or higher.
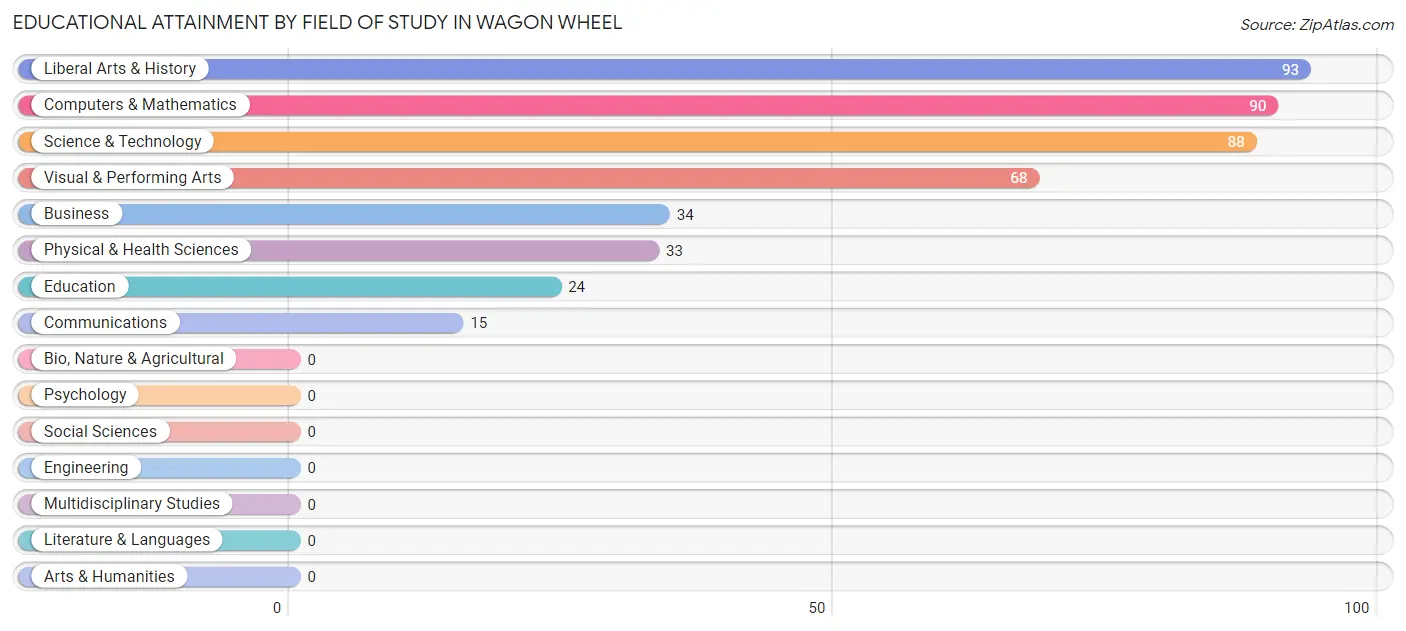
| Field of Study | # Graduates | % Graduates |
| Computers & Mathematics | 90 | 20.2% |
| Bio, Nature & Agricultural | 0 | 0.0% |
| Physical & Health Sciences | 33 | 7.4% |
| Psychology | 0 | 0.0% |
| Social Sciences | 0 | 0.0% |
| Engineering | 0 | 0.0% |
| Multidisciplinary Studies | 0 | 0.0% |
| Science & Technology | 88 | 19.8% |
| Business | 34 | 7.6% |
| Education | 24 | 5.4% |
| Literature & Languages | 0 | 0.0% |
| Liberal Arts & History | 93 | 20.9% |
| Visual & Performing Arts | 68 | 15.3% |
| Communications | 15 | 3.4% |
| Arts & Humanities | 0 | 0.0% |
| Total | 445 | 100.0% |
Transportation & Commute in Wagon Wheel
Vehicle Availability by Sex in Wagon Wheel
The most prevalent vehicle ownership categories in Wagon Wheel are males with 2 vehicles (119, accounting for 36.8%) and females with 2 vehicles (43, making up 40.3%).
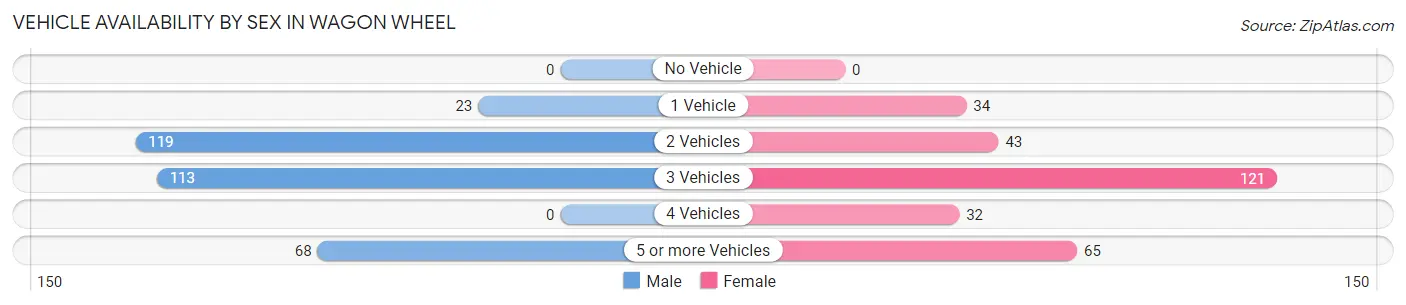
| Vehicles Available | Male | Female |
| No Vehicle | 0 (0.0%) | 0 (0.0%) |
| 1 Vehicle | 23 (7.1%) | 34 (11.5%) |
| 2 Vehicles | 119 (36.8%) | 43 (14.6%) |
| 3 Vehicles | 113 (35.0%) | 121 (41.0%) |
| 4 Vehicles | 0 (0.0%) | 32 (10.8%) |
| 5 or more Vehicles | 68 (21.0%) | 65 (22.0%) |
| Total | 323 (100.0%) | 295 (100.0%) |
Commute Time in Wagon Wheel
The most frequently occuring commute durations in Wagon Wheel are 20 to 24 minutes (164 commuters, 28.8%), 15 to 19 minutes (160 commuters, 28.1%), and 40 to 44 minutes (85 commuters, 14.9%).
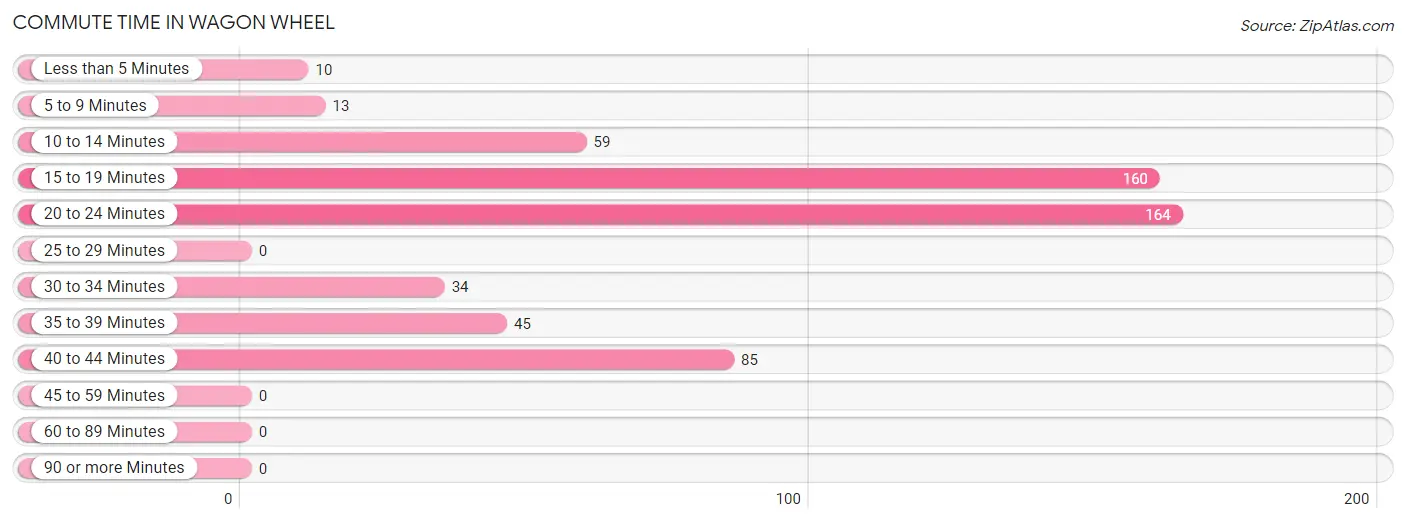
| Commute Time | # Commuters | % Commuters |
| Less than 5 Minutes | 10 | 1.8% |
| 5 to 9 Minutes | 13 | 2.3% |
| 10 to 14 Minutes | 59 | 10.3% |
| 15 to 19 Minutes | 160 | 28.1% |
| 20 to 24 Minutes | 164 | 28.8% |
| 25 to 29 Minutes | 0 | 0.0% |
| 30 to 34 Minutes | 34 | 6.0% |
| 35 to 39 Minutes | 45 | 7.9% |
| 40 to 44 Minutes | 85 | 14.9% |
| 45 to 59 Minutes | 0 | 0.0% |
| 60 to 89 Minutes | 0 | 0.0% |
| 90 or more Minutes | 0 | 0.0% |
Commute Time by Sex in Wagon Wheel
The most common commute times in Wagon Wheel are 15 to 19 minutes (141 commuters, 43.6%) for males and 20 to 24 minutes (156 commuters, 63.2%) for females.
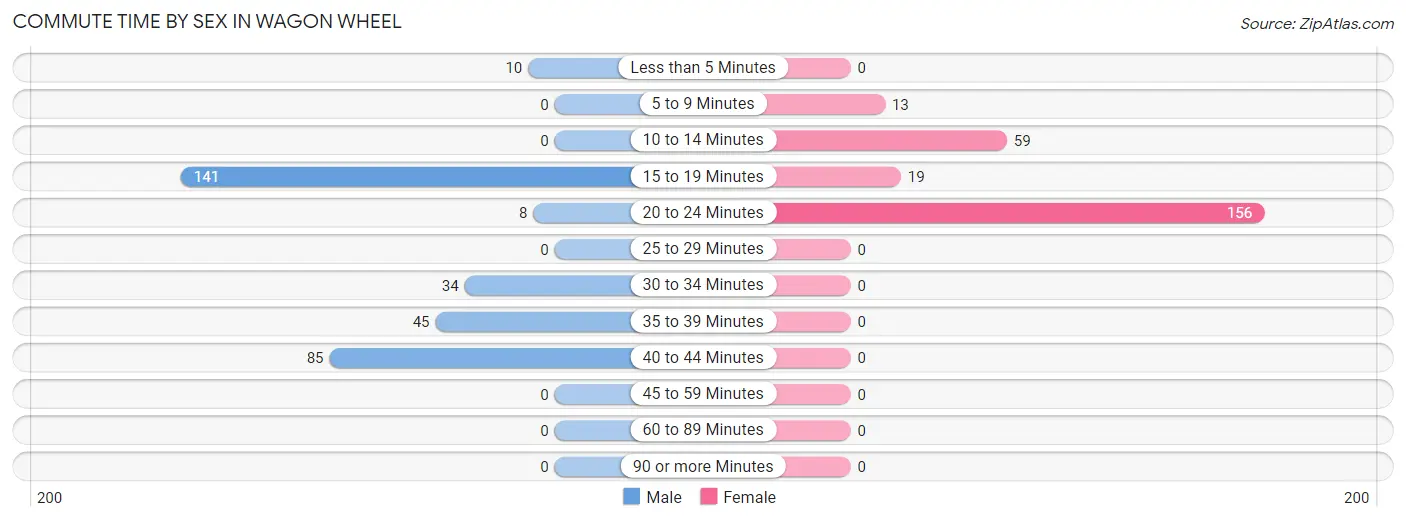
| Commute Time | Male | Female |
| Less than 5 Minutes | 10 (3.1%) | 0 (0.0%) |
| 5 to 9 Minutes | 0 (0.0%) | 13 (5.3%) |
| 10 to 14 Minutes | 0 (0.0%) | 59 (23.9%) |
| 15 to 19 Minutes | 141 (43.6%) | 19 (7.7%) |
| 20 to 24 Minutes | 8 (2.5%) | 156 (63.2%) |
| 25 to 29 Minutes | 0 (0.0%) | 0 (0.0%) |
| 30 to 34 Minutes | 34 (10.5%) | 0 (0.0%) |
| 35 to 39 Minutes | 45 (13.9%) | 0 (0.0%) |
| 40 to 44 Minutes | 85 (26.3%) | 0 (0.0%) |
| 45 to 59 Minutes | 0 (0.0%) | 0 (0.0%) |
| 60 to 89 Minutes | 0 (0.0%) | 0 (0.0%) |
| 90 or more Minutes | 0 (0.0%) | 0 (0.0%) |
Time of Departure to Work by Sex in Wagon Wheel
The most frequent times of departure to work in Wagon Wheel are 6:00 AM to 6:29 AM (130, 40.3%) for males and 8:30 AM to 8:59 AM (143, 57.9%) for females.
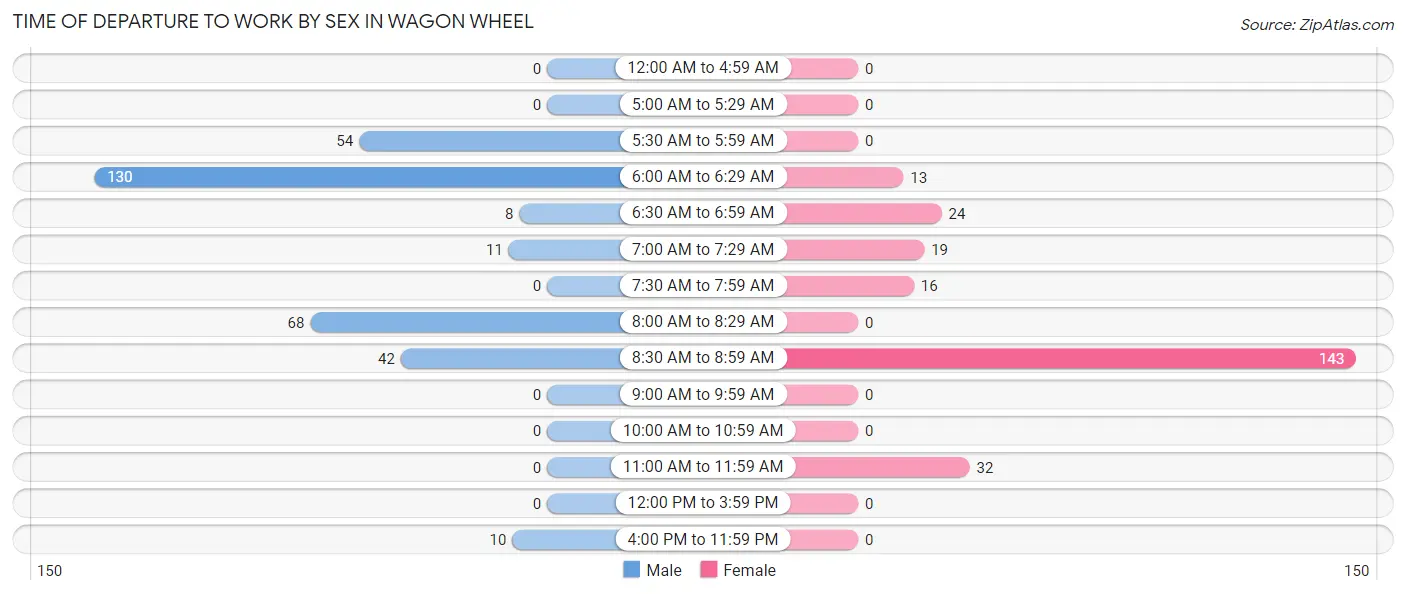
| Time of Departure | Male | Female |
| 12:00 AM to 4:59 AM | 0 (0.0%) | 0 (0.0%) |
| 5:00 AM to 5:29 AM | 0 (0.0%) | 0 (0.0%) |
| 5:30 AM to 5:59 AM | 54 (16.7%) | 0 (0.0%) |
| 6:00 AM to 6:29 AM | 130 (40.3%) | 13 (5.3%) |
| 6:30 AM to 6:59 AM | 8 (2.5%) | 24 (9.7%) |
| 7:00 AM to 7:29 AM | 11 (3.4%) | 19 (7.7%) |
| 7:30 AM to 7:59 AM | 0 (0.0%) | 16 (6.5%) |
| 8:00 AM to 8:29 AM | 68 (21.0%) | 0 (0.0%) |
| 8:30 AM to 8:59 AM | 42 (13.0%) | 143 (57.9%) |
| 9:00 AM to 9:59 AM | 0 (0.0%) | 0 (0.0%) |
| 10:00 AM to 10:59 AM | 0 (0.0%) | 0 (0.0%) |
| 11:00 AM to 11:59 AM | 0 (0.0%) | 32 (13.0%) |
| 12:00 PM to 3:59 PM | 0 (0.0%) | 0 (0.0%) |
| 4:00 PM to 11:59 PM | 10 (3.1%) | 0 (0.0%) |
| Total | 323 (100.0%) | 247 (100.0%) |
Housing Occupancy in Wagon Wheel
Occupancy by Ownership in Wagon Wheel
Of the total 643 dwellings in Wagon Wheel, owner-occupied units account for 529 (82.3%), while renter-occupied units make up 114 (17.7%).
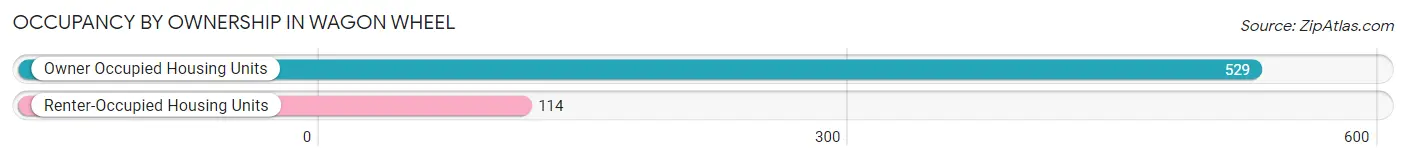
| Occupancy | # Housing Units | % Housing Units |
| Owner Occupied Housing Units | 529 | 82.3% |
| Renter-Occupied Housing Units | 114 | 17.7% |
| Total Occupied Housing Units | 643 | 100.0% |
Occupancy by Household Size in Wagon Wheel
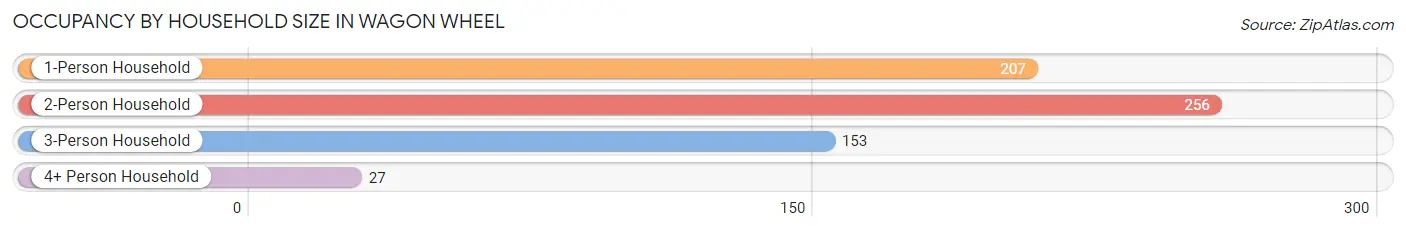
| Household Size | # Housing Units | % Housing Units |
| 1-Person Household | 207 | 32.2% |
| 2-Person Household | 256 | 39.8% |
| 3-Person Household | 153 | 23.8% |
| 4+ Person Household | 27 | 4.2% |
| Total Housing Units | 643 | 100.0% |
Occupancy by Ownership by Household Size in Wagon Wheel
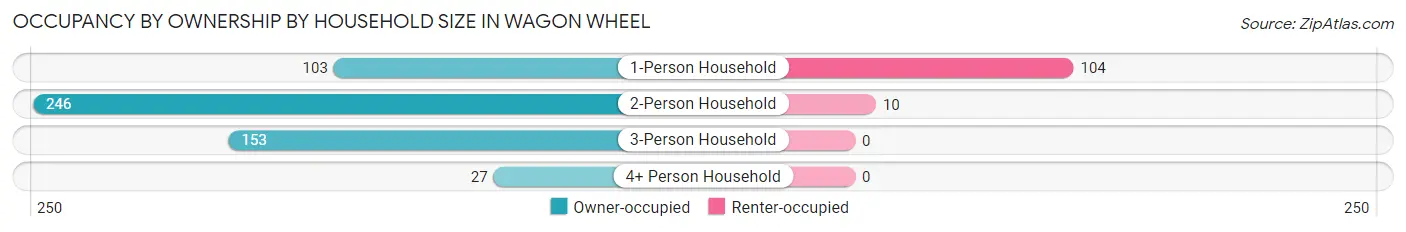
| Household Size | Owner-occupied | Renter-occupied |
| 1-Person Household | 103 (49.8%) | 104 (50.2%) |
| 2-Person Household | 246 (96.1%) | 10 (3.9%) |
| 3-Person Household | 153 (100.0%) | 0 (0.0%) |
| 4+ Person Household | 27 (100.0%) | 0 (0.0%) |
| Total Housing Units | 529 (82.3%) | 114 (17.7%) |
Occupancy by Educational Attainment in Wagon Wheel
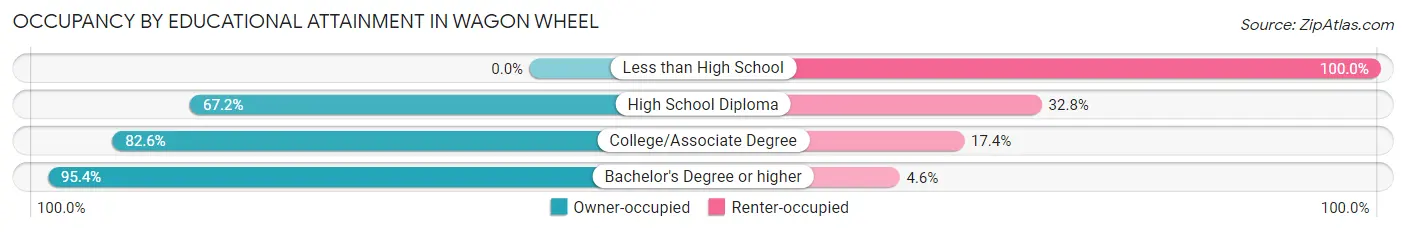
| Household Size | Owner-occupied | Renter-occupied |
| Less than High School | 0 (0.0%) | 12 (100.0%) |
| High School Diploma | 86 (67.2%) | 42 (32.8%) |
| College/Associate Degree | 237 (82.6%) | 50 (17.4%) |
| Bachelor's Degree or higher | 206 (95.4%) | 10 (4.6%) |
Occupancy by Age of Householder in Wagon Wheel
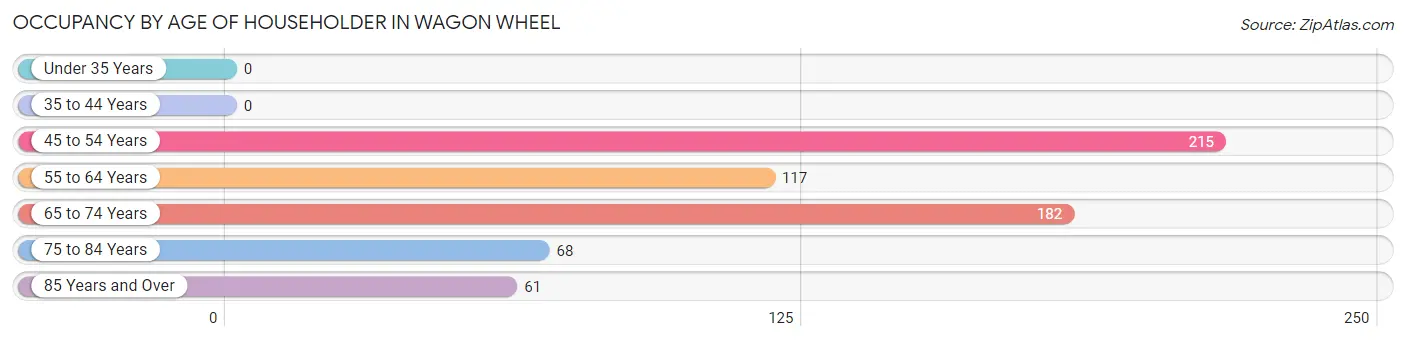
| Age Bracket | # Households | % Households |
| Under 35 Years | 0 | 0.0% |
| 35 to 44 Years | 0 | 0.0% |
| 45 to 54 Years | 215 | 33.4% |
| 55 to 64 Years | 117 | 18.2% |
| 65 to 74 Years | 182 | 28.3% |
| 75 to 84 Years | 68 | 10.6% |
| 85 Years and Over | 61 | 9.5% |
| Total | 643 | 100.0% |
Housing Finances in Wagon Wheel
Median Income by Occupancy in Wagon Wheel
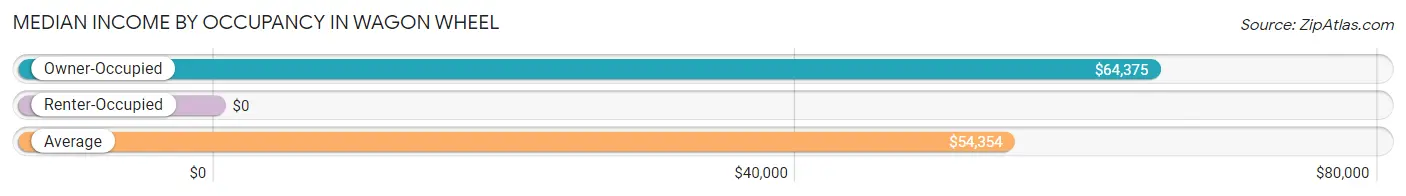
| Occupancy Type | # Households | Median Income |
| Owner-Occupied | 529 (82.3%) | $64,375 |
| Renter-Occupied | 114 (17.7%) | $0 |
| Average | 643 (100.0%) | $54,354 |
Occupancy by Householder Income Bracket in Wagon Wheel
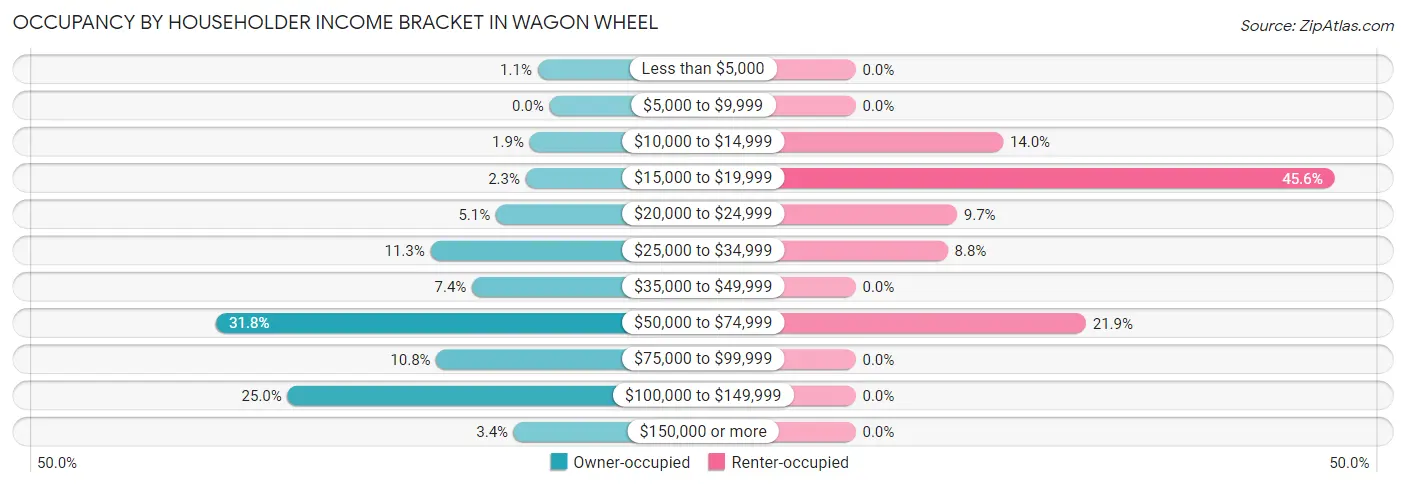
| Income Bracket | Owner-occupied | Renter-occupied |
| Less than $5,000 | 6 (1.1%) | 0 (0.0%) |
| $5,000 to $9,999 | 0 (0.0%) | 0 (0.0%) |
| $10,000 to $14,999 | 10 (1.9%) | 16 (14.0%) |
| $15,000 to $19,999 | 12 (2.3%) | 52 (45.6%) |
| $20,000 to $24,999 | 27 (5.1%) | 11 (9.7%) |
| $25,000 to $34,999 | 60 (11.3%) | 10 (8.8%) |
| $35,000 to $49,999 | 39 (7.4%) | 0 (0.0%) |
| $50,000 to $74,999 | 168 (31.8%) | 25 (21.9%) |
| $75,000 to $99,999 | 57 (10.8%) | 0 (0.0%) |
| $100,000 to $149,999 | 132 (24.9%) | 0 (0.0%) |
| $150,000 or more | 18 (3.4%) | 0 (0.0%) |
| Total | 529 (100.0%) | 114 (100.0%) |
Monthly Housing Cost Tiers in Wagon Wheel
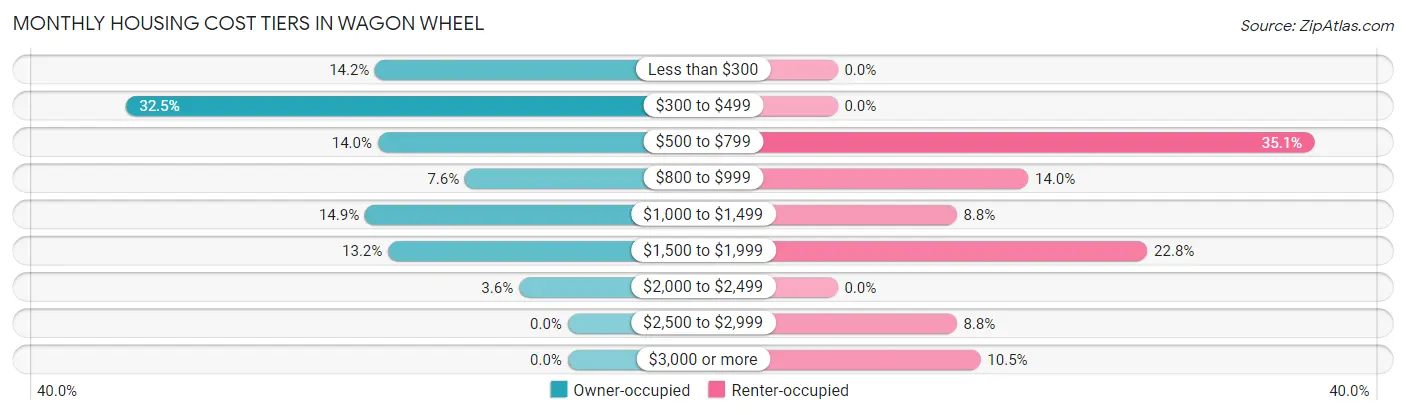
| Monthly Cost | Owner-occupied | Renter-occupied |
| Less than $300 | 75 (14.2%) | 0 (0.0%) |
| $300 to $499 | 172 (32.5%) | 0 (0.0%) |
| $500 to $799 | 74 (14.0%) | 40 (35.1%) |
| $800 to $999 | 40 (7.6%) | 16 (14.0%) |
| $1,000 to $1,499 | 79 (14.9%) | 10 (8.8%) |
| $1,500 to $1,999 | 70 (13.2%) | 26 (22.8%) |
| $2,000 to $2,499 | 19 (3.6%) | 0 (0.0%) |
| $2,500 to $2,999 | 0 (0.0%) | 10 (8.8%) |
| $3,000 or more | 0 (0.0%) | 12 (10.5%) |
| Total | 529 (100.0%) | 114 (100.0%) |
Physical Housing Characteristics in Wagon Wheel
Housing Structures in Wagon Wheel
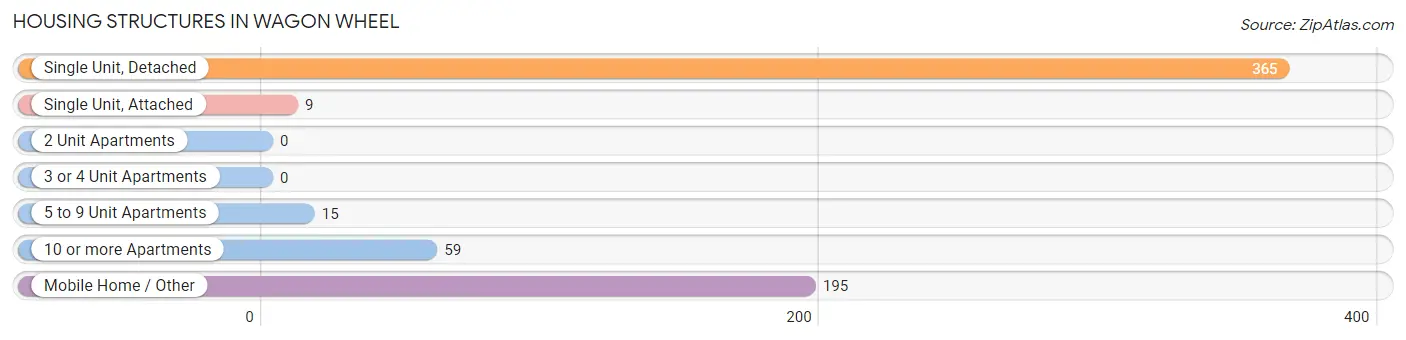
| Structure Type | # Housing Units | % Housing Units |
| Single Unit, Detached | 365 | 56.8% |
| Single Unit, Attached | 9 | 1.4% |
| 2 Unit Apartments | 0 | 0.0% |
| 3 or 4 Unit Apartments | 0 | 0.0% |
| 5 to 9 Unit Apartments | 15 | 2.3% |
| 10 or more Apartments | 59 | 9.2% |
| Mobile Home / Other | 195 | 30.3% |
| Total | 643 | 100.0% |
Housing Structures by Occupancy in Wagon Wheel
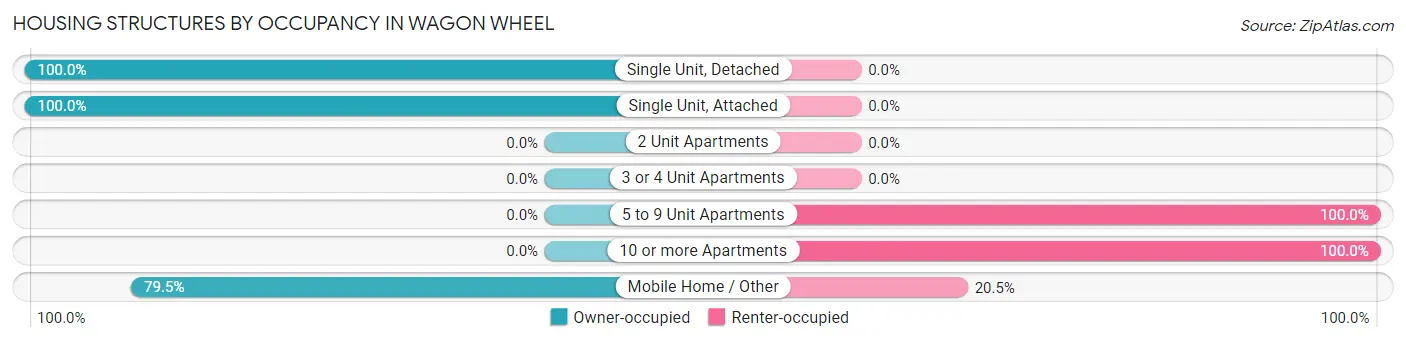
| Structure Type | Owner-occupied | Renter-occupied |
| Single Unit, Detached | 365 (100.0%) | 0 (0.0%) |
| Single Unit, Attached | 9 (100.0%) | 0 (0.0%) |
| 2 Unit Apartments | 0 (0.0%) | 0 (0.0%) |
| 3 or 4 Unit Apartments | 0 (0.0%) | 0 (0.0%) |
| 5 to 9 Unit Apartments | 0 (0.0%) | 15 (100.0%) |
| 10 or more Apartments | 0 (0.0%) | 59 (100.0%) |
| Mobile Home / Other | 155 (79.5%) | 40 (20.5%) |
| Total | 529 (82.3%) | 114 (17.7%) |
Housing Structures by Number of Rooms in Wagon Wheel
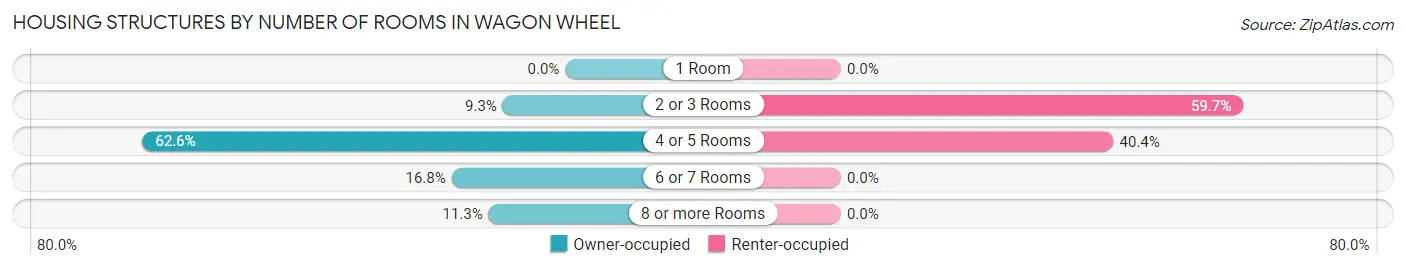
| Number of Rooms | Owner-occupied | Renter-occupied |
| 1 Room | 0 (0.0%) | 0 (0.0%) |
| 2 or 3 Rooms | 49 (9.3%) | 68 (59.7%) |
| 4 or 5 Rooms | 331 (62.6%) | 46 (40.4%) |
| 6 or 7 Rooms | 89 (16.8%) | 0 (0.0%) |
| 8 or more Rooms | 60 (11.3%) | 0 (0.0%) |
| Total | 529 (100.0%) | 114 (100.0%) |
Housing Structure by Heating Type in Wagon Wheel
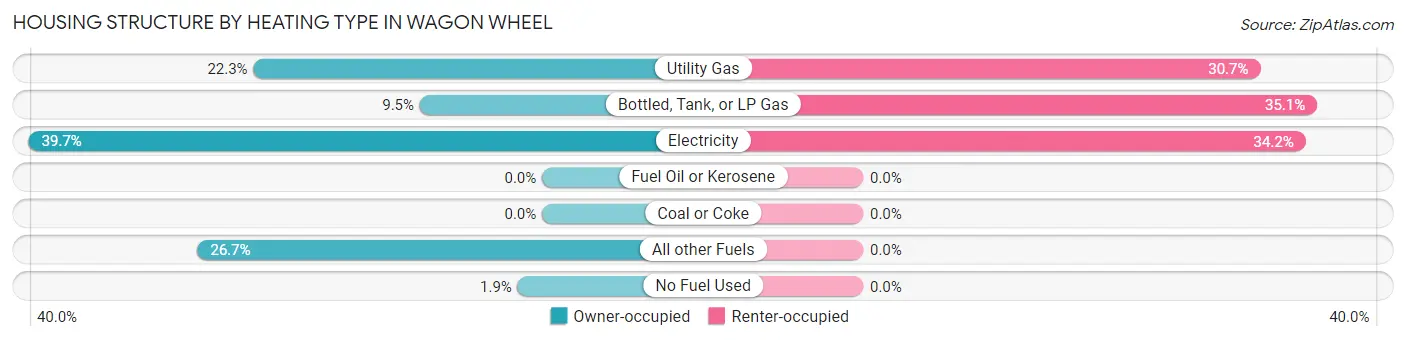
| Heating Type | Owner-occupied | Renter-occupied |
| Utility Gas | 118 (22.3%) | 35 (30.7%) |
| Bottled, Tank, or LP Gas | 50 (9.5%) | 40 (35.1%) |
| Electricity | 210 (39.7%) | 39 (34.2%) |
| Fuel Oil or Kerosene | 0 (0.0%) | 0 (0.0%) |
| Coal or Coke | 0 (0.0%) | 0 (0.0%) |
| All other Fuels | 141 (26.7%) | 0 (0.0%) |
| No Fuel Used | 10 (1.9%) | 0 (0.0%) |
| Total | 529 (100.0%) | 114 (100.0%) |
Household Vehicle Usage in Wagon Wheel
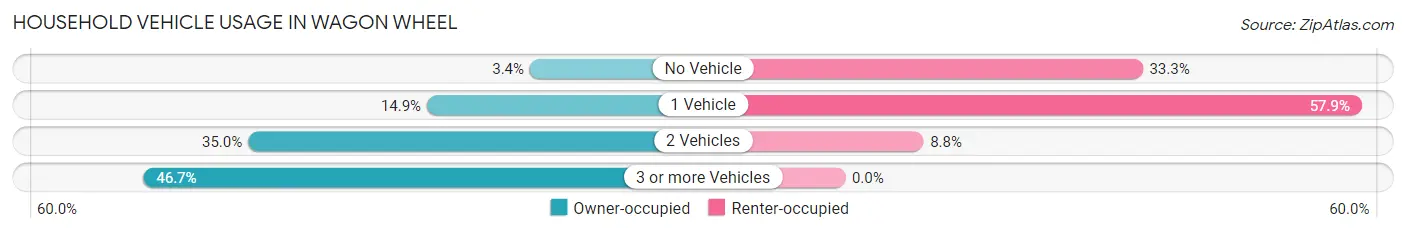
| Vehicles per Household | Owner-occupied | Renter-occupied |
| No Vehicle | 18 (3.4%) | 38 (33.3%) |
| 1 Vehicle | 79 (14.9%) | 66 (57.9%) |
| 2 Vehicles | 185 (35.0%) | 10 (8.8%) |
| 3 or more Vehicles | 247 (46.7%) | 0 (0.0%) |
| Total | 529 (100.0%) | 114 (100.0%) |
Real Estate & Mortgages in Wagon Wheel
Real Estate and Mortgage Overview in Wagon Wheel
| Characteristic | Without Mortgage | With Mortgage |
| Housing Units | 332 | 197 |
| Median Property Value | $164,600 | $338,900 |
| Median Household Income | $63,182 | $0 |
| Monthly Housing Costs | $428 | $0 |
| Real Estate Taxes | $1,428 | $0 |
Property Value by Mortgage Status in Wagon Wheel
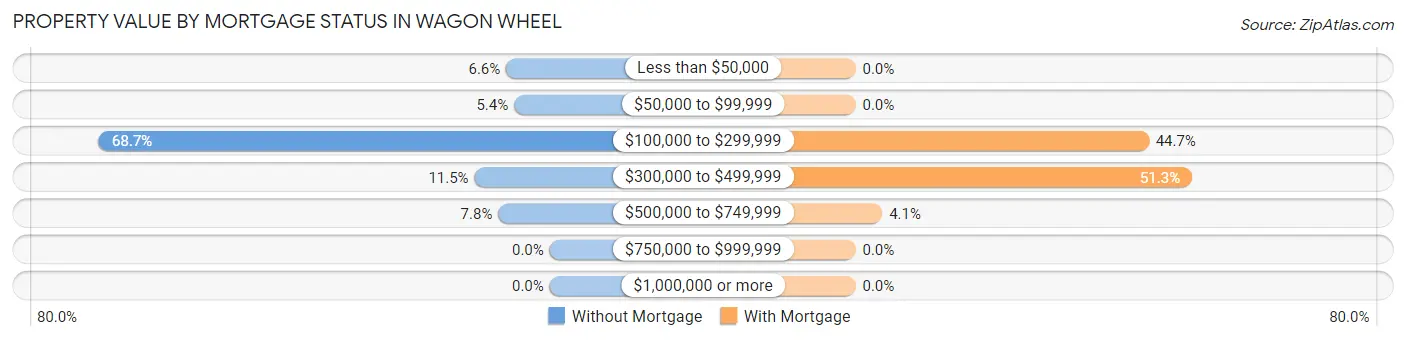
| Property Value | Without Mortgage | With Mortgage |
| Less than $50,000 | 22 (6.6%) | 0 (0.0%) |
| $50,000 to $99,999 | 18 (5.4%) | 0 (0.0%) |
| $100,000 to $299,999 | 228 (68.7%) | 88 (44.7%) |
| $300,000 to $499,999 | 38 (11.5%) | 101 (51.3%) |
| $500,000 to $749,999 | 26 (7.8%) | 8 (4.1%) |
| $750,000 to $999,999 | 0 (0.0%) | 0 (0.0%) |
| $1,000,000 or more | 0 (0.0%) | 0 (0.0%) |
| Total | 332 (100.0%) | 197 (100.0%) |
Household Income by Mortgage Status in Wagon Wheel
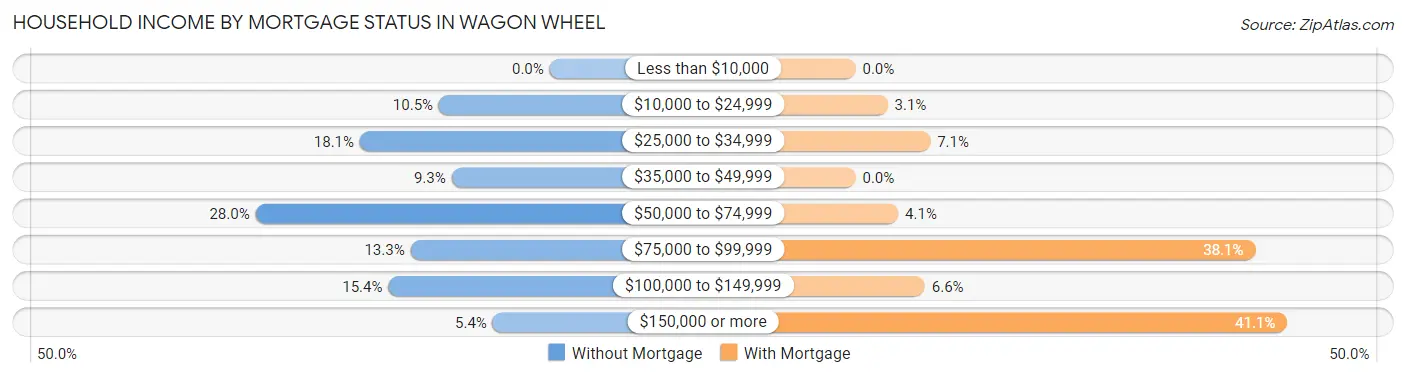
| Household Income | Without Mortgage | With Mortgage |
| Less than $10,000 | 0 (0.0%) | 0 (0.0%) |
| $10,000 to $24,999 | 35 (10.5%) | 6 (3.0%) |
| $25,000 to $34,999 | 60 (18.1%) | 14 (7.1%) |
| $35,000 to $49,999 | 31 (9.3%) | 0 (0.0%) |
| $50,000 to $74,999 | 93 (28.0%) | 8 (4.1%) |
| $75,000 to $99,999 | 44 (13.3%) | 75 (38.1%) |
| $100,000 to $149,999 | 51 (15.4%) | 13 (6.6%) |
| $150,000 or more | 18 (5.4%) | 81 (41.1%) |
| Total | 332 (100.0%) | 197 (100.0%) |
Property Value to Household Income Ratio in Wagon Wheel
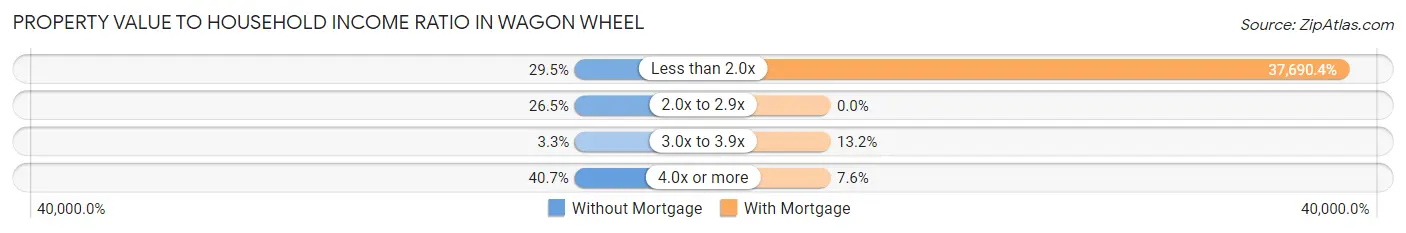
| Value-to-Income Ratio | Without Mortgage | With Mortgage |
| Less than 2.0x | 98 (29.5%) | 74,250 (37,690.4%) |
| 2.0x to 2.9x | 88 (26.5%) | 0 (0.0%) |
| 3.0x to 3.9x | 11 (3.3%) | 26 (13.2%) |
| 4.0x or more | 135 (40.7%) | 15 (7.6%) |
| Total | 332 (100.0%) | 197 (100.0%) |
Real Estate Taxes by Mortgage Status in Wagon Wheel
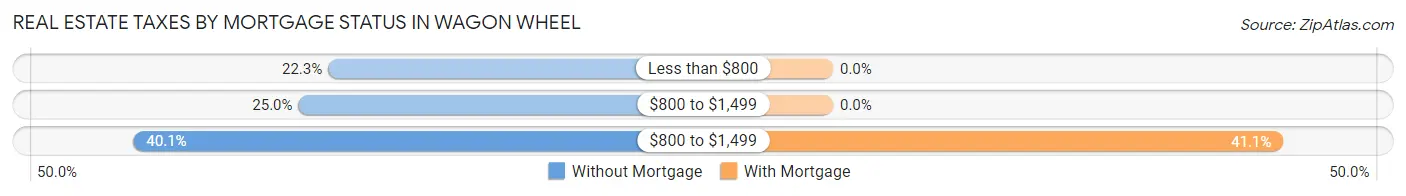
| Property Taxes | Without Mortgage | With Mortgage |
| Less than $800 | 74 (22.3%) | 0 (0.0%) |
| $800 to $1,499 | 83 (25.0%) | 0 (0.0%) |
| $800 to $1,499 | 133 (40.1%) | 81 (41.1%) |
| Total | 332 (100.0%) | 197 (100.0%) |
Health & Disability in Wagon Wheel
Health Insurance Coverage by Age in Wagon Wheel
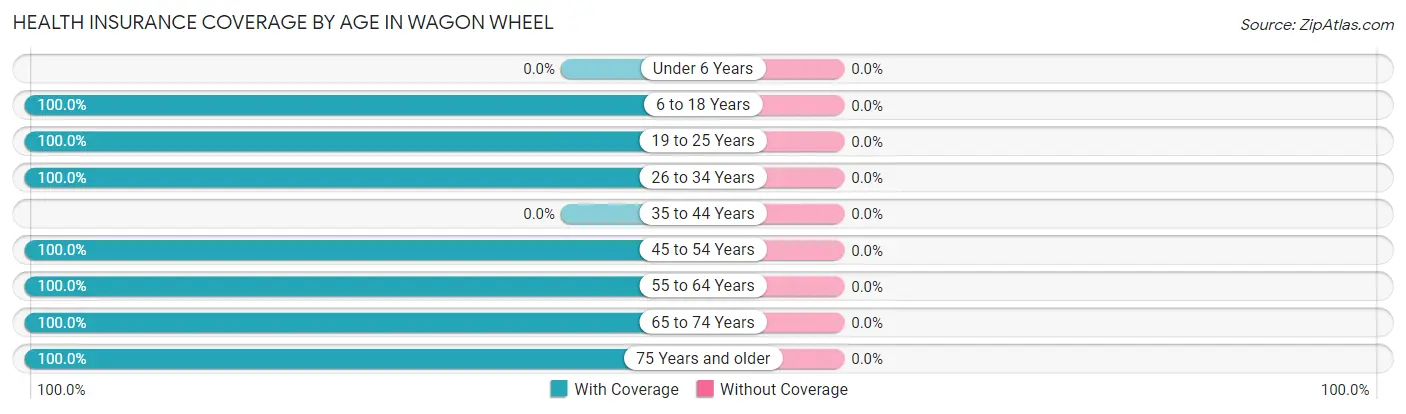
| Age Bracket | With Coverage | Without Coverage |
| Under 6 Years | 0 (0.0%) | 0 (0.0%) |
| 6 to 18 Years | 79 (100.0%) | 0 (0.0%) |
| 19 to 25 Years | 118 (100.0%) | 0 (0.0%) |
| 26 to 34 Years | 49 (100.0%) | 0 (0.0%) |
| 35 to 44 Years | 0 (0.0%) | 0 (0.0%) |
| 45 to 54 Years | 417 (100.0%) | 0 (0.0%) |
| 55 to 64 Years | 210 (100.0%) | 0 (0.0%) |
| 65 to 74 Years | 312 (100.0%) | 0 (0.0%) |
| 75 Years and older | 157 (100.0%) | 0 (0.0%) |
| Total | 1,342 (100.0%) | 0 (0.0%) |
Health Insurance Coverage by Citizenship Status in Wagon Wheel
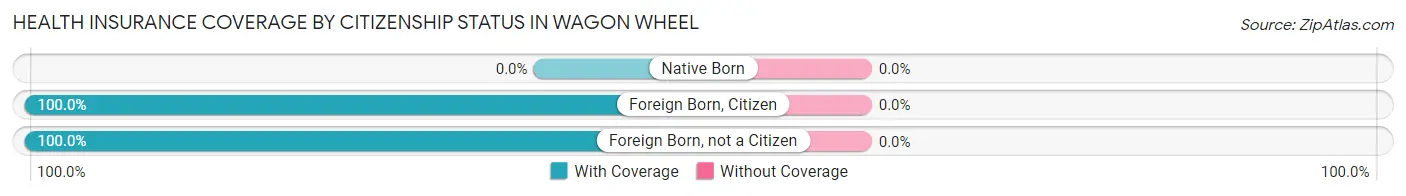
| Citizenship Status | With Coverage | Without Coverage |
| Native Born | 0 (0.0%) | 0 (0.0%) |
| Foreign Born, Citizen | 79 (100.0%) | 0 (0.0%) |
| Foreign Born, not a Citizen | 118 (100.0%) | 0 (0.0%) |
Health Insurance Coverage by Household Income in Wagon Wheel
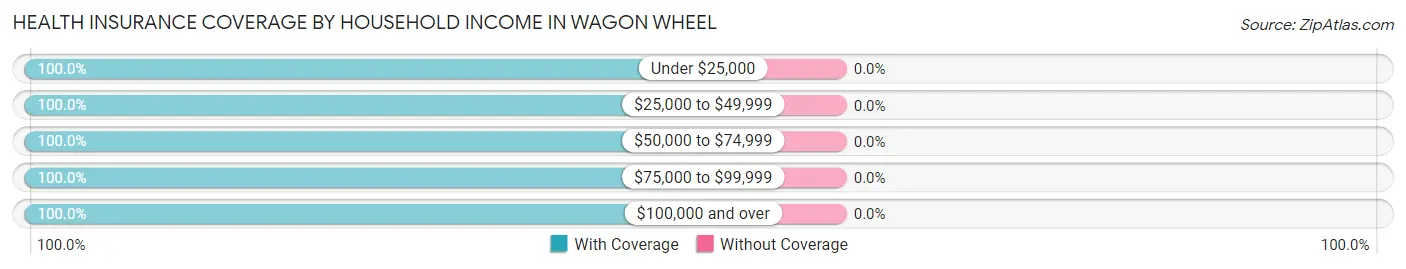
| Household Income | With Coverage | Without Coverage |
| Under $25,000 | 141 (100.0%) | 0 (0.0%) |
| $25,000 to $49,999 | 159 (100.0%) | 0 (0.0%) |
| $50,000 to $74,999 | 519 (100.0%) | 0 (0.0%) |
| $75,000 to $99,999 | 147 (100.0%) | 0 (0.0%) |
| $100,000 and over | 371 (100.0%) | 0 (0.0%) |
Public vs Private Health Insurance Coverage by Age in Wagon Wheel
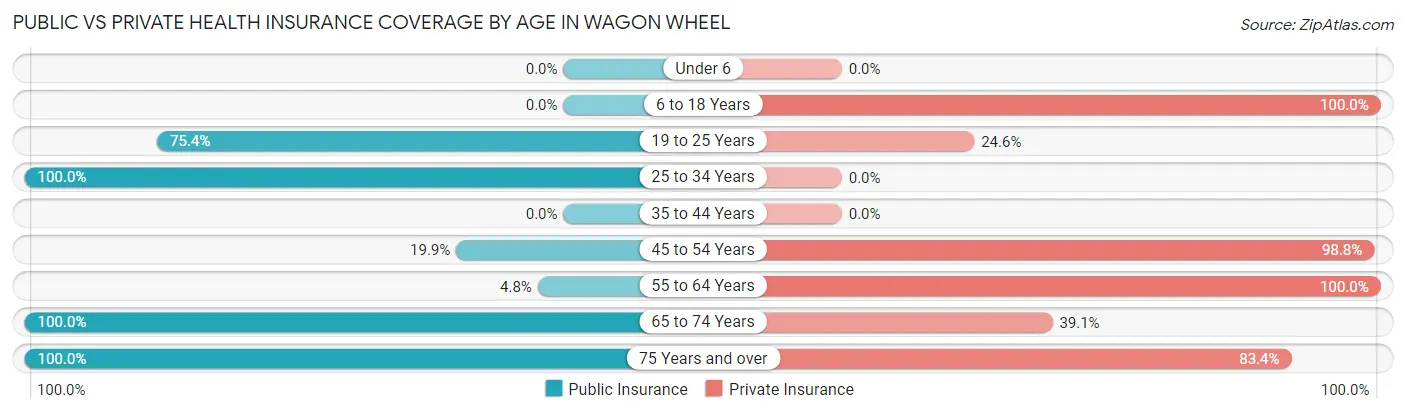
| Age Bracket | Public Insurance | Private Insurance |
| Under 6 | 0 (0.0%) | 0 (0.0%) |
| 6 to 18 Years | 0 (0.0%) | 79 (100.0%) |
| 19 to 25 Years | 89 (75.4%) | 29 (24.6%) |
| 25 to 34 Years | 49 (100.0%) | 0 (0.0%) |
| 35 to 44 Years | 0 (0.0%) | 0 (0.0%) |
| 45 to 54 Years | 83 (19.9%) | 412 (98.8%) |
| 55 to 64 Years | 10 (4.8%) | 210 (100.0%) |
| 65 to 74 Years | 312 (100.0%) | 122 (39.1%) |
| 75 Years and over | 157 (100.0%) | 131 (83.4%) |
| Total | 700 (52.2%) | 983 (73.3%) |
Disability Status by Sex by Age in Wagon Wheel
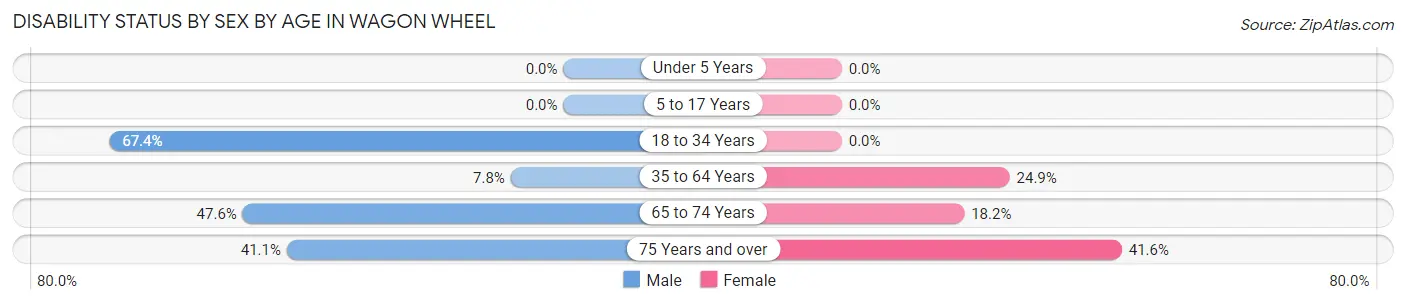
| Age Bracket | Male | Female |
| Under 5 Years | 0 (0.0%) | 0 (0.0%) |
| 5 to 17 Years | 0 (0.0%) | 0 (0.0%) |
| 18 to 34 Years | 60 (67.4%) | 0 (0.0%) |
| 35 to 64 Years | 23 (7.8%) | 83 (24.9%) |
| 65 to 74 Years | 70 (47.6%) | 30 (18.2%) |
| 75 Years and over | 23 (41.1%) | 42 (41.6%) |
Disability Class by Sex by Age in Wagon Wheel
Disability Class: Hearing Difficulty
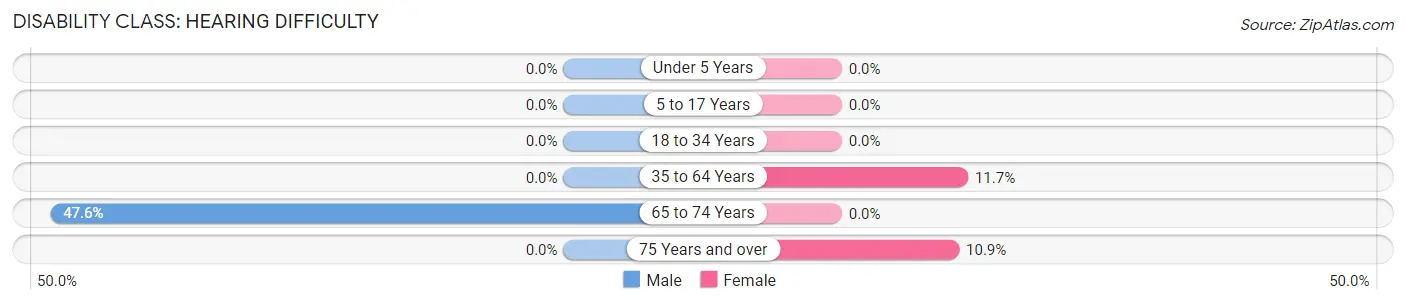
| Age Bracket | Male | Female |
| Under 5 Years | 0 (0.0%) | 0 (0.0%) |
| 5 to 17 Years | 0 (0.0%) | 0 (0.0%) |
| 18 to 34 Years | 0 (0.0%) | 0 (0.0%) |
| 35 to 64 Years | 0 (0.0%) | 39 (11.7%) |
| 65 to 74 Years | 70 (47.6%) | 0 (0.0%) |
| 75 Years and over | 0 (0.0%) | 11 (10.9%) |
Disability Class: Vision Difficulty
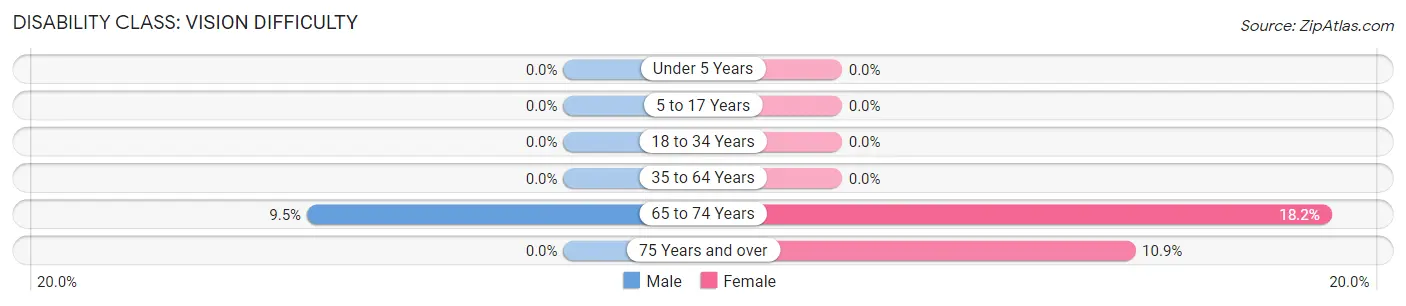
| Age Bracket | Male | Female |
| Under 5 Years | 0 (0.0%) | 0 (0.0%) |
| 5 to 17 Years | 0 (0.0%) | 0 (0.0%) |
| 18 to 34 Years | 0 (0.0%) | 0 (0.0%) |
| 35 to 64 Years | 0 (0.0%) | 0 (0.0%) |
| 65 to 74 Years | 14 (9.5%) | 30 (18.2%) |
| 75 Years and over | 0 (0.0%) | 11 (10.9%) |
Disability Class: Cognitive Difficulty
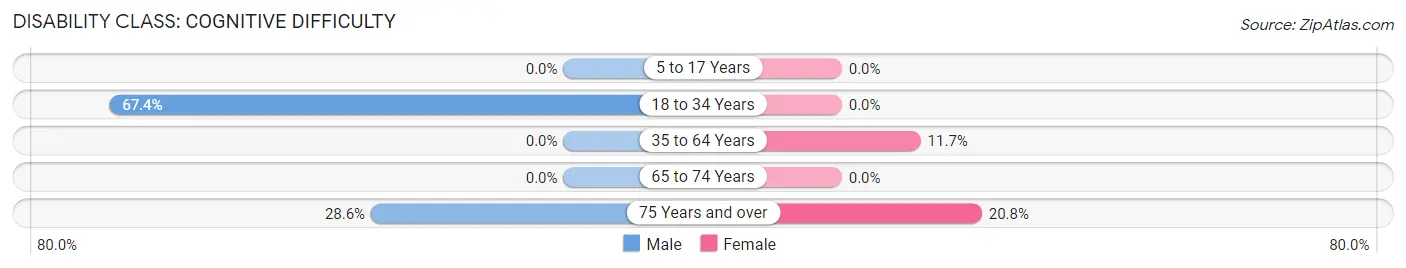
| Age Bracket | Male | Female |
| 5 to 17 Years | 0 (0.0%) | 0 (0.0%) |
| 18 to 34 Years | 60 (67.4%) | 0 (0.0%) |
| 35 to 64 Years | 0 (0.0%) | 39 (11.7%) |
| 65 to 74 Years | 0 (0.0%) | 0 (0.0%) |
| 75 Years and over | 16 (28.6%) | 21 (20.8%) |
Disability Class: Ambulatory Difficulty
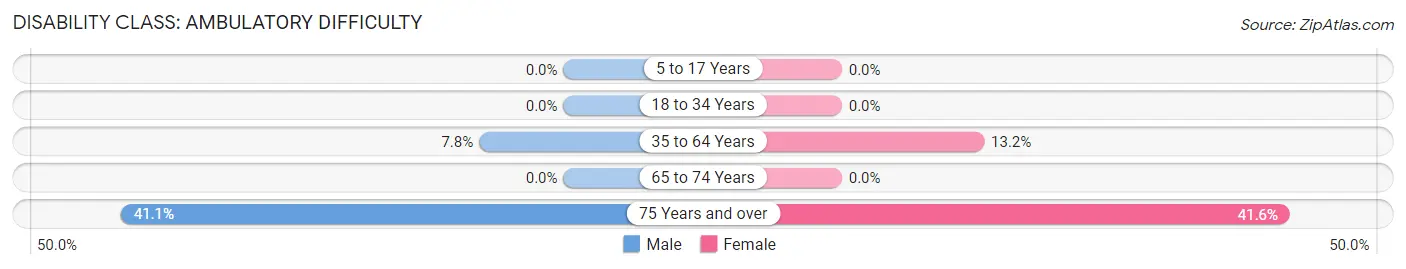
| Age Bracket | Male | Female |
| 5 to 17 Years | 0 (0.0%) | 0 (0.0%) |
| 18 to 34 Years | 0 (0.0%) | 0 (0.0%) |
| 35 to 64 Years | 23 (7.8%) | 44 (13.2%) |
| 65 to 74 Years | 0 (0.0%) | 0 (0.0%) |
| 75 Years and over | 23 (41.1%) | 42 (41.6%) |
Disability Class: Self-Care Difficulty
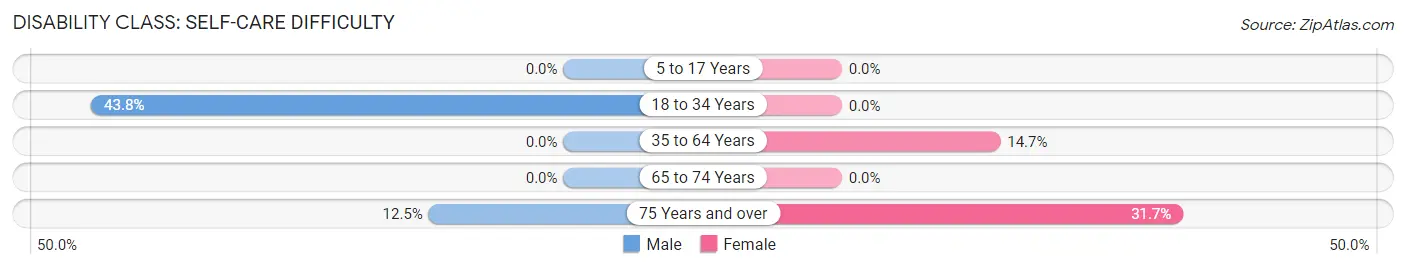
| Age Bracket | Male | Female |
| 5 to 17 Years | 0 (0.0%) | 0 (0.0%) |
| 18 to 34 Years | 39 (43.8%) | 0 (0.0%) |
| 35 to 64 Years | 0 (0.0%) | 49 (14.7%) |
| 65 to 74 Years | 0 (0.0%) | 0 (0.0%) |
| 75 Years and over | 7 (12.5%) | 32 (31.7%) |
Technology Access in Wagon Wheel
Computing Device Access in Wagon Wheel
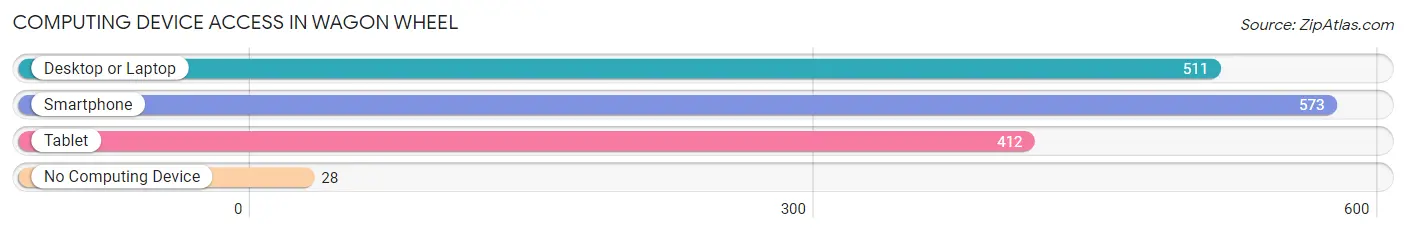
| Device Type | # Households | % Households |
| Desktop or Laptop | 511 | 79.5% |
| Smartphone | 573 | 89.1% |
| Tablet | 412 | 64.1% |
| No Computing Device | 28 | 4.3% |
| Total | 643 | 100.0% |
Internet Access in Wagon Wheel
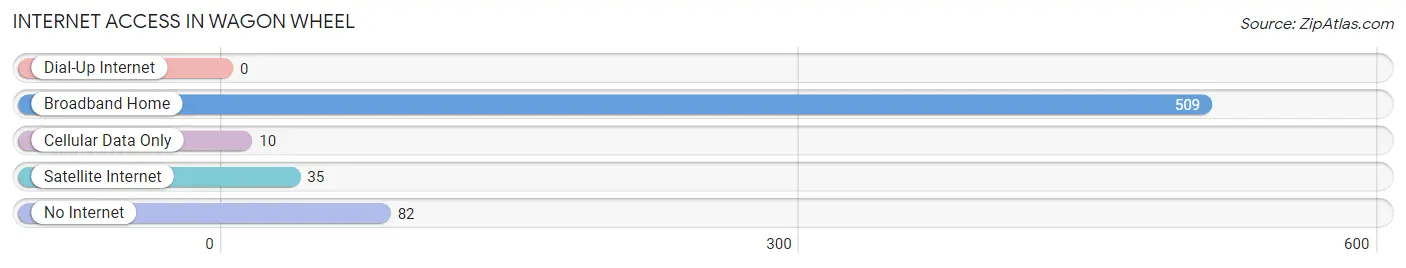
| Internet Type | # Households | % Households |
| Dial-Up Internet | 0 | 0.0% |
| Broadband Home | 509 | 79.2% |
| Cellular Data Only | 10 | 1.6% |
| Satellite Internet | 35 | 5.4% |
| No Internet | 82 | 12.8% |
| Total | 643 | 100.0% |
Wagon Wheel Summary
Wagon Wheel, Arizona is a small unincorporated community located in the northern part of the state, in Coconino County. It is situated in a rural area, surrounded by the Coconino National Forest and the Kaibab National Forest. The community is located approximately 25 miles north of Flagstaff, Arizona, and is home to a population of approximately 200 people.
History
The area that is now known as Wagon Wheel was first settled in the late 1800s by a group of Mormon settlers. The settlers were looking for a place to establish a new community and chose the area due to its proximity to the Grand Canyon and other natural attractions. The settlers named the area Wagon Wheel due to the large number of wagon wheels that were found in the area.
The community was officially established in 1891 and was initially a farming and ranching community. The settlers grew crops such as corn, wheat, and hay, and raised cattle and sheep. The community also had a small sawmill and a general store.
In the early 1900s, the community began to grow and the population increased. The town had a post office, a school, and a church. The town also had a hotel, a saloon, and a blacksmith shop.
Geography
Wagon Wheel is located in the northern part of Arizona, in Coconino County. It is situated in a rural area, surrounded by the Coconino National Forest and the Kaibab National Forest. The community is located approximately 25 miles north of Flagstaff, Arizona.
The area has a semi-arid climate, with hot summers and cold winters. The average temperature in the summer is around 90 degrees Fahrenheit, and the average temperature in the winter is around 30 degrees Fahrenheit. The area receives an average of 12 inches of precipitation per year.
Economy
The economy of Wagon Wheel is largely based on agriculture and tourism. The area is home to several farms and ranches, which produce crops such as corn, wheat, and hay. The area is also home to several tourist attractions, such as the Grand Canyon and other natural attractions.
The area also has a few small businesses, such as a general store, a gas station, and a restaurant. The town also has a post office and a school.
Demographics
As of the 2010 census, the population of Wagon Wheel was approximately 200 people. The population is mostly white, with a small percentage of Native American and Hispanic residents. The median household income is approximately $35,000 per year. The median age is around 40 years old.
Common Questions
What is Per Capita Income in Wagon Wheel?
Per Capita income in Wagon Wheel is $30,306.
What is the Median Family Income in Wagon Wheel?
Median Family Income in Wagon Wheel is $74,276.
What is the Median Household income in Wagon Wheel?
Median Household Income in Wagon Wheel is $54,354.
What is Income or Wage Gap in Wagon Wheel?
Income or Wage Gap in Wagon Wheel is 62.9%.
Women in Wagon Wheel earn 37.1 cents for every dollar earned by a man.
What is Inequality or Gini Index in Wagon Wheel?
Inequality or Gini Index in Wagon Wheel is 0.35.
What is the Total Population of Wagon Wheel?
Total Population of Wagon Wheel is 1,406.
What is the Total Male Population of Wagon Wheel?
Total Male Population of Wagon Wheel is 633.
What is the Total Female Population of Wagon Wheel?
Total Female Population of Wagon Wheel is 773.
What is the Ratio of Males per 100 Females in Wagon Wheel?
There are 81.89 Males per 100 Females in Wagon Wheel.
What is the Ratio of Females per 100 Males in Wagon Wheel?
There are 122.12 Females per 100 Males in Wagon Wheel.
What is the Median Population Age in Wagon Wheel?
Median Population Age in Wagon Wheel is 58.3 Years.
What is the Average Family Size in Wagon Wheel
Average Family Size in Wagon Wheel is 2.6 People.
What is the Average Household Size in Wagon Wheel
Average Household Size in Wagon Wheel is 2.1 People.
How Large is the Labor Force in Wagon Wheel?
There are 673 People in the Labor Forcein in Wagon Wheel.
What is the Percentage of People in the Labor Force in Wagon Wheel?
47.9% of People are in the Labor Force in Wagon Wheel.
What is the Unemployment Rate in Wagon Wheel?
Unemployment Rate in Wagon Wheel is 3.1%.