New Kingman Butler, AZ Map & Demographics
New Kingman Butler Map
New Kingman Butler Overview
$24,267
PER CAPITA INCOME
$51,832
AVG FAMILY INCOME
$42,541
AVG HOUSEHOLD INCOME
19.8%
WAGE / INCOME GAP [ % ]
80.2¢/ $1
WAGE / INCOME GAP [ $ ]
$11,144
FAMILY INCOME DEFICIT
0.41
INEQUALITY / GINI INDEX
13,247
TOTAL POPULATION
6,935
MALE POPULATION
6,312
FEMALE POPULATION
109.87
MALES / 100 FEMALES
91.02
FEMALES / 100 MALES
48.8
MEDIAN AGE
2.7
AVG FAMILY SIZE
2.2
AVG HOUSEHOLD SIZE
5,175
LABOR FORCE [ PEOPLE ]
46.0%
PERCENT IN LABOR FORCE
3.4%
UNEMPLOYMENT RATE
Income in New Kingman Butler
Income Overview in New Kingman Butler
Per Capita Income in New Kingman Butler is $24,267, while median incomes of families and households are $51,832 and $42,541 respectively.
| Characteristic | Number | Measure |
| Per Capita Income | 13,247 | $24,267 |
| Median Family Income | 3,271 | $51,832 |
| Mean Family Income | 3,271 | $59,074 |
| Median Household Income | 6,131 | $42,541 |
| Mean Household Income | 6,131 | $51,918 |
| Income Deficit | 3,271 | $11,144 |
| Wage / Income Gap (%) | 13,247 | 19.78% |
| Wage / Income Gap ($) | 13,247 | 80.22¢ per $1 |
| Gini / Inequality Index | 13,247 | 0.41 |
Earnings by Sex in New Kingman Butler
Average Earnings in New Kingman Butler are $30,385, $33,701 for men and $27,036 for women, a difference of 19.8%.
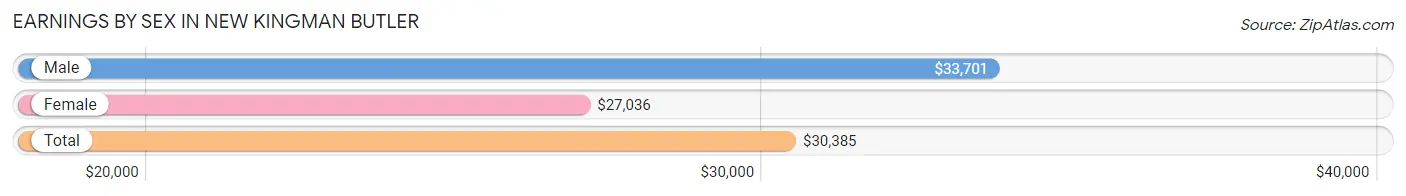
| Sex | Number | Average Earnings |
| Male | 2,985 (53.9%) | $33,701 |
| Female | 2,549 (46.1%) | $27,036 |
| Total | 5,534 (100.0%) | $30,385 |
Earnings by Sex by Income Bracket in New Kingman Butler
The most common earnings brackets in New Kingman Butler are $55,000 to $64,999 for men (303 | 10.2%) and $25,000 to $29,999 for women (343 | 13.5%).
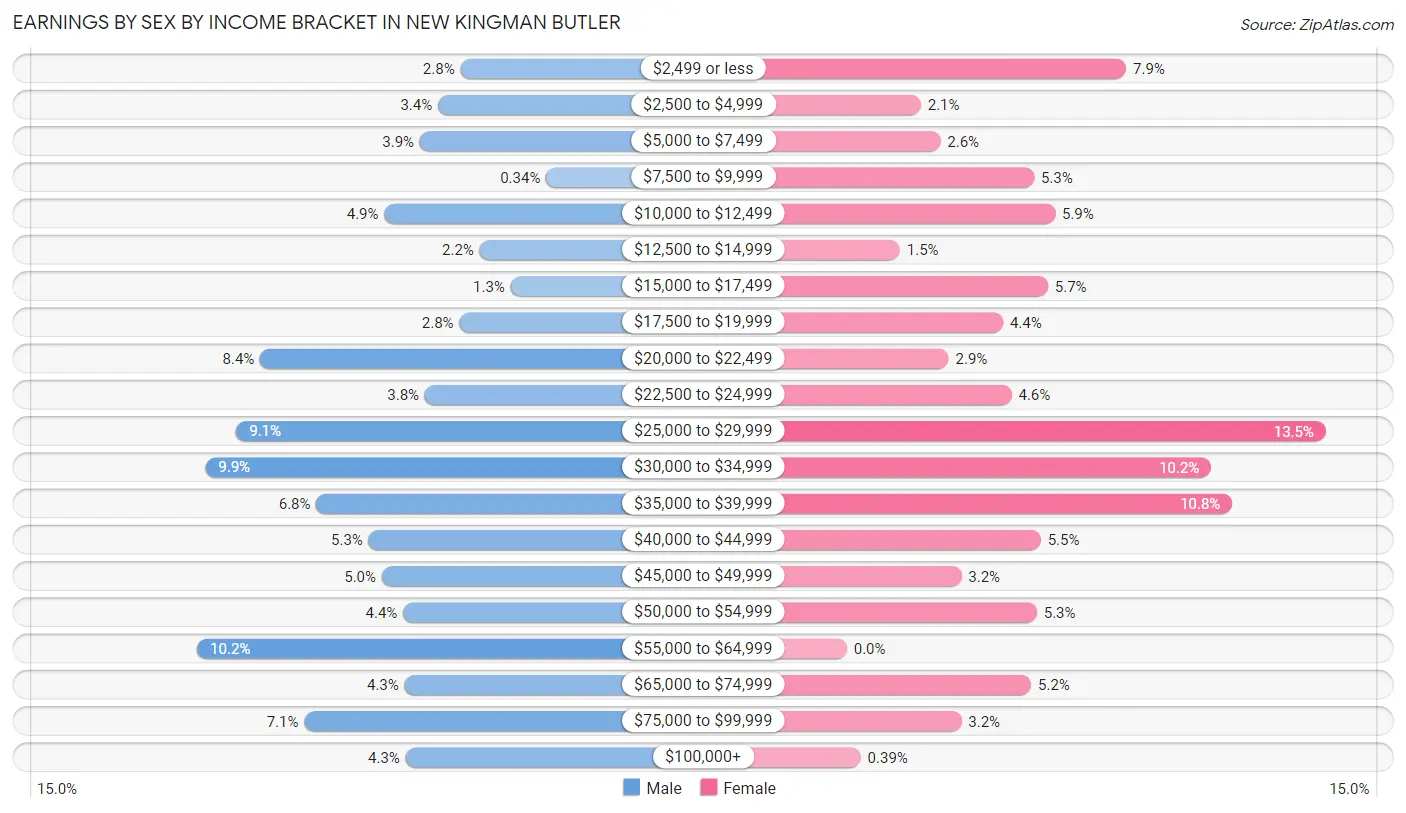
| Income | Male | Female |
| $2,499 or less | 82 (2.8%) | 200 (7.9%) |
| $2,500 to $4,999 | 101 (3.4%) | 53 (2.1%) |
| $5,000 to $7,499 | 116 (3.9%) | 67 (2.6%) |
| $7,500 to $9,999 | 10 (0.3%) | 134 (5.3%) |
| $10,000 to $12,499 | 146 (4.9%) | 149 (5.9%) |
| $12,500 to $14,999 | 66 (2.2%) | 38 (1.5%) |
| $15,000 to $17,499 | 40 (1.3%) | 144 (5.7%) |
| $17,500 to $19,999 | 83 (2.8%) | 112 (4.4%) |
| $20,000 to $22,499 | 250 (8.4%) | 73 (2.9%) |
| $22,500 to $24,999 | 112 (3.7%) | 118 (4.6%) |
| $25,000 to $29,999 | 270 (9.0%) | 343 (13.5%) |
| $30,000 to $34,999 | 296 (9.9%) | 261 (10.2%) |
| $35,000 to $39,999 | 203 (6.8%) | 276 (10.8%) |
| $40,000 to $44,999 | 159 (5.3%) | 139 (5.4%) |
| $45,000 to $49,999 | 148 (5.0%) | 82 (3.2%) |
| $50,000 to $54,999 | 130 (4.4%) | 136 (5.3%) |
| $55,000 to $64,999 | 303 (10.2%) | 0 (0.0%) |
| $65,000 to $74,999 | 129 (4.3%) | 132 (5.2%) |
| $75,000 to $99,999 | 213 (7.1%) | 82 (3.2%) |
| $100,000+ | 128 (4.3%) | 10 (0.4%) |
| Total | 2,985 (100.0%) | 2,549 (100.0%) |
Earnings by Sex by Educational Attainment in New Kingman Butler
Average earnings in New Kingman Butler are $37,443 for men and $26,621 for women, a difference of 28.9%. Men with an educational attainment of bachelor's degree enjoy the highest average annual earnings of $70,046, while those with graduate degree education earn the least with $21,042. Women with an educational attainment of bachelor's degree earn the most with the average annual earnings of $39,567, while those with less than high school education have the smallest earnings of $18,588.
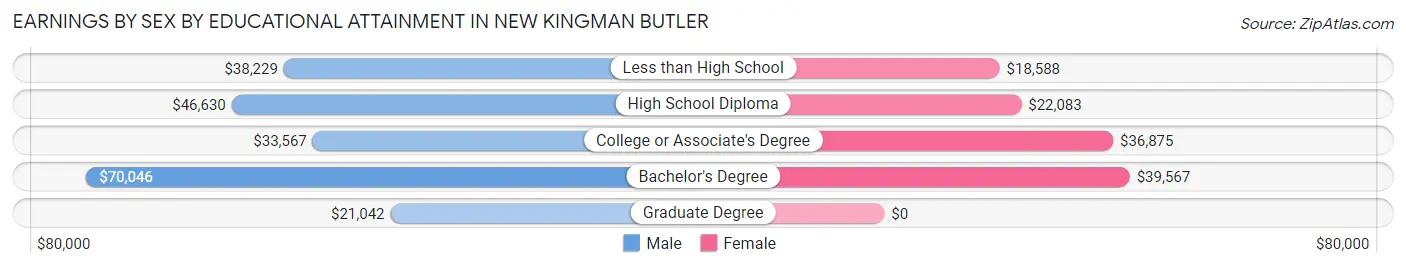
| Educational Attainment | Male Income | Female Income |
| Less than High School | $38,229 | $18,588 |
| High School Diploma | $46,630 | $22,083 |
| College or Associate's Degree | $33,567 | $36,875 |
| Bachelor's Degree | $70,046 | $39,567 |
| Graduate Degree | $21,042 | $0 |
| Total | $37,443 | $26,621 |
Family Income in New Kingman Butler
Family Income Brackets in New Kingman Butler
According to the New Kingman Butler family income data, there are 697 families falling into the $75,000 to $99,999 income range, which is the most common income bracket and makes up 21.3% of all families.
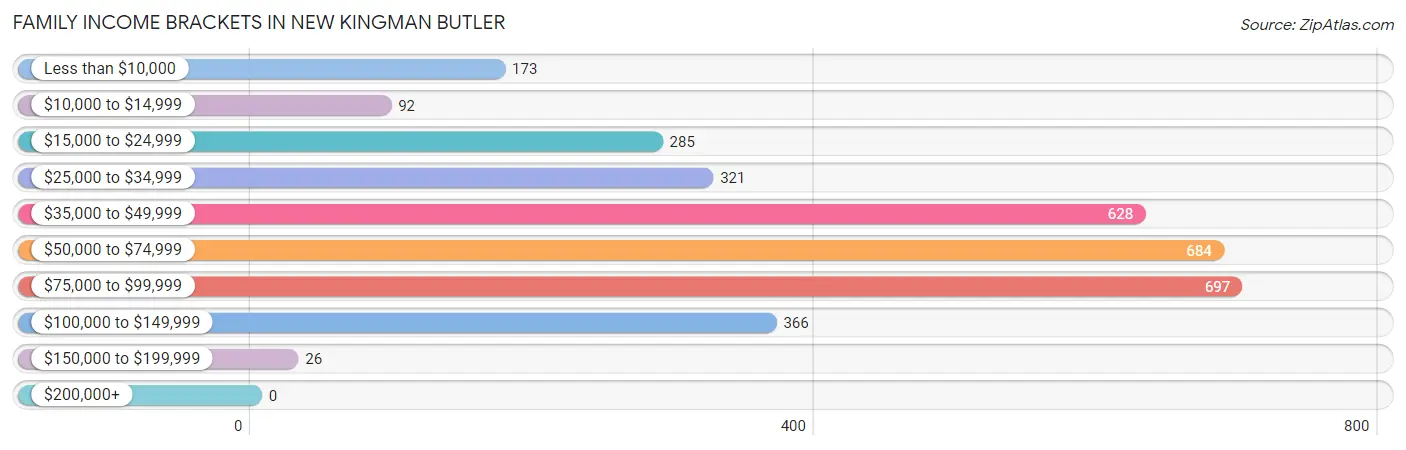
| Income Bracket | # Families | % Families |
| Less than $10,000 | 173 | 5.3% |
| $10,000 to $14,999 | 92 | 2.8% |
| $15,000 to $24,999 | 285 | 8.7% |
| $25,000 to $34,999 | 321 | 9.8% |
| $35,000 to $49,999 | 628 | 19.2% |
| $50,000 to $74,999 | 684 | 20.9% |
| $75,000 to $99,999 | 697 | 21.3% |
| $100,000 to $149,999 | 366 | 11.2% |
| $150,000 to $199,999 | 26 | 0.8% |
| $200,000+ | 0 | 0.0% |
Family Income by Famaliy Size in New Kingman Butler
6-person families (85 | 2.6%) account for the highest median family income in New Kingman Butler with $102,917 per family, while 2-person families (1,951 | 59.7%) have the highest median income of $24,856 per family member.
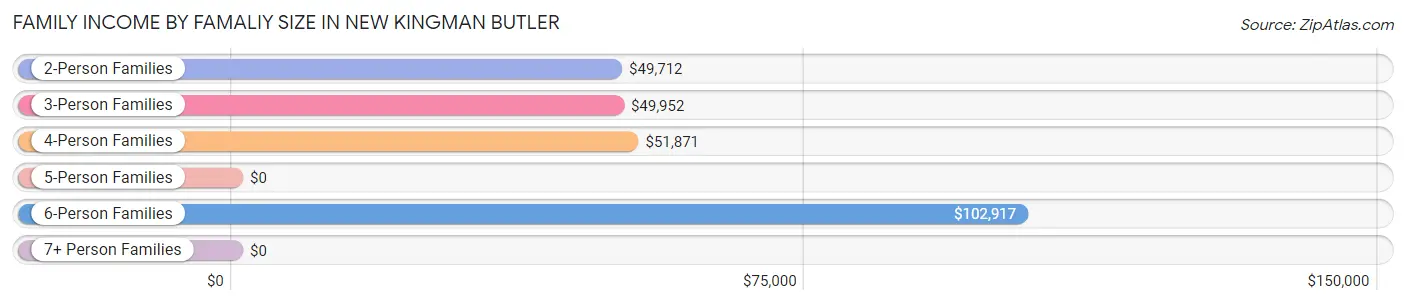
| Income Bracket | # Families | Median Income |
| 2-Person Families | 1,951 (59.7%) | $49,712 |
| 3-Person Families | 722 (22.1%) | $49,952 |
| 4-Person Families | 434 (13.3%) | $51,871 |
| 5-Person Families | 51 (1.6%) | $0 |
| 6-Person Families | 85 (2.6%) | $102,917 |
| 7+ Person Families | 28 (0.9%) | $0 |
| Total | 3,271 (100.0%) | $51,832 |
Family Income by Number of Earners in New Kingman Butler
The median family income in New Kingman Butler is $51,832, with families comprising 3+ earners (132) having the highest median family income of $102,794, while families with no earners (972) have the lowest median family income of $38,929, accounting for 4.0% and 29.7% of families, respectively.
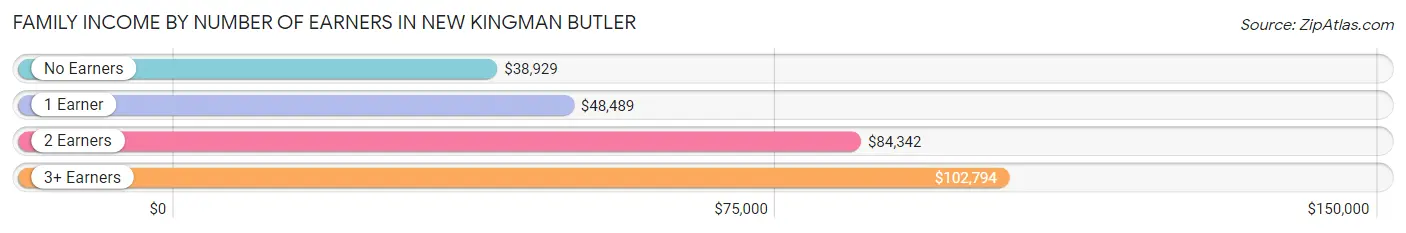
| Number of Earners | # Families | Median Income |
| No Earners | 972 (29.7%) | $38,929 |
| 1 Earner | 1,189 (36.3%) | $48,489 |
| 2 Earners | 978 (29.9%) | $84,342 |
| 3+ Earners | 132 (4.0%) | $102,794 |
| Total | 3,271 (100.0%) | $51,832 |
Household Income in New Kingman Butler
Household Income Brackets in New Kingman Butler
With 1,159 households falling in the category, the $50,000 to $74,999 income range is the most frequent in New Kingman Butler, accounting for 18.9% of all households. In contrast, only 12 households (0.2%) fall into the $200,000+ income bracket, making it the least populous group.
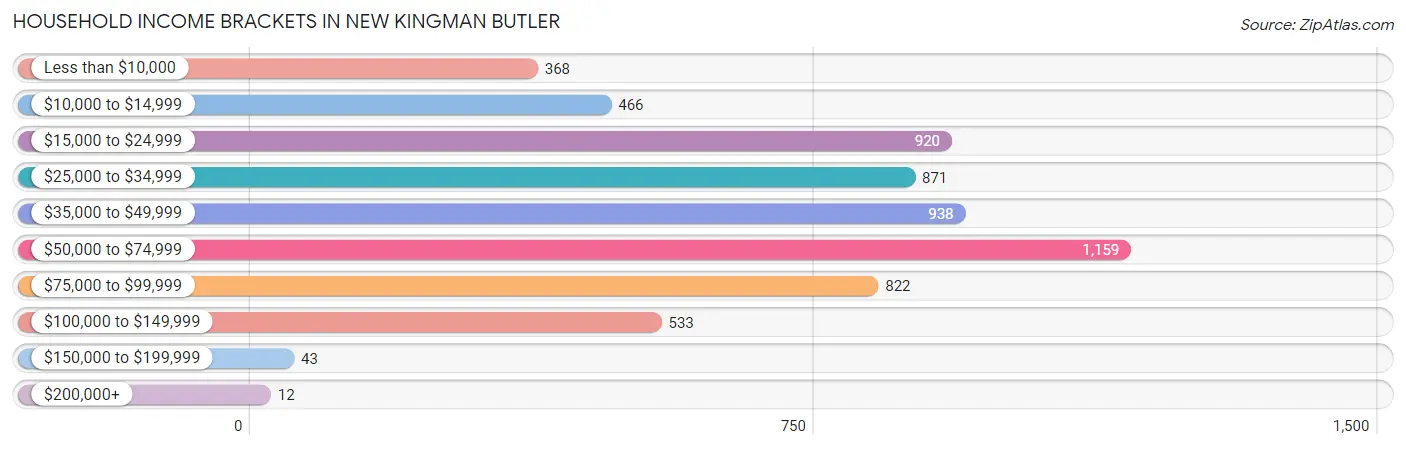
| Income Bracket | # Households | % Households |
| Less than $10,000 | 368 | 6.0% |
| $10,000 to $14,999 | 466 | 7.6% |
| $15,000 to $24,999 | 920 | 15.0% |
| $25,000 to $34,999 | 871 | 14.2% |
| $35,000 to $49,999 | 938 | 15.3% |
| $50,000 to $74,999 | 1,159 | 18.9% |
| $75,000 to $99,999 | 822 | 13.4% |
| $100,000 to $149,999 | 533 | 8.7% |
| $150,000 to $199,999 | 43 | 0.7% |
| $200,000+ | 12 | 0.2% |
Household Income by Householder Age in New Kingman Butler
The median household income in New Kingman Butler is $42,541, with the highest median household income of $51,202 found in the 15 to 24 years age bracket for the primary householder. A total of 315 households (5.1%) fall into this category. Meanwhile, the 65+ years age bracket for the primary householder has the lowest median household income of $35,397, with 2,372 households (38.7%) in this group.
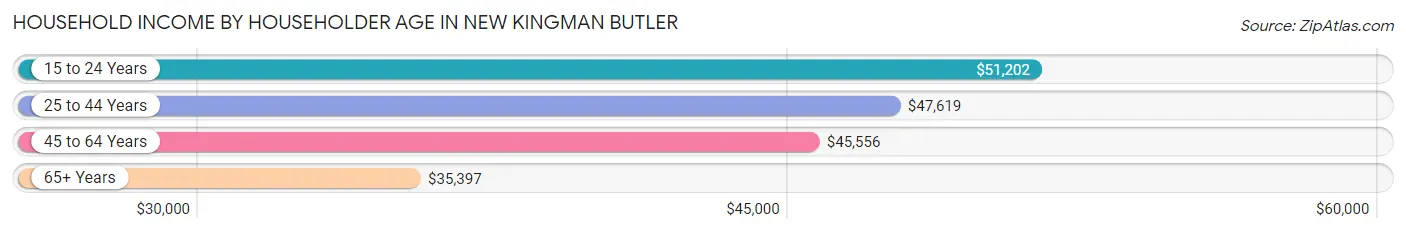
| Income Bracket | # Households | Median Income |
| 15 to 24 Years | 315 (5.1%) | $51,202 |
| 25 to 44 Years | 1,144 (18.7%) | $47,619 |
| 45 to 64 Years | 2,300 (37.5%) | $45,556 |
| 65+ Years | 2,372 (38.7%) | $35,397 |
| Total | 6,131 (100.0%) | $42,541 |
Poverty in New Kingman Butler
Income Below Poverty by Sex and Age in New Kingman Butler
With 17.7% poverty level for males and 26.1% for females among the residents of New Kingman Butler, under 5 year old males and 15 year old females are the most vulnerable to poverty, with 43 males (70.5%) and 27 females (71.1%) in their respective age groups living below the poverty level.
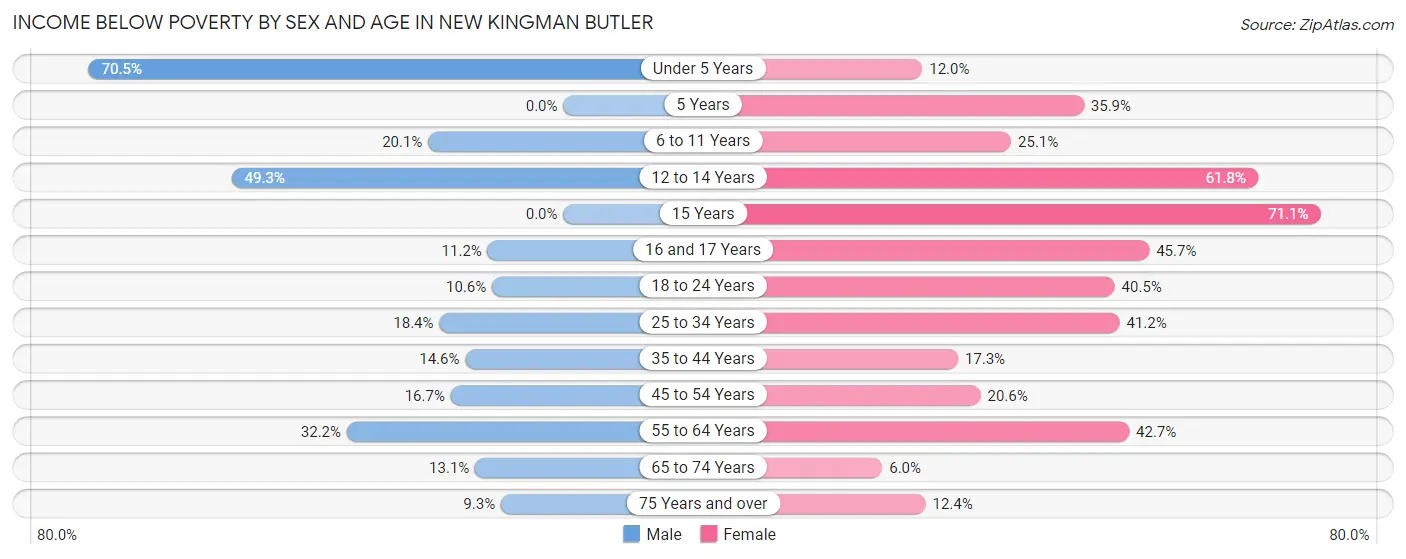
| Age Bracket | Male | Female |
| Under 5 Years | 43 (70.5%) | 39 (12.0%) |
| 5 Years | 0 (0.0%) | 23 (35.9%) |
| 6 to 11 Years | 108 (20.1%) | 46 (25.1%) |
| 12 to 14 Years | 100 (49.3%) | 84 (61.8%) |
| 15 Years | 0 (0.0%) | 27 (71.1%) |
| 16 and 17 Years | 19 (11.2%) | 42 (45.7%) |
| 18 to 24 Years | 71 (10.6%) | 250 (40.5%) |
| 25 to 34 Years | 123 (18.4%) | 240 (41.2%) |
| 35 to 44 Years | 99 (14.6%) | 74 (17.2%) |
| 45 to 54 Years | 154 (16.7%) | 198 (20.6%) |
| 55 to 64 Years | 254 (32.2%) | 468 (42.7%) |
| 65 to 74 Years | 131 (13.1%) | 61 (6.0%) |
| 75 Years and over | 71 (9.3%) | 96 (12.4%) |
| Total | 1,173 (17.7%) | 1,648 (26.1%) |
Income Above Poverty by Sex and Age in New Kingman Butler
According to the poverty statistics in New Kingman Butler, males aged 5 years and females aged 65 to 74 years are the age groups that are most secure financially, with 100.0% of males and 94.0% of females in these age groups living above the poverty line.
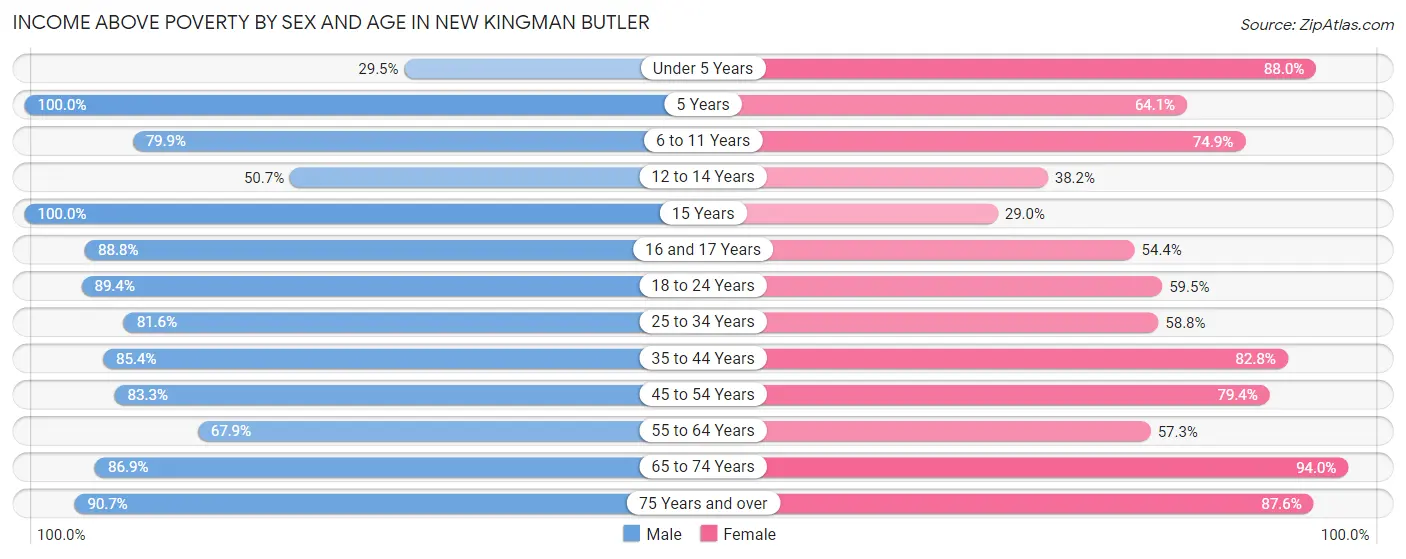
| Age Bracket | Male | Female |
| Under 5 Years | 18 (29.5%) | 287 (88.0%) |
| 5 Years | 10 (100.0%) | 41 (64.1%) |
| 6 to 11 Years | 430 (79.9%) | 137 (74.9%) |
| 12 to 14 Years | 103 (50.7%) | 52 (38.2%) |
| 15 Years | 141 (100.0%) | 11 (28.9%) |
| 16 and 17 Years | 150 (88.8%) | 50 (54.3%) |
| 18 to 24 Years | 600 (89.4%) | 367 (59.5%) |
| 25 to 34 Years | 545 (81.6%) | 342 (58.8%) |
| 35 to 44 Years | 581 (85.4%) | 355 (82.8%) |
| 45 to 54 Years | 767 (83.3%) | 763 (79.4%) |
| 55 to 64 Years | 536 (67.8%) | 629 (57.3%) |
| 65 to 74 Years | 869 (86.9%) | 954 (94.0%) |
| 75 Years and over | 696 (90.7%) | 676 (87.6%) |
| Total | 5,446 (82.3%) | 4,664 (73.9%) |
Income Below Poverty Among Married-Couple Families in New Kingman Butler
The poverty statistics for married-couple families in New Kingman Butler show that 8.5% or 183 of the total 2,161 families live below the poverty line. Families with 3 or 4 children have the highest poverty rate of 56.2%, comprising of 36 families. On the other hand, families with no children have the lowest poverty rate of 4.6%, which includes 67 families.
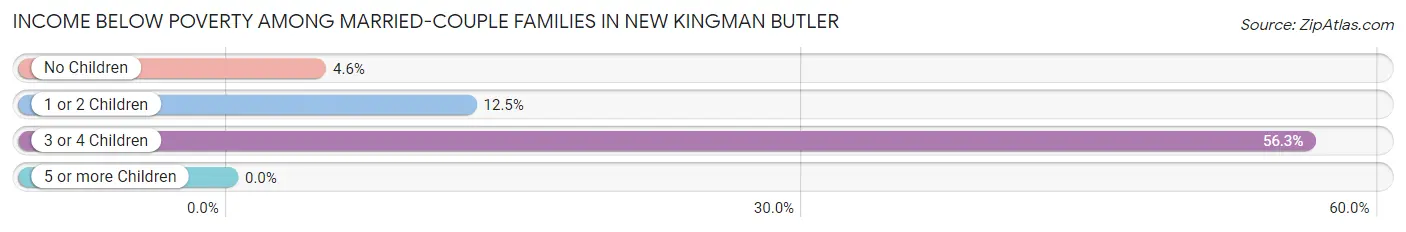
| Children | Above Poverty | Below Poverty |
| No Children | 1,388 (95.4%) | 67 (4.6%) |
| 1 or 2 Children | 562 (87.5%) | 80 (12.5%) |
| 3 or 4 Children | 28 (43.8%) | 36 (56.2%) |
| 5 or more Children | 0 (0.0%) | 0 (0.0%) |
| Total | 1,978 (91.5%) | 183 (8.5%) |
Income Below Poverty Among Single-Parent Households in New Kingman Butler
According to the poverty data in New Kingman Butler, 12.2% or 49 single-father households and 31.5% or 223 single-mother households are living below the poverty line. Among single-father households, those with 3 or 4 children have the highest poverty rate, with 15 households (65.2%) experiencing poverty. Likewise, among single-mother households, those with 3 or 4 children have the highest poverty rate, with 26 households (66.7%) falling below the poverty line.
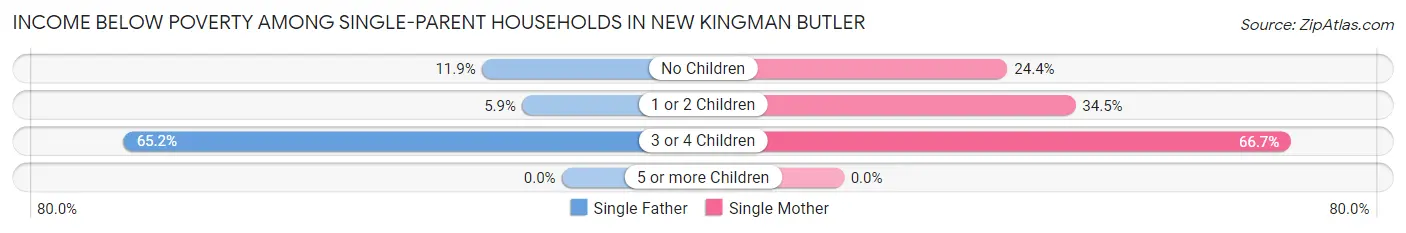
| Children | Single Father | Single Mother |
| No Children | 23 (11.9%) | 82 (24.4%) |
| 1 or 2 Children | 11 (5.9%) | 115 (34.5%) |
| 3 or 4 Children | 15 (65.2%) | 26 (66.7%) |
| 5 or more Children | 0 (0.0%) | 0 (0.0%) |
| Total | 49 (12.2%) | 223 (31.5%) |
Income Below Poverty Among Married-Couple vs Single-Parent Households in New Kingman Butler
The poverty data for New Kingman Butler shows that 183 of the married-couple family households (8.5%) and 272 of the single-parent households (24.5%) are living below the poverty level. Within the married-couple family households, those with 3 or 4 children have the highest poverty rate, with 36 households (56.2%) falling below the poverty line. Among the single-parent households, those with 3 or 4 children have the highest poverty rate, with 41 household (66.1%) living below poverty.
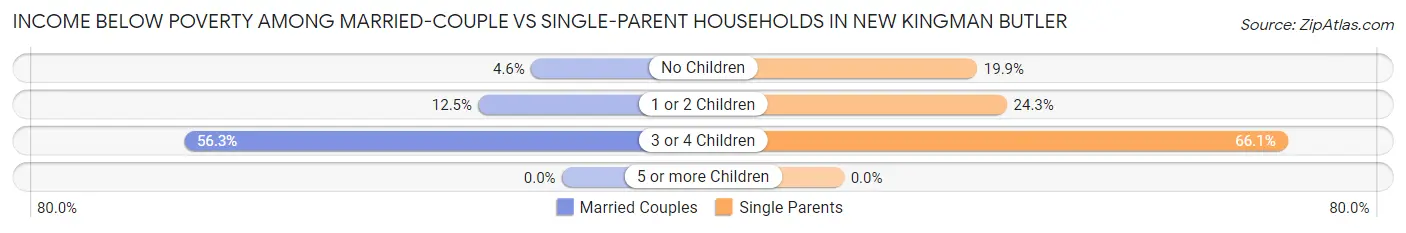
| Children | Married-Couple Families | Single-Parent Households |
| No Children | 67 (4.6%) | 105 (19.9%) |
| 1 or 2 Children | 80 (12.5%) | 126 (24.3%) |
| 3 or 4 Children | 36 (56.2%) | 41 (66.1%) |
| 5 or more Children | 0 (0.0%) | 0 (0.0%) |
| Total | 183 (8.5%) | 272 (24.5%) |
Race in New Kingman Butler
The most populous races in New Kingman Butler are White / Caucasian (11,262 | 85.0%), Hispanic or Latino (2,216 | 16.7%), and Two or more Races (1,195 | 9.0%).
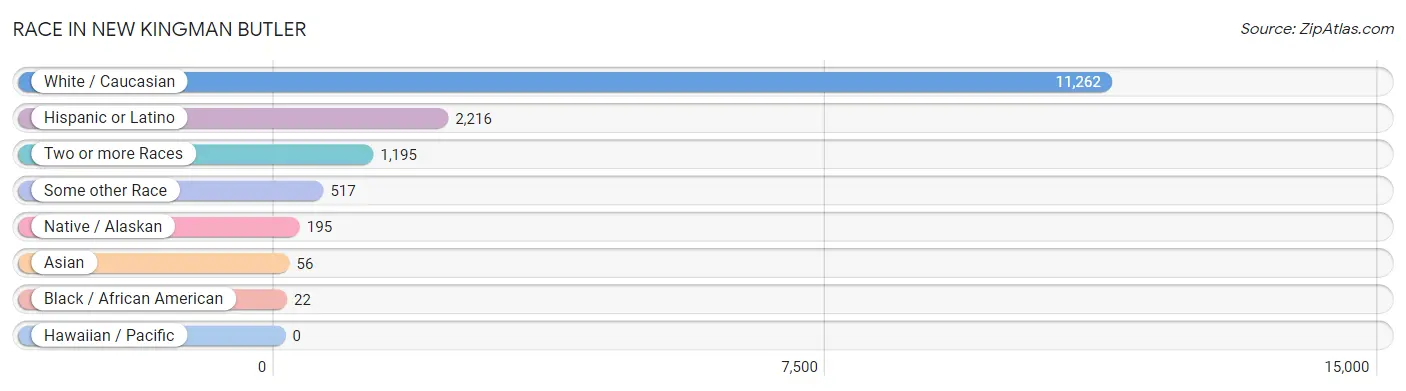
| Race | # Population | % Population |
| Asian | 56 | 0.4% |
| Black / African American | 22 | 0.2% |
| Hawaiian / Pacific | 0 | 0.0% |
| Hispanic or Latino | 2,216 | 16.7% |
| Native / Alaskan | 195 | 1.5% |
| White / Caucasian | 11,262 | 85.0% |
| Two or more Races | 1,195 | 9.0% |
| Some other Race | 517 | 3.9% |
| Total | 13,247 | 100.0% |
Ancestry in New Kingman Butler
The most populous ancestries reported in New Kingman Butler are German (2,145 | 16.2%), Mexican (2,028 | 15.3%), Irish (1,752 | 13.2%), English (1,102 | 8.3%), and American (756 | 5.7%), together accounting for 58.8% of all New Kingman Butler residents.
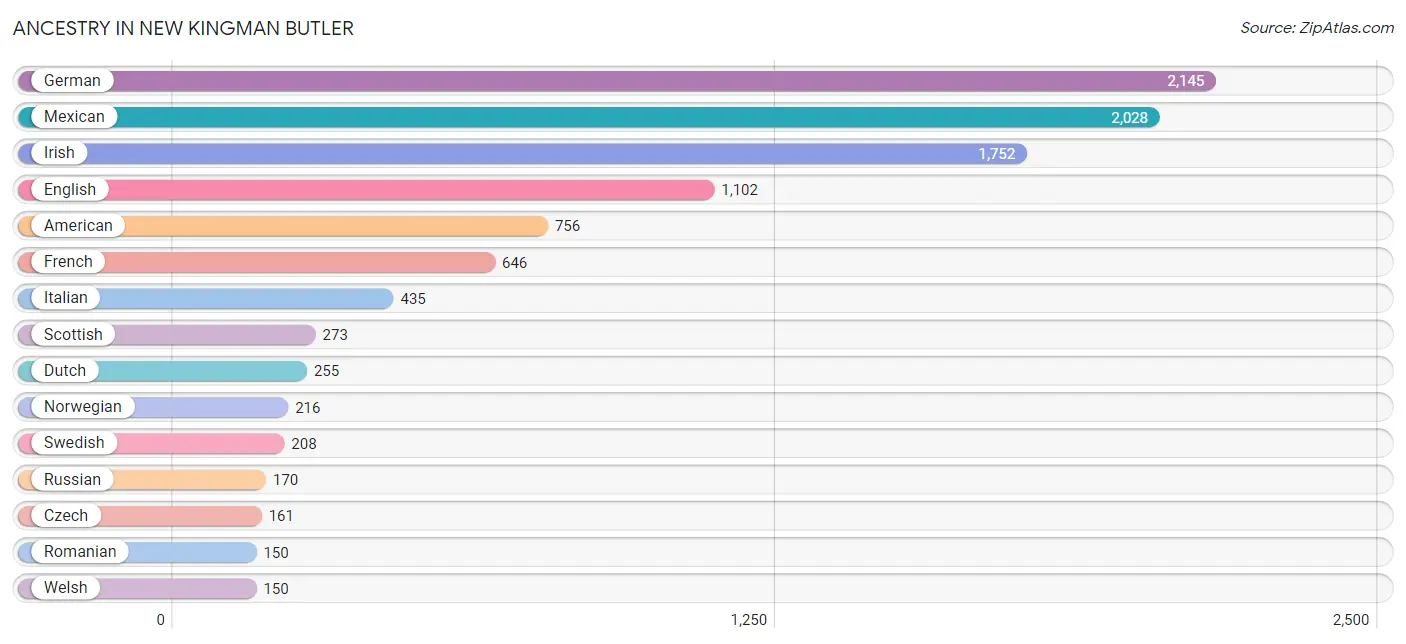
| Ancestry | # Population | % Population |
| American | 756 | 5.7% |
| Apache | 54 | 0.4% |
| Arab | 17 | 0.1% |
| Argentinean | 78 | 0.6% |
| Basque | 15 | 0.1% |
| Bhutanese | 8 | 0.1% |
| Blackfeet | 15 | 0.1% |
| British | 8 | 0.1% |
| Burmese | 75 | 0.6% |
| Canadian | 42 | 0.3% |
| Central American | 4 | 0.0% |
| Central American Indian | 8 | 0.1% |
| Cherokee | 9 | 0.1% |
| Chippewa | 11 | 0.1% |
| Choctaw | 43 | 0.3% |
| Czech | 161 | 1.2% |
| Czechoslovakian | 8 | 0.1% |
| Danish | 105 | 0.8% |
| Dutch | 255 | 1.9% |
| English | 1,102 | 8.3% |
| European | 62 | 0.5% |
| French | 646 | 4.9% |
| French Canadian | 37 | 0.3% |
| German | 2,145 | 16.2% |
| Greek | 76 | 0.6% |
| Honduran | 4 | 0.0% |
| Hungarian | 50 | 0.4% |
| Indian (Asian) | 26 | 0.2% |
| Irish | 1,752 | 13.2% |
| Italian | 435 | 3.3% |
| Korean | 32 | 0.2% |
| Lithuanian | 14 | 0.1% |
| Mexican | 2,028 | 15.3% |
| Mexican American Indian | 8 | 0.1% |
| Native Hawaiian | 32 | 0.2% |
| Navajo | 108 | 0.8% |
| Norwegian | 216 | 1.6% |
| Pima | 69 | 0.5% |
| Polish | 123 | 0.9% |
| Puerto Rican | 11 | 0.1% |
| Romanian | 150 | 1.1% |
| Russian | 170 | 1.3% |
| Samoan | 17 | 0.1% |
| Scandinavian | 23 | 0.2% |
| Scotch-Irish | 115 | 0.9% |
| Scottish | 273 | 2.1% |
| Serbian | 14 | 0.1% |
| Sioux | 11 | 0.1% |
| Slavic | 27 | 0.2% |
| South American | 78 | 0.6% |
| Spaniard | 40 | 0.3% |
| Spanish | 34 | 0.3% |
| Swedish | 208 | 1.6% |
| Turkish | 8 | 0.1% |
| Welsh | 150 | 1.1% |
| Yaqui | 65 | 0.5% |
| Yugoslavian | 12 | 0.1% | View All 57 Rows |
Immigrants in New Kingman Butler
The most numerous immigrant groups reported in New Kingman Butler came from Central America (851 | 6.4%), Latin America (851 | 6.4%), Mexico (847 | 6.4%), Europe (61 | 0.5%), and Eastern Europe (38 | 0.3%), together accounting for 20.0% of all New Kingman Butler residents.

| Immigration Origin | # Population | % Population |
| Asia | 34 | 0.3% |
| Canada | 15 | 0.1% |
| Central America | 851 | 6.4% |
| China | 26 | 0.2% |
| Eastern Asia | 26 | 0.2% |
| Eastern Europe | 38 | 0.3% |
| England | 14 | 0.1% |
| Europe | 61 | 0.5% |
| Germany | 9 | 0.1% |
| Honduras | 4 | 0.0% |
| Latin America | 851 | 6.4% |
| Mexico | 847 | 6.4% |
| Northern Europe | 14 | 0.1% |
| Taiwan | 26 | 0.2% |
| Turkey | 8 | 0.1% |
| Ukraine | 38 | 0.3% |
| Western Asia | 8 | 0.1% |
| Western Europe | 9 | 0.1% | View All 18 Rows |
Sex and Age in New Kingman Butler
Sex and Age in New Kingman Butler
The most populous age groups in New Kingman Butler are 65 to 69 Years (621 | 8.9%) for men and 60 to 64 Years (670 | 10.6%) for women.
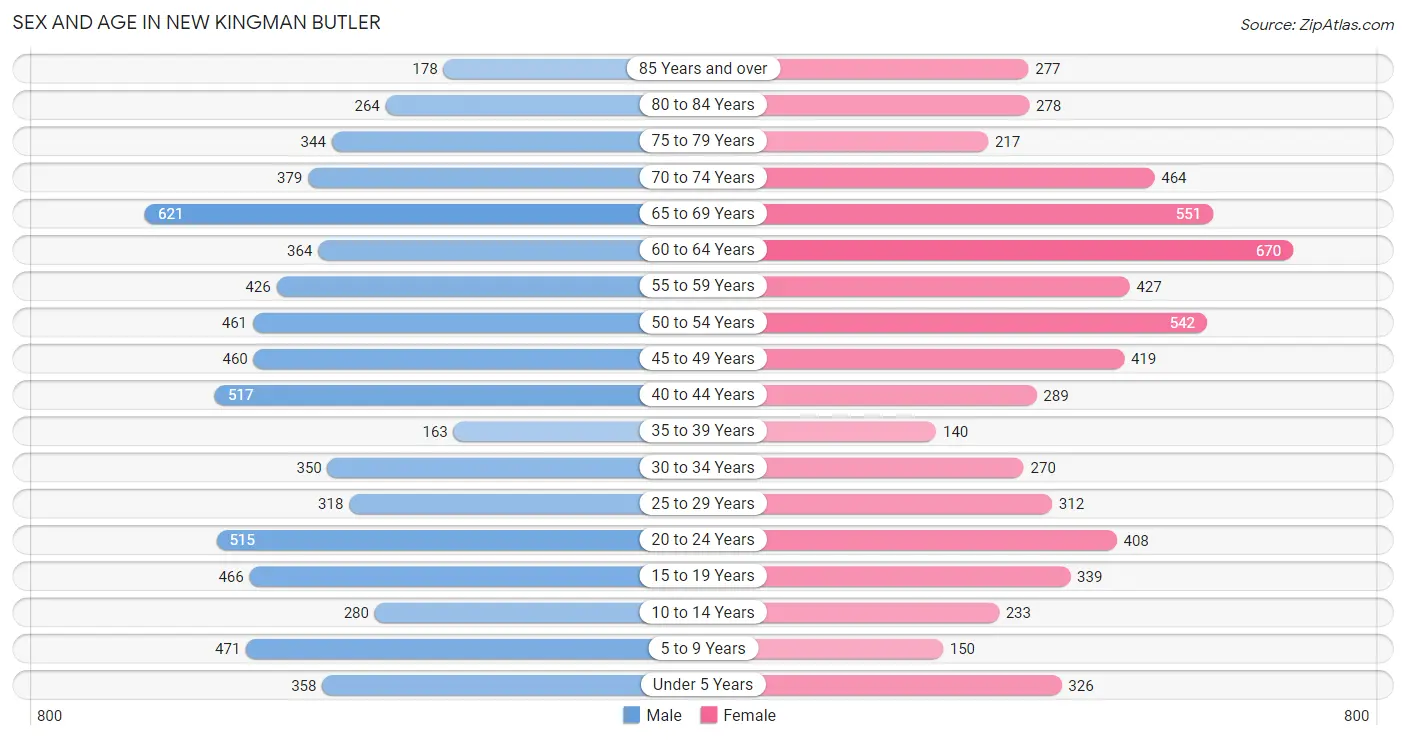
| Age Bracket | Male | Female |
| Under 5 Years | 358 (5.2%) | 326 (5.2%) |
| 5 to 9 Years | 471 (6.8%) | 150 (2.4%) |
| 10 to 14 Years | 280 (4.0%) | 233 (3.7%) |
| 15 to 19 Years | 466 (6.7%) | 339 (5.4%) |
| 20 to 24 Years | 515 (7.4%) | 408 (6.5%) |
| 25 to 29 Years | 318 (4.6%) | 312 (4.9%) |
| 30 to 34 Years | 350 (5.1%) | 270 (4.3%) |
| 35 to 39 Years | 163 (2.4%) | 140 (2.2%) |
| 40 to 44 Years | 517 (7.4%) | 289 (4.6%) |
| 45 to 49 Years | 460 (6.6%) | 419 (6.6%) |
| 50 to 54 Years | 461 (6.7%) | 542 (8.6%) |
| 55 to 59 Years | 426 (6.1%) | 427 (6.8%) |
| 60 to 64 Years | 364 (5.2%) | 670 (10.6%) |
| 65 to 69 Years | 621 (8.9%) | 551 (8.7%) |
| 70 to 74 Years | 379 (5.5%) | 464 (7.3%) |
| 75 to 79 Years | 344 (5.0%) | 217 (3.4%) |
| 80 to 84 Years | 264 (3.8%) | 278 (4.4%) |
| 85 Years and over | 178 (2.6%) | 277 (4.4%) |
| Total | 6,935 (100.0%) | 6,312 (100.0%) |
Families and Households in New Kingman Butler
Median Family Size in New Kingman Butler
The median family size in New Kingman Butler is 2.67 persons per family, with married-couple families (2,161 | 66.1%) accounting for the largest median family size of 2.73 persons per family. On the other hand, single male/father families (402 | 12.3%) represent the smallest median family size with 2.45 persons per family.
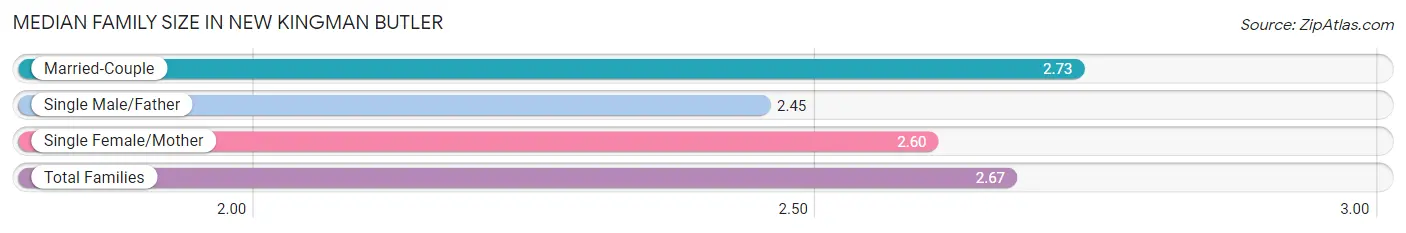
| Family Type | # Families | Family Size |
| Married-Couple | 2,161 (66.1%) | 2.73 |
| Single Male/Father | 402 (12.3%) | 2.45 |
| Single Female/Mother | 708 (21.6%) | 2.60 |
| Total Families | 3,271 (100.0%) | 2.67 |
Median Household Size in New Kingman Butler
The median household size in New Kingman Butler is 2.16 persons per household, with single female/mother households (708 | 11.6%) accounting for the largest median household size of 2.91 persons per household. non-family households (2,860 | 46.7%) represent the smallest median household size with 1.43 persons per household.
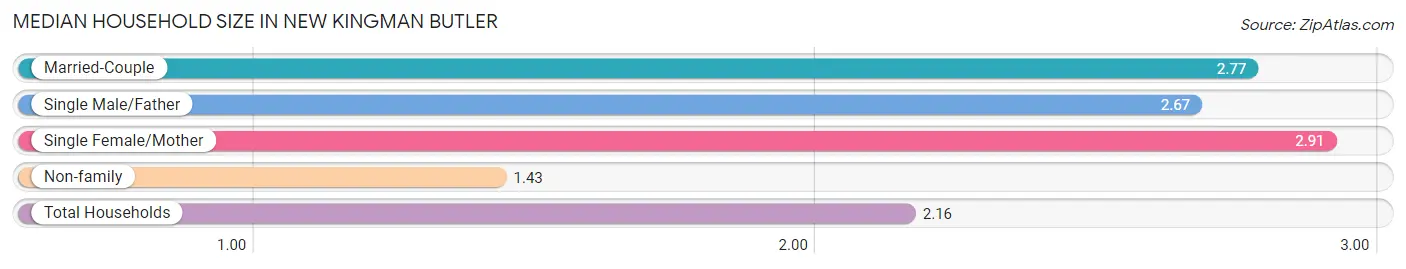
| Household Type | # Households | Household Size |
| Married-Couple | 2,161 (35.2%) | 2.77 |
| Single Male/Father | 402 (6.6%) | 2.67 |
| Single Female/Mother | 708 (11.6%) | 2.91 |
| Non-family | 2,860 (46.7%) | 1.43 |
| Total Households | 6,131 (100.0%) | 2.16 |
Household Size by Marriage Status in New Kingman Butler
Out of a total of 6,131 households in New Kingman Butler, 3,271 (53.3%) are family households, while 2,860 (46.7%) are nonfamily households. The most numerous type of family households are 2-person households, comprising 1,834, and the most common type of nonfamily households are 1-person households, comprising 1,993.
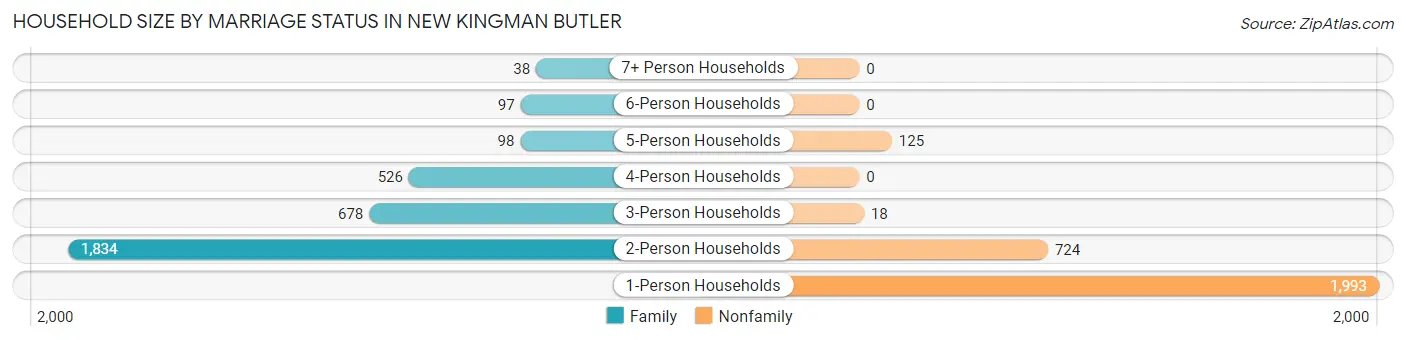
| Household Size | Family Households | Nonfamily Households |
| 1-Person Households | - | 1,993 (32.5%) |
| 2-Person Households | 1,834 (29.9%) | 724 (11.8%) |
| 3-Person Households | 678 (11.1%) | 18 (0.3%) |
| 4-Person Households | 526 (8.6%) | 0 (0.0%) |
| 5-Person Households | 98 (1.6%) | 125 (2.0%) |
| 6-Person Households | 97 (1.6%) | 0 (0.0%) |
| 7+ Person Households | 38 (0.6%) | 0 (0.0%) |
| Total | 3,271 (53.3%) | 2,860 (46.7%) |
Female Fertility in New Kingman Butler
Fertility by Age in New Kingman Butler
Average fertility rate in New Kingman Butler is 62.0 births per 1,000 women. Women in the age bracket of 20 to 34 years have the highest fertility rate with 135.0 births per 1,000 women. Women in the age bracket of 20 to 34 years acount for 95.7% of all women with births.
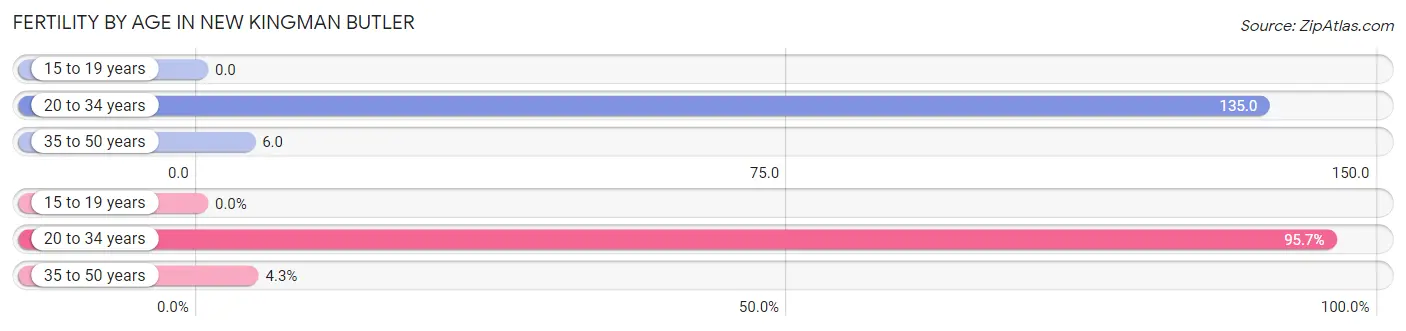
| Age Bracket | Women with Births | Births / 1,000 Women |
| 15 to 19 years | 0 (0.0%) | 0.0 |
| 20 to 34 years | 134 (95.7%) | 135.0 |
| 35 to 50 years | 6 (4.3%) | 6.0 |
| Total | 140 (100.0%) | 62.0 |
Fertility by Age by Marriage Status in New Kingman Butler
62.9% of women with births (140) in New Kingman Butler are married. The highest percentage of unmarried women with births falls into 20 to 34 years age bracket with 38.8% of them unmarried at the time of birth, while the lowest percentage of unmarried women with births belong to 35 to 50 years age bracket with 0.0% of them unmarried.
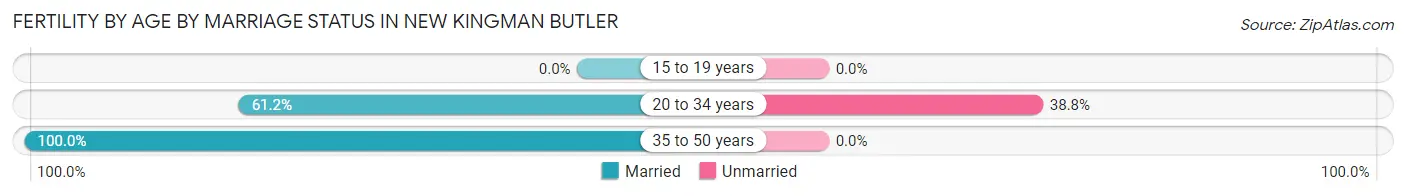
| Age Bracket | Married | Unmarried |
| 15 to 19 years | 0 (0.0%) | 0 (0.0%) |
| 20 to 34 years | 82 (61.2%) | 52 (38.8%) |
| 35 to 50 years | 6 (100.0%) | 0 (0.0%) |
| Total | 88 (62.9%) | 52 (37.1%) |
Fertility by Education in New Kingman Butler
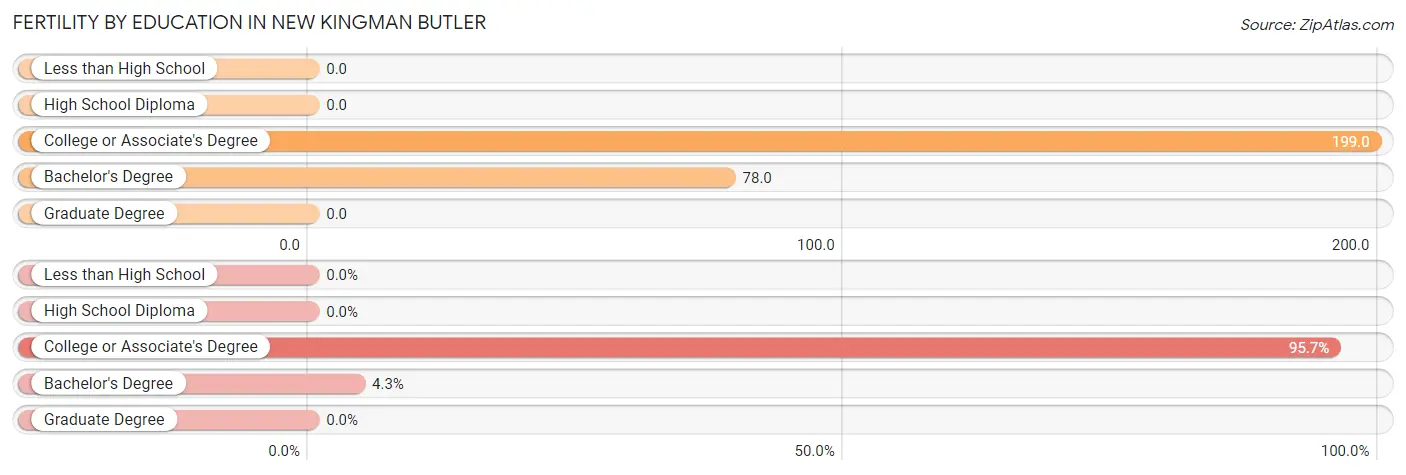
| Educational Attainment | Women with Births | Births / 1,000 Women |
| Less than High School | 0 (0.0%) | 0.0 |
| High School Diploma | 0 (0.0%) | 0.0 |
| College or Associate's Degree | 134 (95.7%) | 199.0 |
| Bachelor's Degree | 6 (4.3%) | 78.0 |
| Graduate Degree | 0 (0.0%) | 0.0 |
| Total | 140 (100.0%) | 62.0 |
Fertility by Education by Marriage Status in New Kingman Butler
37.1% of women with births in New Kingman Butler are unmarried. Women with the educational attainment of bachelor's degree are most likely to be married with 100.0% of them married at childbirth, while women with the educational attainment of college or associate's degree are least likely to be married with 38.8% of them unmarried at childbirth.
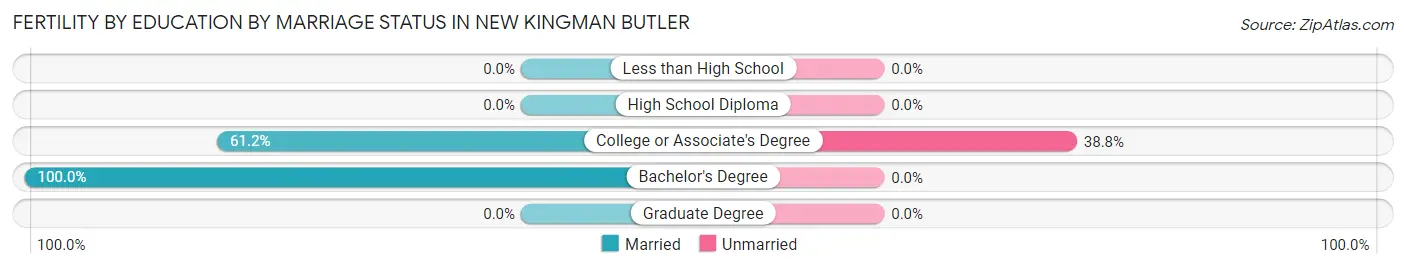
| Educational Attainment | Married | Unmarried |
| Less than High School | 0 (0.0%) | 0 (0.0%) |
| High School Diploma | 0 (0.0%) | 0 (0.0%) |
| College or Associate's Degree | 82 (61.2%) | 52 (38.8%) |
| Bachelor's Degree | 6 (100.0%) | 0 (0.0%) |
| Graduate Degree | 0 (0.0%) | 0 (0.0%) |
| Total | 88 (62.9%) | 52 (37.1%) |
Employment Characteristics in New Kingman Butler
Employment by Class of Employer in New Kingman Butler
Among the 4,935 employed individuals in New Kingman Butler, private company employees (3,625 | 73.5%), local government employees (344 | 7.0%), and not-for-profit organizations (337 | 6.8%) make up the most common classes of employment.
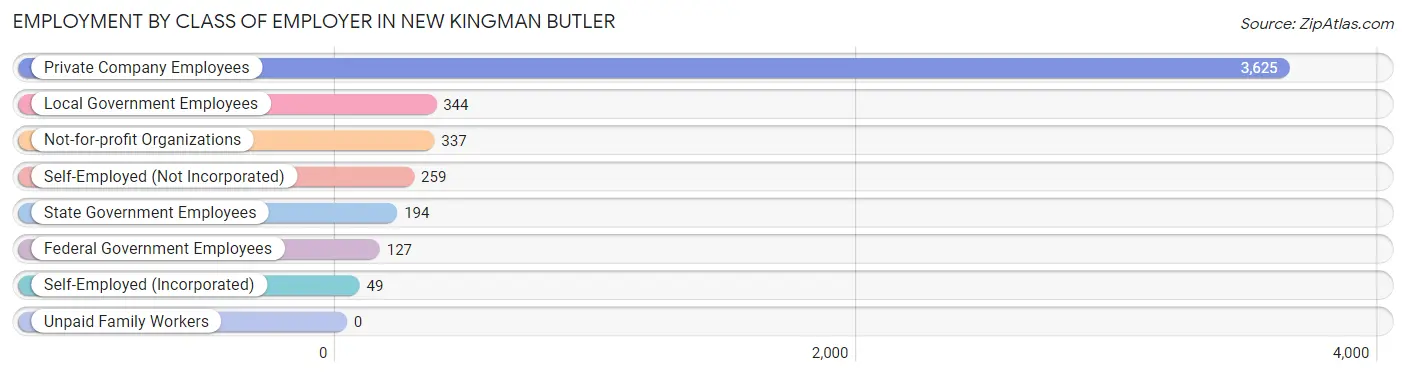
| Employer Class | # Employees | % Employees |
| Private Company Employees | 3,625 | 73.5% |
| Self-Employed (Incorporated) | 49 | 1.0% |
| Self-Employed (Not Incorporated) | 259 | 5.2% |
| Not-for-profit Organizations | 337 | 6.8% |
| Local Government Employees | 344 | 7.0% |
| State Government Employees | 194 | 3.9% |
| Federal Government Employees | 127 | 2.6% |
| Unpaid Family Workers | 0 | 0.0% |
| Total | 4,935 | 100.0% |
Employment Status by Age in New Kingman Butler
According to the labor force statistics for New Kingman Butler, out of the total population over 16 years of age (11,250), 46.0% or 5,175 individuals are in the labor force, with 3.4% or 176 of them unemployed. The age group with the highest labor force participation rate is 35 to 44 years, with 80.5% or 893 individuals in the labor force. Within the labor force, the 16 to 19 years age range has the highest percentage of unemployed individuals, with 18.9% or 24 of them being unemployed.
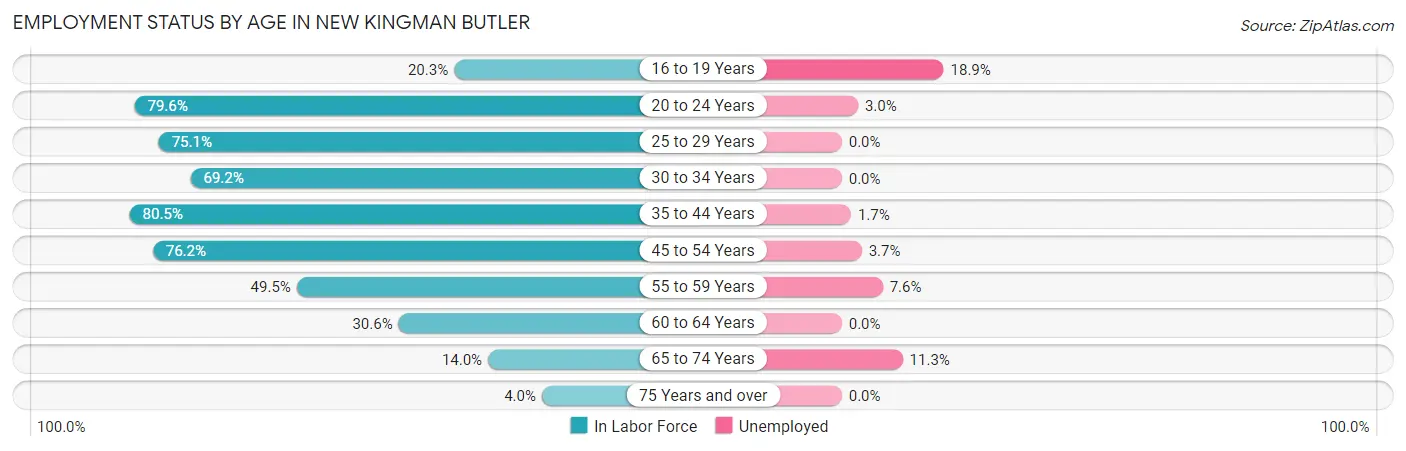
| Age Bracket | In Labor Force | Unemployed |
| 16 to 19 Years | 127 (20.3%) | 24 (18.9%) |
| 20 to 24 Years | 735 (79.6%) | 22 (3.0%) |
| 25 to 29 Years | 473 (75.1%) | 0 (0.0%) |
| 30 to 34 Years | 429 (69.2%) | 0 (0.0%) |
| 35 to 44 Years | 893 (80.5%) | 15 (1.7%) |
| 45 to 54 Years | 1,434 (76.2%) | 53 (3.7%) |
| 55 to 59 Years | 422 (49.5%) | 32 (7.6%) |
| 60 to 64 Years | 316 (30.6%) | 0 (0.0%) |
| 65 to 74 Years | 282 (14.0%) | 32 (11.3%) |
| 75 Years and over | 62 (4.0%) | 0 (0.0%) |
| Total | 5,175 (46.0%) | 176 (3.4%) |
Employment Status by Educational Attainment in New Kingman Butler
According to labor force statistics for New Kingman Butler, 64.8% of individuals (3,971) out of the total population between 25 and 64 years of age (6,128) are in the labor force, with 2.5% or 99 of them being unemployed. The group with the highest labor force participation rate are those with the educational attainment of less than high school, with 65.5% or 763 individuals in the labor force. Within the labor force, individuals with college / associate degree education have the highest percentage of unemployment, with 6.0% or 90 of them being unemployed.
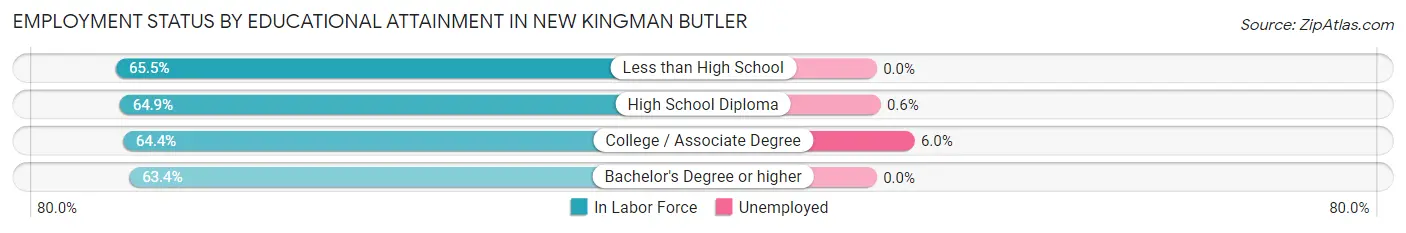
| Educational Attainment | In Labor Force | Unemployed |
| Less than High School | 763 (65.5%) | 0 (0.0%) |
| High School Diploma | 1,509 (64.9%) | 14 (0.6%) |
| College / Associate Degree | 1,507 (64.4%) | 140 (6.0%) |
| Bachelor's Degree or higher | 189 (63.4%) | 0 (0.0%) |
| Total | 3,971 (64.8%) | 153 (2.5%) |
Employment Occupations by Sex in New Kingman Butler
Management, Business, Science and Arts Occupations
The most common Management, Business, Science and Arts occupations in New Kingman Butler are Community & Social Service (524 | 10.5%), Management (308 | 6.2%), Education Instruction & Library (283 | 5.7%), Health Diagnosing & Treating (185 | 3.7%), and Arts, Media & Entertainment (124 | 2.5%).
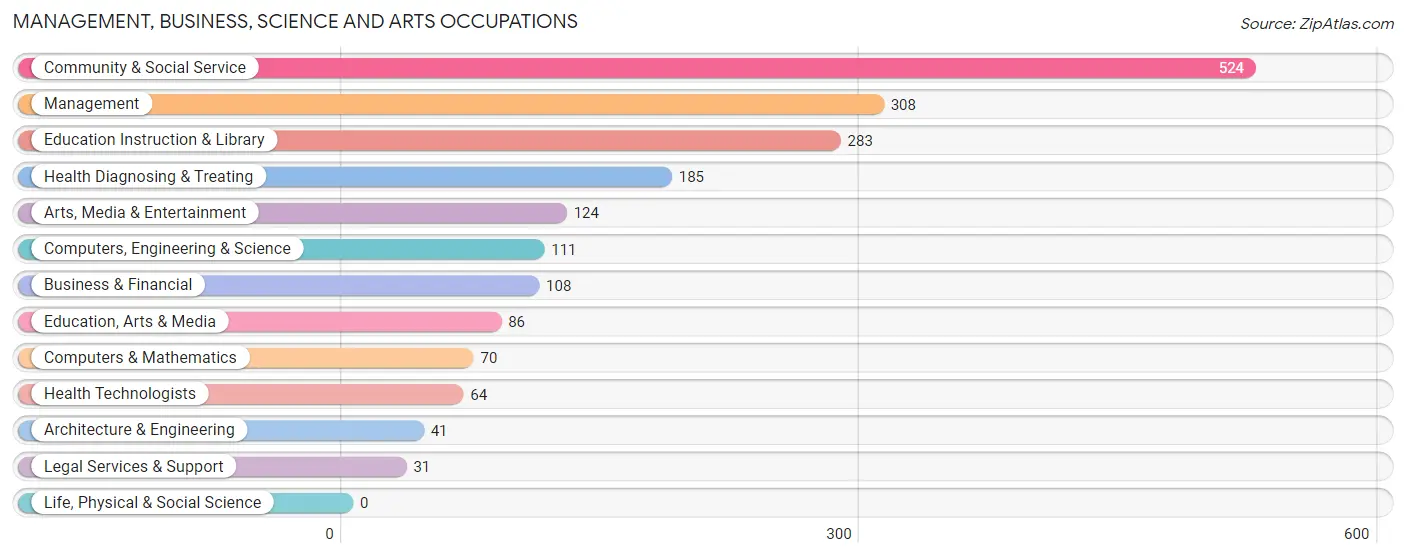
Management, Business, Science and Arts Occupations by Sex
Within the Management, Business, Science and Arts occupations in New Kingman Butler, the most male-oriented occupations are Computers, Engineering & Science (100.0%), Computers & Mathematics (100.0%), and Architecture & Engineering (100.0%), while the most female-oriented occupations are Legal Services & Support (100.0%), Arts, Media & Entertainment (100.0%), and Health Technologists (92.2%).
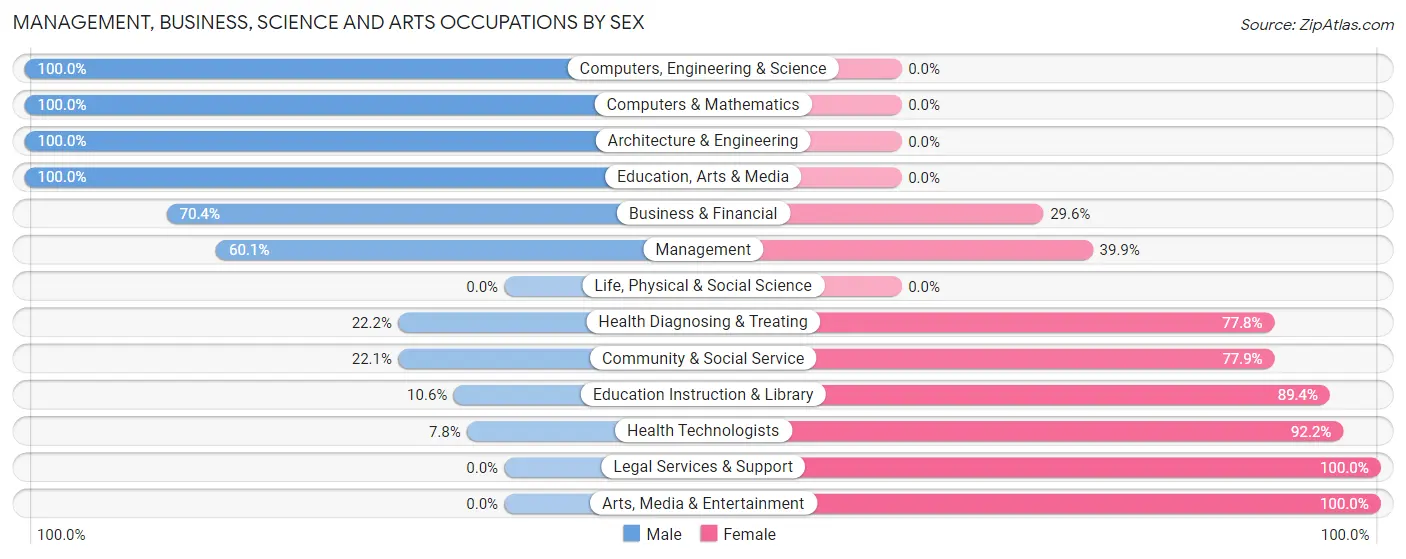
| Occupation | Male | Female |
| Management | 185 (60.1%) | 123 (39.9%) |
| Business & Financial | 76 (70.4%) | 32 (29.6%) |
| Computers, Engineering & Science | 111 (100.0%) | 0 (0.0%) |
| Computers & Mathematics | 70 (100.0%) | 0 (0.0%) |
| Architecture & Engineering | 41 (100.0%) | 0 (0.0%) |
| Life, Physical & Social Science | 0 (0.0%) | 0 (0.0%) |
| Community & Social Service | 116 (22.1%) | 408 (77.9%) |
| Education, Arts & Media | 86 (100.0%) | 0 (0.0%) |
| Legal Services & Support | 0 (0.0%) | 31 (100.0%) |
| Education Instruction & Library | 30 (10.6%) | 253 (89.4%) |
| Arts, Media & Entertainment | 0 (0.0%) | 124 (100.0%) |
| Health Diagnosing & Treating | 41 (22.2%) | 144 (77.8%) |
| Health Technologists | 5 (7.8%) | 59 (92.2%) |
| Total (Category) | 529 (42.8%) | 707 (57.2%) |
| Total (Overall) | 2,700 (54.0%) | 2,297 (46.0%) |
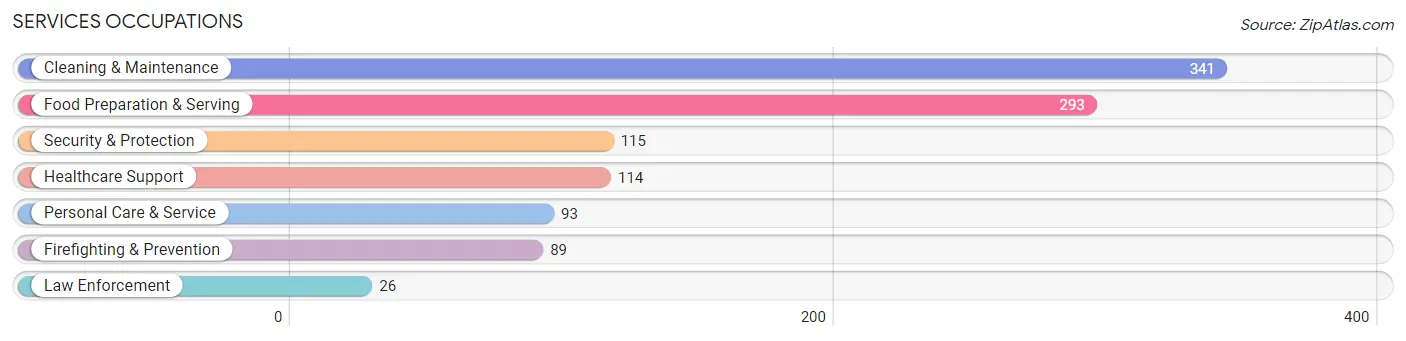
Services Occupations
The most common Services occupations in New Kingman Butler are Cleaning & Maintenance (341 | 6.8%), Food Preparation & Serving (293 | 5.9%), Security & Protection (115 | 2.3%), Healthcare Support (114 | 2.3%), and Personal Care & Service (93 | 1.9%).
Services Occupations by Sex
Within the Services occupations in New Kingman Butler, the most male-oriented occupations are Law Enforcement (100.0%), Security & Protection (87.8%), and Firefighting & Prevention (84.3%), while the most female-oriented occupations are Healthcare Support (100.0%), Food Preparation & Serving (63.8%), and Personal Care & Service (43.0%).
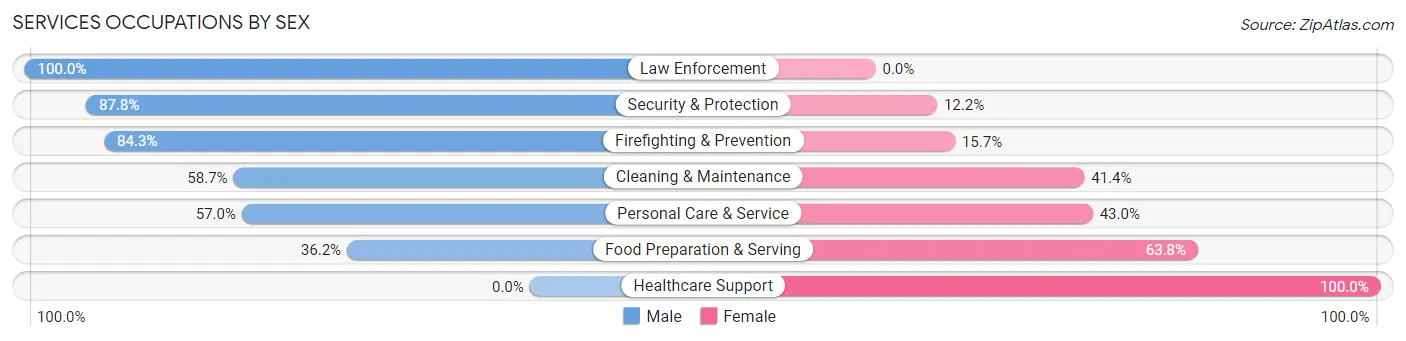
| Occupation | Male | Female |
| Healthcare Support | 0 (0.0%) | 114 (100.0%) |
| Security & Protection | 101 (87.8%) | 14 (12.2%) |
| Firefighting & Prevention | 75 (84.3%) | 14 (15.7%) |
| Law Enforcement | 26 (100.0%) | 0 (0.0%) |
| Food Preparation & Serving | 106 (36.2%) | 187 (63.8%) |
| Cleaning & Maintenance | 200 (58.7%) | 141 (41.3%) |
| Personal Care & Service | 53 (57.0%) | 40 (43.0%) |
| Total (Category) | 460 (48.1%) | 496 (51.9%) |
| Total (Overall) | 2,700 (54.0%) | 2,297 (46.0%) |
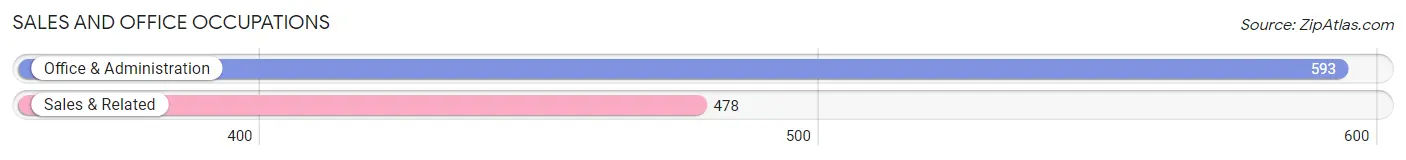
Sales and Office Occupations
The most common Sales and Office occupations in New Kingman Butler are Office & Administration (593 | 11.9%), and Sales & Related (478 | 9.6%).
Sales and Office Occupations by Sex
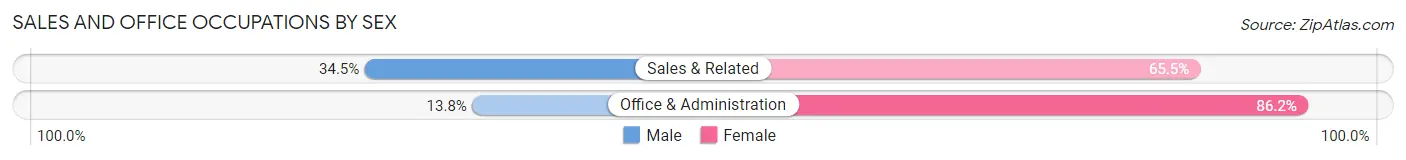
| Occupation | Male | Female |
| Sales & Related | 165 (34.5%) | 313 (65.5%) |
| Office & Administration | 82 (13.8%) | 511 (86.2%) |
| Total (Category) | 247 (23.1%) | 824 (76.9%) |
| Total (Overall) | 2,700 (54.0%) | 2,297 (46.0%) |
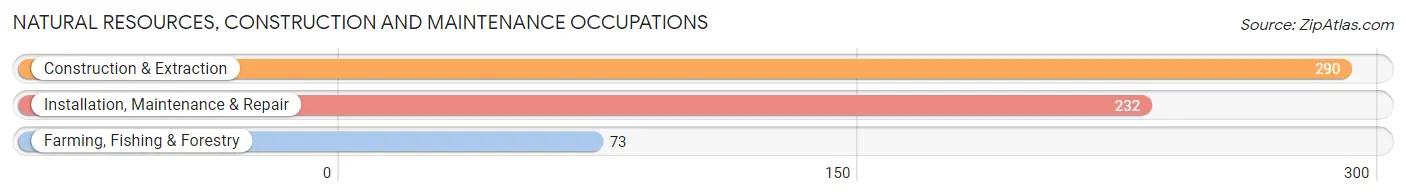
Natural Resources, Construction and Maintenance Occupations
The most common Natural Resources, Construction and Maintenance occupations in New Kingman Butler are Construction & Extraction (290 | 5.8%), Installation, Maintenance & Repair (232 | 4.6%), and Farming, Fishing & Forestry (73 | 1.5%).
Natural Resources, Construction and Maintenance Occupations by Sex
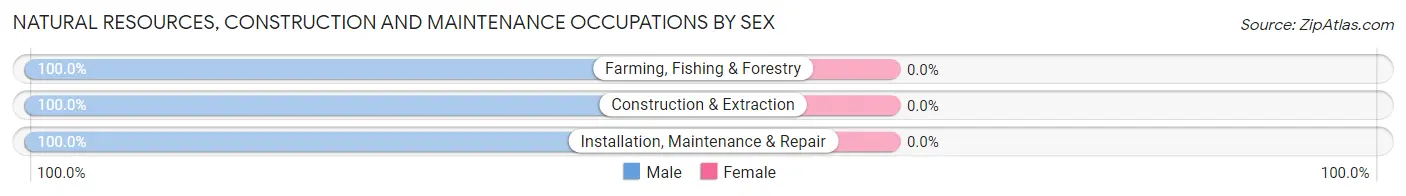
| Occupation | Male | Female |
| Farming, Fishing & Forestry | 73 (100.0%) | 0 (0.0%) |
| Construction & Extraction | 290 (100.0%) | 0 (0.0%) |
| Installation, Maintenance & Repair | 232 (100.0%) | 0 (0.0%) |
| Total (Category) | 595 (100.0%) | 0 (0.0%) |
| Total (Overall) | 2,700 (54.0%) | 2,297 (46.0%) |
Production, Transportation and Moving Occupations
The most common Production, Transportation and Moving occupations in New Kingman Butler are Transportation (444 | 8.9%), Material Moving (394 | 7.9%), and Production (301 | 6.0%).
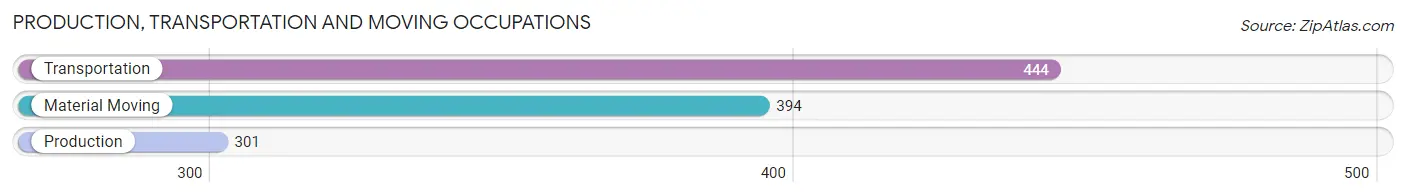
Production, Transportation and Moving Occupations by Sex
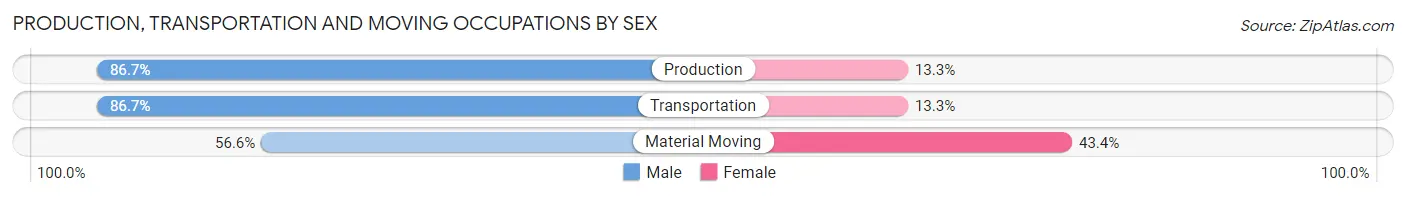
| Occupation | Male | Female |
| Production | 261 (86.7%) | 40 (13.3%) |
| Transportation | 385 (86.7%) | 59 (13.3%) |
| Material Moving | 223 (56.6%) | 171 (43.4%) |
| Total (Category) | 869 (76.3%) | 270 (23.7%) |
| Total (Overall) | 2,700 (54.0%) | 2,297 (46.0%) |
Employment Industries by Sex in New Kingman Butler
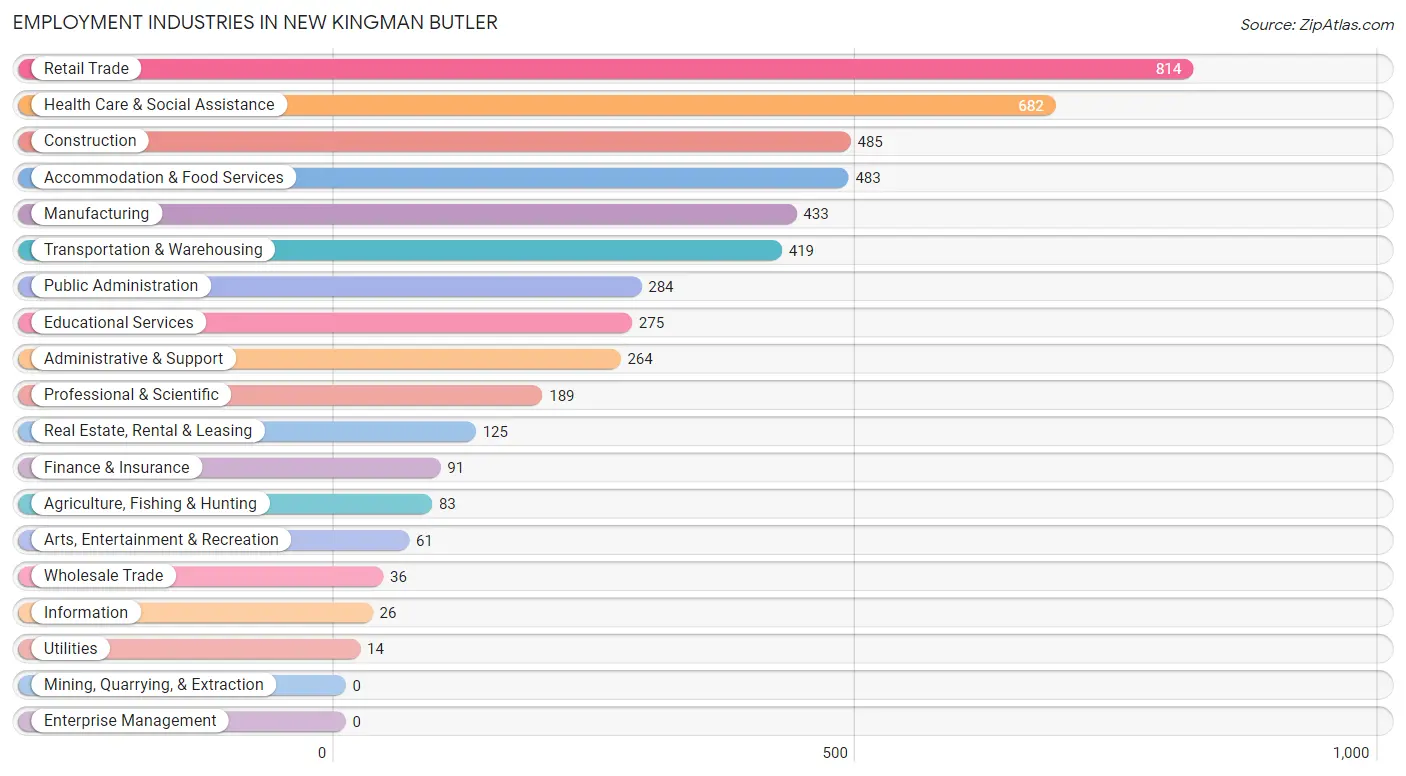
Employment Industries in New Kingman Butler
The major employment industries in New Kingman Butler include Retail Trade (814 | 16.3%), Health Care & Social Assistance (682 | 13.7%), Construction (485 | 9.7%), Accommodation & Food Services (483 | 9.7%), and Manufacturing (433 | 8.7%).
Employment Industries by Sex in New Kingman Butler
The New Kingman Butler industries that see more men than women are Agriculture, Fishing & Hunting (100.0%), Construction (100.0%), and Utilities (100.0%), whereas the industries that tend to have a higher number of women are Information (100.0%), Finance & Insurance (100.0%), and Health Care & Social Assistance (85.5%).
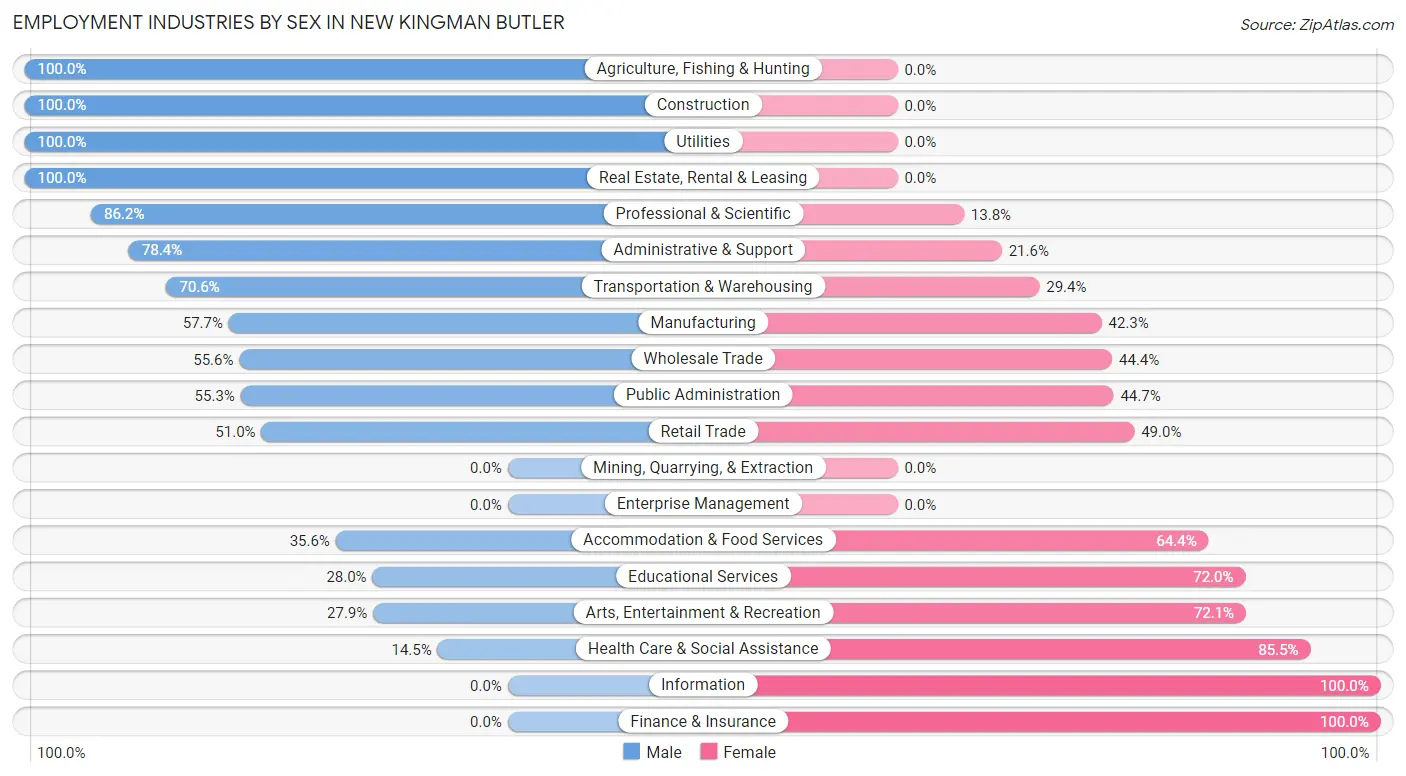
| Industry | Male | Female |
| Agriculture, Fishing & Hunting | 83 (100.0%) | 0 (0.0%) |
| Mining, Quarrying, & Extraction | 0 (0.0%) | 0 (0.0%) |
| Construction | 485 (100.0%) | 0 (0.0%) |
| Manufacturing | 250 (57.7%) | 183 (42.3%) |
| Wholesale Trade | 20 (55.6%) | 16 (44.4%) |
| Retail Trade | 415 (51.0%) | 399 (49.0%) |
| Transportation & Warehousing | 296 (70.6%) | 123 (29.4%) |
| Utilities | 14 (100.0%) | 0 (0.0%) |
| Information | 0 (0.0%) | 26 (100.0%) |
| Finance & Insurance | 0 (0.0%) | 91 (100.0%) |
| Real Estate, Rental & Leasing | 125 (100.0%) | 0 (0.0%) |
| Professional & Scientific | 163 (86.2%) | 26 (13.8%) |
| Enterprise Management | 0 (0.0%) | 0 (0.0%) |
| Administrative & Support | 207 (78.4%) | 57 (21.6%) |
| Educational Services | 77 (28.0%) | 198 (72.0%) |
| Health Care & Social Assistance | 99 (14.5%) | 583 (85.5%) |
| Arts, Entertainment & Recreation | 17 (27.9%) | 44 (72.1%) |
| Accommodation & Food Services | 172 (35.6%) | 311 (64.4%) |
| Public Administration | 157 (55.3%) | 127 (44.7%) |
| Total | 2,700 (54.0%) | 2,297 (46.0%) |
Education in New Kingman Butler
School Enrollment in New Kingman Butler
The most common levels of schooling among the 2,076 students in New Kingman Butler are elementary school (529 | 25.5%), high school (527 | 25.4%), and middle school (472 | 22.7%).
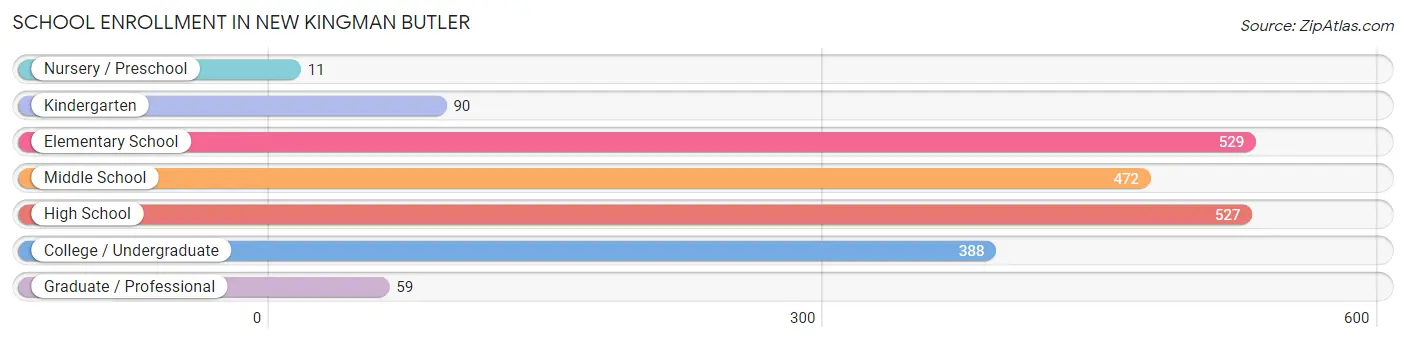
| School Level | # Students | % Students |
| Nursery / Preschool | 11 | 0.5% |
| Kindergarten | 90 | 4.3% |
| Elementary School | 529 | 25.5% |
| Middle School | 472 | 22.7% |
| High School | 527 | 25.4% |
| College / Undergraduate | 388 | 18.7% |
| Graduate / Professional | 59 | 2.8% |
| Total | 2,076 | 100.0% |
School Enrollment by Age by Funding Source in New Kingman Butler
Out of a total of 2,076 students who are enrolled in schools in New Kingman Butler, 239 (11.5%) attend a private institution, while the remaining 1,837 (88.5%) are enrolled in public schools. The age group of 18 to 19 year olds has the highest likelihood of being enrolled in private schools, with 132 (55.0% in the age bracket) enrolled. Conversely, the age group of 3 to 4 year olds has the lowest likelihood of being enrolled in a private school, with 11 (100.0% in the age bracket) attending a public institution.
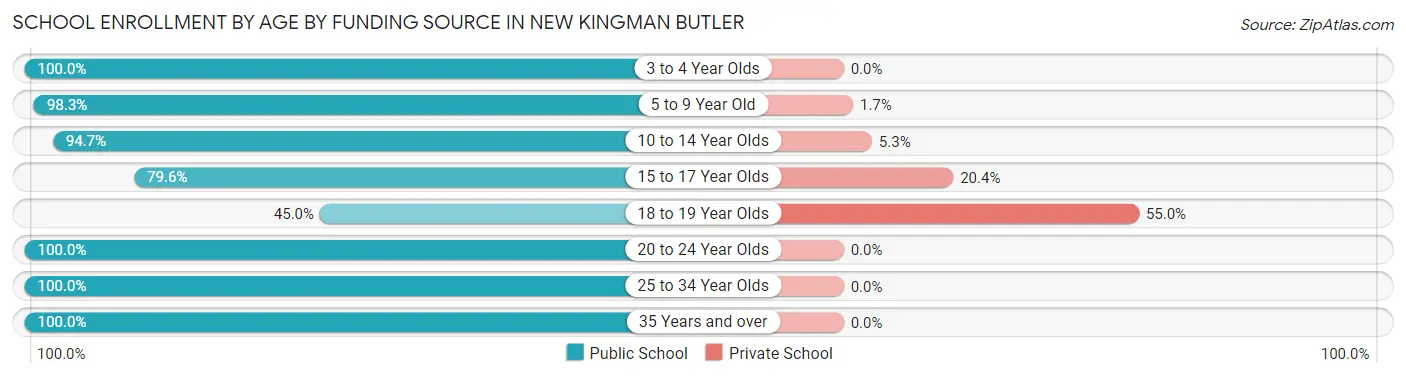
| Age Bracket | Public School | Private School |
| 3 to 4 Year Olds | 11 (100.0%) | 0 (0.0%) |
| 5 to 9 Year Old | 564 (98.3%) | 10 (1.7%) |
| 10 to 14 Year Olds | 486 (94.7%) | 27 (5.3%) |
| 15 to 17 Year Olds | 269 (79.6%) | 69 (20.4%) |
| 18 to 19 Year Olds | 108 (45.0%) | 132 (55.0%) |
| 20 to 24 Year Olds | 160 (100.0%) | 0 (0.0%) |
| 25 to 34 Year Olds | 130 (100.0%) | 0 (0.0%) |
| 35 Years and over | 110 (100.0%) | 0 (0.0%) |
| Total | 1,837 (88.5%) | 239 (11.5%) |
Educational Attainment by Field of Study in New Kingman Butler
Business (177 | 29.9%), education (71 | 12.0%), social sciences (58 | 9.8%), arts & humanities (58 | 9.8%), and bio, nature & agricultural (54 | 9.1%) are the most common fields of study among 592 individuals in New Kingman Butler who have obtained a bachelor's degree or higher.
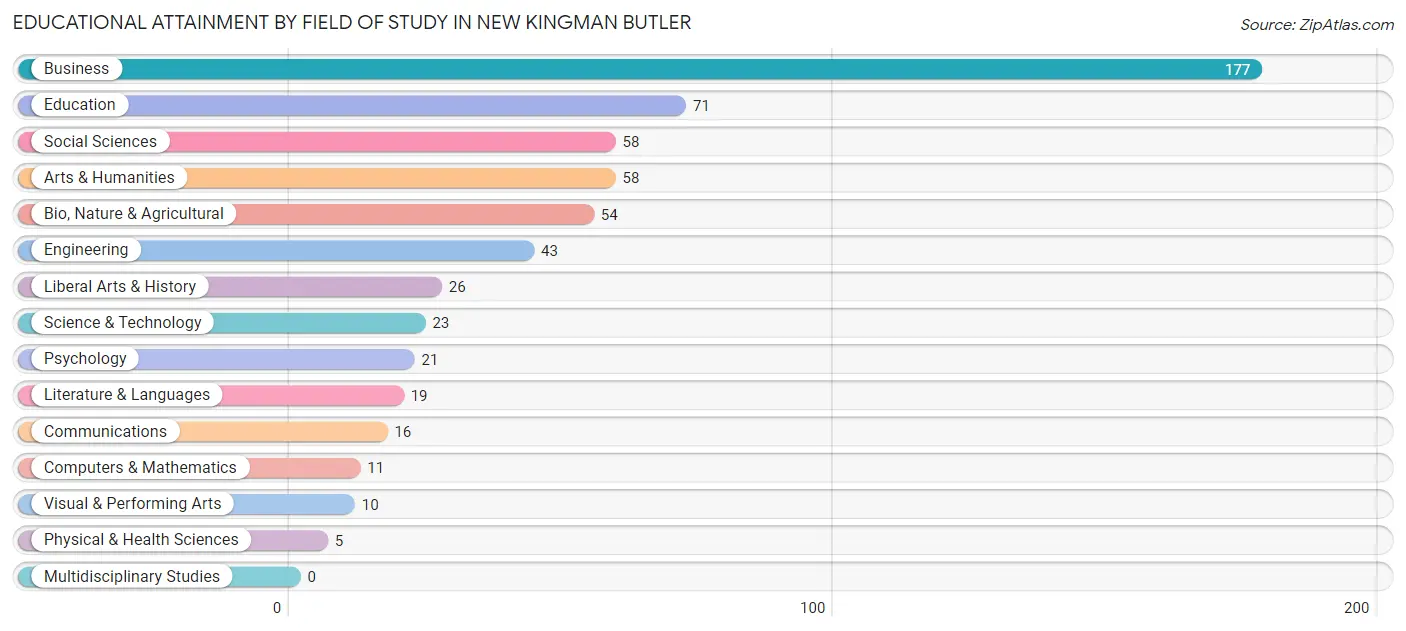
| Field of Study | # Graduates | % Graduates |
| Computers & Mathematics | 11 | 1.9% |
| Bio, Nature & Agricultural | 54 | 9.1% |
| Physical & Health Sciences | 5 | 0.8% |
| Psychology | 21 | 3.5% |
| Social Sciences | 58 | 9.8% |
| Engineering | 43 | 7.3% |
| Multidisciplinary Studies | 0 | 0.0% |
| Science & Technology | 23 | 3.9% |
| Business | 177 | 29.9% |
| Education | 71 | 12.0% |
| Literature & Languages | 19 | 3.2% |
| Liberal Arts & History | 26 | 4.4% |
| Visual & Performing Arts | 10 | 1.7% |
| Communications | 16 | 2.7% |
| Arts & Humanities | 58 | 9.8% |
| Total | 592 | 100.0% |
Transportation & Commute in New Kingman Butler
Vehicle Availability by Sex in New Kingman Butler
The most prevalent vehicle ownership categories in New Kingman Butler are males with 2 vehicles (1,272, accounting for 48.0%) and females with 2 vehicles (1,016, making up 55.7%).
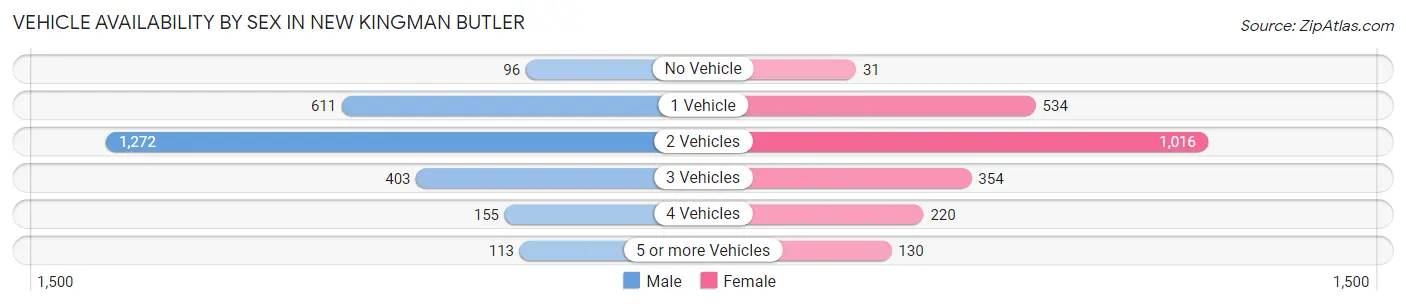
| Vehicles Available | Male | Female |
| No Vehicle | 96 (3.6%) | 31 (1.4%) |
| 1 Vehicle | 611 (23.1%) | 534 (23.4%) |
| 2 Vehicles | 1,272 (48.0%) | 1,016 (44.5%) |
| 3 Vehicles | 403 (15.2%) | 354 (15.5%) |
| 4 Vehicles | 155 (5.9%) | 220 (9.6%) |
| 5 or more Vehicles | 113 (4.3%) | 130 (5.7%) |
| Total | 2,650 (100.0%) | 2,285 (100.0%) |
Commute Time in New Kingman Butler
The most frequently occuring commute durations in New Kingman Butler are 10 to 14 minutes (1,773 commuters, 38.0%), 15 to 19 minutes (1,116 commuters, 23.9%), and 5 to 9 minutes (435 commuters, 9.3%).
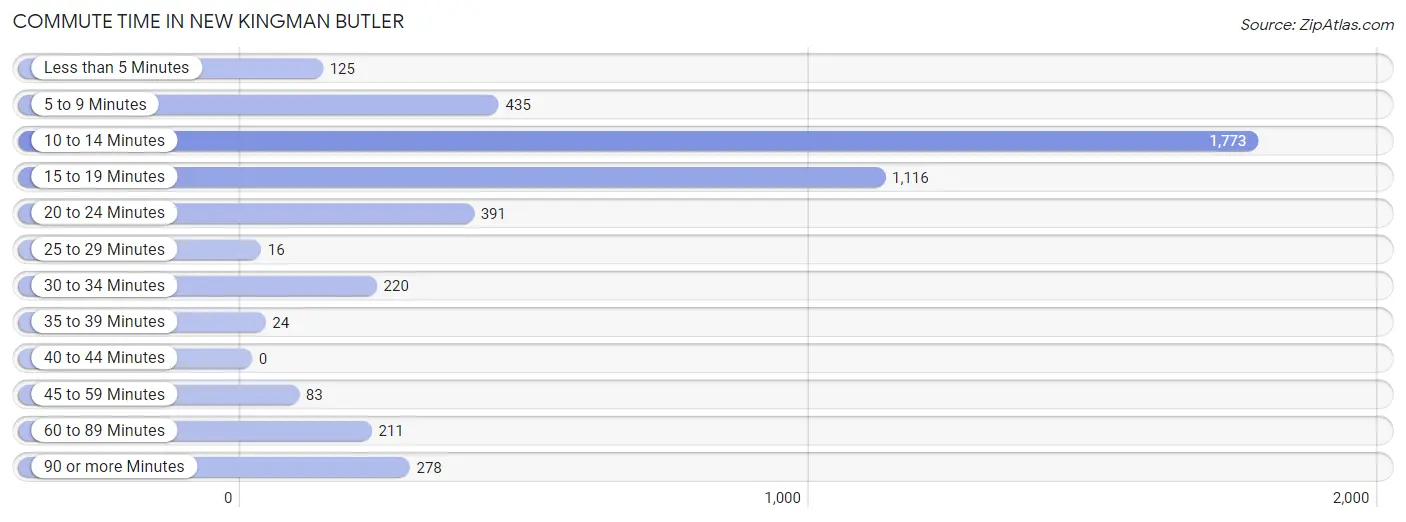
| Commute Time | # Commuters | % Commuters |
| Less than 5 Minutes | 125 | 2.7% |
| 5 to 9 Minutes | 435 | 9.3% |
| 10 to 14 Minutes | 1,773 | 38.0% |
| 15 to 19 Minutes | 1,116 | 23.9% |
| 20 to 24 Minutes | 391 | 8.4% |
| 25 to 29 Minutes | 16 | 0.3% |
| 30 to 34 Minutes | 220 | 4.7% |
| 35 to 39 Minutes | 24 | 0.5% |
| 40 to 44 Minutes | 0 | 0.0% |
| 45 to 59 Minutes | 83 | 1.8% |
| 60 to 89 Minutes | 211 | 4.5% |
| 90 or more Minutes | 278 | 5.9% |
Commute Time by Sex in New Kingman Butler
The most common commute times in New Kingman Butler are 10 to 14 minutes (736 commuters, 30.2%) for males and 10 to 14 minutes (1,037 commuters, 46.4%) for females.
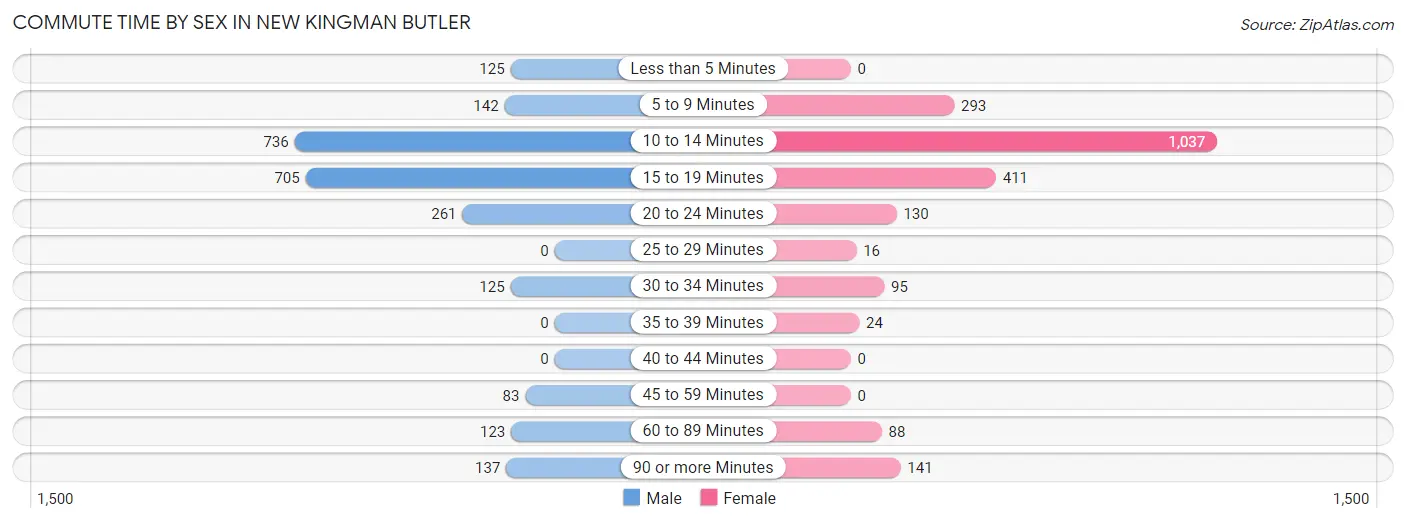
| Commute Time | Male | Female |
| Less than 5 Minutes | 125 (5.1%) | 0 (0.0%) |
| 5 to 9 Minutes | 142 (5.8%) | 293 (13.1%) |
| 10 to 14 Minutes | 736 (30.2%) | 1,037 (46.4%) |
| 15 to 19 Minutes | 705 (28.9%) | 411 (18.4%) |
| 20 to 24 Minutes | 261 (10.7%) | 130 (5.8%) |
| 25 to 29 Minutes | 0 (0.0%) | 16 (0.7%) |
| 30 to 34 Minutes | 125 (5.1%) | 95 (4.3%) |
| 35 to 39 Minutes | 0 (0.0%) | 24 (1.1%) |
| 40 to 44 Minutes | 0 (0.0%) | 0 (0.0%) |
| 45 to 59 Minutes | 83 (3.4%) | 0 (0.0%) |
| 60 to 89 Minutes | 123 (5.1%) | 88 (3.9%) |
| 90 or more Minutes | 137 (5.6%) | 141 (6.3%) |
Time of Departure to Work by Sex in New Kingman Butler
The most frequent times of departure to work in New Kingman Butler are 6:30 AM to 6:59 AM (410, 16.8%) for males and 6:30 AM to 6:59 AM (454, 20.3%) for females.
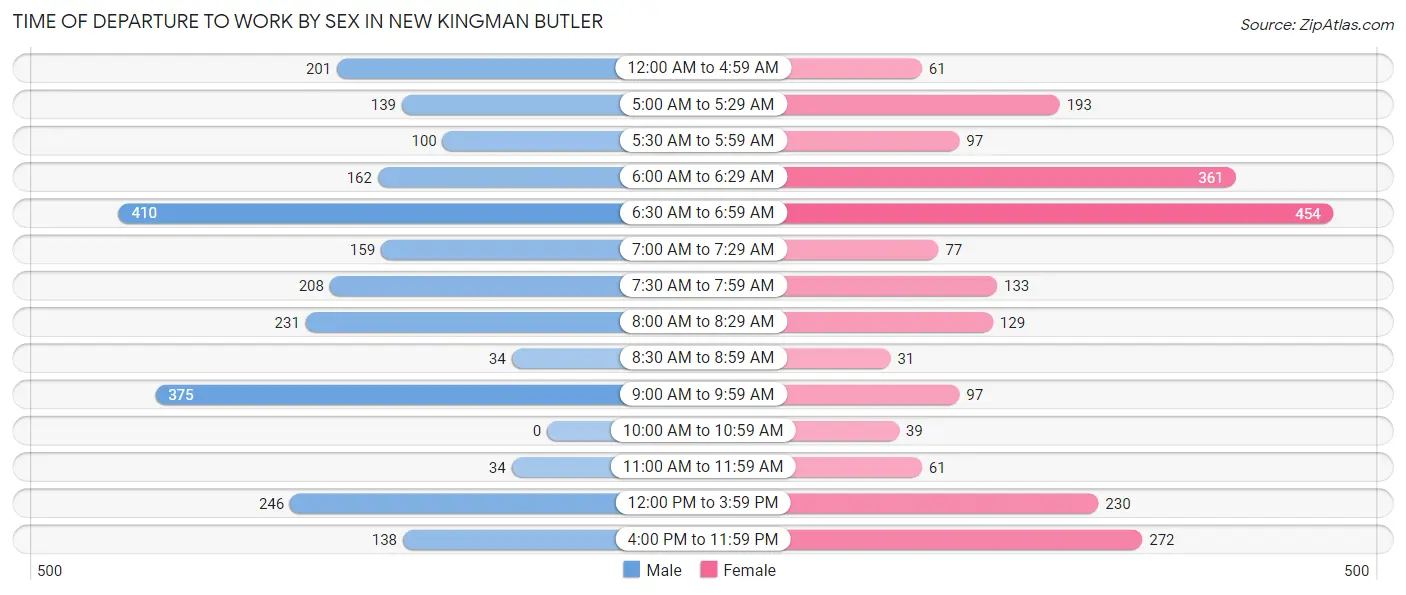
| Time of Departure | Male | Female |
| 12:00 AM to 4:59 AM | 201 (8.3%) | 61 (2.7%) |
| 5:00 AM to 5:29 AM | 139 (5.7%) | 193 (8.6%) |
| 5:30 AM to 5:59 AM | 100 (4.1%) | 97 (4.3%) |
| 6:00 AM to 6:29 AM | 162 (6.7%) | 361 (16.2%) |
| 6:30 AM to 6:59 AM | 410 (16.8%) | 454 (20.3%) |
| 7:00 AM to 7:29 AM | 159 (6.5%) | 77 (3.5%) |
| 7:30 AM to 7:59 AM | 208 (8.5%) | 133 (5.9%) |
| 8:00 AM to 8:29 AM | 231 (9.5%) | 129 (5.8%) |
| 8:30 AM to 8:59 AM | 34 (1.4%) | 31 (1.4%) |
| 9:00 AM to 9:59 AM | 375 (15.4%) | 97 (4.3%) |
| 10:00 AM to 10:59 AM | 0 (0.0%) | 39 (1.7%) |
| 11:00 AM to 11:59 AM | 34 (1.4%) | 61 (2.7%) |
| 12:00 PM to 3:59 PM | 246 (10.1%) | 230 (10.3%) |
| 4:00 PM to 11:59 PM | 138 (5.7%) | 272 (12.2%) |
| Total | 2,437 (100.0%) | 2,235 (100.0%) |
Housing Occupancy in New Kingman Butler
Occupancy by Ownership in New Kingman Butler
Of the total 6,131 dwellings in New Kingman Butler, owner-occupied units account for 3,997 (65.2%), while renter-occupied units make up 2,134 (34.8%).
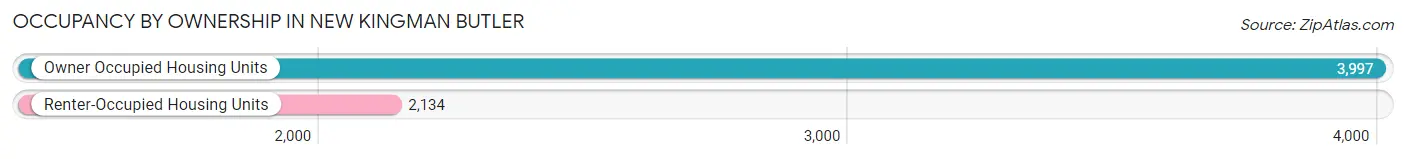
| Occupancy | # Housing Units | % Housing Units |
| Owner Occupied Housing Units | 3,997 | 65.2% |
| Renter-Occupied Housing Units | 2,134 | 34.8% |
| Total Occupied Housing Units | 6,131 | 100.0% |
Occupancy by Household Size in New Kingman Butler
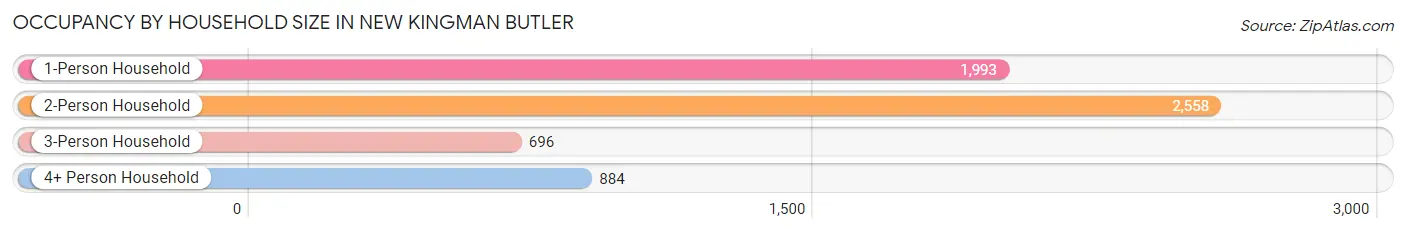
| Household Size | # Housing Units | % Housing Units |
| 1-Person Household | 1,993 | 32.5% |
| 2-Person Household | 2,558 | 41.7% |
| 3-Person Household | 696 | 11.4% |
| 4+ Person Household | 884 | 14.4% |
| Total Housing Units | 6,131 | 100.0% |
Occupancy by Ownership by Household Size in New Kingman Butler
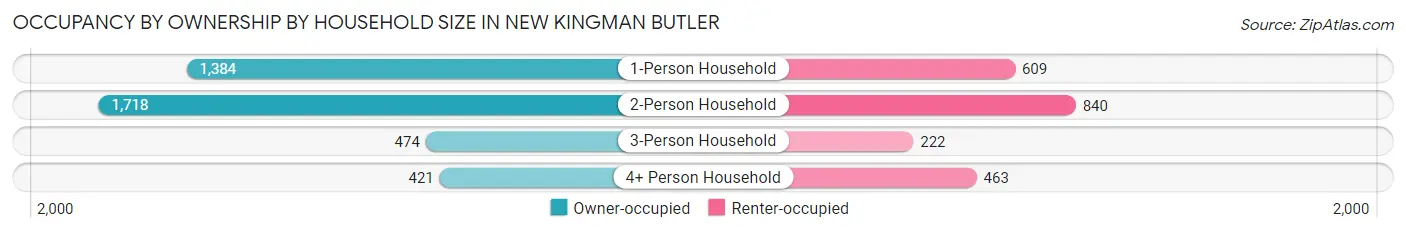
| Household Size | Owner-occupied | Renter-occupied |
| 1-Person Household | 1,384 (69.4%) | 609 (30.6%) |
| 2-Person Household | 1,718 (67.2%) | 840 (32.8%) |
| 3-Person Household | 474 (68.1%) | 222 (31.9%) |
| 4+ Person Household | 421 (47.6%) | 463 (52.4%) |
| Total Housing Units | 3,997 (65.2%) | 2,134 (34.8%) |
Occupancy by Educational Attainment in New Kingman Butler
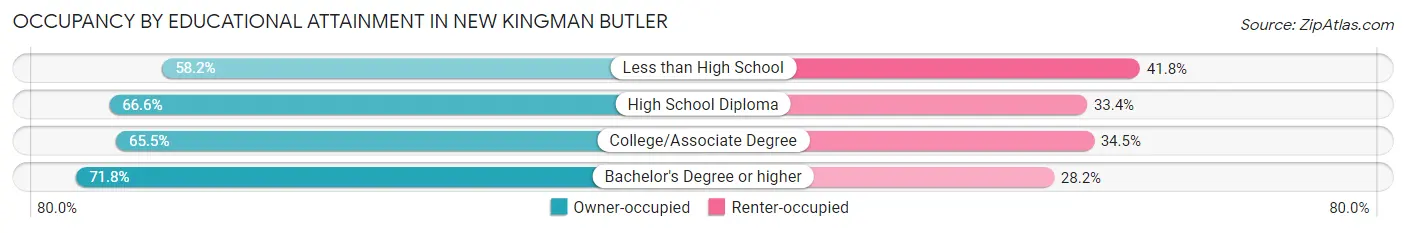
| Household Size | Owner-occupied | Renter-occupied |
| Less than High School | 516 (58.2%) | 371 (41.8%) |
| High School Diploma | 1,575 (66.6%) | 791 (33.4%) |
| College/Associate Degree | 1,664 (65.5%) | 877 (34.5%) |
| Bachelor's Degree or higher | 242 (71.8%) | 95 (28.2%) |
Occupancy by Age of Householder in New Kingman Butler
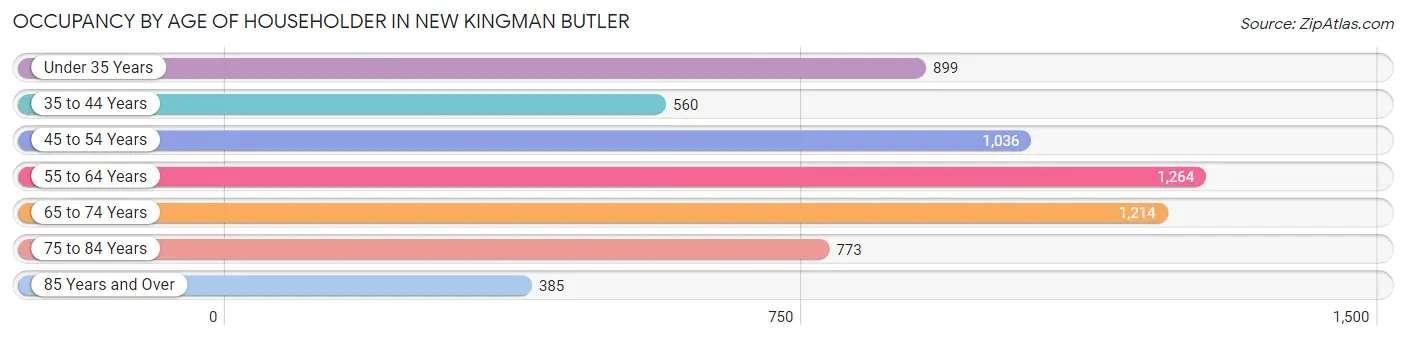
| Age Bracket | # Households | % Households |
| Under 35 Years | 899 | 14.7% |
| 35 to 44 Years | 560 | 9.1% |
| 45 to 54 Years | 1,036 | 16.9% |
| 55 to 64 Years | 1,264 | 20.6% |
| 65 to 74 Years | 1,214 | 19.8% |
| 75 to 84 Years | 773 | 12.6% |
| 85 Years and Over | 385 | 6.3% |
| Total | 6,131 | 100.0% |
Housing Finances in New Kingman Butler
Median Income by Occupancy in New Kingman Butler
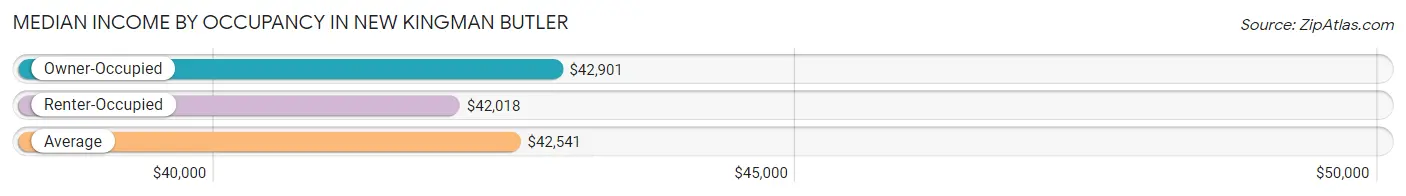
| Occupancy Type | # Households | Median Income |
| Owner-Occupied | 3,997 (65.2%) | $42,901 |
| Renter-Occupied | 2,134 (34.8%) | $42,018 |
| Average | 6,131 (100.0%) | $42,541 |
Occupancy by Householder Income Bracket in New Kingman Butler
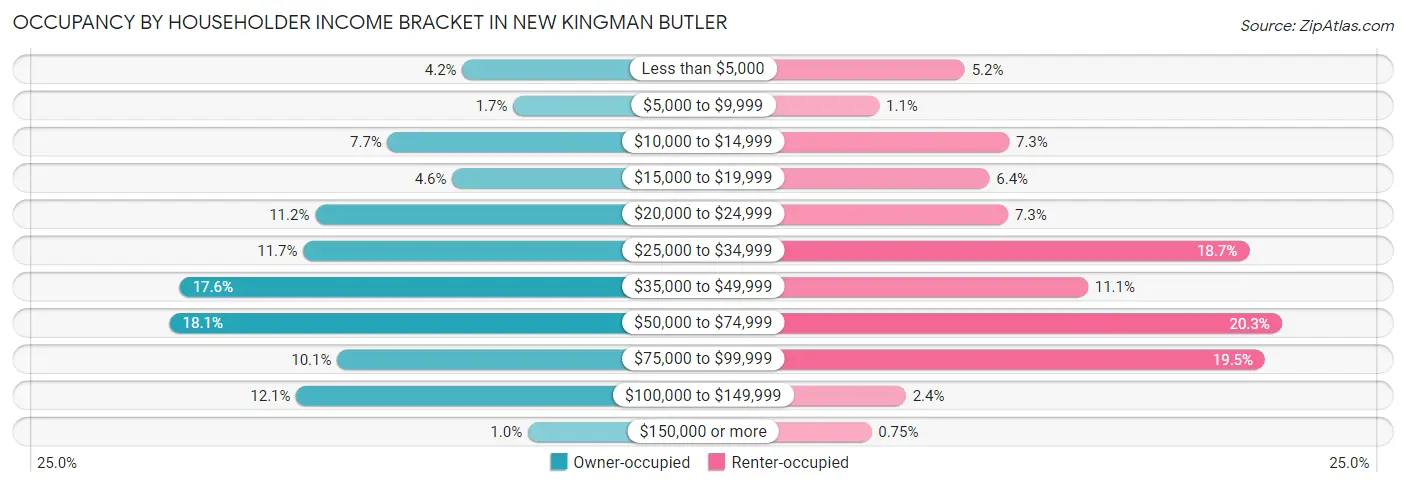
| Income Bracket | Owner-occupied | Renter-occupied |
| Less than $5,000 | 166 (4.2%) | 111 (5.2%) |
| $5,000 to $9,999 | 69 (1.7%) | 24 (1.1%) |
| $10,000 to $14,999 | 308 (7.7%) | 156 (7.3%) |
| $15,000 to $19,999 | 185 (4.6%) | 136 (6.4%) |
| $20,000 to $24,999 | 446 (11.2%) | 155 (7.3%) |
| $25,000 to $34,999 | 469 (11.7%) | 400 (18.7%) |
| $35,000 to $49,999 | 704 (17.6%) | 236 (11.1%) |
| $50,000 to $74,999 | 723 (18.1%) | 433 (20.3%) |
| $75,000 to $99,999 | 404 (10.1%) | 416 (19.5%) |
| $100,000 to $149,999 | 482 (12.1%) | 51 (2.4%) |
| $150,000 or more | 41 (1.0%) | 16 (0.7%) |
| Total | 3,997 (100.0%) | 2,134 (100.0%) |
Monthly Housing Cost Tiers in New Kingman Butler
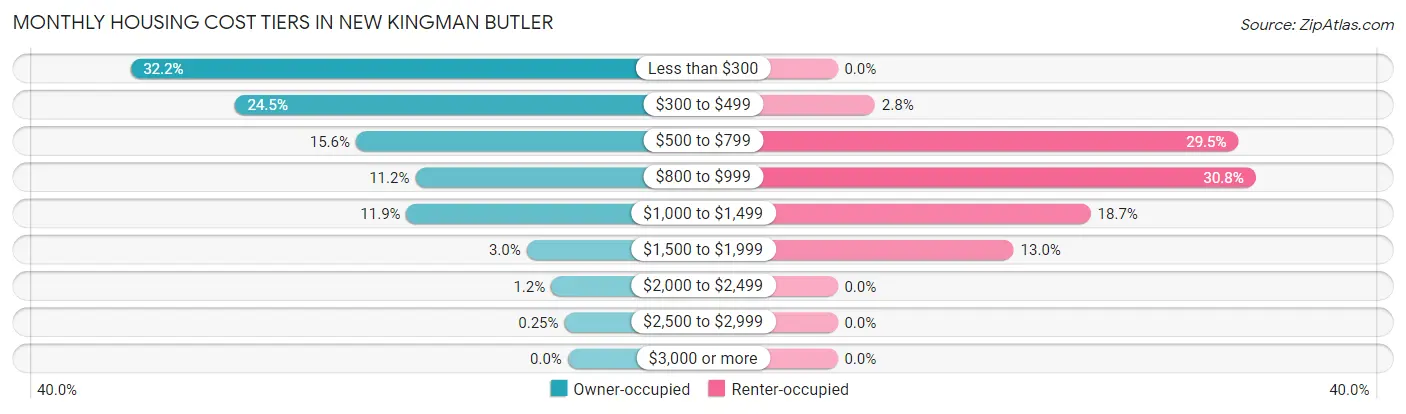
| Monthly Cost | Owner-occupied | Renter-occupied |
| Less than $300 | 1,288 (32.2%) | 0 (0.0%) |
| $300 to $499 | 981 (24.5%) | 59 (2.8%) |
| $500 to $799 | 624 (15.6%) | 630 (29.5%) |
| $800 to $999 | 449 (11.2%) | 657 (30.8%) |
| $1,000 to $1,499 | 475 (11.9%) | 398 (18.6%) |
| $1,500 to $1,999 | 121 (3.0%) | 277 (13.0%) |
| $2,000 to $2,499 | 49 (1.2%) | 0 (0.0%) |
| $2,500 to $2,999 | 10 (0.3%) | 0 (0.0%) |
| $3,000 or more | 0 (0.0%) | 0 (0.0%) |
| Total | 3,997 (100.0%) | 2,134 (100.0%) |
Physical Housing Characteristics in New Kingman Butler
Housing Structures in New Kingman Butler
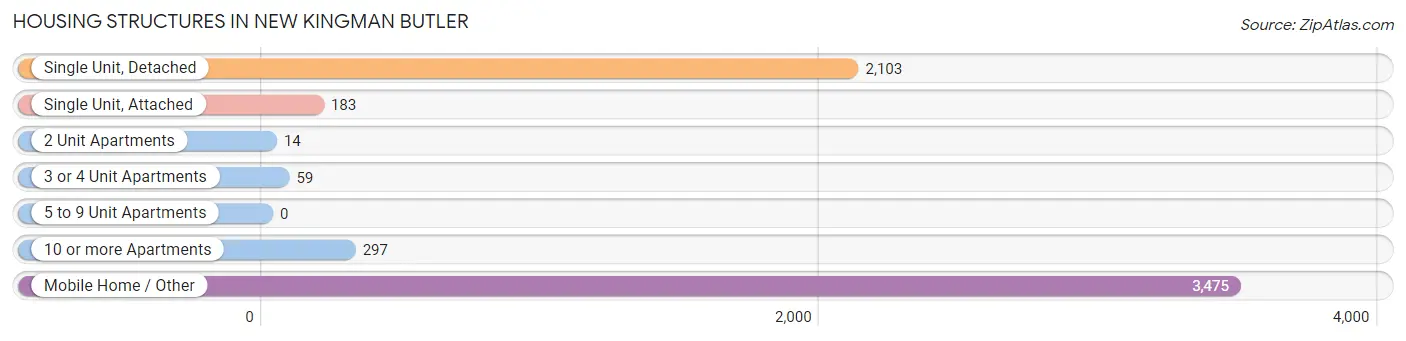
| Structure Type | # Housing Units | % Housing Units |
| Single Unit, Detached | 2,103 | 34.3% |
| Single Unit, Attached | 183 | 3.0% |
| 2 Unit Apartments | 14 | 0.2% |
| 3 or 4 Unit Apartments | 59 | 1.0% |
| 5 to 9 Unit Apartments | 0 | 0.0% |
| 10 or more Apartments | 297 | 4.8% |
| Mobile Home / Other | 3,475 | 56.7% |
| Total | 6,131 | 100.0% |
Housing Structures by Occupancy in New Kingman Butler
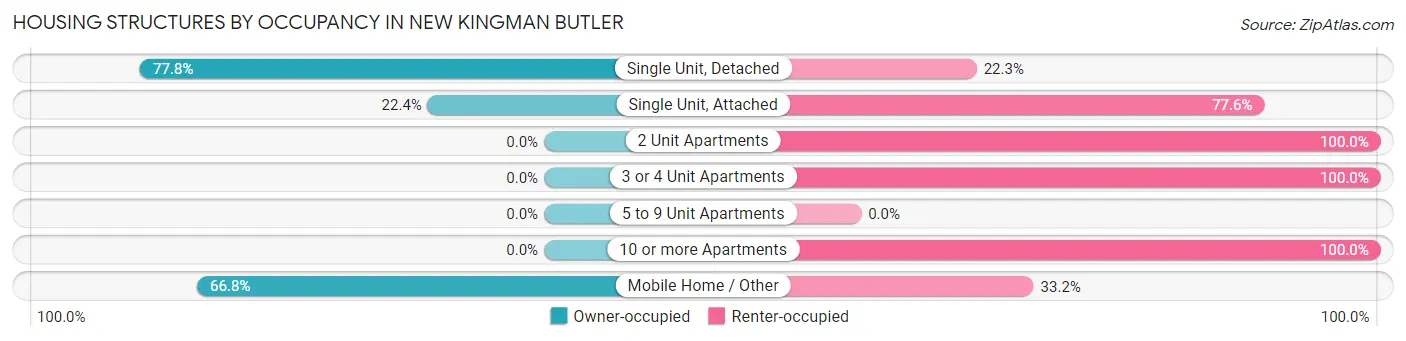
| Structure Type | Owner-occupied | Renter-occupied |
| Single Unit, Detached | 1,635 (77.7%) | 468 (22.3%) |
| Single Unit, Attached | 41 (22.4%) | 142 (77.6%) |
| 2 Unit Apartments | 0 (0.0%) | 14 (100.0%) |
| 3 or 4 Unit Apartments | 0 (0.0%) | 59 (100.0%) |
| 5 to 9 Unit Apartments | 0 (0.0%) | 0 (0.0%) |
| 10 or more Apartments | 0 (0.0%) | 297 (100.0%) |
| Mobile Home / Other | 2,321 (66.8%) | 1,154 (33.2%) |
| Total | 3,997 (65.2%) | 2,134 (34.8%) |
Housing Structures by Number of Rooms in New Kingman Butler
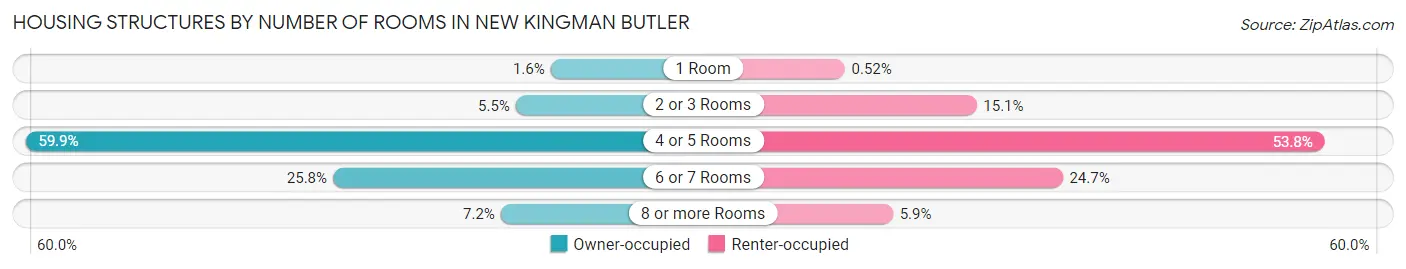
| Number of Rooms | Owner-occupied | Renter-occupied |
| 1 Room | 65 (1.6%) | 11 (0.5%) |
| 2 or 3 Rooms | 220 (5.5%) | 323 (15.1%) |
| 4 or 5 Rooms | 2,395 (59.9%) | 1,148 (53.8%) |
| 6 or 7 Rooms | 1,031 (25.8%) | 527 (24.7%) |
| 8 or more Rooms | 286 (7.2%) | 125 (5.9%) |
| Total | 3,997 (100.0%) | 2,134 (100.0%) |
Housing Structure by Heating Type in New Kingman Butler
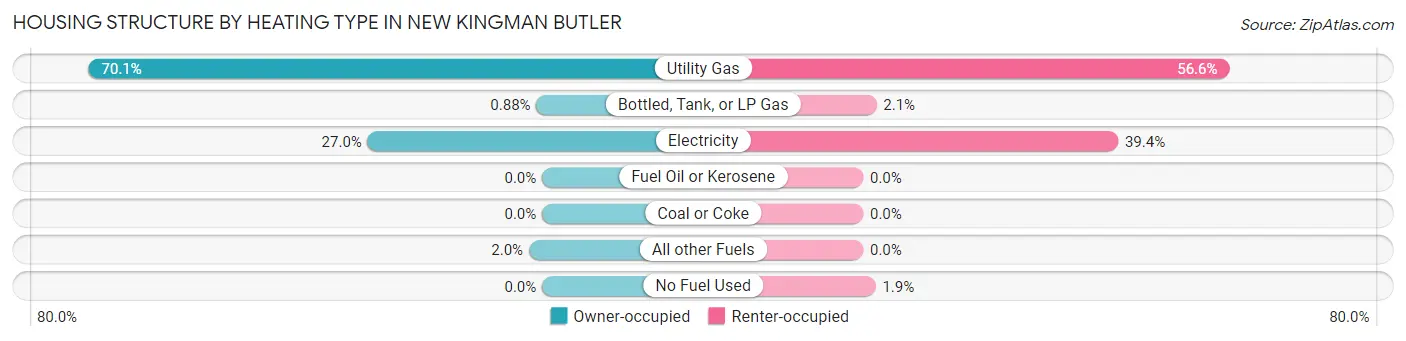
| Heating Type | Owner-occupied | Renter-occupied |
| Utility Gas | 2,803 (70.1%) | 1,208 (56.6%) |
| Bottled, Tank, or LP Gas | 35 (0.9%) | 44 (2.1%) |
| Electricity | 1,078 (27.0%) | 841 (39.4%) |
| Fuel Oil or Kerosene | 0 (0.0%) | 0 (0.0%) |
| Coal or Coke | 0 (0.0%) | 0 (0.0%) |
| All other Fuels | 81 (2.0%) | 0 (0.0%) |
| No Fuel Used | 0 (0.0%) | 41 (1.9%) |
| Total | 3,997 (100.0%) | 2,134 (100.0%) |
Household Vehicle Usage in New Kingman Butler
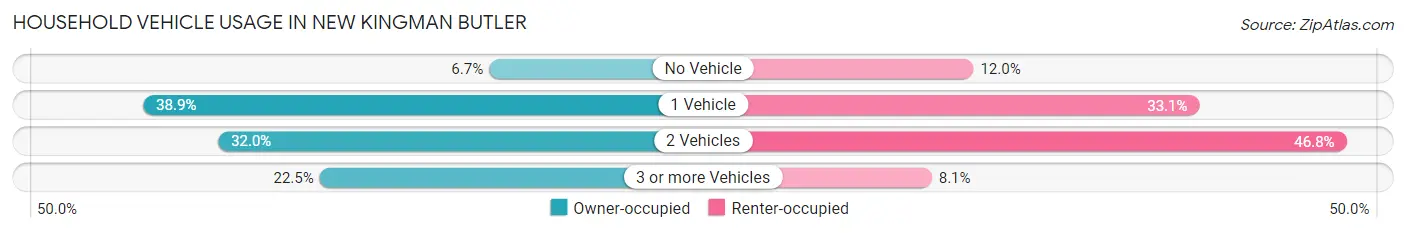
| Vehicles per Household | Owner-occupied | Renter-occupied |
| No Vehicle | 266 (6.7%) | 256 (12.0%) |
| 1 Vehicle | 1,556 (38.9%) | 706 (33.1%) |
| 2 Vehicles | 1,277 (32.0%) | 999 (46.8%) |
| 3 or more Vehicles | 898 (22.5%) | 173 (8.1%) |
| Total | 3,997 (100.0%) | 2,134 (100.0%) |
Real Estate & Mortgages in New Kingman Butler
Real Estate and Mortgage Overview in New Kingman Butler
| Characteristic | Without Mortgage | With Mortgage |
| Housing Units | 2,303 | 1,694 |
| Median Property Value | $77,500 | $138,600 |
| Median Household Income | $38,216 | $24 |
| Monthly Housing Costs | $282 | $0 |
| Real Estate Taxes | $415 | $174 |
Property Value by Mortgage Status in New Kingman Butler
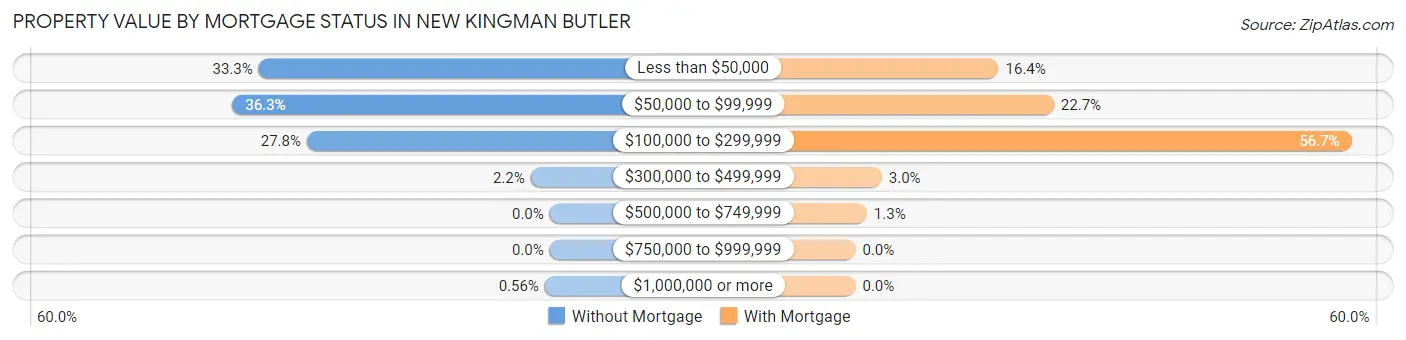
| Property Value | Without Mortgage | With Mortgage |
| Less than $50,000 | 766 (33.3%) | 277 (16.4%) |
| $50,000 to $99,999 | 835 (36.3%) | 384 (22.7%) |
| $100,000 to $299,999 | 639 (27.8%) | 960 (56.7%) |
| $300,000 to $499,999 | 50 (2.2%) | 51 (3.0%) |
| $500,000 to $749,999 | 0 (0.0%) | 22 (1.3%) |
| $750,000 to $999,999 | 0 (0.0%) | 0 (0.0%) |
| $1,000,000 or more | 13 (0.6%) | 0 (0.0%) |
| Total | 2,303 (100.0%) | 1,694 (100.0%) |
Household Income by Mortgage Status in New Kingman Butler
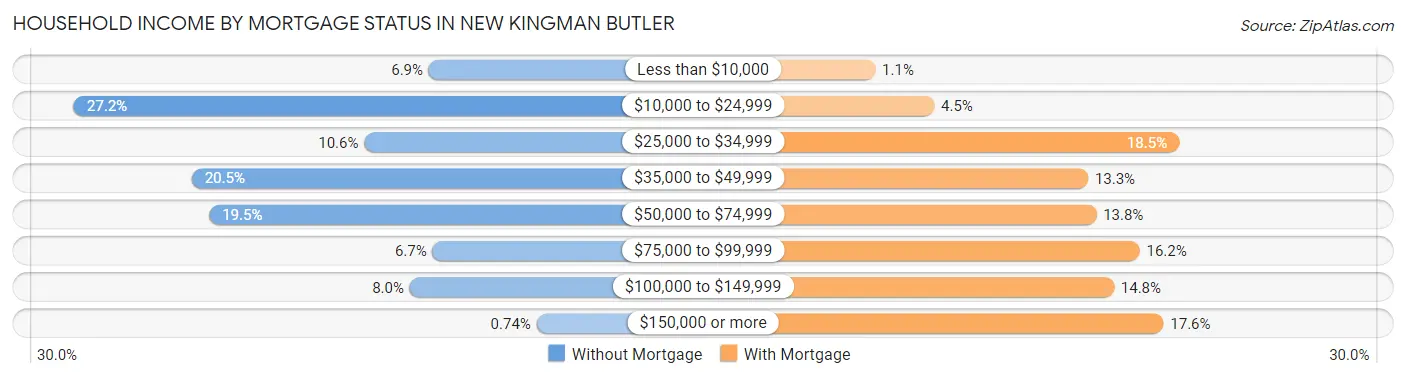
| Household Income | Without Mortgage | With Mortgage |
| Less than $10,000 | 159 (6.9%) | 19 (1.1%) |
| $10,000 to $24,999 | 626 (27.2%) | 76 (4.5%) |
| $25,000 to $34,999 | 244 (10.6%) | 313 (18.5%) |
| $35,000 to $49,999 | 471 (20.4%) | 225 (13.3%) |
| $50,000 to $74,999 | 448 (19.5%) | 233 (13.8%) |
| $75,000 to $99,999 | 154 (6.7%) | 275 (16.2%) |
| $100,000 to $149,999 | 184 (8.0%) | 250 (14.8%) |
| $150,000 or more | 17 (0.7%) | 298 (17.6%) |
| Total | 2,303 (100.0%) | 1,694 (100.0%) |
Property Value to Household Income Ratio in New Kingman Butler
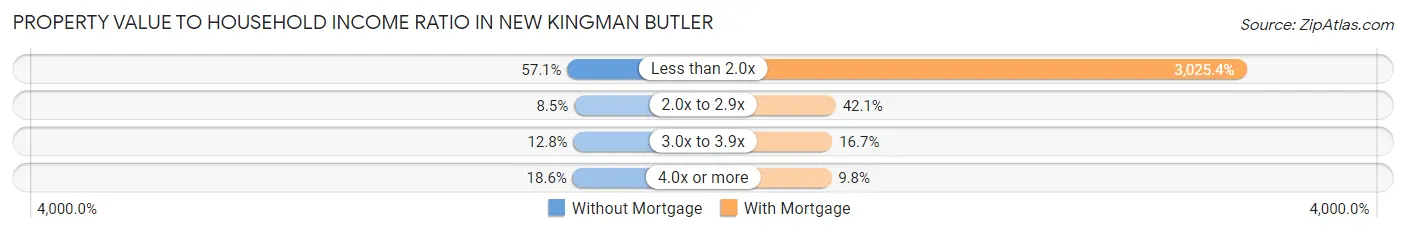
| Value-to-Income Ratio | Without Mortgage | With Mortgage |
| Less than 2.0x | 1,315 (57.1%) | 51,250 (3,025.4%) |
| 2.0x to 2.9x | 196 (8.5%) | 713 (42.1%) |
| 3.0x to 3.9x | 295 (12.8%) | 282 (16.7%) |
| 4.0x or more | 429 (18.6%) | 166 (9.8%) |
| Total | 2,303 (100.0%) | 1,694 (100.0%) |
Real Estate Taxes by Mortgage Status in New Kingman Butler
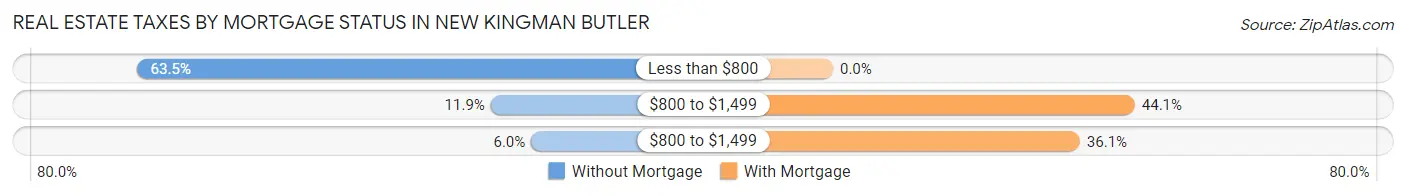
| Property Taxes | Without Mortgage | With Mortgage |
| Less than $800 | 1,462 (63.5%) | 0 (0.0%) |
| $800 to $1,499 | 274 (11.9%) | 747 (44.1%) |
| $800 to $1,499 | 138 (6.0%) | 611 (36.1%) |
| Total | 2,303 (100.0%) | 1,694 (100.0%) |
Health & Disability in New Kingman Butler
Health Insurance Coverage by Age in New Kingman Butler
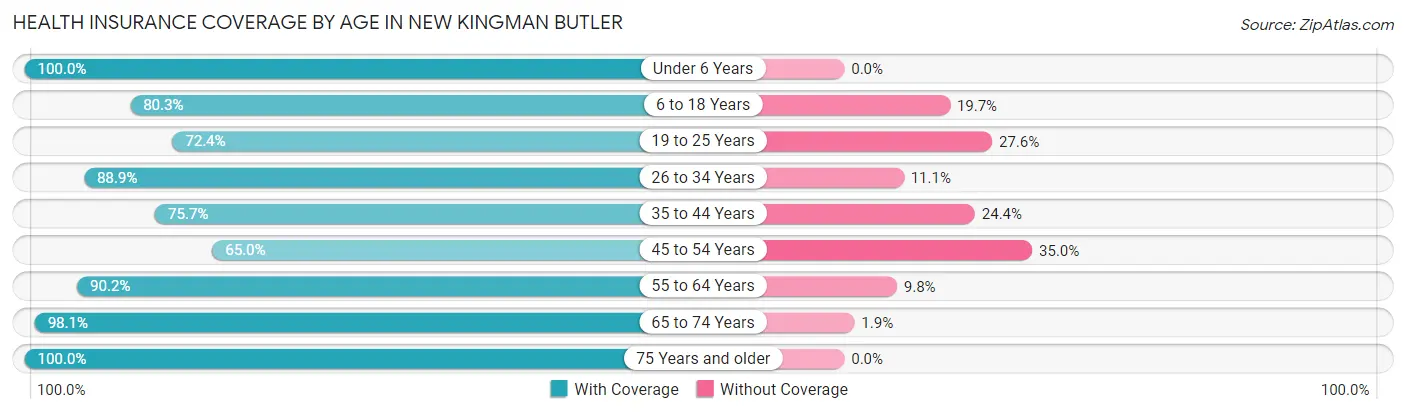
| Age Bracket | With Coverage | Without Coverage |
| Under 6 Years | 758 (100.0%) | 0 (0.0%) |
| 6 to 18 Years | 1,386 (80.3%) | 340 (19.7%) |
| 19 to 25 Years | 812 (72.4%) | 309 (27.6%) |
| 26 to 34 Years | 1,059 (88.9%) | 132 (11.1%) |
| 35 to 44 Years | 839 (75.6%) | 270 (24.3%) |
| 45 to 54 Years | 1,223 (65.0%) | 659 (35.0%) |
| 55 to 64 Years | 1,702 (90.2%) | 185 (9.8%) |
| 65 to 74 Years | 1,977 (98.1%) | 38 (1.9%) |
| 75 Years and older | 1,539 (100.0%) | 0 (0.0%) |
| Total | 11,295 (85.4%) | 1,933 (14.6%) |
Health Insurance Coverage by Citizenship Status in New Kingman Butler
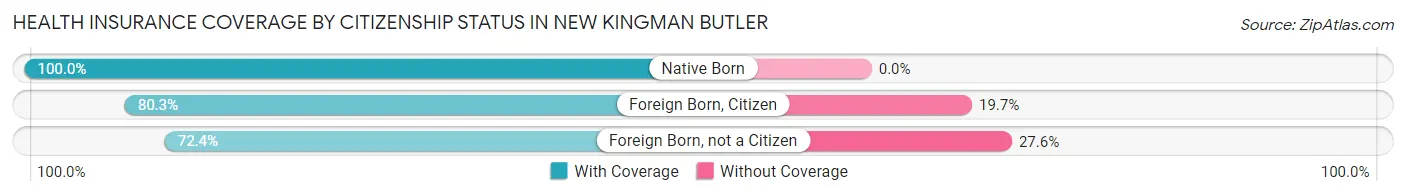
| Citizenship Status | With Coverage | Without Coverage |
| Native Born | 758 (100.0%) | 0 (0.0%) |
| Foreign Born, Citizen | 1,386 (80.3%) | 340 (19.7%) |
| Foreign Born, not a Citizen | 812 (72.4%) | 309 (27.6%) |
Health Insurance Coverage by Household Income in New Kingman Butler
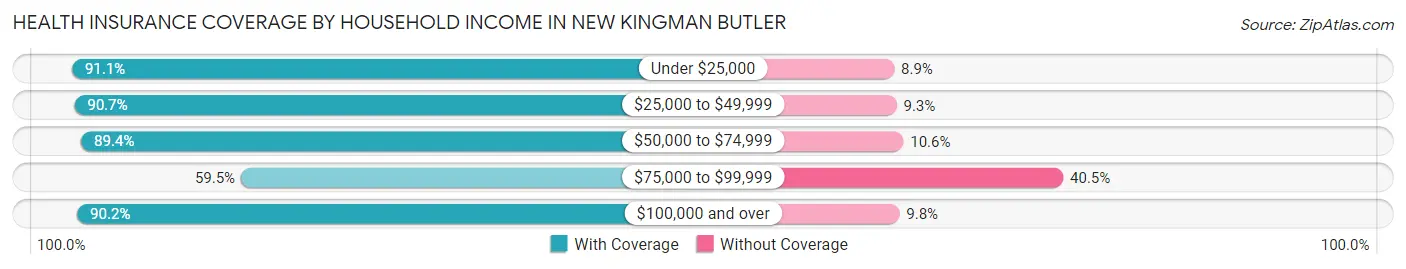
| Household Income | With Coverage | Without Coverage |
| Under $25,000 | 2,508 (91.1%) | 244 (8.9%) |
| $25,000 to $49,999 | 3,299 (90.7%) | 339 (9.3%) |
| $50,000 to $74,999 | 2,841 (89.4%) | 336 (10.6%) |
| $75,000 to $99,999 | 1,269 (59.5%) | 865 (40.5%) |
| $100,000 and over | 1,365 (90.2%) | 149 (9.8%) |
Public vs Private Health Insurance Coverage by Age in New Kingman Butler
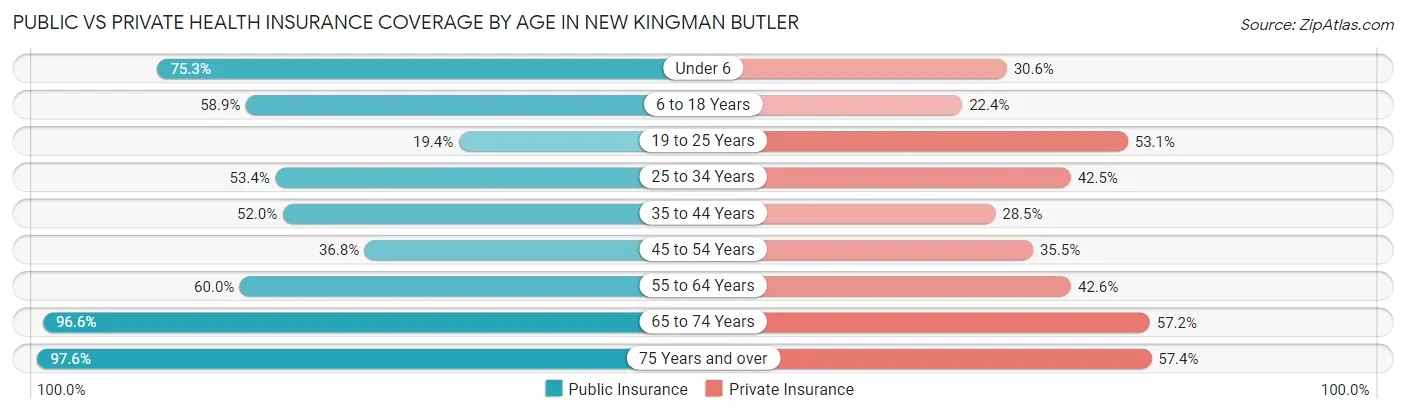
| Age Bracket | Public Insurance | Private Insurance |
| Under 6 | 571 (75.3%) | 232 (30.6%) |
| 6 to 18 Years | 1,016 (58.9%) | 386 (22.4%) |
| 19 to 25 Years | 217 (19.4%) | 595 (53.1%) |
| 25 to 34 Years | 636 (53.4%) | 506 (42.5%) |
| 35 to 44 Years | 577 (52.0%) | 316 (28.5%) |
| 45 to 54 Years | 693 (36.8%) | 668 (35.5%) |
| 55 to 64 Years | 1,132 (60.0%) | 803 (42.5%) |
| 65 to 74 Years | 1,946 (96.6%) | 1,152 (57.2%) |
| 75 Years and over | 1,502 (97.6%) | 884 (57.4%) |
| Total | 8,290 (62.7%) | 5,542 (41.9%) |
Disability Status by Sex by Age in New Kingman Butler
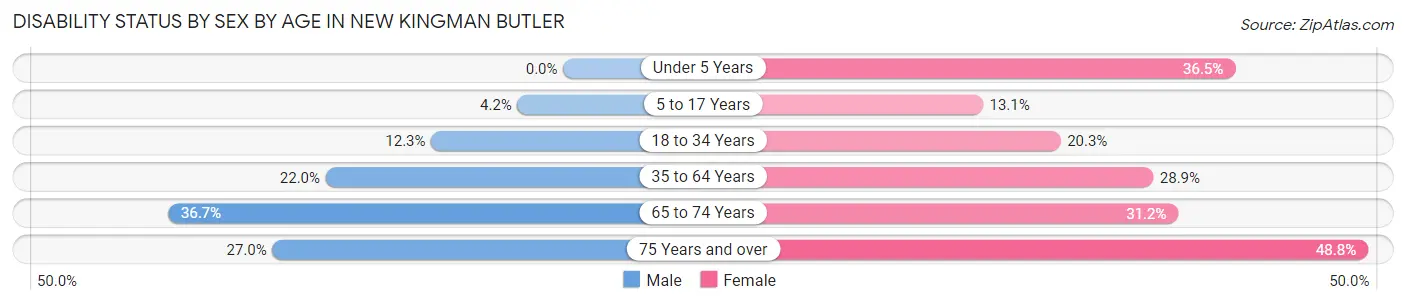
| Age Bracket | Male | Female |
| Under 5 Years | 0 (0.0%) | 119 (36.5%) |
| 5 to 17 Years | 45 (4.2%) | 67 (13.1%) |
| 18 to 34 Years | 164 (12.2%) | 243 (20.3%) |
| 35 to 64 Years | 527 (22.0%) | 718 (28.9%) |
| 65 to 74 Years | 367 (36.7%) | 317 (31.2%) |
| 75 Years and over | 207 (27.0%) | 377 (48.8%) |
Disability Class by Sex by Age in New Kingman Butler
Disability Class: Hearing Difficulty
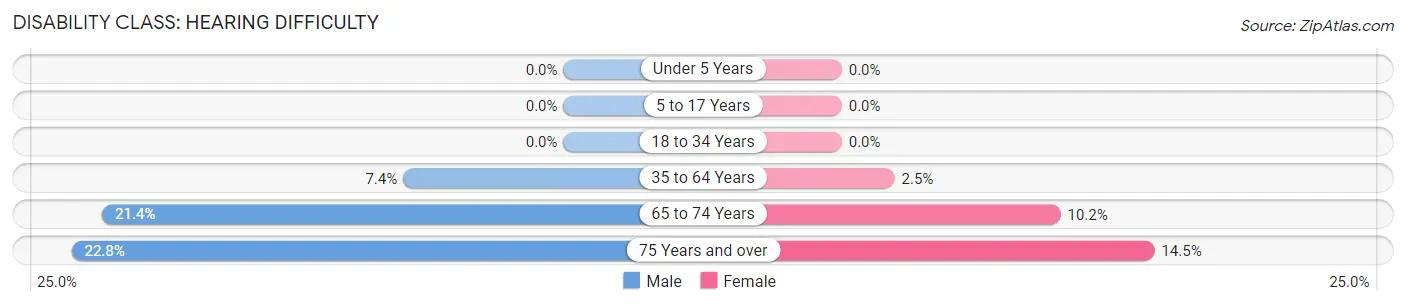
| Age Bracket | Male | Female |
| Under 5 Years | 0 (0.0%) | 0 (0.0%) |
| 5 to 17 Years | 0 (0.0%) | 0 (0.0%) |
| 18 to 34 Years | 0 (0.0%) | 0 (0.0%) |
| 35 to 64 Years | 178 (7.4%) | 61 (2.5%) |
| 65 to 74 Years | 214 (21.4%) | 103 (10.2%) |
| 75 Years and over | 175 (22.8%) | 112 (14.5%) |
Disability Class: Vision Difficulty
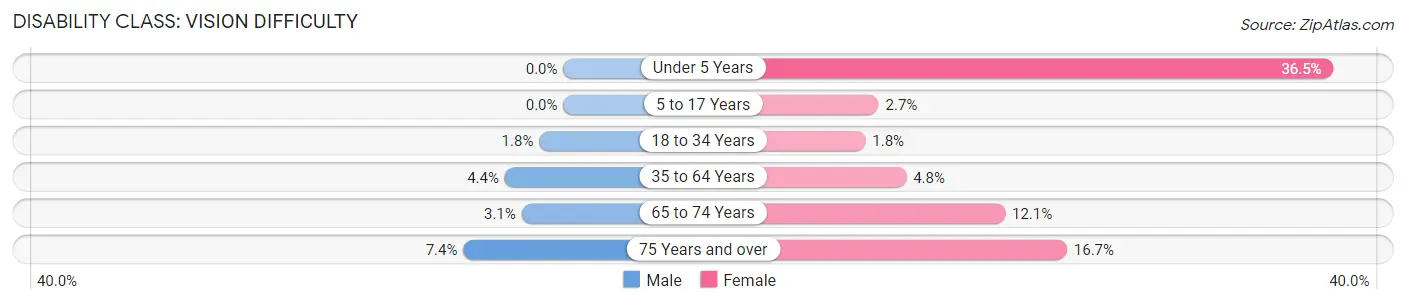
| Age Bracket | Male | Female |
| Under 5 Years | 0 (0.0%) | 119 (36.5%) |
| 5 to 17 Years | 0 (0.0%) | 14 (2.7%) |
| 18 to 34 Years | 24 (1.8%) | 21 (1.8%) |
| 35 to 64 Years | 104 (4.3%) | 119 (4.8%) |
| 65 to 74 Years | 31 (3.1%) | 123 (12.1%) |
| 75 Years and over | 57 (7.4%) | 129 (16.7%) |
Disability Class: Cognitive Difficulty
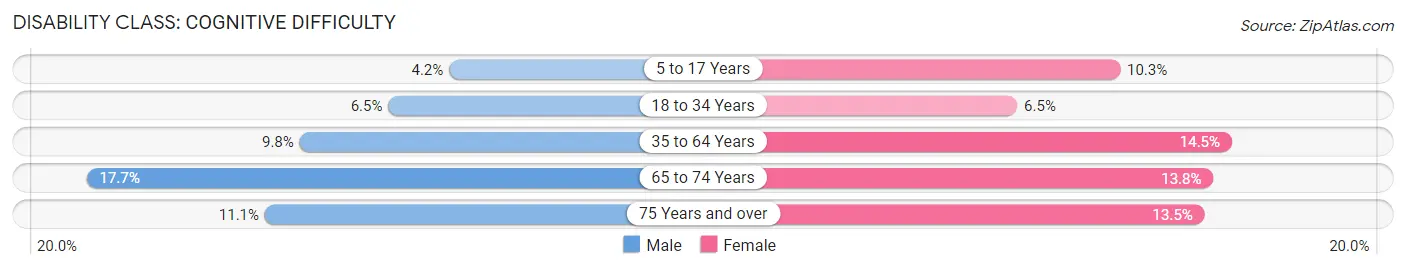
| Age Bracket | Male | Female |
| 5 to 17 Years | 45 (4.2%) | 53 (10.3%) |
| 18 to 34 Years | 87 (6.5%) | 78 (6.5%) |
| 35 to 64 Years | 234 (9.8%) | 360 (14.5%) |
| 65 to 74 Years | 177 (17.7%) | 140 (13.8%) |
| 75 Years and over | 85 (11.1%) | 104 (13.5%) |
Disability Class: Ambulatory Difficulty
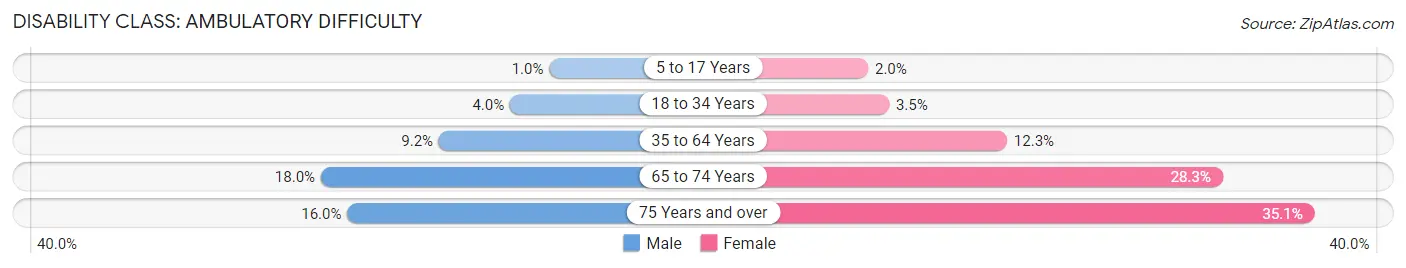
| Age Bracket | Male | Female |
| 5 to 17 Years | 11 (1.0%) | 10 (1.9%) |
| 18 to 34 Years | 53 (4.0%) | 42 (3.5%) |
| 35 to 64 Years | 221 (9.2%) | 305 (12.3%) |
| 65 to 74 Years | 180 (18.0%) | 287 (28.3%) |
| 75 Years and over | 123 (16.0%) | 271 (35.1%) |
Disability Class: Self-Care Difficulty
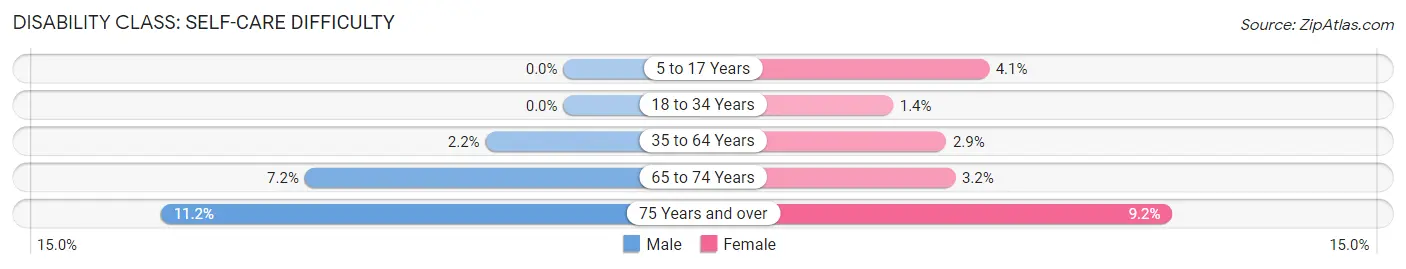
| Age Bracket | Male | Female |
| 5 to 17 Years | 0 (0.0%) | 21 (4.1%) |
| 18 to 34 Years | 0 (0.0%) | 17 (1.4%) |
| 35 to 64 Years | 52 (2.2%) | 72 (2.9%) |
| 65 to 74 Years | 72 (7.2%) | 32 (3.2%) |
| 75 Years and over | 86 (11.2%) | 71 (9.2%) |
Technology Access in New Kingman Butler
Computing Device Access in New Kingman Butler
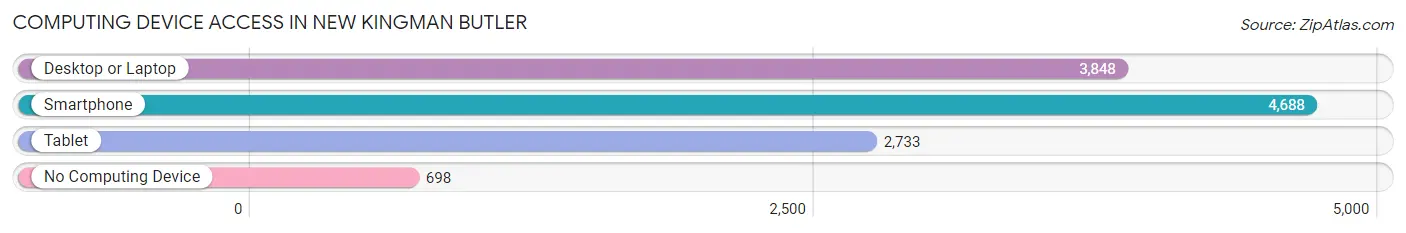
| Device Type | # Households | % Households |
| Desktop or Laptop | 3,848 | 62.8% |
| Smartphone | 4,688 | 76.5% |
| Tablet | 2,733 | 44.6% |
| No Computing Device | 698 | 11.4% |
| Total | 6,131 | 100.0% |
Internet Access in New Kingman Butler
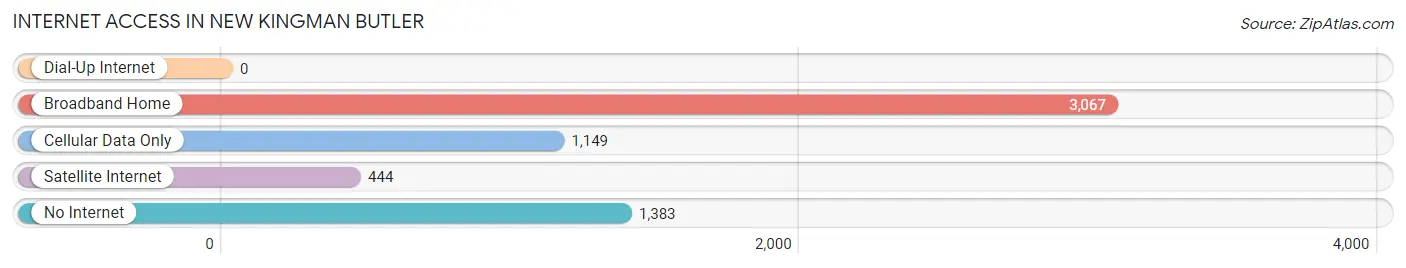
| Internet Type | # Households | % Households |
| Dial-Up Internet | 0 | 0.0% |
| Broadband Home | 3,067 | 50.0% |
| Cellular Data Only | 1,149 | 18.7% |
| Satellite Internet | 444 | 7.2% |
| No Internet | 1,383 | 22.6% |
| Total | 6,131 | 100.0% |
New Kingman Butler Summary
Kingman-Butler, Arizona is a small town located in Mohave County, Arizona. It is situated in the western part of the state, approximately 70 miles southeast of Las Vegas, Nevada. The town is named after two of its founders, William Kingman and John Butler.
Geography
Kingman-Butler is located in the western part of Arizona, in Mohave County. It is situated in the Hualapai Valley, which is surrounded by the Hualapai Mountains. The town is located at an elevation of 3,845 feet above sea level. The climate in the area is arid, with hot summers and mild winters. The average annual temperature is around 70 degrees Fahrenheit.
Demographics
As of the 2010 census, the population of Kingman-Butler was 1,845. The racial makeup of the town was 94.3% White, 0.7% African American, 0.7% Native American, 0.3% Asian, 0.1% Pacific Islander, and 3.1% from other races. The median household income was $35,938, and the median family income was $41,250.
Economy
The economy of Kingman-Butler is largely based on tourism and agriculture. The town is home to several tourist attractions, including the Kingman-Butler Museum, the Kingman-Butler Railroad Museum, and the Kingman-Butler Historic District. The town is also home to several wineries and vineyards, as well as a number of farms and ranches.
History
Kingman-Butler was founded in 1882 by William Kingman and John Butler. The town was originally known as Kingman, but the name was changed to Kingman-Butler in 1883. The town was incorporated in 1887.
In the early 1900s, Kingman-Butler was a thriving mining town. The town was home to several mines, including the Kingman Mine, the Butler Mine, and the Kingman-Butler Mine. The town was also home to several smelters, which processed ore from the mines.
In the late 1900s, the mining industry in Kingman-Butler began to decline. The town shifted its focus to tourism and agriculture. Today, Kingman-Butler is a popular tourist destination, and the town is home to several wineries and vineyards.
Conclusion
Kingman-Butler, Arizona is a small town located in Mohave County, Arizona. It is situated in the western part of the state, approximately 70 miles southeast of Las Vegas, Nevada. The town is named after two of its founders, William Kingman and John Butler. The population of Kingman-Butler was 1,845 as of the 2010 census. The economy of the town is largely based on tourism and agriculture. The town is home to several tourist attractions, wineries, and vineyards. Kingman-Butler was founded in 1882 and was originally known as Kingman. The town was incorporated in 1887 and was once a thriving mining town. Today, the town is a popular tourist destination.
Common Questions
What is Per Capita Income in New Kingman Butler?
Per Capita income in New Kingman Butler is $24,267.
What is the Median Family Income in New Kingman Butler?
Median Family Income in New Kingman Butler is $51,832.
What is the Median Household income in New Kingman Butler?
Median Household Income in New Kingman Butler is $42,541.
What is Income or Wage Gap in New Kingman Butler?
Income or Wage Gap in New Kingman Butler is 19.8%.
Women in New Kingman Butler earn 80.2 cents for every dollar earned by a man.
What is Family Income Deficit in New Kingman Butler?
Family Income Deficit in New Kingman Butler is $11,144.
Families that are below poverty line in New Kingman Butler earn $11,144 less on average than the poverty threshold level.
What is Inequality or Gini Index in New Kingman Butler?
Inequality or Gini Index in New Kingman Butler is 0.41.
What is the Total Population of New Kingman Butler?
Total Population of New Kingman Butler is 13,247.
What is the Total Male Population of New Kingman Butler?
Total Male Population of New Kingman Butler is 6,935.
What is the Total Female Population of New Kingman Butler?
Total Female Population of New Kingman Butler is 6,312.
What is the Ratio of Males per 100 Females in New Kingman Butler?
There are 109.87 Males per 100 Females in New Kingman Butler.
What is the Ratio of Females per 100 Males in New Kingman Butler?
There are 91.02 Females per 100 Males in New Kingman Butler.
What is the Median Population Age in New Kingman Butler?
Median Population Age in New Kingman Butler is 48.8 Years.
What is the Average Family Size in New Kingman Butler
Average Family Size in New Kingman Butler is 2.7 People.
What is the Average Household Size in New Kingman Butler
Average Household Size in New Kingman Butler is 2.2 People.
How Large is the Labor Force in New Kingman Butler?
There are 5,175 People in the Labor Forcein in New Kingman Butler.
What is the Percentage of People in the Labor Force in New Kingman Butler?
46.0% of People are in the Labor Force in New Kingman Butler.
What is the Unemployment Rate in New Kingman Butler?
Unemployment Rate in New Kingman Butler is 3.4%.