Leupp, AZ Map & Demographics
Leupp Map
Leupp Overview
$15,686
PER CAPITA INCOME
$48,333
AVG FAMILY INCOME
$47,083
AVG HOUSEHOLD INCOME
4.3%
WAGE / INCOME GAP [ % ]
95.7¢/ $1
WAGE / INCOME GAP [ $ ]
0.41
INEQUALITY / GINI INDEX
1,179
TOTAL POPULATION
518
MALE POPULATION
661
FEMALE POPULATION
78.37
MALES / 100 FEMALES
127.61
FEMALES / 100 MALES
30.8
MEDIAN AGE
4.6
AVG FAMILY SIZE
4.2
AVG HOUSEHOLD SIZE
482
LABOR FORCE [ PEOPLE ]
57.8%
PERCENT IN LABOR FORCE
12.9%
UNEMPLOYMENT RATE
Leupp Zip Codes
Leupp Area Codes
Income in Leupp
Income Overview in Leupp
Per Capita Income in Leupp is $15,686, while median incomes of families and households are $48,333 and $47,083 respectively.
| Characteristic | Number | Measure |
| Per Capita Income | 1,179 | $15,686 |
| Median Family Income | 248 | $48,333 |
| Mean Family Income | 248 | $68,158 |
| Median Household Income | 278 | $47,083 |
| Mean Household Income | 278 | $64,565 |
| Income Deficit | 248 | $0 |
| Wage / Income Gap (%) | 1,179 | 4.26% |
| Wage / Income Gap ($) | 1,179 | 95.74¢ per $1 |
| Gini / Inequality Index | 1,179 | 0.41 |
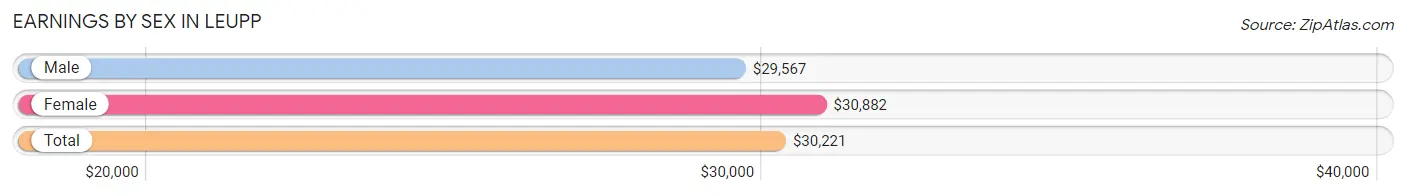
Earnings by Sex in Leupp
Average Earnings in Leupp are $30,221, $29,567 for men and $30,882 for women, a difference of 4.3%.
| Sex | Number | Average Earnings |
| Male | 255 (55.6%) | $29,567 |
| Female | 204 (44.4%) | $30,882 |
| Total | 459 (100.0%) | $30,221 |
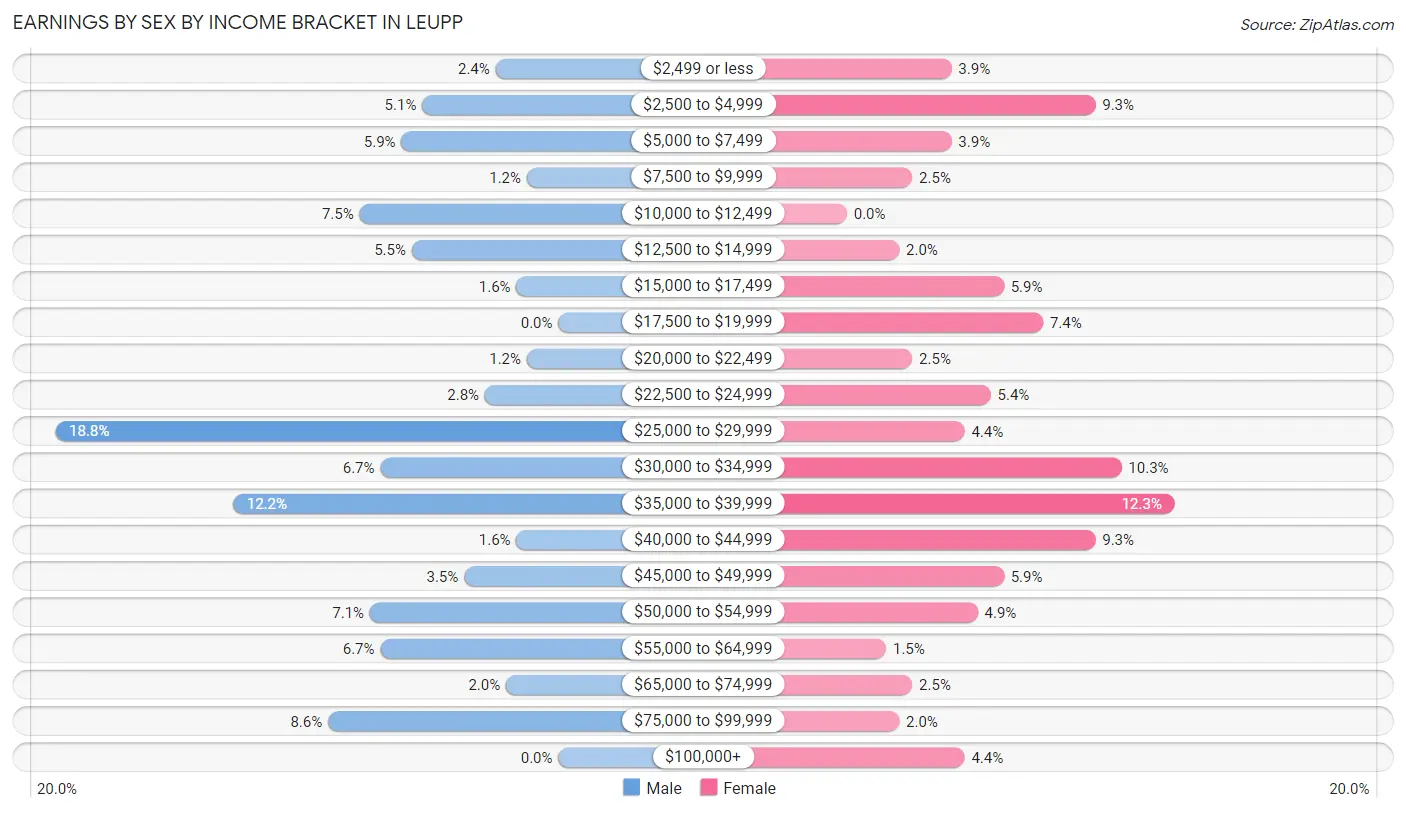
Earnings by Sex by Income Bracket in Leupp
The most common earnings brackets in Leupp are $25,000 to $29,999 for men (48 | 18.8%) and $35,000 to $39,999 for women (25 | 12.2%).
| Income | Male | Female |
| $2,499 or less | 6 (2.4%) | 8 (3.9%) |
| $2,500 to $4,999 | 13 (5.1%) | 19 (9.3%) |
| $5,000 to $7,499 | 15 (5.9%) | 8 (3.9%) |
| $7,500 to $9,999 | 3 (1.2%) | 5 (2.5%) |
| $10,000 to $12,499 | 19 (7.4%) | 0 (0.0%) |
| $12,500 to $14,999 | 14 (5.5%) | 4 (2.0%) |
| $15,000 to $17,499 | 4 (1.6%) | 12 (5.9%) |
| $17,500 to $19,999 | 0 (0.0%) | 15 (7.3%) |
| $20,000 to $22,499 | 3 (1.2%) | 5 (2.5%) |
| $22,500 to $24,999 | 7 (2.8%) | 11 (5.4%) |
| $25,000 to $29,999 | 48 (18.8%) | 9 (4.4%) |
| $30,000 to $34,999 | 17 (6.7%) | 21 (10.3%) |
| $35,000 to $39,999 | 31 (12.2%) | 25 (12.2%) |
| $40,000 to $44,999 | 4 (1.6%) | 19 (9.3%) |
| $45,000 to $49,999 | 9 (3.5%) | 12 (5.9%) |
| $50,000 to $54,999 | 18 (7.1%) | 10 (4.9%) |
| $55,000 to $64,999 | 17 (6.7%) | 3 (1.5%) |
| $65,000 to $74,999 | 5 (2.0%) | 5 (2.5%) |
| $75,000 to $99,999 | 22 (8.6%) | 4 (2.0%) |
| $100,000+ | 0 (0.0%) | 9 (4.4%) |
| Total | 255 (100.0%) | 204 (100.0%) |
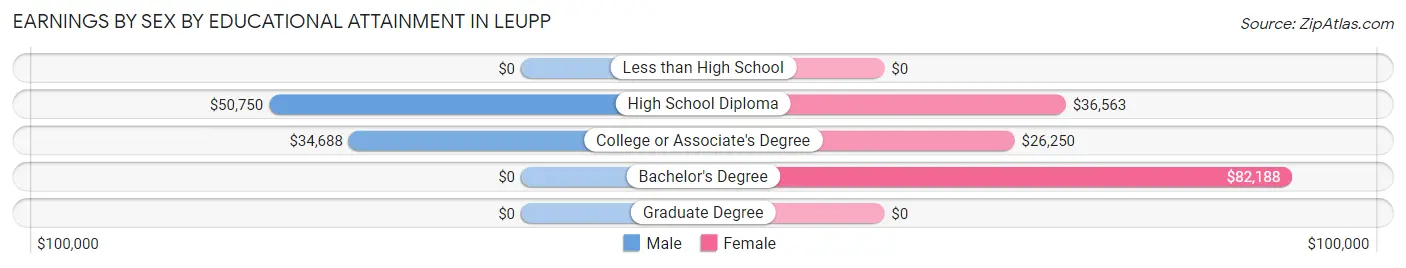
Earnings by Sex by Educational Attainment in Leupp
Average earnings in Leupp are $33,000 for men and $32,813 for women, a difference of 0.6%. Men with an educational attainment of high school diploma enjoy the highest average annual earnings of $50,750, while those with college or associate's degree education earn the least with $34,688. Women with an educational attainment of bachelor's degree earn the most with the average annual earnings of $82,188, while those with college or associate's degree education have the smallest earnings of $26,250.
| Educational Attainment | Male Income | Female Income |
| Less than High School | - | - |
| High School Diploma | $50,750 | $36,563 |
| College or Associate's Degree | $34,688 | $26,250 |
| Bachelor's Degree | - | - |
| Graduate Degree | - | - |
| Total | $33,000 | $32,813 |
Family Income in Leupp
Family Income Brackets in Leupp
According to the Leupp family income data, there are 50 families falling into the $25,000 to $34,999 income range, which is the most common income bracket and makes up 20.2% of all families. Conversely, the $10,000 to $14,999 income bracket is the least frequent group with only 4 families (1.6%) belonging to this category.
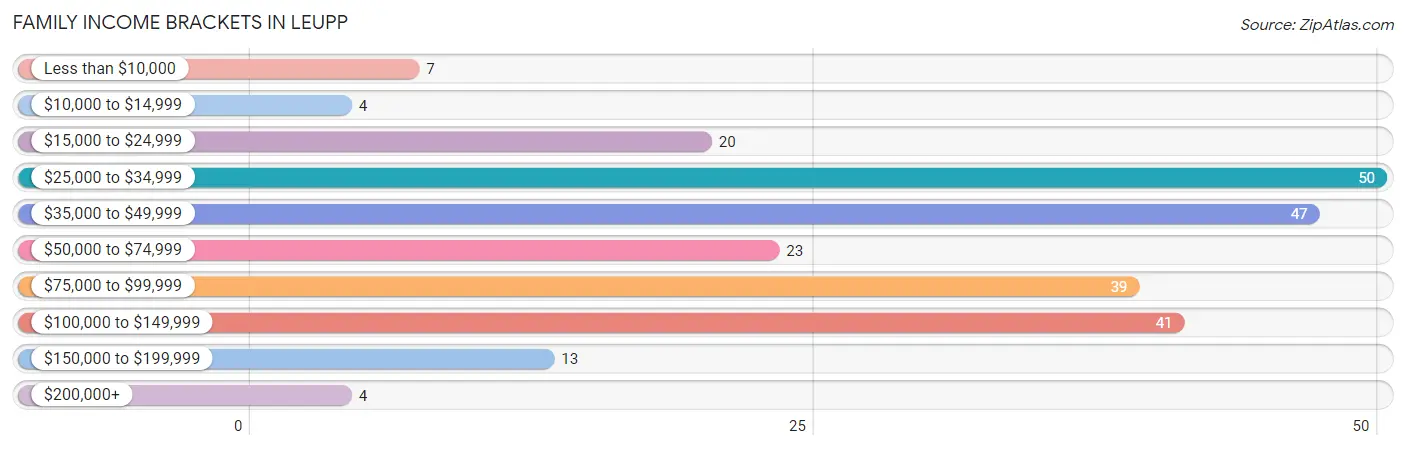
| Income Bracket | # Families | % Families |
| Less than $10,000 | 7 | 2.8% |
| $10,000 to $14,999 | 4 | 1.6% |
| $15,000 to $24,999 | 20 | 8.1% |
| $25,000 to $34,999 | 50 | 20.2% |
| $35,000 to $49,999 | 47 | 19.0% |
| $50,000 to $74,999 | 23 | 9.3% |
| $75,000 to $99,999 | 39 | 15.7% |
| $100,000 to $149,999 | 41 | 16.5% |
| $150,000 to $199,999 | 13 | 5.2% |
| $200,000+ | 4 | 1.6% |
Family Income by Famaliy Size in Leupp
5-person families (32 | 12.9%) account for the highest median family income in Leupp with $81,667 per family, while 3-person families (62 | 25.0%) have the highest median income of $18,788 per family member.
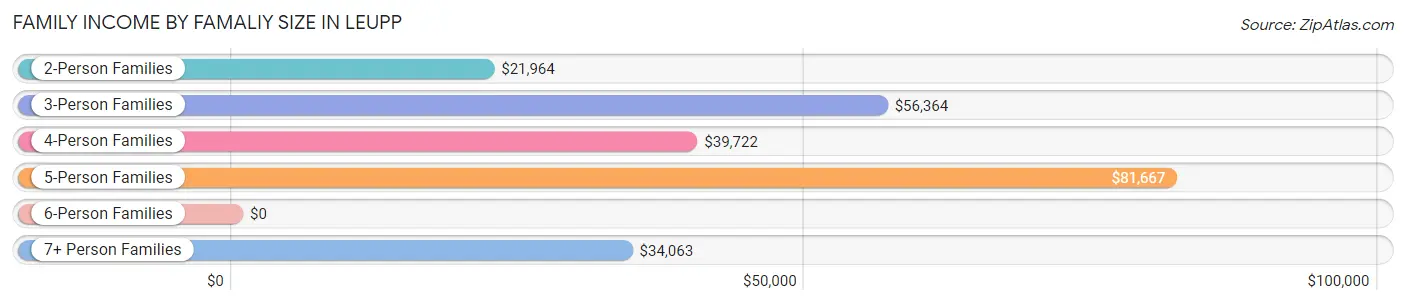
| Income Bracket | # Families | Median Income |
| 2-Person Families | 38 (15.3%) | $21,964 |
| 3-Person Families | 62 (25.0%) | $56,364 |
| 4-Person Families | 56 (22.6%) | $39,722 |
| 5-Person Families | 32 (12.9%) | $81,667 |
| 6-Person Families | 40 (16.1%) | $0 |
| 7+ Person Families | 20 (8.1%) | $34,063 |
| Total | 248 (100.0%) | $48,333 |
Family Income by Number of Earners in Leupp
The median family income in Leupp is $48,333, with families comprising 3+ earners (66) having the highest median family income of $109,500, while families with no earners (37) have the lowest median family income of $21,172, accounting for 26.6% and 14.9% of families, respectively.
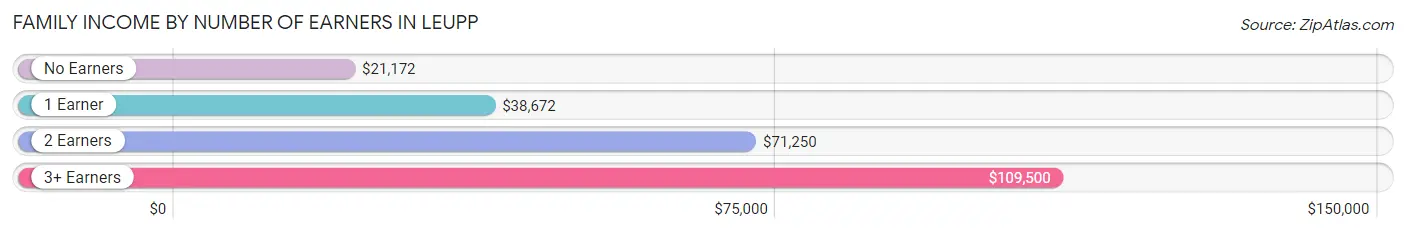
| Number of Earners | # Families | Median Income |
| No Earners | 37 (14.9%) | $21,172 |
| 1 Earner | 87 (35.1%) | $38,672 |
| 2 Earners | 58 (23.4%) | $71,250 |
| 3+ Earners | 66 (26.6%) | $109,500 |
| Total | 248 (100.0%) | $48,333 |
Household Income in Leupp
Household Income Brackets in Leupp
With 52 households falling in the category, the $25,000 to $34,999 income range is the most frequent in Leupp, accounting for 18.7% of all households. In contrast, only 4 households (1.4%) fall into the $200,000+ income bracket, making it the least populous group.
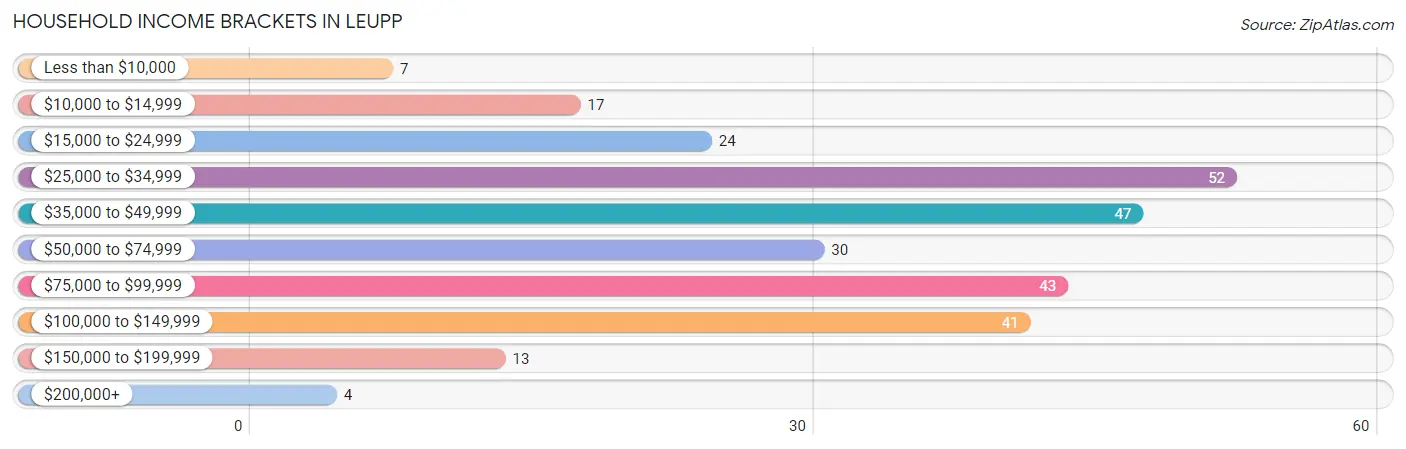
| Income Bracket | # Households | % Households |
| Less than $10,000 | 7 | 2.5% |
| $10,000 to $14,999 | 17 | 6.1% |
| $15,000 to $24,999 | 24 | 8.6% |
| $25,000 to $34,999 | 52 | 18.7% |
| $35,000 to $49,999 | 47 | 16.9% |
| $50,000 to $74,999 | 30 | 10.8% |
| $75,000 to $99,999 | 43 | 15.5% |
| $100,000 to $149,999 | 41 | 14.7% |
| $150,000 to $199,999 | 13 | 4.7% |
| $200,000+ | 4 | 1.4% |
Household Income by Householder Age in Leupp
The median household income in Leupp is $47,083, with the highest median household income of $78,571 found in the 25 to 44 years age bracket for the primary householder. A total of 76 households (27.3%) fall into this category. Meanwhile, the 15 to 24 years age bracket for the primary householder has the lowest median household income of $0, with 7 households (2.5%) in this group.
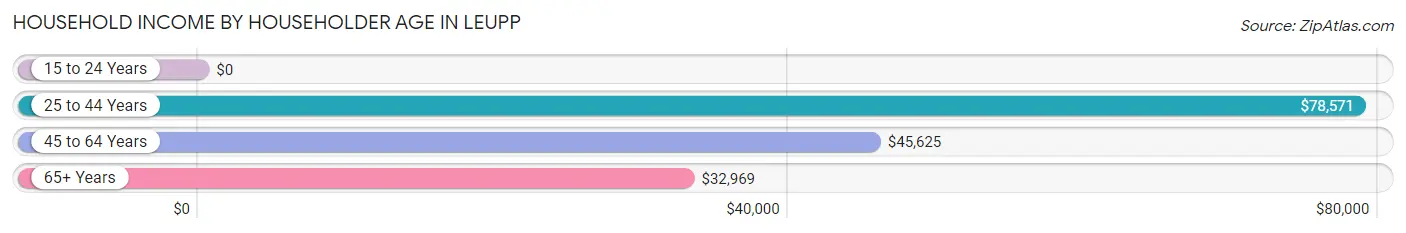
| Income Bracket | # Households | Median Income |
| 15 to 24 Years | 7 (2.5%) | $0 |
| 25 to 44 Years | 76 (27.3%) | $78,571 |
| 45 to 64 Years | 116 (41.7%) | $45,625 |
| 65+ Years | 79 (28.4%) | $32,969 |
| Total | 278 (100.0%) | $47,083 |
Poverty in Leupp
Income Below Poverty by Sex and Age in Leupp
With 29.8% poverty level for males and 25.5% for females among the residents of Leupp, 15 year old males and 6 to 11 year old females are the most vulnerable to poverty, with 6 males (50.0%) and 27 females (60.0%) in their respective age groups living below the poverty level.
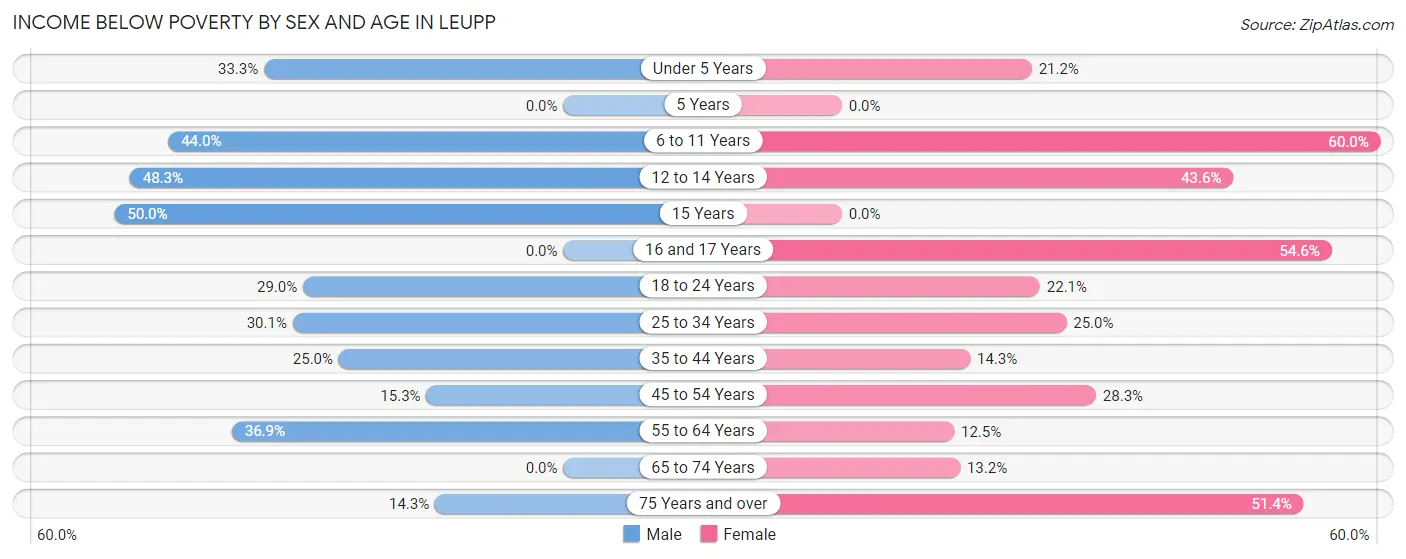
| Age Bracket | Male | Female |
| Under 5 Years | 4 (33.3%) | 22 (21.1%) |
| 5 Years | 0 (0.0%) | 0 (0.0%) |
| 6 to 11 Years | 33 (44.0%) | 27 (60.0%) |
| 12 to 14 Years | 14 (48.3%) | 17 (43.6%) |
| 15 Years | 6 (50.0%) | 0 (0.0%) |
| 16 and 17 Years | 0 (0.0%) | 6 (54.5%) |
| 18 to 24 Years | 20 (29.0%) | 15 (22.1%) |
| 25 to 34 Years | 22 (30.1%) | 20 (25.0%) |
| 35 to 44 Years | 18 (25.0%) | 13 (14.3%) |
| 45 to 54 Years | 9 (15.2%) | 15 (28.3%) |
| 55 to 64 Years | 24 (36.9%) | 9 (12.5%) |
| 65 to 74 Years | 0 (0.0%) | 5 (13.2%) |
| 75 Years and over | 3 (14.3%) | 18 (51.4%) |
| Total | 153 (29.8%) | 167 (25.5%) |
Income Above Poverty by Sex and Age in Leupp
According to the poverty statistics in Leupp, males aged 16 and 17 years and females aged 5 years are the age groups that are most secure financially, with 100.0% of males and 100.0% of females in these age groups living above the poverty line.
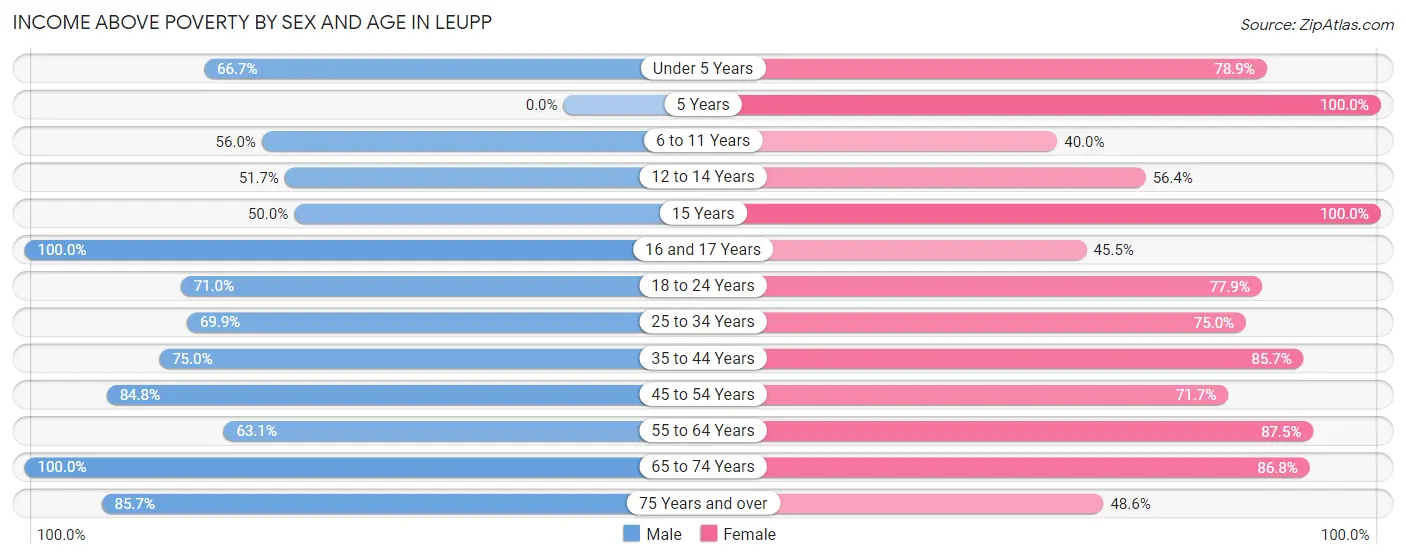
| Age Bracket | Male | Female |
| Under 5 Years | 8 (66.7%) | 82 (78.8%) |
| 5 Years | 0 (0.0%) | 11 (100.0%) |
| 6 to 11 Years | 42 (56.0%) | 18 (40.0%) |
| 12 to 14 Years | 15 (51.7%) | 22 (56.4%) |
| 15 Years | 6 (50.0%) | 8 (100.0%) |
| 16 and 17 Years | 11 (100.0%) | 5 (45.5%) |
| 18 to 24 Years | 49 (71.0%) | 53 (77.9%) |
| 25 to 34 Years | 51 (69.9%) | 60 (75.0%) |
| 35 to 44 Years | 54 (75.0%) | 78 (85.7%) |
| 45 to 54 Years | 50 (84.8%) | 38 (71.7%) |
| 55 to 64 Years | 41 (63.1%) | 63 (87.5%) |
| 65 to 74 Years | 16 (100.0%) | 33 (86.8%) |
| 75 Years and over | 18 (85.7%) | 17 (48.6%) |
| Total | 361 (70.2%) | 488 (74.5%) |
Income Below Poverty Among Married-Couple Families in Leupp
The poverty statistics for married-couple families in Leupp show that 20.7% or 31 of the total 150 families live below the poverty line. Families with 5 or more children have the highest poverty rate of 55.6%, comprising of 5 families. On the other hand, families with no children have the lowest poverty rate of 3.9%, which includes 2 families.
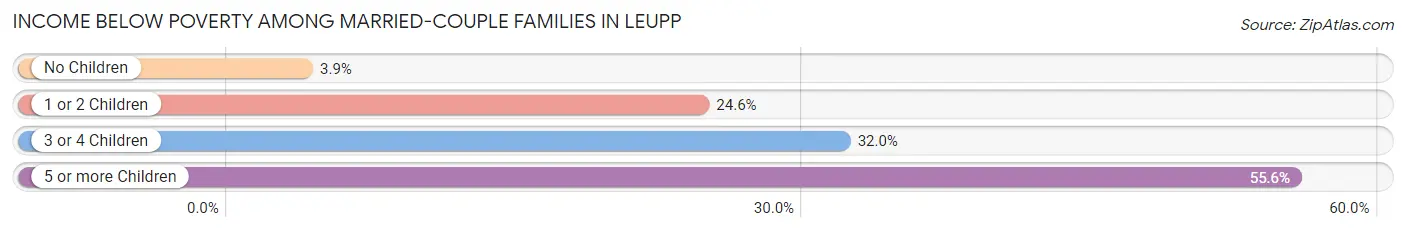
| Children | Above Poverty | Below Poverty |
| No Children | 49 (96.1%) | 2 (3.9%) |
| 1 or 2 Children | 49 (75.4%) | 16 (24.6%) |
| 3 or 4 Children | 17 (68.0%) | 8 (32.0%) |
| 5 or more Children | 4 (44.4%) | 5 (55.6%) |
| Total | 119 (79.3%) | 31 (20.7%) |
Income Below Poverty Among Single-Parent Households in Leupp
According to the poverty data in Leupp, 28.0% or 7 single-father households and 27.4% or 20 single-mother households are living below the poverty line. Among single-father households, those with 1 or 2 children have the highest poverty rate, with 7 households (53.8%) experiencing poverty. Likewise, among single-mother households, those with 3 or 4 children have the highest poverty rate, with 7 households (50.0%) falling below the poverty line.
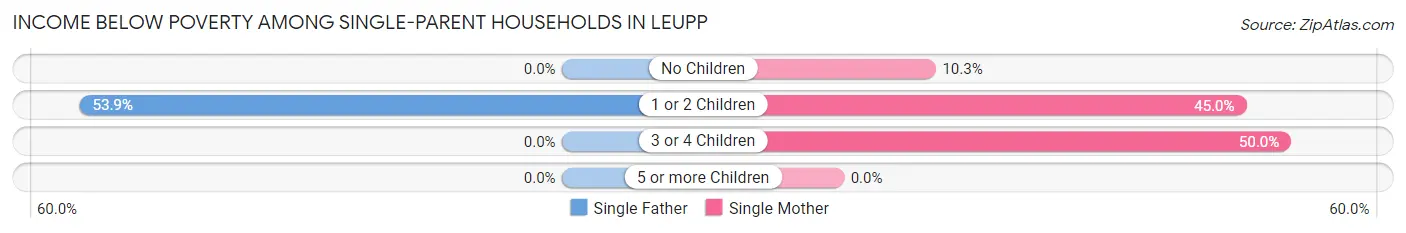
| Children | Single Father | Single Mother |
| No Children | 0 (0.0%) | 4 (10.3%) |
| 1 or 2 Children | 7 (53.8%) | 9 (45.0%) |
| 3 or 4 Children | 0 (0.0%) | 7 (50.0%) |
| 5 or more Children | 0 (0.0%) | 0 (0.0%) |
| Total | 7 (28.0%) | 20 (27.4%) |
Income Below Poverty Among Married-Couple vs Single-Parent Households in Leupp
The poverty data for Leupp shows that 31 of the married-couple family households (20.7%) and 27 of the single-parent households (27.6%) are living below the poverty level. Within the married-couple family households, those with 5 or more children have the highest poverty rate, with 5 households (55.6%) falling below the poverty line. Among the single-parent households, those with 3 or 4 children have the highest poverty rate, with 7 household (50.0%) living below poverty.
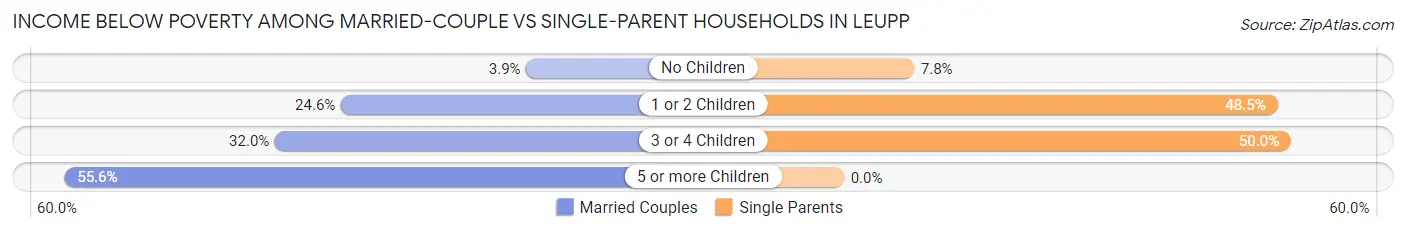
| Children | Married-Couple Families | Single-Parent Households |
| No Children | 2 (3.9%) | 4 (7.8%) |
| 1 or 2 Children | 16 (24.6%) | 16 (48.5%) |
| 3 or 4 Children | 8 (32.0%) | 7 (50.0%) |
| 5 or more Children | 5 (55.6%) | 0 (0.0%) |
| Total | 31 (20.7%) | 27 (27.6%) |
Race in Leupp
The most populous races in Leupp are Native / Alaskan (1,070 | 90.7%), Two or more Races (94 | 8.0%), and White / Caucasian (8 | 0.7%).
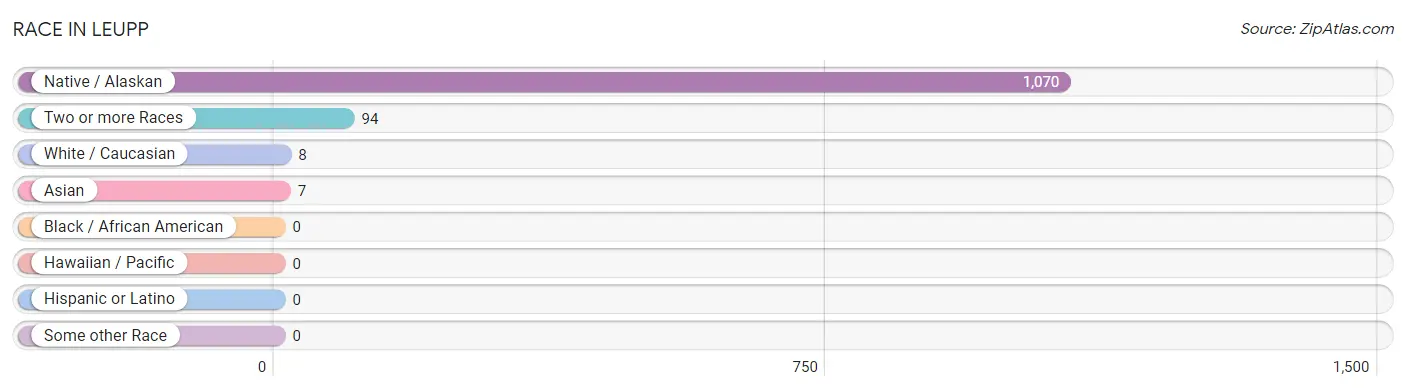
| Race | # Population | % Population |
| Asian | 7 | 0.6% |
| Black / African American | 0 | 0.0% |
| Hawaiian / Pacific | 0 | 0.0% |
| Hispanic or Latino | 0 | 0.0% |
| Native / Alaskan | 1,070 | 90.7% |
| White / Caucasian | 8 | 0.7% |
| Two or more Races | 94 | 8.0% |
| Some other Race | 0 | 0.0% |
| Total | 1,179 | 100.0% |
Ancestry in Leupp
The most populous ancestries reported in Leupp are Navajo (1,155 | 98.0%), Korean (34 | 2.9%), Burmese (32 | 2.7%), Pima (18 | 1.5%), and Hopi (17 | 1.4%), together accounting for 106.5% of all Leupp residents.
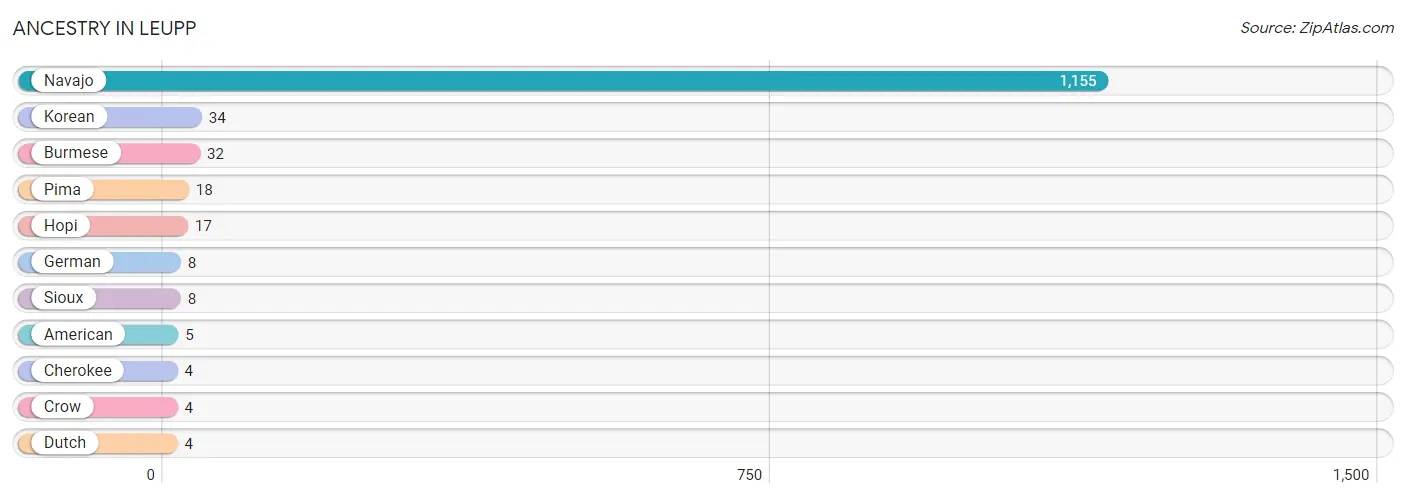
| Ancestry | # Population | % Population |
| American | 5 | 0.4% |
| Burmese | 32 | 2.7% |
| Cherokee | 4 | 0.3% |
| Crow | 4 | 0.3% |
| Dutch | 4 | 0.3% |
| German | 8 | 0.7% |
| Hopi | 17 | 1.4% |
| Korean | 34 | 2.9% |
| Navajo | 1,155 | 98.0% |
| Pima | 18 | 1.5% |
| Sioux | 8 | 0.7% | View All 11 Rows |
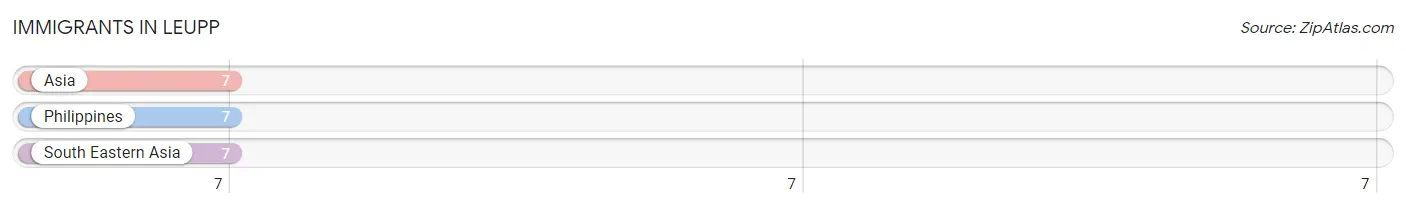
Immigrants in Leupp
The most numerous immigrant groups reported in Leupp came from Asia (7 | 0.6%), Philippines (7 | 0.6%), and South Eastern Asia (7 | 0.6%), together accounting for 1.8% of all Leupp residents.
| Immigration Origin | # Population | % Population |
| Asia | 7 | 0.6% |
| Philippines | 7 | 0.6% |
| South Eastern Asia | 7 | 0.6% | View All 3 Rows |
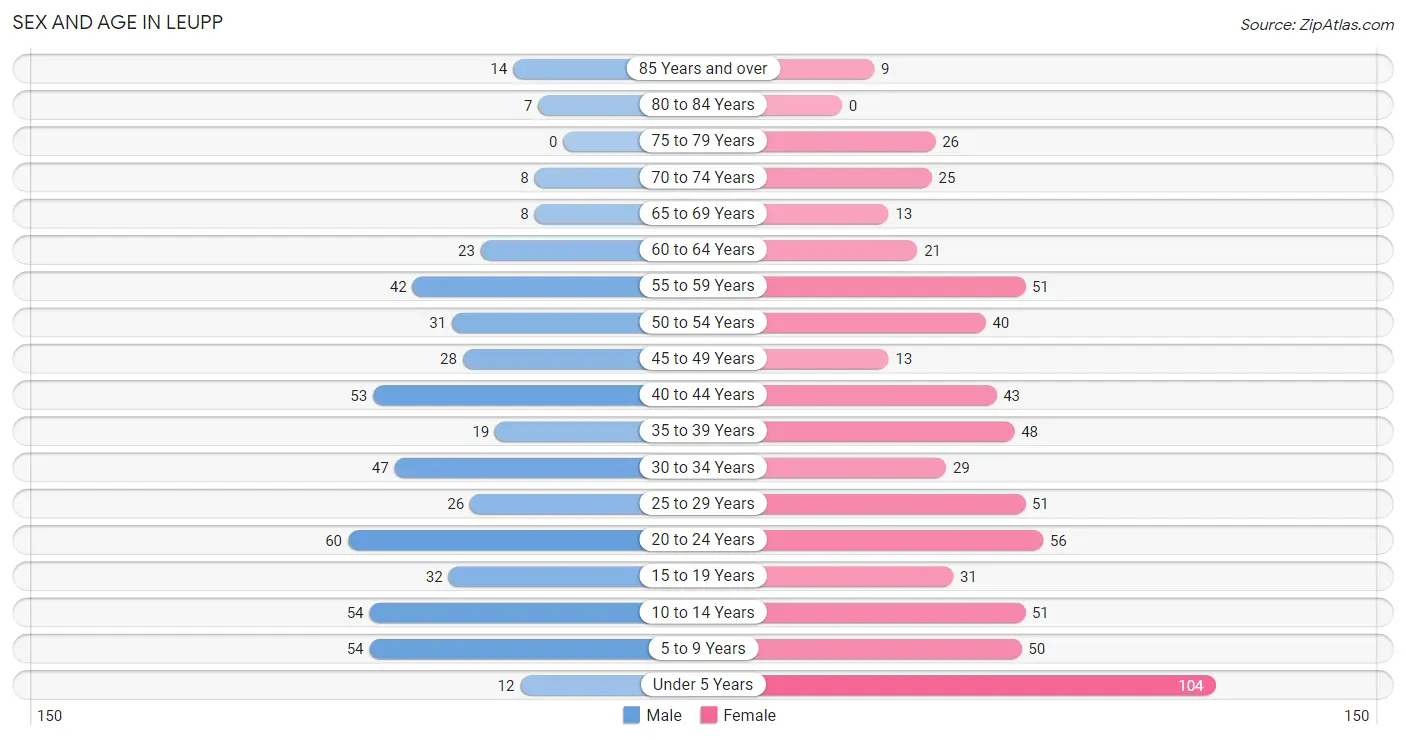
Sex and Age in Leupp
Sex and Age in Leupp
The most populous age groups in Leupp are 20 to 24 Years (60 | 11.6%) for men and Under 5 Years (104 | 15.7%) for women.
| Age Bracket | Male | Female |
| Under 5 Years | 12 (2.3%) | 104 (15.7%) |
| 5 to 9 Years | 54 (10.4%) | 50 (7.6%) |
| 10 to 14 Years | 54 (10.4%) | 51 (7.7%) |
| 15 to 19 Years | 32 (6.2%) | 31 (4.7%) |
| 20 to 24 Years | 60 (11.6%) | 56 (8.5%) |
| 25 to 29 Years | 26 (5.0%) | 51 (7.7%) |
| 30 to 34 Years | 47 (9.1%) | 29 (4.4%) |
| 35 to 39 Years | 19 (3.7%) | 48 (7.3%) |
| 40 to 44 Years | 53 (10.2%) | 43 (6.5%) |
| 45 to 49 Years | 28 (5.4%) | 13 (2.0%) |
| 50 to 54 Years | 31 (6.0%) | 40 (6.0%) |
| 55 to 59 Years | 42 (8.1%) | 51 (7.7%) |
| 60 to 64 Years | 23 (4.4%) | 21 (3.2%) |
| 65 to 69 Years | 8 (1.5%) | 13 (2.0%) |
| 70 to 74 Years | 8 (1.5%) | 25 (3.8%) |
| 75 to 79 Years | 0 (0.0%) | 26 (3.9%) |
| 80 to 84 Years | 7 (1.3%) | 0 (0.0%) |
| 85 Years and over | 14 (2.7%) | 9 (1.4%) |
| Total | 518 (100.0%) | 661 (100.0%) |
Families and Households in Leupp
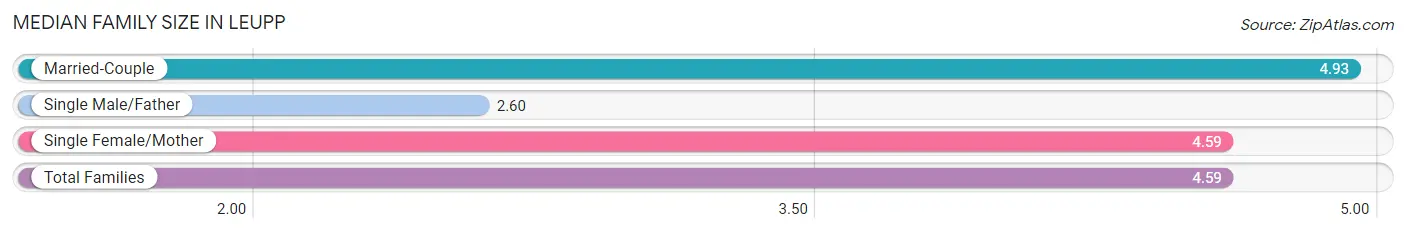
Median Family Size in Leupp
The median family size in Leupp is 4.59 persons per family, with married-couple families (150 | 60.5%) accounting for the largest median family size of 4.93 persons per family. On the other hand, single male/father families (25 | 10.1%) represent the smallest median family size with 2.60 persons per family.
| Family Type | # Families | Family Size |
| Married-Couple | 150 (60.5%) | 4.93 |
| Single Male/Father | 25 (10.1%) | 2.60 |
| Single Female/Mother | 73 (29.4%) | 4.59 |
| Total Families | 248 (100.0%) | 4.59 |
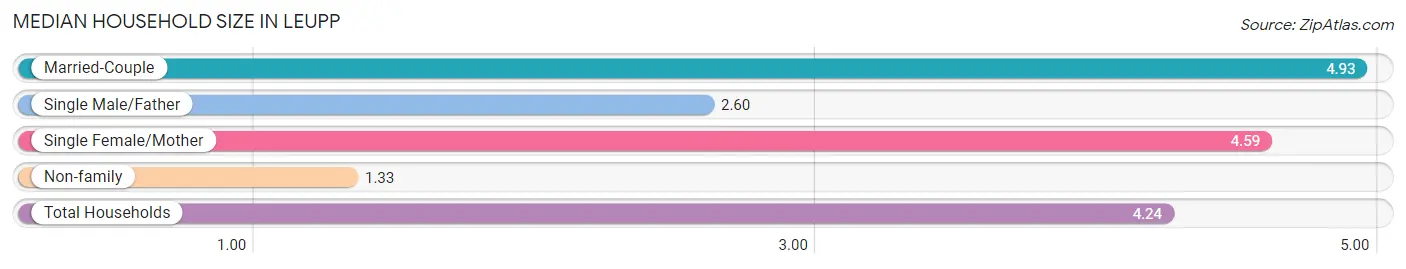
Median Household Size in Leupp
The median household size in Leupp is 4.24 persons per household, with married-couple households (150 | 54.0%) accounting for the largest median household size of 4.93 persons per household. non-family households (30 | 10.8%) represent the smallest median household size with 1.33 persons per household.
| Household Type | # Households | Household Size |
| Married-Couple | 150 (54.0%) | 4.93 |
| Single Male/Father | 25 (9.0%) | 2.60 |
| Single Female/Mother | 73 (26.3%) | 4.59 |
| Non-family | 30 (10.8%) | 1.33 |
| Total Households | 278 (100.0%) | 4.24 |
Household Size by Marriage Status in Leupp
Out of a total of 278 households in Leupp, 248 (89.2%) are family households, while 30 (10.8%) are nonfamily households. The most numerous type of family households are 3-person households, comprising 62, and the most common type of nonfamily households are 1-person households, comprising 26.
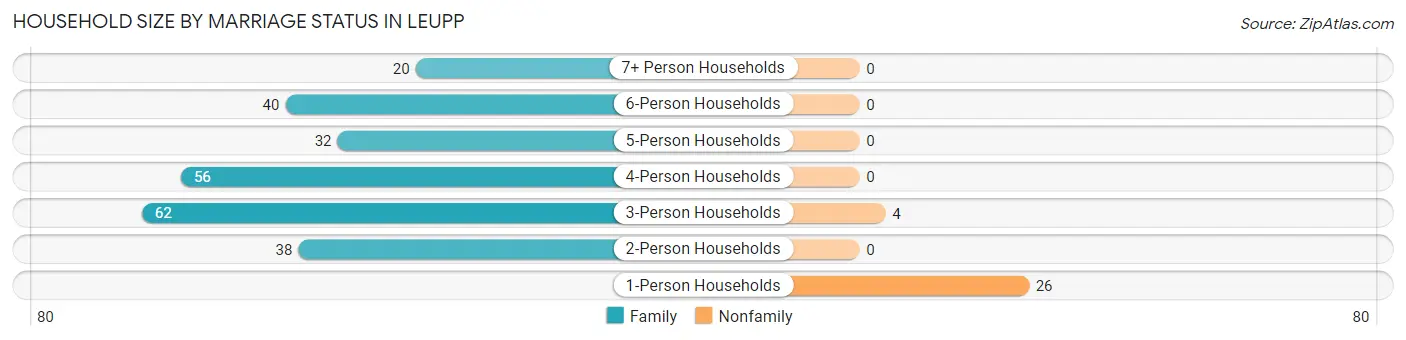
| Household Size | Family Households | Nonfamily Households |
| 1-Person Households | - | 26 (9.3%) |
| 2-Person Households | 38 (13.7%) | 0 (0.0%) |
| 3-Person Households | 62 (22.3%) | 4 (1.4%) |
| 4-Person Households | 56 (20.1%) | 0 (0.0%) |
| 5-Person Households | 32 (11.5%) | 0 (0.0%) |
| 6-Person Households | 40 (14.4%) | 0 (0.0%) |
| 7+ Person Households | 20 (7.2%) | 0 (0.0%) |
| Total | 248 (89.2%) | 30 (10.8%) |
Female Fertility in Leupp
Fertility by Age in Leupp
Average fertility rate in Leupp is 73.0 births per 1,000 women. Women in the age bracket of 20 to 34 years have the highest fertility rate with 147.0 births per 1,000 women. Women in the age bracket of 20 to 34 years acount for 100.0% of all women with births.
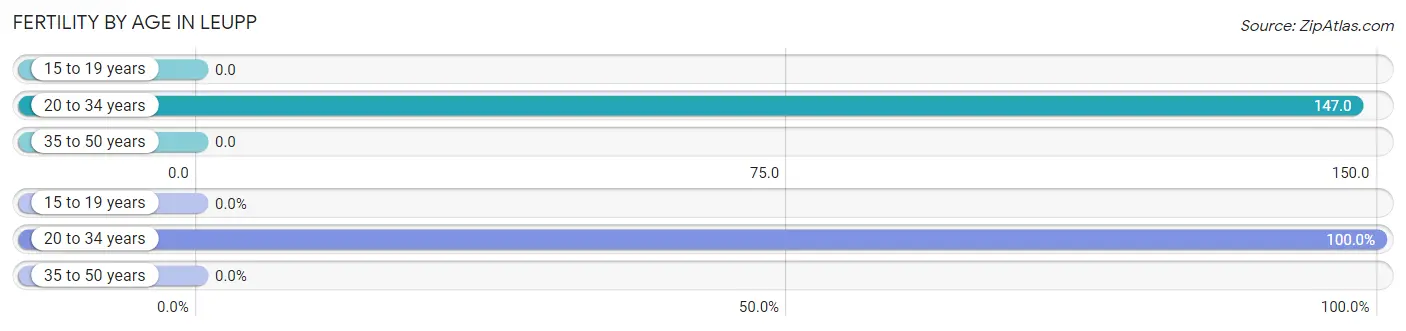
| Age Bracket | Women with Births | Births / 1,000 Women |
| 15 to 19 years | 0 (0.0%) | 0.0 |
| 20 to 34 years | 20 (100.0%) | 147.0 |
| 35 to 50 years | 0 (0.0%) | 0.0 |
| Total | 20 (100.0%) | 73.0 |
Fertility by Age by Marriage Status in Leupp
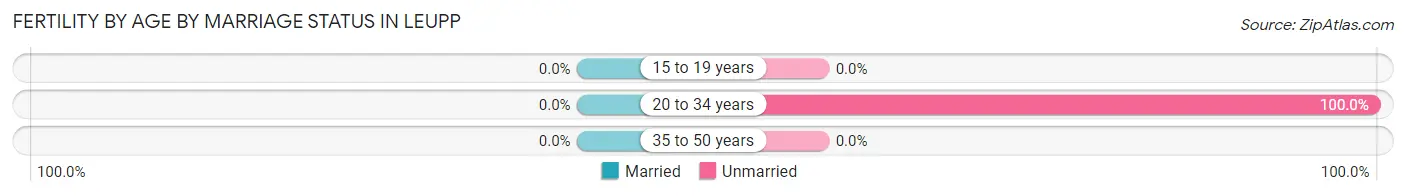
| Age Bracket | Married | Unmarried |
| 15 to 19 years | 0 (0.0%) | 0 (0.0%) |
| 20 to 34 years | 0 (0.0%) | 20 (100.0%) |
| 35 to 50 years | 0 (0.0%) | 0 (0.0%) |
| Total | 0 (0.0%) | 20 (100.0%) |
Fertility by Education in Leupp
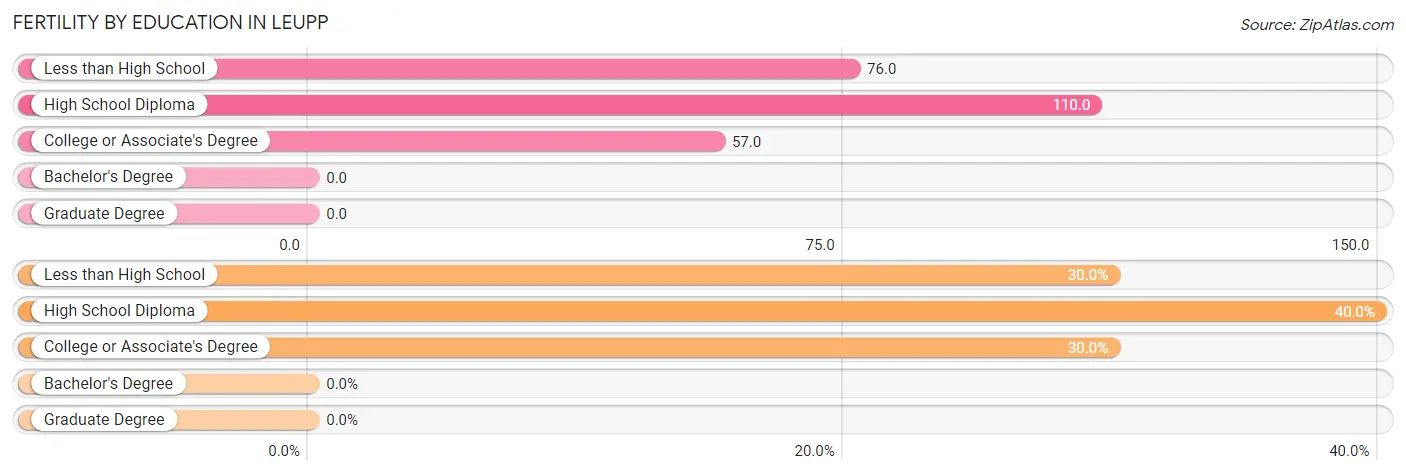
| Educational Attainment | Women with Births | Births / 1,000 Women |
| Less than High School | 6 (30.0%) | 76.0 |
| High School Diploma | 8 (40.0%) | 110.0 |
| College or Associate's Degree | 6 (30.0%) | 57.0 |
| Bachelor's Degree | 0 (0.0%) | 0.0 |
| Graduate Degree | 0 (0.0%) | 0.0 |
| Total | 20 (100.0%) | 73.0 |
Fertility by Education by Marriage Status in Leupp
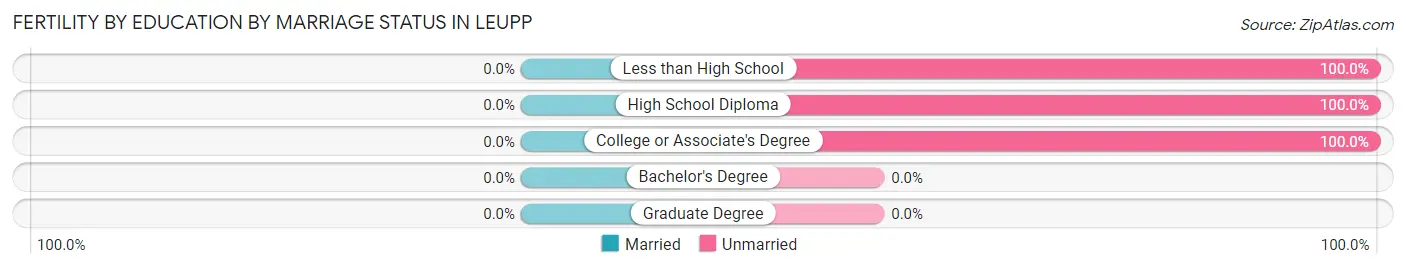
| Educational Attainment | Married | Unmarried |
| Less than High School | 0 (0.0%) | 6 (100.0%) |
| High School Diploma | 0 (0.0%) | 8 (100.0%) |
| College or Associate's Degree | 0 (0.0%) | 6 (100.0%) |
| Bachelor's Degree | 0 (0.0%) | 0 (0.0%) |
| Graduate Degree | 0 (0.0%) | 0 (0.0%) |
| Total | 0 (0.0%) | 20 (100.0%) |
Employment Characteristics in Leupp
Employment by Class of Employer in Leupp
Among the 401 employed individuals in Leupp, private company employees (255 | 63.6%), local government employees (45 | 11.2%), and not-for-profit organizations (40 | 10.0%) make up the most common classes of employment.
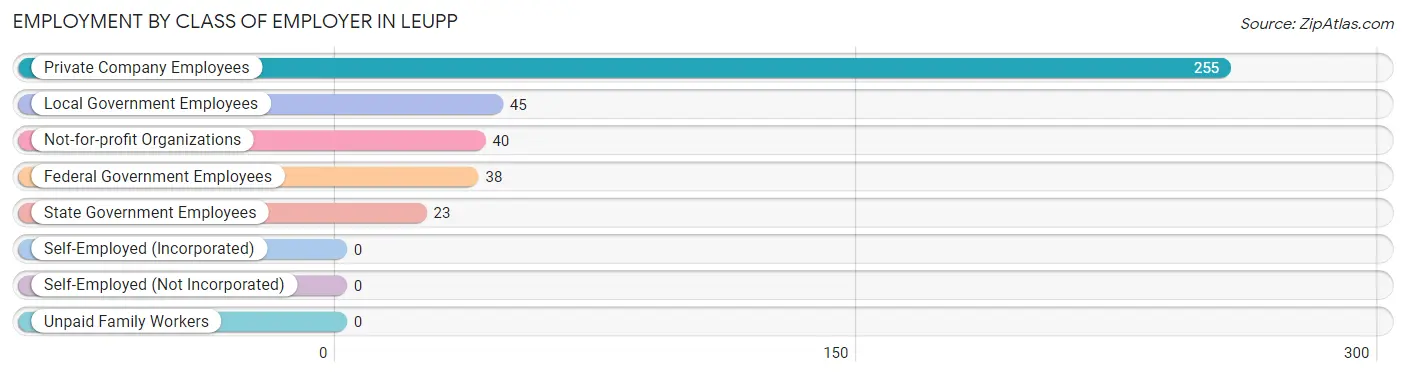
| Employer Class | # Employees | % Employees |
| Private Company Employees | 255 | 63.6% |
| Self-Employed (Incorporated) | 0 | 0.0% |
| Self-Employed (Not Incorporated) | 0 | 0.0% |
| Not-for-profit Organizations | 40 | 10.0% |
| Local Government Employees | 45 | 11.2% |
| State Government Employees | 23 | 5.7% |
| Federal Government Employees | 38 | 9.5% |
| Unpaid Family Workers | 0 | 0.0% |
| Total | 401 | 100.0% |
Employment Status by Age in Leupp
According to the labor force statistics for Leupp, out of the total population over 16 years of age (834), 57.8% or 482 individuals are in the labor force, with 12.9% or 62 of them unemployed. The age group with the highest labor force participation rate is 45 to 54 years, with 85.7% or 96 individuals in the labor force. Within the labor force, the 30 to 34 years age range has the highest percentage of unemployed individuals, with 37.0% or 17 of them being unemployed.
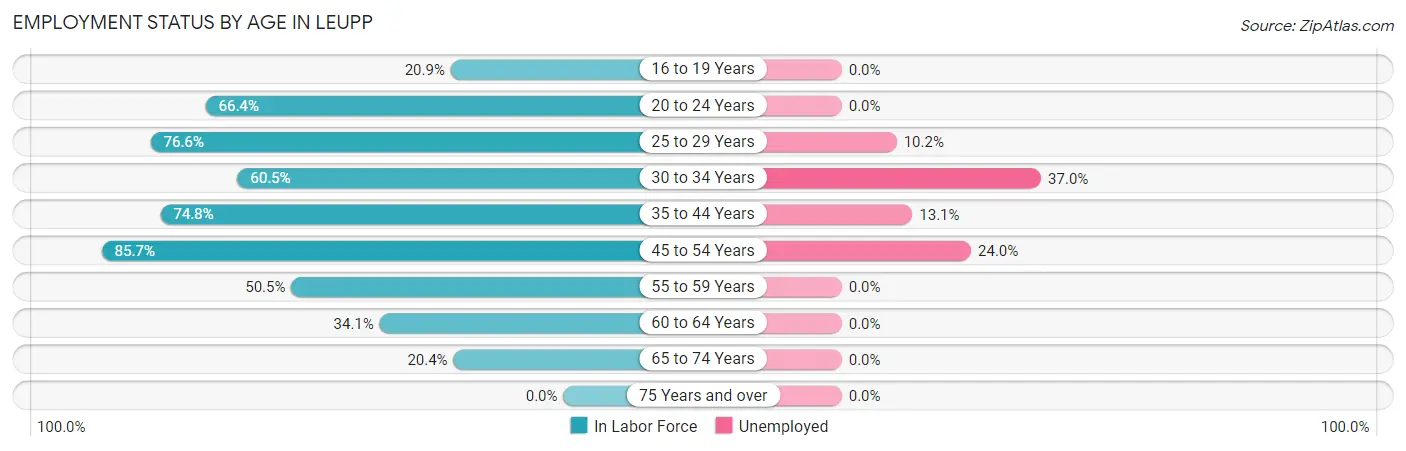
| Age Bracket | In Labor Force | Unemployed |
| 16 to 19 Years | 9 (20.9%) | 0 (0.0%) |
| 20 to 24 Years | 77 (66.4%) | 0 (0.0%) |
| 25 to 29 Years | 59 (76.6%) | 6 (10.2%) |
| 30 to 34 Years | 46 (60.5%) | 17 (37.0%) |
| 35 to 44 Years | 122 (74.8%) | 16 (13.1%) |
| 45 to 54 Years | 96 (85.7%) | 23 (24.0%) |
| 55 to 59 Years | 47 (50.5%) | 0 (0.0%) |
| 60 to 64 Years | 15 (34.1%) | 0 (0.0%) |
| 65 to 74 Years | 11 (20.4%) | 0 (0.0%) |
| 75 Years and over | 0 (0.0%) | 0 (0.0%) |
| Total | 482 (57.8%) | 62 (12.9%) |
Employment Status by Educational Attainment in Leupp
According to labor force statistics for Leupp, 68.1% of individuals (385) out of the total population between 25 and 64 years of age (565) are in the labor force, with 16.1% or 62 of them being unemployed. The group with the highest labor force participation rate are those with the educational attainment of college / associate degree, with 81.0% or 200 individuals in the labor force. Within the labor force, individuals with less than high school education have the highest percentage of unemployment, with 36.8% or 21 of them being unemployed.
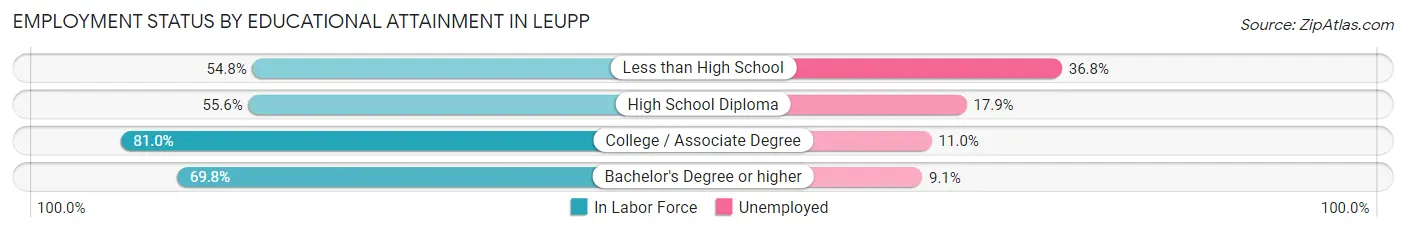
| Educational Attainment | In Labor Force | Unemployed |
| Less than High School | 57 (54.8%) | 38 (36.8%) |
| High School Diploma | 84 (55.6%) | 27 (17.9%) |
| College / Associate Degree | 200 (81.0%) | 27 (11.0%) |
| Bachelor's Degree or higher | 44 (69.8%) | 6 (9.1%) |
| Total | 385 (68.1%) | 91 (16.1%) |
Employment Occupations by Sex in Leupp
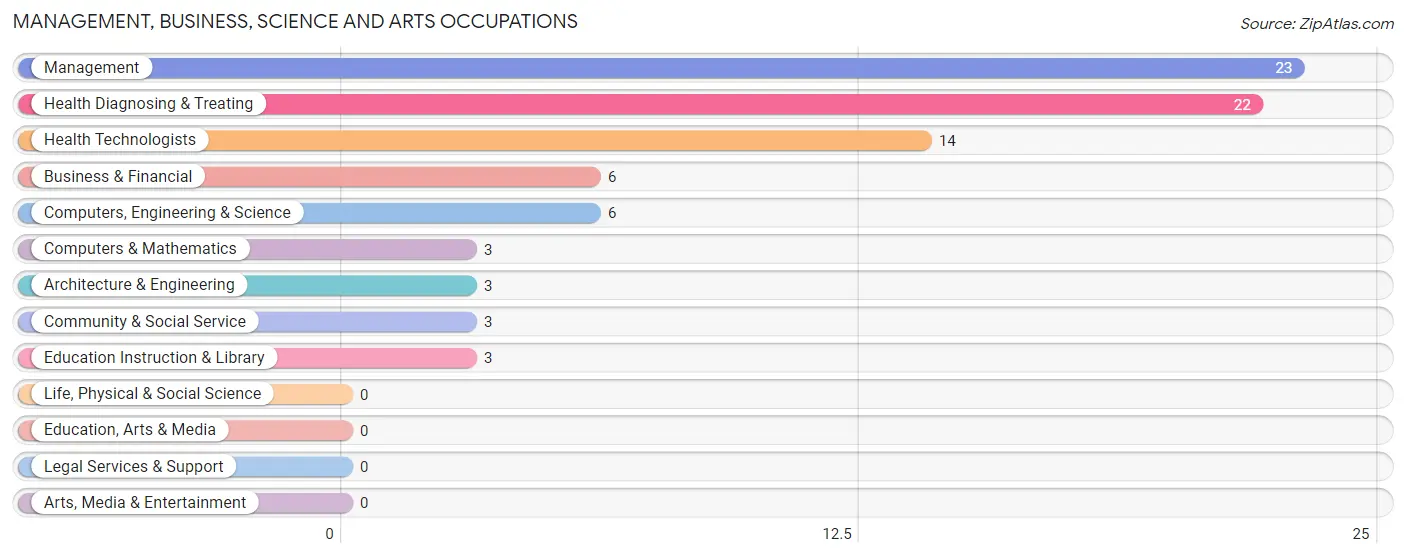
Management, Business, Science and Arts Occupations
The most common Management, Business, Science and Arts occupations in Leupp are Management (23 | 5.5%), Health Diagnosing & Treating (22 | 5.2%), Health Technologists (14 | 3.3%), Business & Financial (6 | 1.4%), and Computers, Engineering & Science (6 | 1.4%).
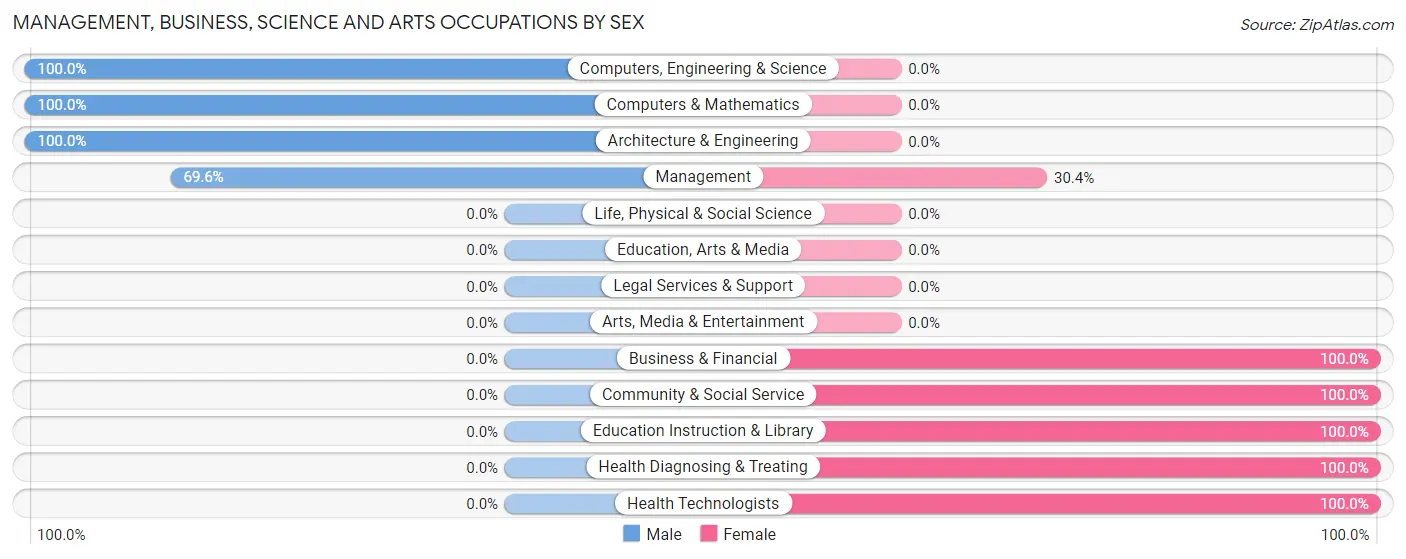
Management, Business, Science and Arts Occupations by Sex
Within the Management, Business, Science and Arts occupations in Leupp, the most male-oriented occupations are Computers, Engineering & Science (100.0%), Computers & Mathematics (100.0%), and Architecture & Engineering (100.0%), while the most female-oriented occupations are Business & Financial (100.0%), Community & Social Service (100.0%), and Education Instruction & Library (100.0%).
| Occupation | Male | Female |
| Management | 16 (69.6%) | 7 (30.4%) |
| Business & Financial | 0 (0.0%) | 6 (100.0%) |
| Computers, Engineering & Science | 6 (100.0%) | 0 (0.0%) |
| Computers & Mathematics | 3 (100.0%) | 0 (0.0%) |
| Architecture & Engineering | 3 (100.0%) | 0 (0.0%) |
| Life, Physical & Social Science | 0 (0.0%) | 0 (0.0%) |
| Community & Social Service | 0 (0.0%) | 3 (100.0%) |
| Education, Arts & Media | 0 (0.0%) | 0 (0.0%) |
| Legal Services & Support | 0 (0.0%) | 0 (0.0%) |
| Education Instruction & Library | 0 (0.0%) | 3 (100.0%) |
| Arts, Media & Entertainment | 0 (0.0%) | 0 (0.0%) |
| Health Diagnosing & Treating | 0 (0.0%) | 22 (100.0%) |
| Health Technologists | 0 (0.0%) | 14 (100.0%) |
| Total (Category) | 22 (36.7%) | 38 (63.3%) |
| Total (Overall) | 228 (54.3%) | 192 (45.7%) |
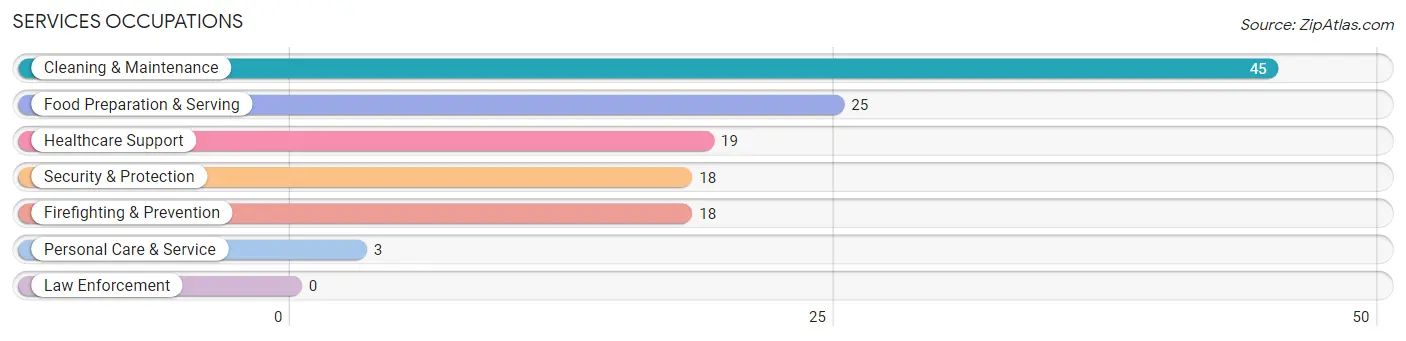
Services Occupations
The most common Services occupations in Leupp are Cleaning & Maintenance (45 | 10.7%), Food Preparation & Serving (25 | 5.9%), Healthcare Support (19 | 4.5%), Security & Protection (18 | 4.3%), and Firefighting & Prevention (18 | 4.3%).
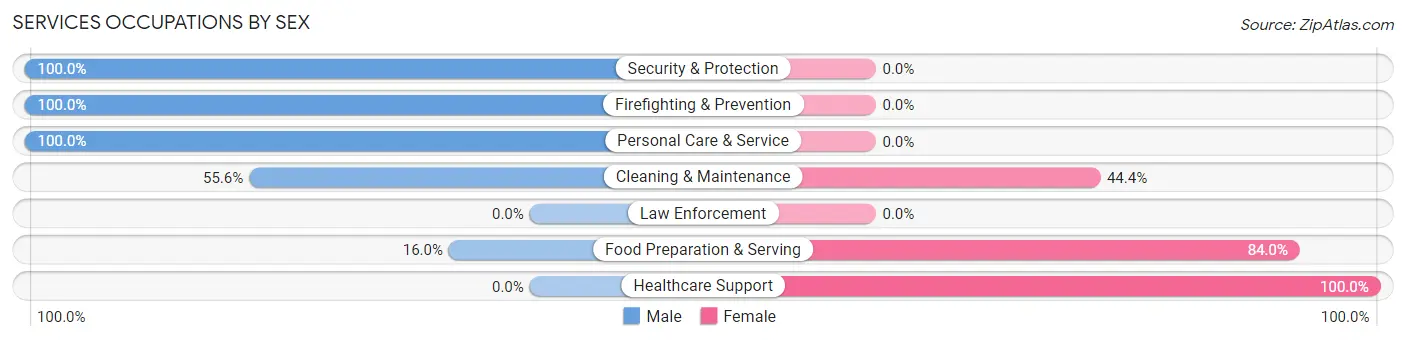
Services Occupations by Sex
Within the Services occupations in Leupp, the most male-oriented occupations are Security & Protection (100.0%), Firefighting & Prevention (100.0%), and Personal Care & Service (100.0%), while the most female-oriented occupations are Healthcare Support (100.0%), Food Preparation & Serving (84.0%), and Cleaning & Maintenance (44.4%).
| Occupation | Male | Female |
| Healthcare Support | 0 (0.0%) | 19 (100.0%) |
| Security & Protection | 18 (100.0%) | 0 (0.0%) |
| Firefighting & Prevention | 18 (100.0%) | 0 (0.0%) |
| Law Enforcement | 0 (0.0%) | 0 (0.0%) |
| Food Preparation & Serving | 4 (16.0%) | 21 (84.0%) |
| Cleaning & Maintenance | 25 (55.6%) | 20 (44.4%) |
| Personal Care & Service | 3 (100.0%) | 0 (0.0%) |
| Total (Category) | 50 (45.5%) | 60 (54.5%) |
| Total (Overall) | 228 (54.3%) | 192 (45.7%) |
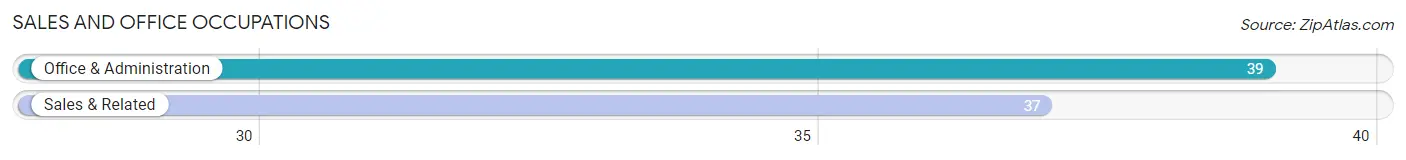
Sales and Office Occupations
The most common Sales and Office occupations in Leupp are Office & Administration (39 | 9.3%), and Sales & Related (37 | 8.8%).
Sales and Office Occupations by Sex
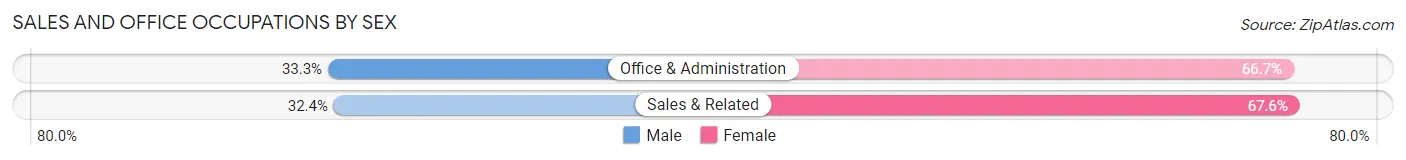
| Occupation | Male | Female |
| Sales & Related | 12 (32.4%) | 25 (67.6%) |
| Office & Administration | 13 (33.3%) | 26 (66.7%) |
| Total (Category) | 25 (32.9%) | 51 (67.1%) |
| Total (Overall) | 228 (54.3%) | 192 (45.7%) |
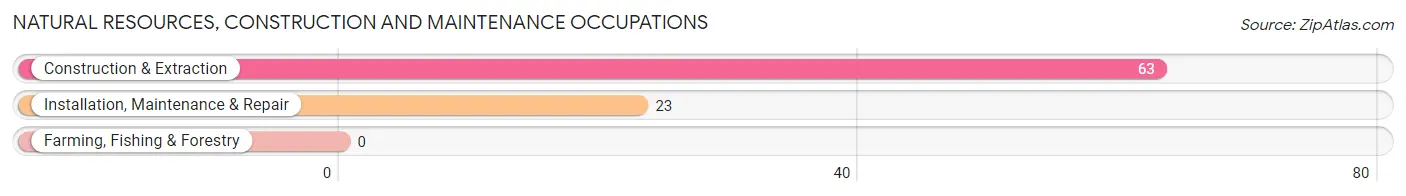
Natural Resources, Construction and Maintenance Occupations
The most common Natural Resources, Construction and Maintenance occupations in Leupp are Construction & Extraction (63 | 15.0%), and Installation, Maintenance & Repair (23 | 5.5%).
Natural Resources, Construction and Maintenance Occupations by Sex
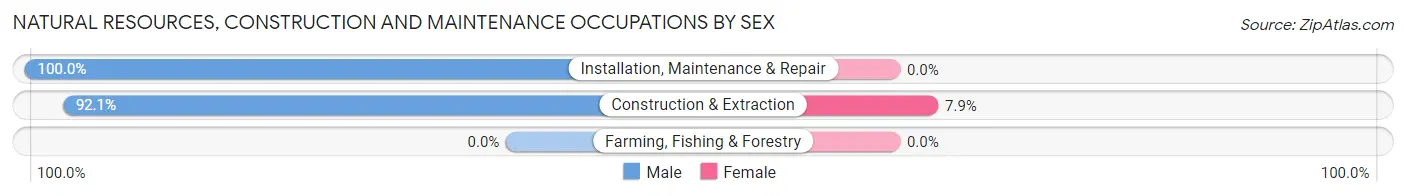
| Occupation | Male | Female |
| Farming, Fishing & Forestry | 0 (0.0%) | 0 (0.0%) |
| Construction & Extraction | 58 (92.1%) | 5 (7.9%) |
| Installation, Maintenance & Repair | 23 (100.0%) | 0 (0.0%) |
| Total (Category) | 81 (94.2%) | 5 (5.8%) |
| Total (Overall) | 228 (54.3%) | 192 (45.7%) |
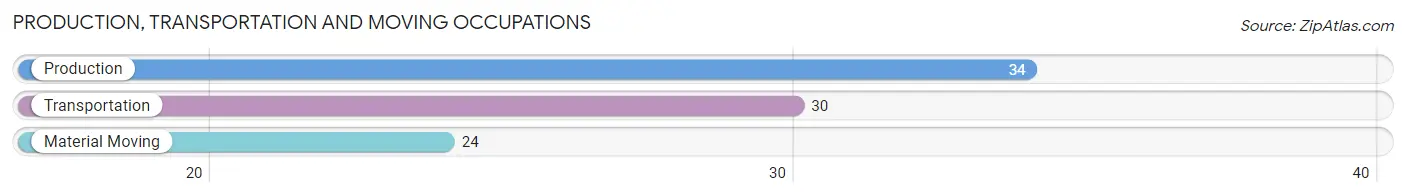
Production, Transportation and Moving Occupations
The most common Production, Transportation and Moving occupations in Leupp are Production (34 | 8.1%), Transportation (30 | 7.1%), and Material Moving (24 | 5.7%).
Production, Transportation and Moving Occupations by Sex
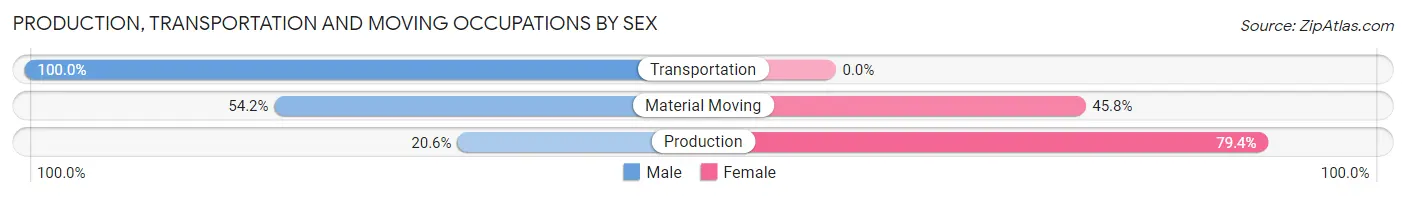
| Occupation | Male | Female |
| Production | 7 (20.6%) | 27 (79.4%) |
| Transportation | 30 (100.0%) | 0 (0.0%) |
| Material Moving | 13 (54.2%) | 11 (45.8%) |
| Total (Category) | 50 (56.8%) | 38 (43.2%) |
| Total (Overall) | 228 (54.3%) | 192 (45.7%) |
Employment Industries by Sex in Leupp
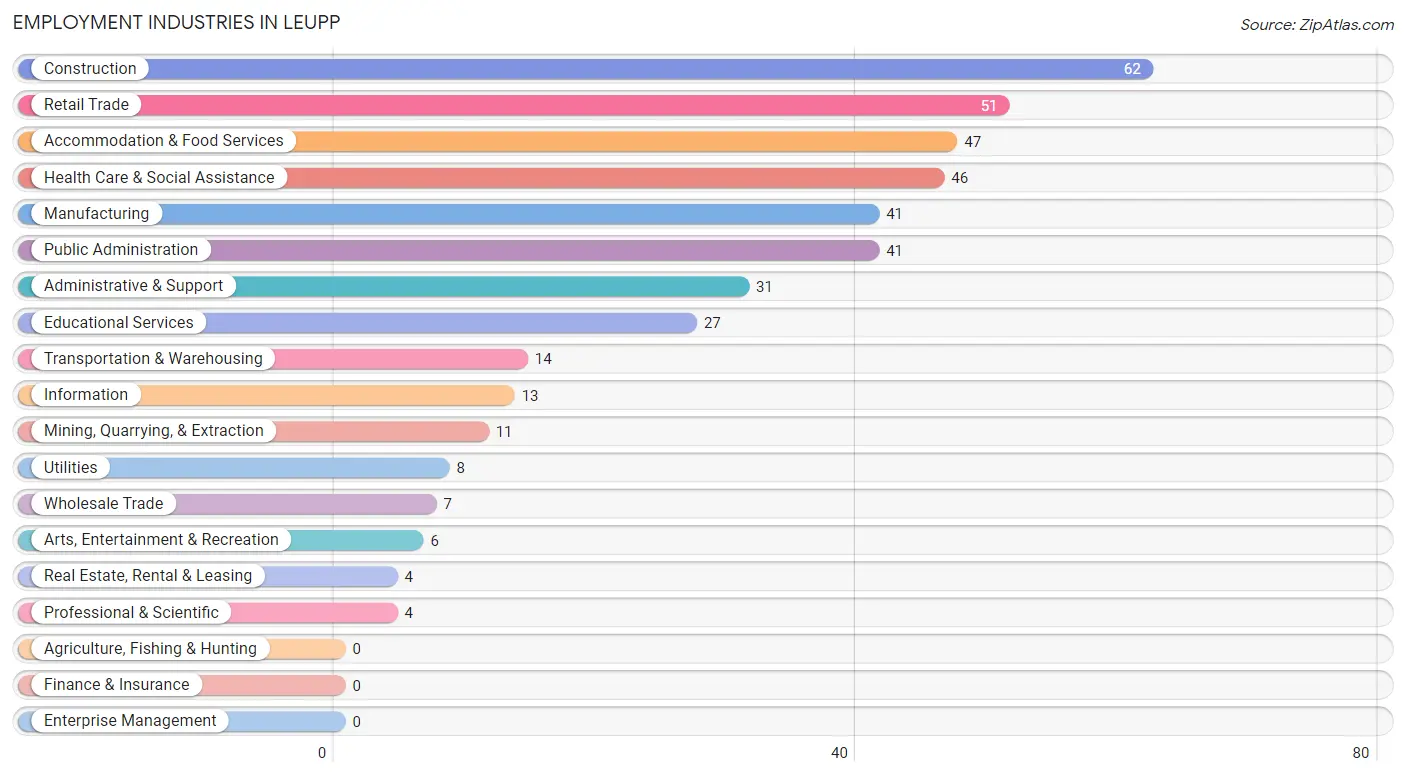
Employment Industries in Leupp
The major employment industries in Leupp include Construction (62 | 14.8%), Retail Trade (51 | 12.1%), Accommodation & Food Services (47 | 11.2%), Health Care & Social Assistance (46 | 11.0%), and Manufacturing (41 | 9.8%).
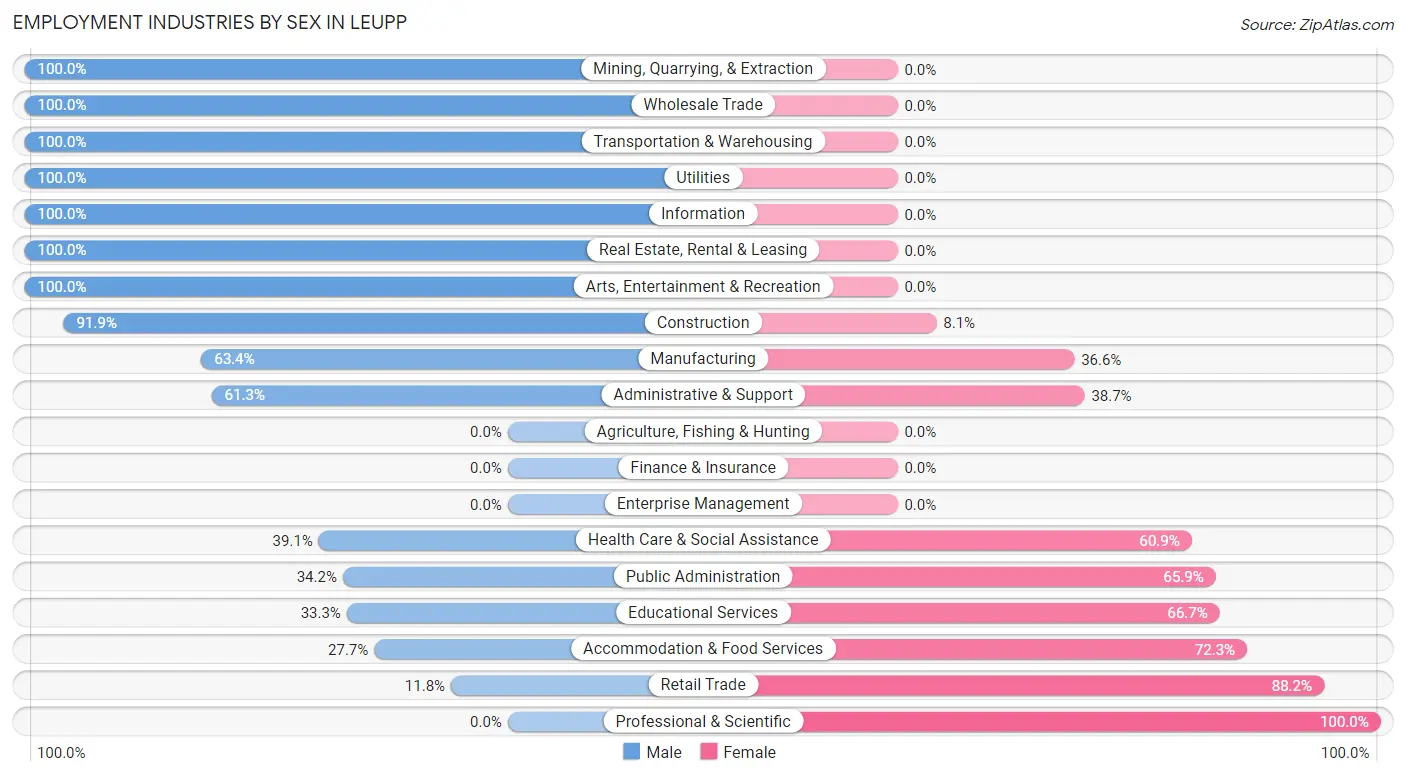
Employment Industries by Sex in Leupp
The Leupp industries that see more men than women are Mining, Quarrying, & Extraction (100.0%), Wholesale Trade (100.0%), and Transportation & Warehousing (100.0%), whereas the industries that tend to have a higher number of women are Professional & Scientific (100.0%), Retail Trade (88.2%), and Accommodation & Food Services (72.3%).
| Industry | Male | Female |
| Agriculture, Fishing & Hunting | 0 (0.0%) | 0 (0.0%) |
| Mining, Quarrying, & Extraction | 11 (100.0%) | 0 (0.0%) |
| Construction | 57 (91.9%) | 5 (8.1%) |
| Manufacturing | 26 (63.4%) | 15 (36.6%) |
| Wholesale Trade | 7 (100.0%) | 0 (0.0%) |
| Retail Trade | 6 (11.8%) | 45 (88.2%) |
| Transportation & Warehousing | 14 (100.0%) | 0 (0.0%) |
| Utilities | 8 (100.0%) | 0 (0.0%) |
| Information | 13 (100.0%) | 0 (0.0%) |
| Finance & Insurance | 0 (0.0%) | 0 (0.0%) |
| Real Estate, Rental & Leasing | 4 (100.0%) | 0 (0.0%) |
| Professional & Scientific | 0 (0.0%) | 4 (100.0%) |
| Enterprise Management | 0 (0.0%) | 0 (0.0%) |
| Administrative & Support | 19 (61.3%) | 12 (38.7%) |
| Educational Services | 9 (33.3%) | 18 (66.7%) |
| Health Care & Social Assistance | 18 (39.1%) | 28 (60.9%) |
| Arts, Entertainment & Recreation | 6 (100.0%) | 0 (0.0%) |
| Accommodation & Food Services | 13 (27.7%) | 34 (72.3%) |
| Public Administration | 14 (34.2%) | 27 (65.8%) |
| Total | 228 (54.3%) | 192 (45.7%) |
Education in Leupp
School Enrollment in Leupp
The most common levels of schooling among the 334 students in Leupp are middle school (93 | 27.8%), elementary school (72 | 21.6%), and high school (72 | 21.6%).
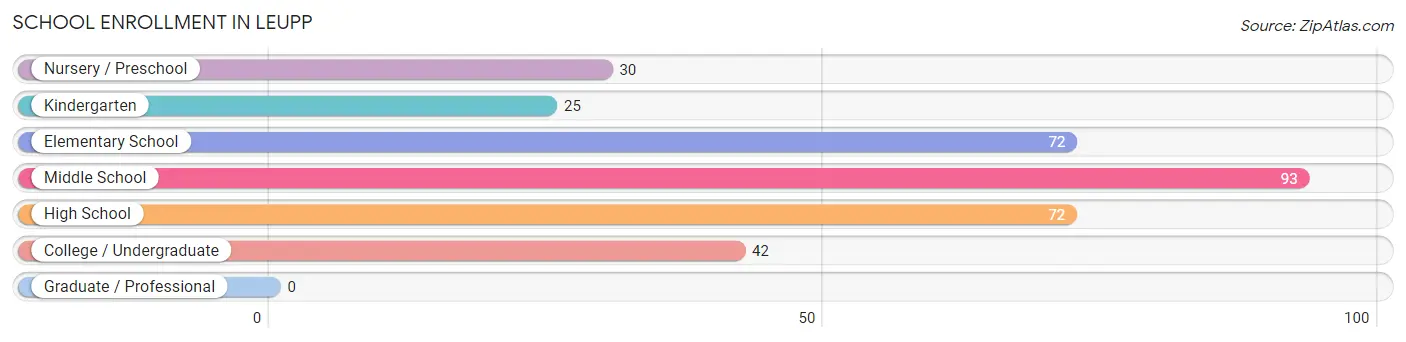
| School Level | # Students | % Students |
| Nursery / Preschool | 30 | 9.0% |
| Kindergarten | 25 | 7.5% |
| Elementary School | 72 | 21.6% |
| Middle School | 93 | 27.8% |
| High School | 72 | 21.6% |
| College / Undergraduate | 42 | 12.6% |
| Graduate / Professional | 0 | 0.0% |
| Total | 334 | 100.0% |
School Enrollment by Age by Funding Source in Leupp
Out of a total of 334 students who are enrolled in schools in Leupp, 4 (1.2%) attend a private institution, while the remaining 330 (98.8%) are enrolled in public schools. The age group of 35 years and over has the highest likelihood of being enrolled in private schools, with 4 (14.3% in the age bracket) enrolled. Conversely, the age group of 3 to 4 year olds has the lowest likelihood of being enrolled in a private school, with 25 (100.0% in the age bracket) attending a public institution.
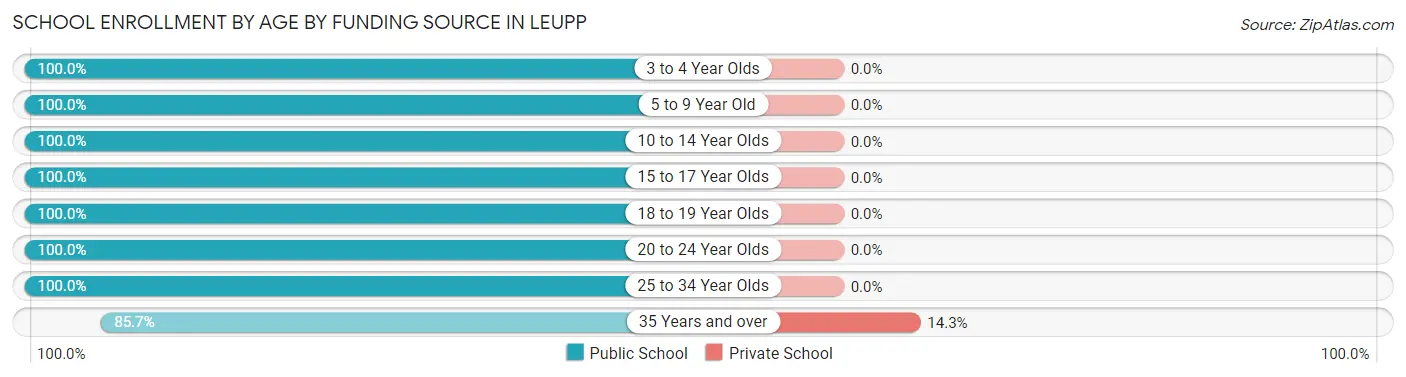
| Age Bracket | Public School | Private School |
| 3 to 4 Year Olds | 25 (100.0%) | 0 (0.0%) |
| 5 to 9 Year Old | 98 (100.0%) | 0 (0.0%) |
| 10 to 14 Year Olds | 105 (100.0%) | 0 (0.0%) |
| 15 to 17 Year Olds | 42 (100.0%) | 0 (0.0%) |
| 18 to 19 Year Olds | 6 (100.0%) | 0 (0.0%) |
| 20 to 24 Year Olds | 24 (100.0%) | 0 (0.0%) |
| 25 to 34 Year Olds | 6 (100.0%) | 0 (0.0%) |
| 35 Years and over | 24 (85.7%) | 4 (14.3%) |
| Total | 330 (98.8%) | 4 (1.2%) |
Educational Attainment by Field of Study in Leupp
Education (21 | 23.9%), visual & performing arts (14 | 15.9%), science & technology (10 | 11.4%), liberal arts & history (10 | 11.4%), and business (8 | 9.1%) are the most common fields of study among 88 individuals in Leupp who have obtained a bachelor's degree or higher.
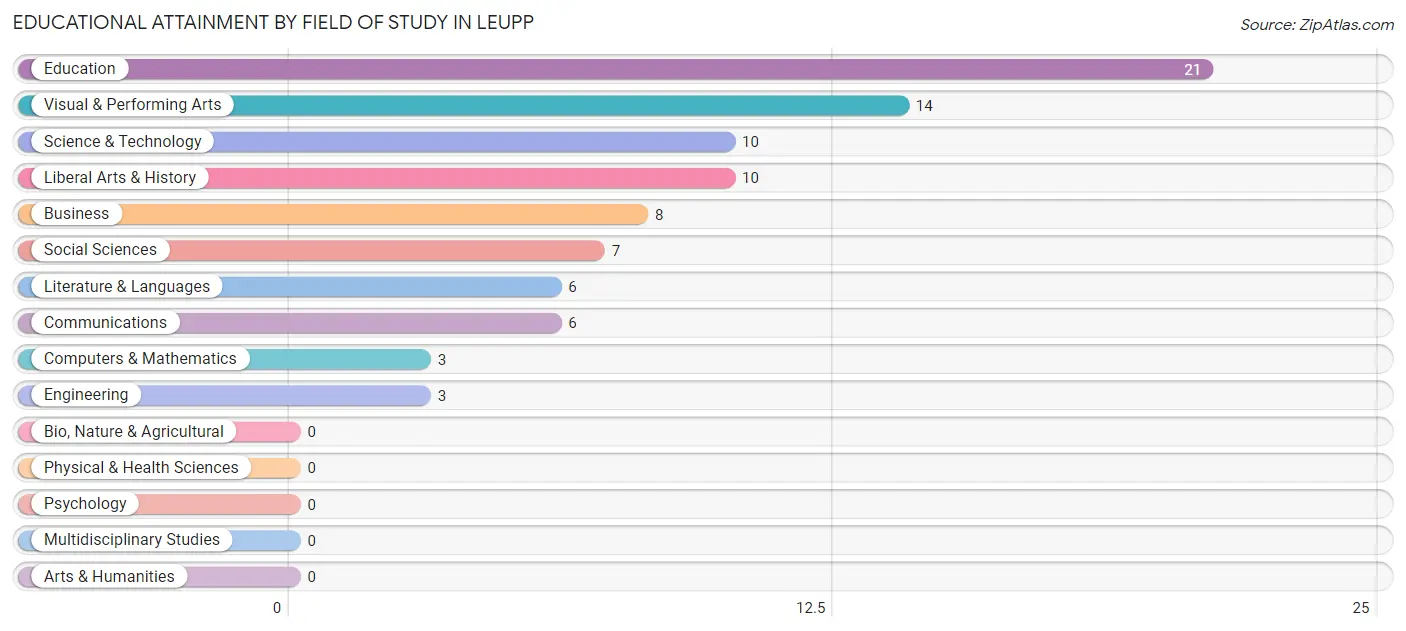
| Field of Study | # Graduates | % Graduates |
| Computers & Mathematics | 3 | 3.4% |
| Bio, Nature & Agricultural | 0 | 0.0% |
| Physical & Health Sciences | 0 | 0.0% |
| Psychology | 0 | 0.0% |
| Social Sciences | 7 | 8.0% |
| Engineering | 3 | 3.4% |
| Multidisciplinary Studies | 0 | 0.0% |
| Science & Technology | 10 | 11.4% |
| Business | 8 | 9.1% |
| Education | 21 | 23.9% |
| Literature & Languages | 6 | 6.8% |
| Liberal Arts & History | 10 | 11.4% |
| Visual & Performing Arts | 14 | 15.9% |
| Communications | 6 | 6.8% |
| Arts & Humanities | 0 | 0.0% |
| Total | 88 | 100.0% |
Transportation & Commute in Leupp
Vehicle Availability by Sex in Leupp
The most prevalent vehicle ownership categories in Leupp are males with 3 vehicles (90, accounting for 39.5%) and females with 3 vehicles (37, making up 52.0%).
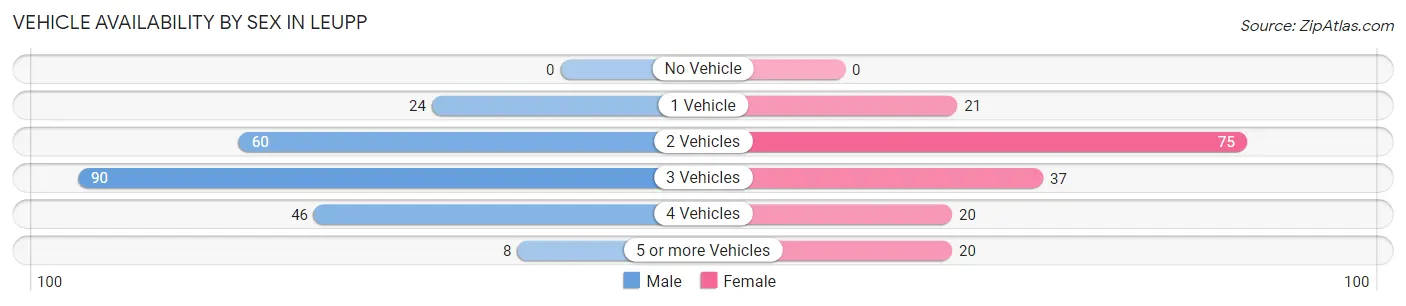
| Vehicles Available | Male | Female |
| No Vehicle | 0 (0.0%) | 0 (0.0%) |
| 1 Vehicle | 24 (10.5%) | 21 (12.1%) |
| 2 Vehicles | 60 (26.3%) | 75 (43.3%) |
| 3 Vehicles | 90 (39.5%) | 37 (21.4%) |
| 4 Vehicles | 46 (20.2%) | 20 (11.6%) |
| 5 or more Vehicles | 8 (3.5%) | 20 (11.6%) |
| Total | 228 (100.0%) | 173 (100.0%) |
Commute Time in Leupp
The most frequently occuring commute durations in Leupp are 45 to 59 minutes (128 commuters, 32.8%), 60 to 89 minutes (57 commuters, 14.6%), and 40 to 44 minutes (54 commuters, 13.9%).
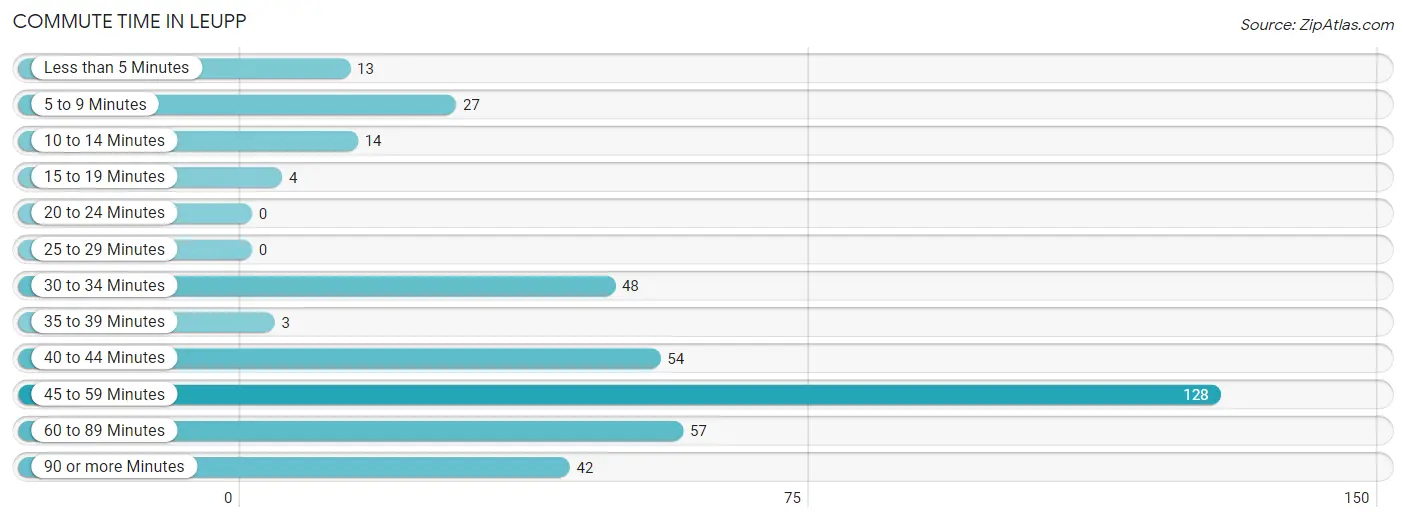
| Commute Time | # Commuters | % Commuters |
| Less than 5 Minutes | 13 | 3.3% |
| 5 to 9 Minutes | 27 | 6.9% |
| 10 to 14 Minutes | 14 | 3.6% |
| 15 to 19 Minutes | 4 | 1.0% |
| 20 to 24 Minutes | 0 | 0.0% |
| 25 to 29 Minutes | 0 | 0.0% |
| 30 to 34 Minutes | 48 | 12.3% |
| 35 to 39 Minutes | 3 | 0.8% |
| 40 to 44 Minutes | 54 | 13.9% |
| 45 to 59 Minutes | 128 | 32.8% |
| 60 to 89 Minutes | 57 | 14.6% |
| 90 or more Minutes | 42 | 10.8% |
Commute Time by Sex in Leupp
The most common commute times in Leupp are 45 to 59 minutes (50 commuters, 22.3%) for males and 45 to 59 minutes (78 commuters, 47.0%) for females.
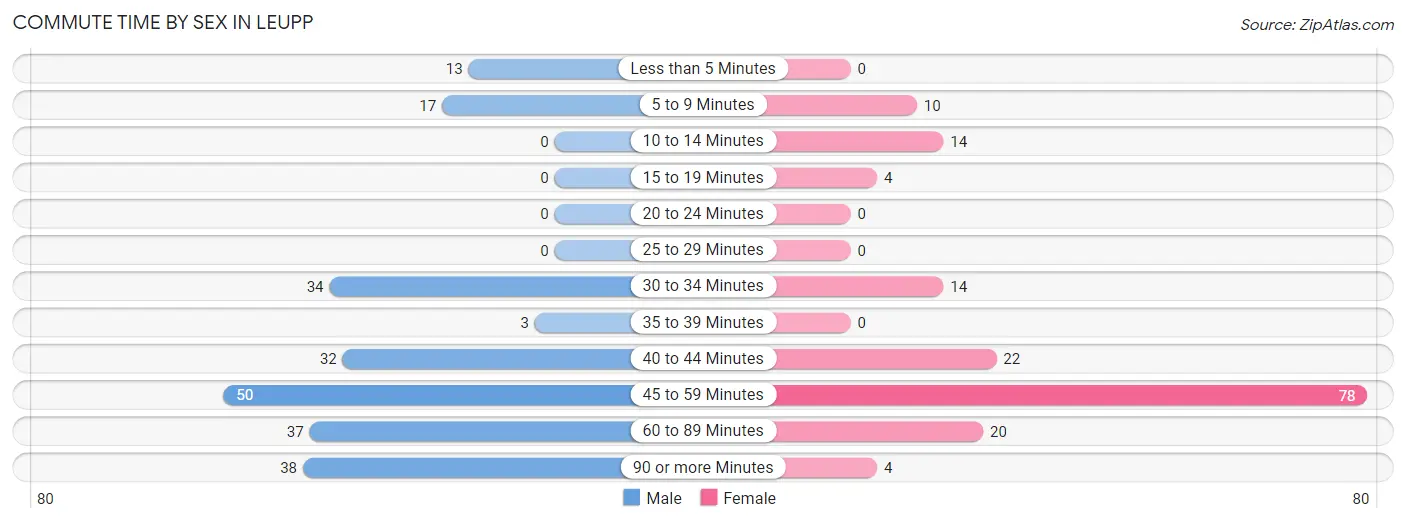
| Commute Time | Male | Female |
| Less than 5 Minutes | 13 (5.8%) | 0 (0.0%) |
| 5 to 9 Minutes | 17 (7.6%) | 10 (6.0%) |
| 10 to 14 Minutes | 0 (0.0%) | 14 (8.4%) |
| 15 to 19 Minutes | 0 (0.0%) | 4 (2.4%) |
| 20 to 24 Minutes | 0 (0.0%) | 0 (0.0%) |
| 25 to 29 Minutes | 0 (0.0%) | 0 (0.0%) |
| 30 to 34 Minutes | 34 (15.2%) | 14 (8.4%) |
| 35 to 39 Minutes | 3 (1.3%) | 0 (0.0%) |
| 40 to 44 Minutes | 32 (14.3%) | 22 (13.3%) |
| 45 to 59 Minutes | 50 (22.3%) | 78 (47.0%) |
| 60 to 89 Minutes | 37 (16.5%) | 20 (12.0%) |
| 90 or more Minutes | 38 (17.0%) | 4 (2.4%) |
Time of Departure to Work by Sex in Leupp
The most frequent times of departure to work in Leupp are 12:00 AM to 4:59 AM (40, 17.9%) for males and 5:30 AM to 5:59 AM (30, 18.1%) for females.
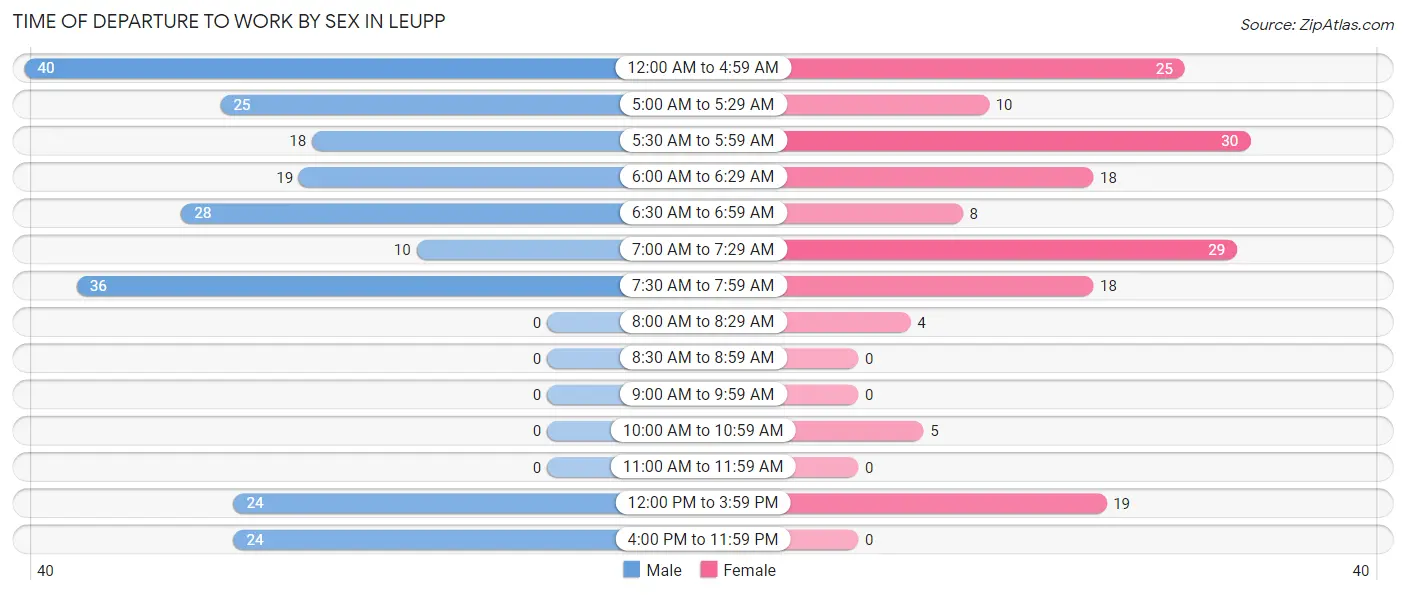
| Time of Departure | Male | Female |
| 12:00 AM to 4:59 AM | 40 (17.9%) | 25 (15.1%) |
| 5:00 AM to 5:29 AM | 25 (11.2%) | 10 (6.0%) |
| 5:30 AM to 5:59 AM | 18 (8.0%) | 30 (18.1%) |
| 6:00 AM to 6:29 AM | 19 (8.5%) | 18 (10.8%) |
| 6:30 AM to 6:59 AM | 28 (12.5%) | 8 (4.8%) |
| 7:00 AM to 7:29 AM | 10 (4.5%) | 29 (17.5%) |
| 7:30 AM to 7:59 AM | 36 (16.1%) | 18 (10.8%) |
| 8:00 AM to 8:29 AM | 0 (0.0%) | 4 (2.4%) |
| 8:30 AM to 8:59 AM | 0 (0.0%) | 0 (0.0%) |
| 9:00 AM to 9:59 AM | 0 (0.0%) | 0 (0.0%) |
| 10:00 AM to 10:59 AM | 0 (0.0%) | 5 (3.0%) |
| 11:00 AM to 11:59 AM | 0 (0.0%) | 0 (0.0%) |
| 12:00 PM to 3:59 PM | 24 (10.7%) | 19 (11.5%) |
| 4:00 PM to 11:59 PM | 24 (10.7%) | 0 (0.0%) |
| Total | 224 (100.0%) | 166 (100.0%) |
Housing Occupancy in Leupp
Occupancy by Ownership in Leupp
Of the total 278 dwellings in Leupp, owner-occupied units account for 201 (72.3%), while renter-occupied units make up 77 (27.7%).
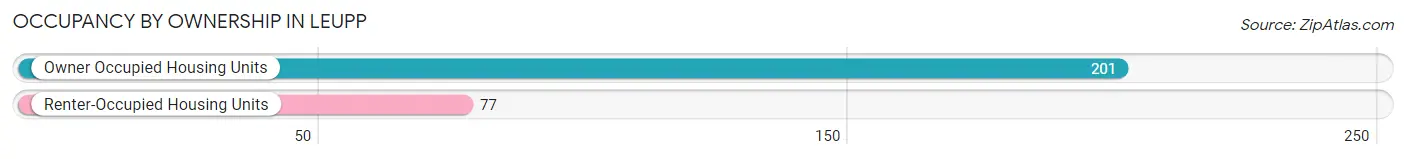
| Occupancy | # Housing Units | % Housing Units |
| Owner Occupied Housing Units | 201 | 72.3% |
| Renter-Occupied Housing Units | 77 | 27.7% |
| Total Occupied Housing Units | 278 | 100.0% |
Occupancy by Household Size in Leupp
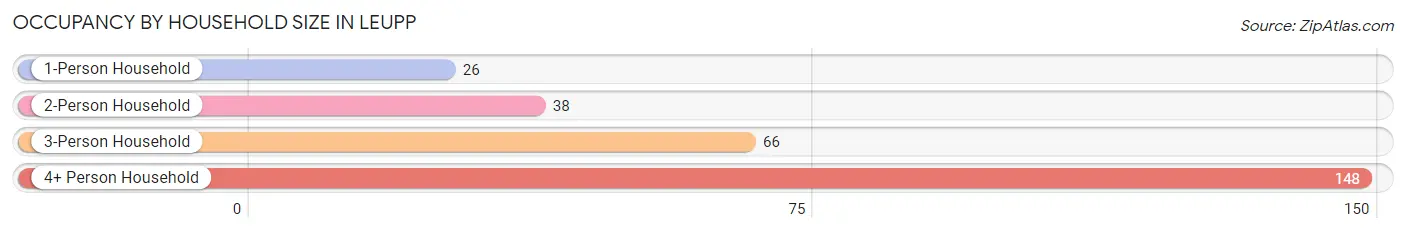
| Household Size | # Housing Units | % Housing Units |
| 1-Person Household | 26 | 9.3% |
| 2-Person Household | 38 | 13.7% |
| 3-Person Household | 66 | 23.7% |
| 4+ Person Household | 148 | 53.2% |
| Total Housing Units | 278 | 100.0% |
Occupancy by Ownership by Household Size in Leupp
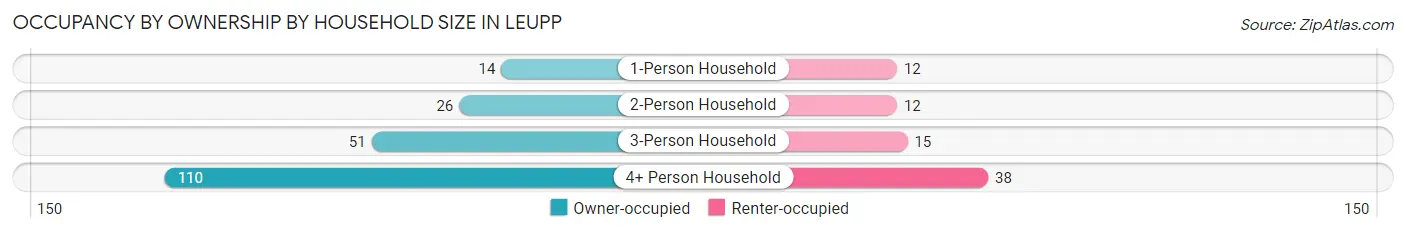
| Household Size | Owner-occupied | Renter-occupied |
| 1-Person Household | 14 (53.8%) | 12 (46.2%) |
| 2-Person Household | 26 (68.4%) | 12 (31.6%) |
| 3-Person Household | 51 (77.3%) | 15 (22.7%) |
| 4+ Person Household | 110 (74.3%) | 38 (25.7%) |
| Total Housing Units | 201 (72.3%) | 77 (27.7%) |
Occupancy by Educational Attainment in Leupp
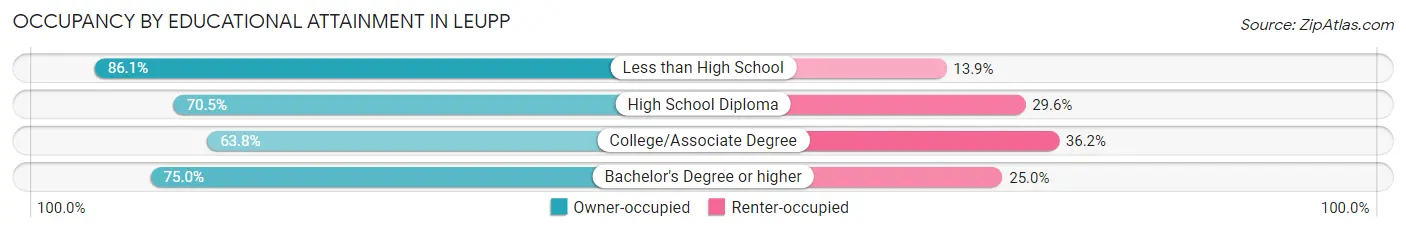
| Household Size | Owner-occupied | Renter-occupied |
| Less than High School | 68 (86.1%) | 11 (13.9%) |
| High School Diploma | 31 (70.5%) | 13 (29.5%) |
| College/Associate Degree | 81 (63.8%) | 46 (36.2%) |
| Bachelor's Degree or higher | 21 (75.0%) | 7 (25.0%) |
Occupancy by Age of Householder in Leupp
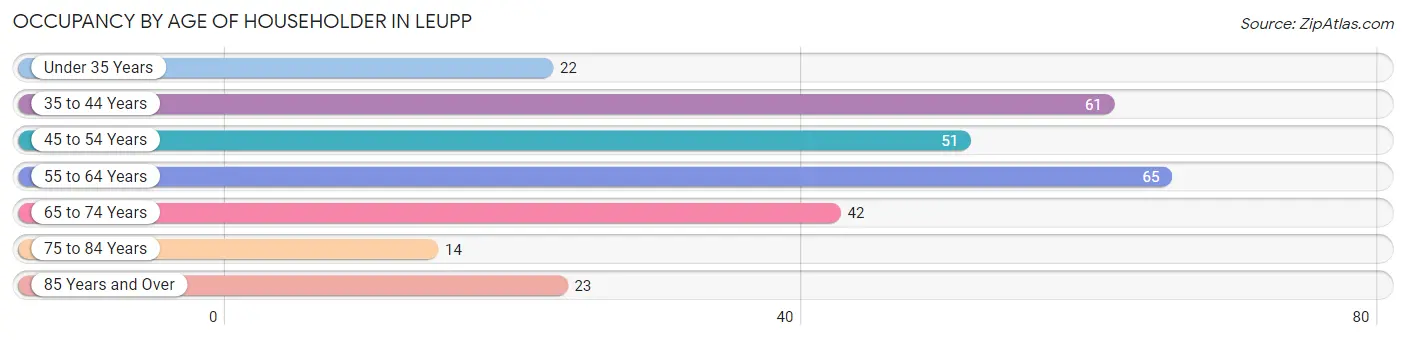
| Age Bracket | # Households | % Households |
| Under 35 Years | 22 | 7.9% |
| 35 to 44 Years | 61 | 21.9% |
| 45 to 54 Years | 51 | 18.3% |
| 55 to 64 Years | 65 | 23.4% |
| 65 to 74 Years | 42 | 15.1% |
| 75 to 84 Years | 14 | 5.0% |
| 85 Years and Over | 23 | 8.3% |
| Total | 278 | 100.0% |
Housing Finances in Leupp
Median Income by Occupancy in Leupp
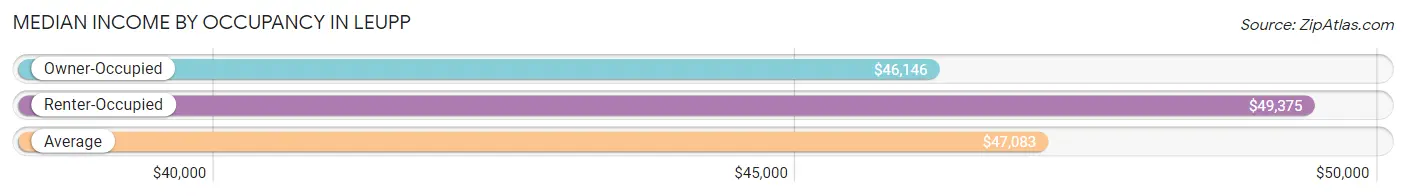
| Occupancy Type | # Households | Median Income |
| Owner-Occupied | 201 (72.3%) | $46,146 |
| Renter-Occupied | 77 (27.7%) | $49,375 |
| Average | 278 (100.0%) | $47,083 |
Occupancy by Householder Income Bracket in Leupp
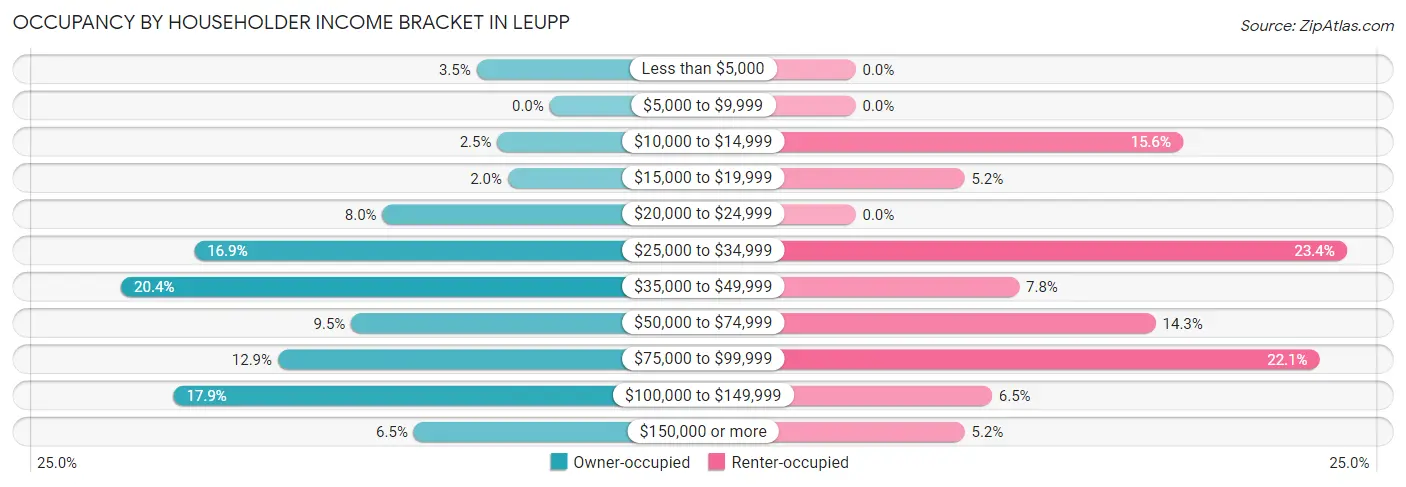
| Income Bracket | Owner-occupied | Renter-occupied |
| Less than $5,000 | 7 (3.5%) | 0 (0.0%) |
| $5,000 to $9,999 | 0 (0.0%) | 0 (0.0%) |
| $10,000 to $14,999 | 5 (2.5%) | 12 (15.6%) |
| $15,000 to $19,999 | 4 (2.0%) | 4 (5.2%) |
| $20,000 to $24,999 | 16 (8.0%) | 0 (0.0%) |
| $25,000 to $34,999 | 34 (16.9%) | 18 (23.4%) |
| $35,000 to $49,999 | 41 (20.4%) | 6 (7.8%) |
| $50,000 to $74,999 | 19 (9.5%) | 11 (14.3%) |
| $75,000 to $99,999 | 26 (12.9%) | 17 (22.1%) |
| $100,000 to $149,999 | 36 (17.9%) | 5 (6.5%) |
| $150,000 or more | 13 (6.5%) | 4 (5.2%) |
| Total | 201 (100.0%) | 77 (100.0%) |
Monthly Housing Cost Tiers in Leupp
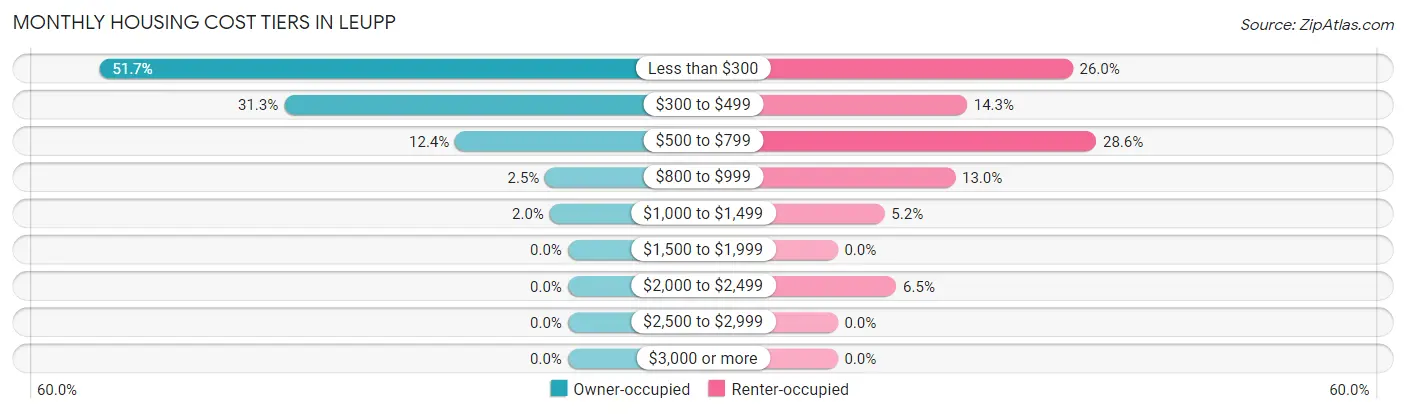
| Monthly Cost | Owner-occupied | Renter-occupied |
| Less than $300 | 104 (51.7%) | 20 (26.0%) |
| $300 to $499 | 63 (31.3%) | 11 (14.3%) |
| $500 to $799 | 25 (12.4%) | 22 (28.6%) |
| $800 to $999 | 5 (2.5%) | 10 (13.0%) |
| $1,000 to $1,499 | 4 (2.0%) | 4 (5.2%) |
| $1,500 to $1,999 | 0 (0.0%) | 0 (0.0%) |
| $2,000 to $2,499 | 0 (0.0%) | 5 (6.5%) |
| $2,500 to $2,999 | 0 (0.0%) | 0 (0.0%) |
| $3,000 or more | 0 (0.0%) | 0 (0.0%) |
| Total | 201 (100.0%) | 77 (100.0%) |
Physical Housing Characteristics in Leupp
Housing Structures in Leupp
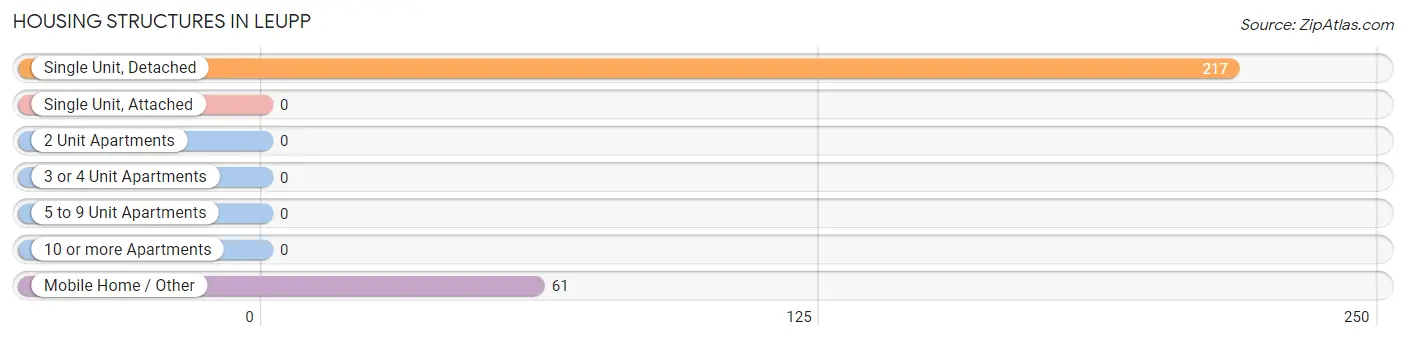
| Structure Type | # Housing Units | % Housing Units |
| Single Unit, Detached | 217 | 78.1% |
| Single Unit, Attached | 0 | 0.0% |
| 2 Unit Apartments | 0 | 0.0% |
| 3 or 4 Unit Apartments | 0 | 0.0% |
| 5 to 9 Unit Apartments | 0 | 0.0% |
| 10 or more Apartments | 0 | 0.0% |
| Mobile Home / Other | 61 | 21.9% |
| Total | 278 | 100.0% |
Housing Structures by Occupancy in Leupp
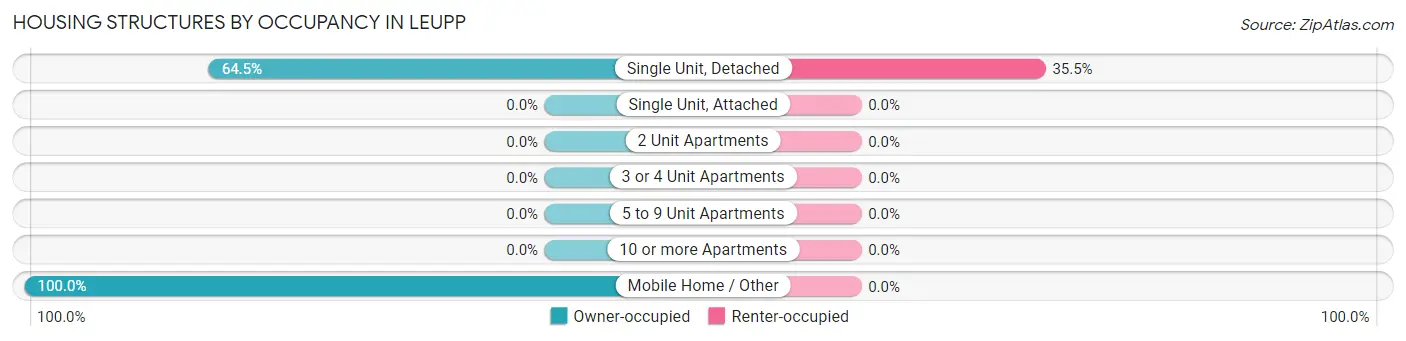
| Structure Type | Owner-occupied | Renter-occupied |
| Single Unit, Detached | 140 (64.5%) | 77 (35.5%) |
| Single Unit, Attached | 0 (0.0%) | 0 (0.0%) |
| 2 Unit Apartments | 0 (0.0%) | 0 (0.0%) |
| 3 or 4 Unit Apartments | 0 (0.0%) | 0 (0.0%) |
| 5 to 9 Unit Apartments | 0 (0.0%) | 0 (0.0%) |
| 10 or more Apartments | 0 (0.0%) | 0 (0.0%) |
| Mobile Home / Other | 61 (100.0%) | 0 (0.0%) |
| Total | 201 (72.3%) | 77 (27.7%) |
Housing Structures by Number of Rooms in Leupp
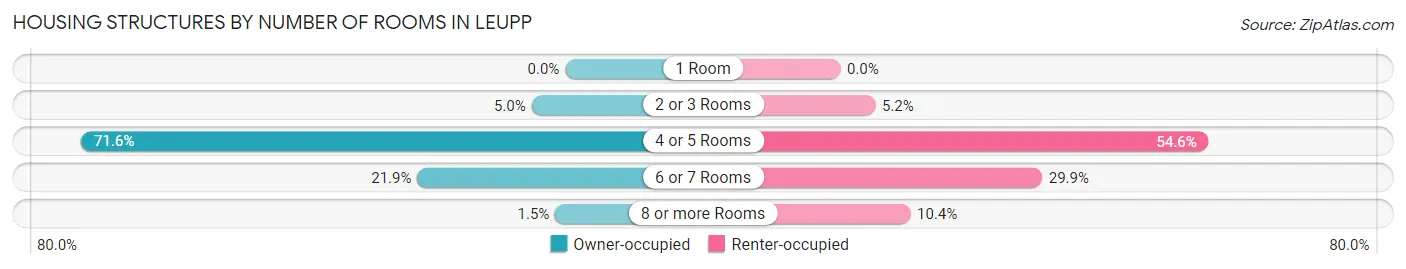
| Number of Rooms | Owner-occupied | Renter-occupied |
| 1 Room | 0 (0.0%) | 0 (0.0%) |
| 2 or 3 Rooms | 10 (5.0%) | 4 (5.2%) |
| 4 or 5 Rooms | 144 (71.6%) | 42 (54.5%) |
| 6 or 7 Rooms | 44 (21.9%) | 23 (29.9%) |
| 8 or more Rooms | 3 (1.5%) | 8 (10.4%) |
| Total | 201 (100.0%) | 77 (100.0%) |
Housing Structure by Heating Type in Leupp
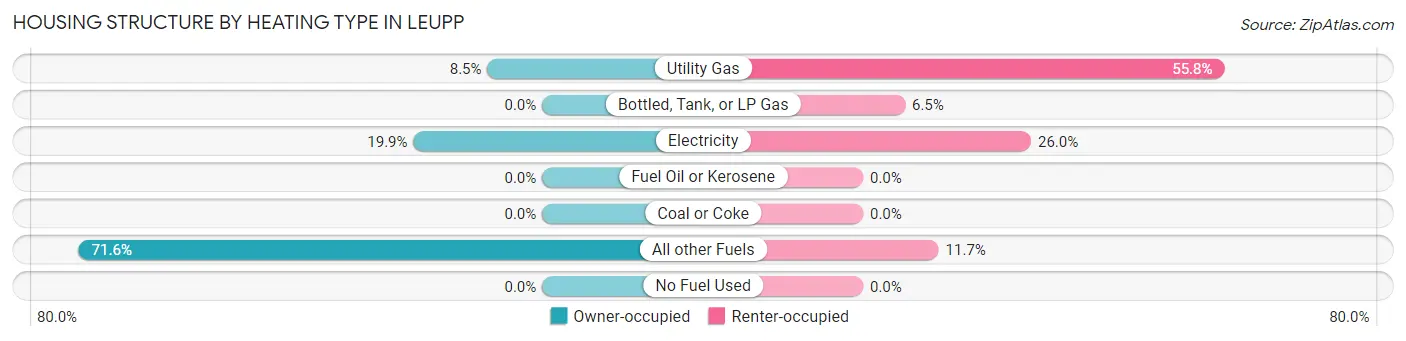
| Heating Type | Owner-occupied | Renter-occupied |
| Utility Gas | 17 (8.5%) | 43 (55.8%) |
| Bottled, Tank, or LP Gas | 0 (0.0%) | 5 (6.5%) |
| Electricity | 40 (19.9%) | 20 (26.0%) |
| Fuel Oil or Kerosene | 0 (0.0%) | 0 (0.0%) |
| Coal or Coke | 0 (0.0%) | 0 (0.0%) |
| All other Fuels | 144 (71.6%) | 9 (11.7%) |
| No Fuel Used | 0 (0.0%) | 0 (0.0%) |
| Total | 201 (100.0%) | 77 (100.0%) |
Household Vehicle Usage in Leupp
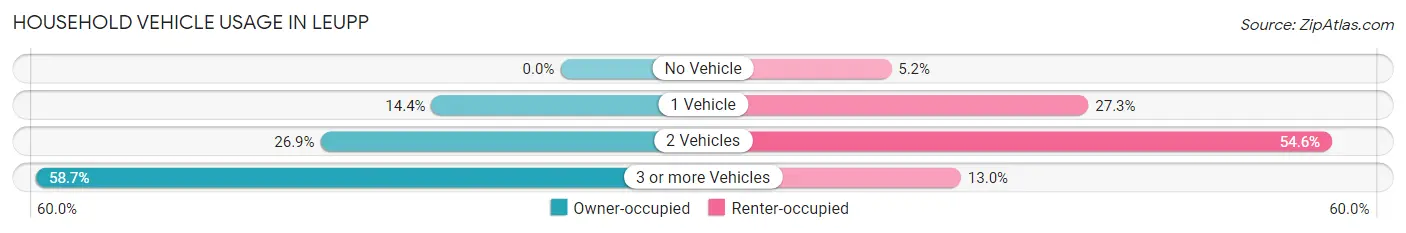
| Vehicles per Household | Owner-occupied | Renter-occupied |
| No Vehicle | 0 (0.0%) | 4 (5.2%) |
| 1 Vehicle | 29 (14.4%) | 21 (27.3%) |
| 2 Vehicles | 54 (26.9%) | 42 (54.5%) |
| 3 or more Vehicles | 118 (58.7%) | 10 (13.0%) |
| Total | 201 (100.0%) | 77 (100.0%) |
Real Estate & Mortgages in Leupp
Real Estate and Mortgage Overview in Leupp
| Characteristic | Without Mortgage | With Mortgage |
| Housing Units | 175 | 26 |
| Median Property Value | $58,300 | $0 |
| Median Household Income | $46,094 | $0 |
| Monthly Housing Costs | $259 | $0 |
| Real Estate Taxes | - | - |
Property Value by Mortgage Status in Leupp
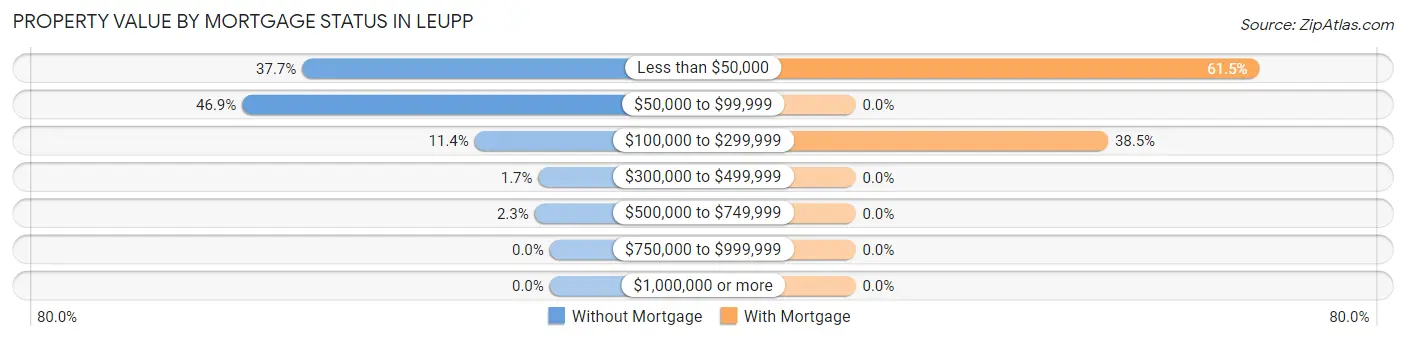
| Property Value | Without Mortgage | With Mortgage |
| Less than $50,000 | 66 (37.7%) | 16 (61.5%) |
| $50,000 to $99,999 | 82 (46.9%) | 0 (0.0%) |
| $100,000 to $299,999 | 20 (11.4%) | 10 (38.5%) |
| $300,000 to $499,999 | 3 (1.7%) | 0 (0.0%) |
| $500,000 to $749,999 | 4 (2.3%) | 0 (0.0%) |
| $750,000 to $999,999 | 0 (0.0%) | 0 (0.0%) |
| $1,000,000 or more | 0 (0.0%) | 0 (0.0%) |
| Total | 175 (100.0%) | 26 (100.0%) |
Household Income by Mortgage Status in Leupp
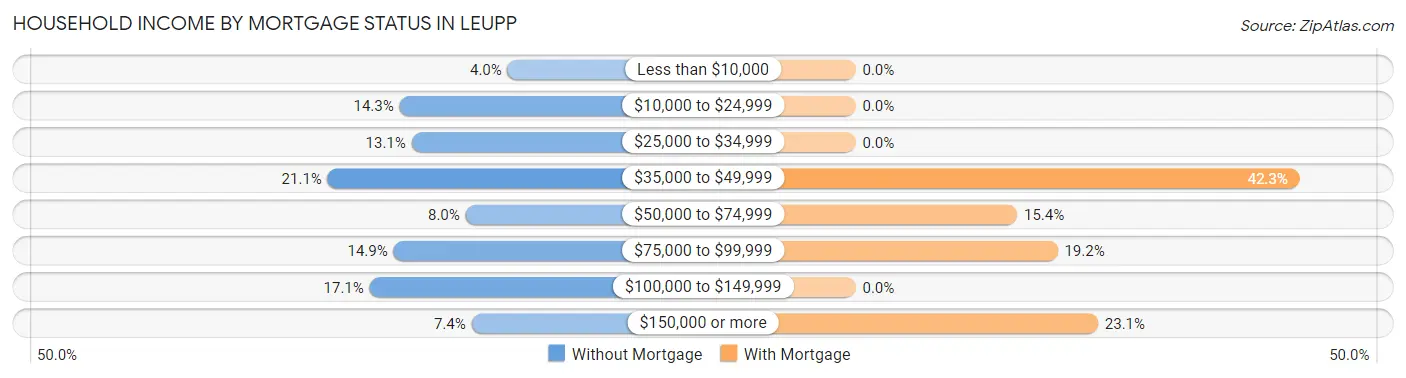
| Household Income | Without Mortgage | With Mortgage |
| Less than $10,000 | 7 (4.0%) | 0 (0.0%) |
| $10,000 to $24,999 | 25 (14.3%) | 0 (0.0%) |
| $25,000 to $34,999 | 23 (13.1%) | 0 (0.0%) |
| $35,000 to $49,999 | 37 (21.1%) | 11 (42.3%) |
| $50,000 to $74,999 | 14 (8.0%) | 4 (15.4%) |
| $75,000 to $99,999 | 26 (14.9%) | 5 (19.2%) |
| $100,000 to $149,999 | 30 (17.1%) | 0 (0.0%) |
| $150,000 or more | 13 (7.4%) | 6 (23.1%) |
| Total | 175 (100.0%) | 26 (100.0%) |
Property Value to Household Income Ratio in Leupp
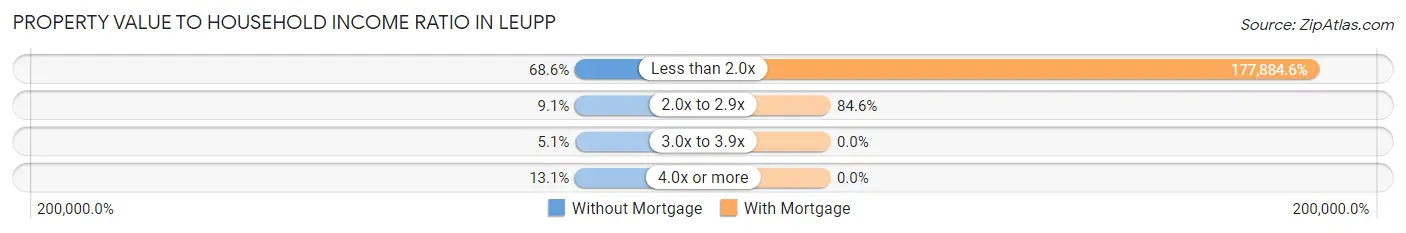
| Value-to-Income Ratio | Without Mortgage | With Mortgage |
| Less than 2.0x | 120 (68.6%) | 46,250 (177,884.6%) |
| 2.0x to 2.9x | 16 (9.1%) | 22 (84.6%) |
| 3.0x to 3.9x | 9 (5.1%) | 0 (0.0%) |
| 4.0x or more | 23 (13.1%) | 0 (0.0%) |
| Total | 175 (100.0%) | 26 (100.0%) |
Real Estate Taxes by Mortgage Status in Leupp
| Property Taxes | Without Mortgage | With Mortgage |
| Less than $800 | 0 (0.0%) | 0 (0.0%) |
| $800 to $1,499 | 0 (0.0%) | 0 (0.0%) |
| $800 to $1,499 | 0 (0.0%) | 0 (0.0%) |
| Total | 175 (100.0%) | 26 (100.0%) |
Health & Disability in Leupp
Health Insurance Coverage by Age in Leupp
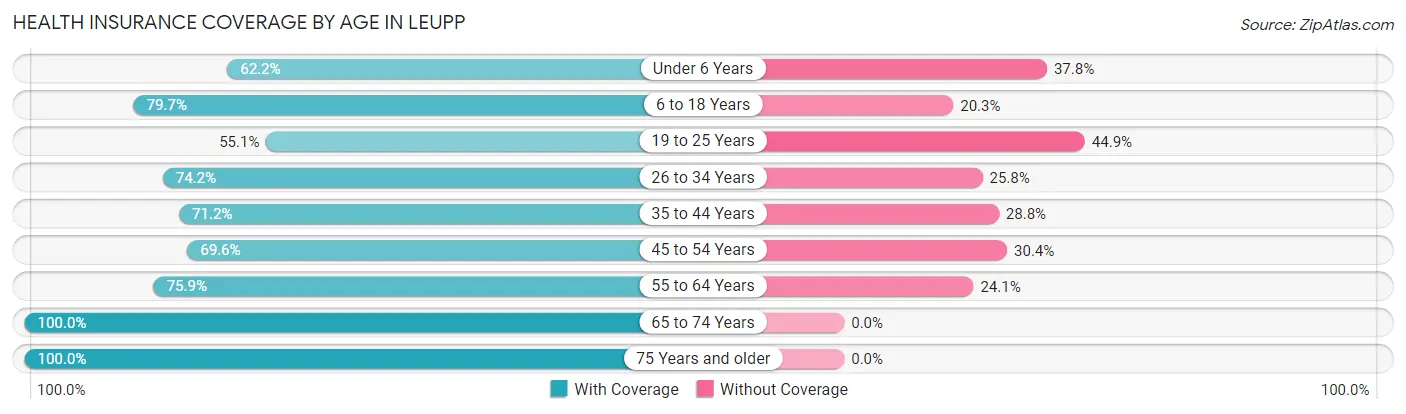
| Age Bracket | With Coverage | Without Coverage |
| Under 6 Years | 79 (62.2%) | 48 (37.8%) |
| 6 to 18 Years | 196 (79.7%) | 50 (20.3%) |
| 19 to 25 Years | 86 (55.1%) | 70 (44.9%) |
| 26 to 34 Years | 95 (74.2%) | 33 (25.8%) |
| 35 to 44 Years | 116 (71.2%) | 47 (28.8%) |
| 45 to 54 Years | 78 (69.6%) | 34 (30.4%) |
| 55 to 64 Years | 104 (75.9%) | 33 (24.1%) |
| 65 to 74 Years | 54 (100.0%) | 0 (0.0%) |
| 75 Years and older | 56 (100.0%) | 0 (0.0%) |
| Total | 864 (73.3%) | 315 (26.7%) |
Health Insurance Coverage by Citizenship Status in Leupp
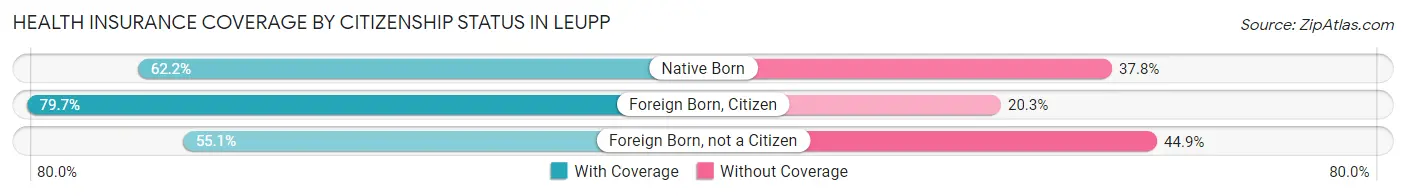
| Citizenship Status | With Coverage | Without Coverage |
| Native Born | 79 (62.2%) | 48 (37.8%) |
| Foreign Born, Citizen | 196 (79.7%) | 50 (20.3%) |
| Foreign Born, not a Citizen | 86 (55.1%) | 70 (44.9%) |
Health Insurance Coverage by Household Income in Leupp
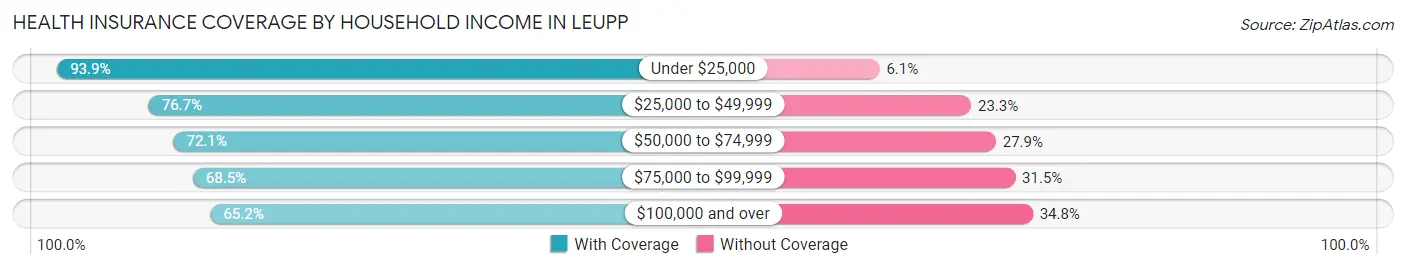
| Household Income | With Coverage | Without Coverage |
| Under $25,000 | 92 (93.9%) | 6 (6.1%) |
| $25,000 to $49,999 | 356 (76.7%) | 108 (23.3%) |
| $50,000 to $74,999 | 62 (72.1%) | 24 (27.9%) |
| $75,000 to $99,999 | 165 (68.5%) | 76 (31.5%) |
| $100,000 and over | 189 (65.2%) | 101 (34.8%) |
Public vs Private Health Insurance Coverage by Age in Leupp
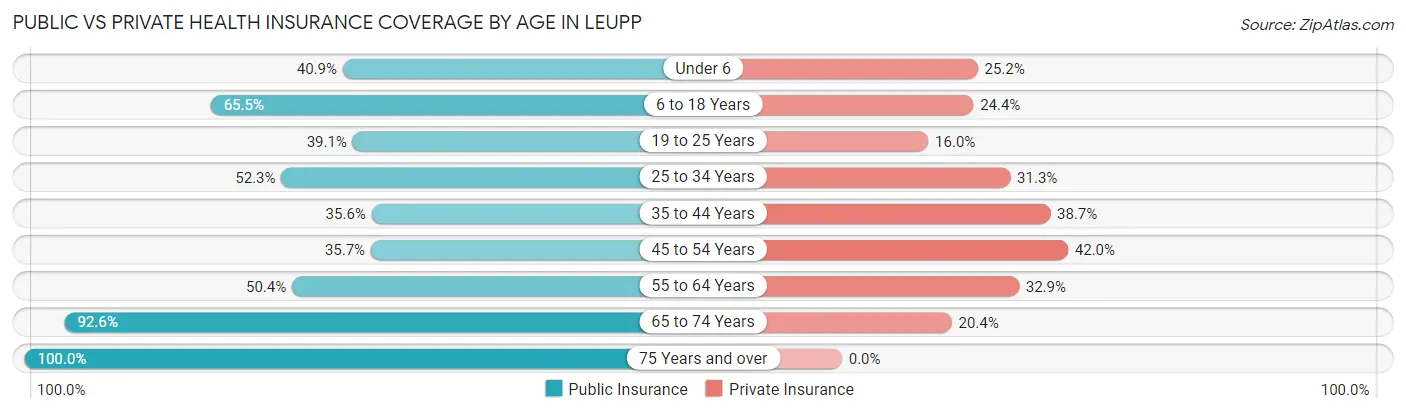
| Age Bracket | Public Insurance | Private Insurance |
| Under 6 | 52 (40.9%) | 32 (25.2%) |
| 6 to 18 Years | 161 (65.4%) | 60 (24.4%) |
| 19 to 25 Years | 61 (39.1%) | 25 (16.0%) |
| 25 to 34 Years | 67 (52.3%) | 40 (31.2%) |
| 35 to 44 Years | 58 (35.6%) | 63 (38.7%) |
| 45 to 54 Years | 40 (35.7%) | 47 (42.0%) |
| 55 to 64 Years | 69 (50.4%) | 45 (32.9%) |
| 65 to 74 Years | 50 (92.6%) | 11 (20.4%) |
| 75 Years and over | 56 (100.0%) | 0 (0.0%) |
| Total | 614 (52.1%) | 323 (27.4%) |
Disability Status by Sex by Age in Leupp
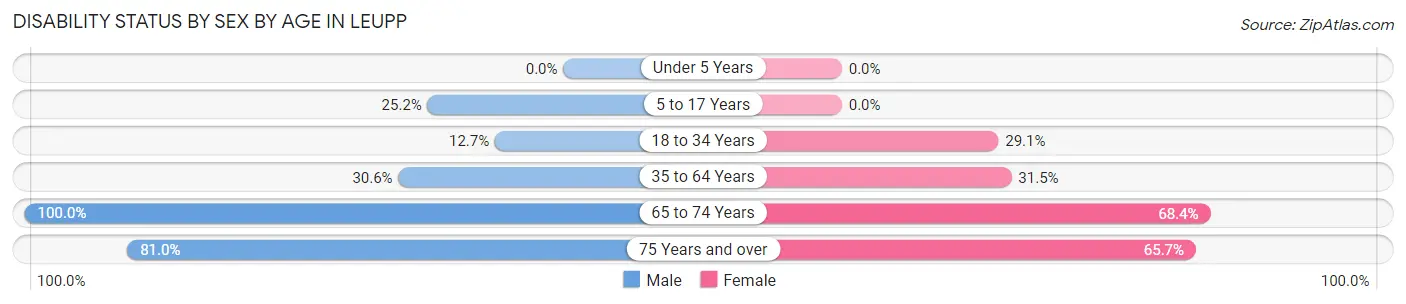
| Age Bracket | Male | Female |
| Under 5 Years | 0 (0.0%) | 0 (0.0%) |
| 5 to 17 Years | 33 (25.2%) | 0 (0.0%) |
| 18 to 34 Years | 18 (12.7%) | 43 (29.0%) |
| 35 to 64 Years | 60 (30.6%) | 68 (31.5%) |
| 65 to 74 Years | 16 (100.0%) | 26 (68.4%) |
| 75 Years and over | 17 (80.9%) | 23 (65.7%) |
Disability Class by Sex by Age in Leupp
Disability Class: Hearing Difficulty
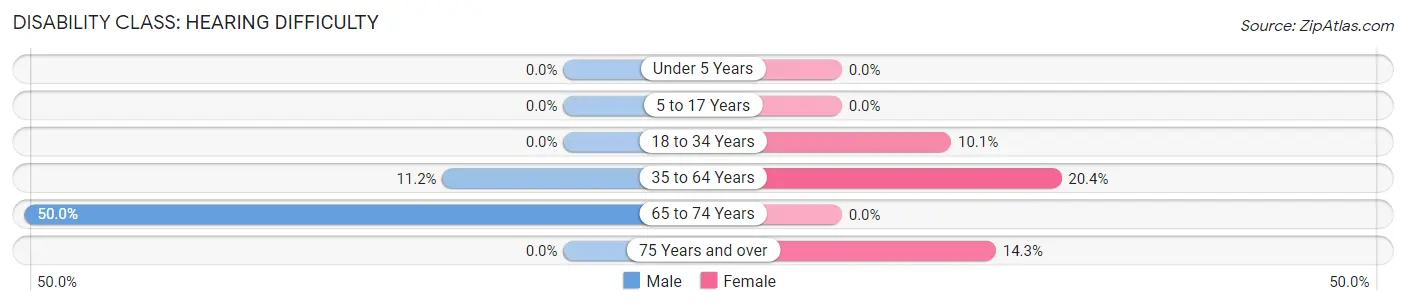
| Age Bracket | Male | Female |
| Under 5 Years | 0 (0.0%) | 0 (0.0%) |
| 5 to 17 Years | 0 (0.0%) | 0 (0.0%) |
| 18 to 34 Years | 0 (0.0%) | 15 (10.1%) |
| 35 to 64 Years | 22 (11.2%) | 44 (20.4%) |
| 65 to 74 Years | 8 (50.0%) | 0 (0.0%) |
| 75 Years and over | 0 (0.0%) | 5 (14.3%) |
Disability Class: Vision Difficulty
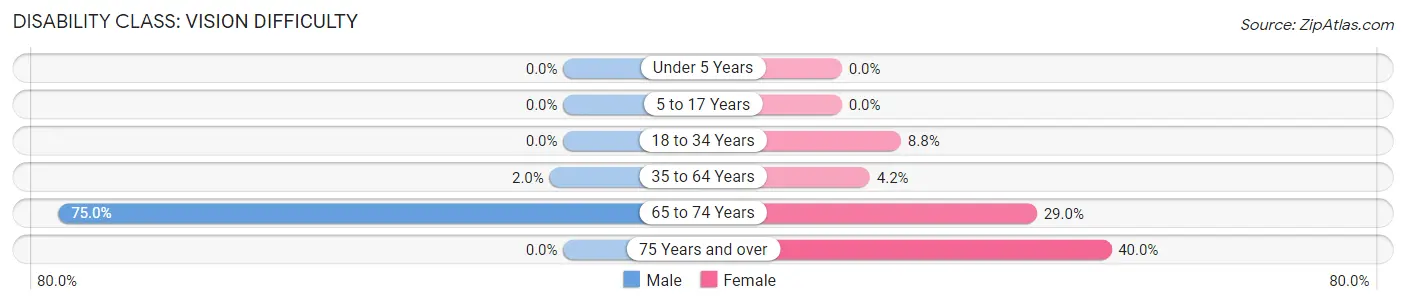
| Age Bracket | Male | Female |
| Under 5 Years | 0 (0.0%) | 0 (0.0%) |
| 5 to 17 Years | 0 (0.0%) | 0 (0.0%) |
| 18 to 34 Years | 0 (0.0%) | 13 (8.8%) |
| 35 to 64 Years | 4 (2.0%) | 9 (4.2%) |
| 65 to 74 Years | 12 (75.0%) | 11 (28.9%) |
| 75 Years and over | 0 (0.0%) | 14 (40.0%) |
Disability Class: Cognitive Difficulty
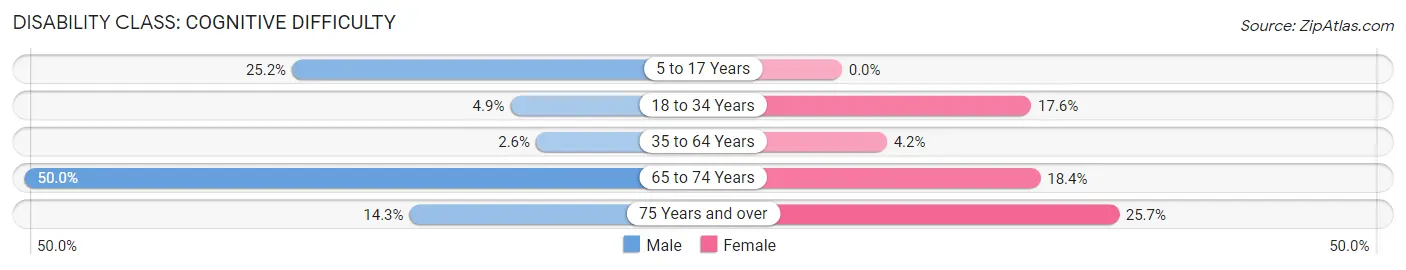
| Age Bracket | Male | Female |
| 5 to 17 Years | 33 (25.2%) | 0 (0.0%) |
| 18 to 34 Years | 7 (4.9%) | 26 (17.6%) |
| 35 to 64 Years | 5 (2.5%) | 9 (4.2%) |
| 65 to 74 Years | 8 (50.0%) | 7 (18.4%) |
| 75 Years and over | 3 (14.3%) | 9 (25.7%) |
Disability Class: Ambulatory Difficulty
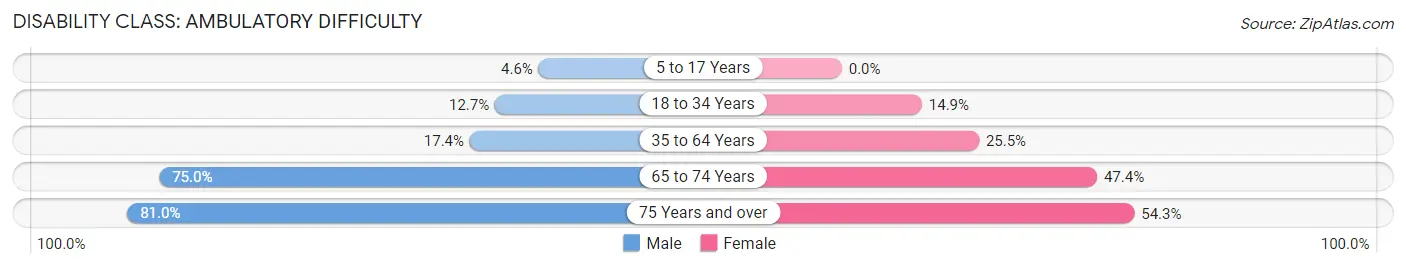
| Age Bracket | Male | Female |
| 5 to 17 Years | 6 (4.6%) | 0 (0.0%) |
| 18 to 34 Years | 18 (12.7%) | 22 (14.9%) |
| 35 to 64 Years | 34 (17.3%) | 55 (25.5%) |
| 65 to 74 Years | 12 (75.0%) | 18 (47.4%) |
| 75 Years and over | 17 (80.9%) | 19 (54.3%) |
Disability Class: Self-Care Difficulty
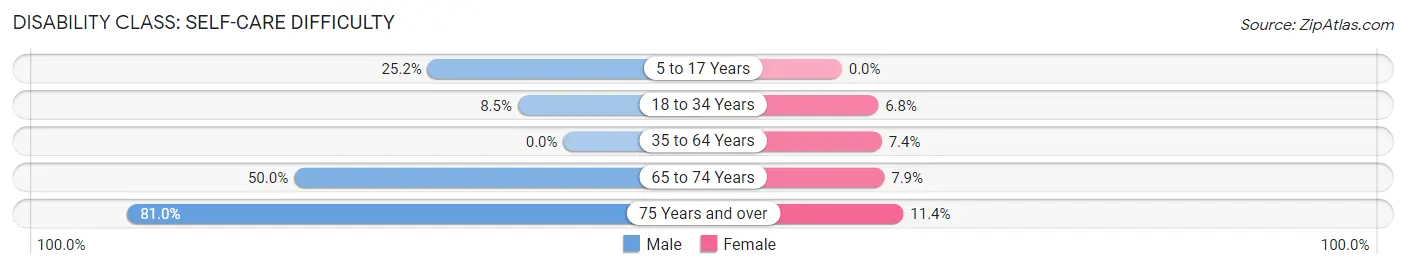
| Age Bracket | Male | Female |
| 5 to 17 Years | 33 (25.2%) | 0 (0.0%) |
| 18 to 34 Years | 12 (8.5%) | 10 (6.8%) |
| 35 to 64 Years | 0 (0.0%) | 16 (7.4%) |
| 65 to 74 Years | 8 (50.0%) | 3 (7.9%) |
| 75 Years and over | 17 (80.9%) | 4 (11.4%) |
Technology Access in Leupp
Computing Device Access in Leupp
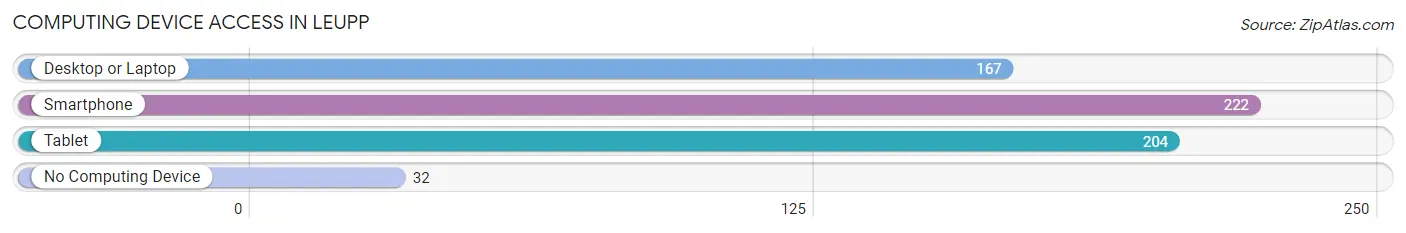
| Device Type | # Households | % Households |
| Desktop or Laptop | 167 | 60.1% |
| Smartphone | 222 | 79.9% |
| Tablet | 204 | 73.4% |
| No Computing Device | 32 | 11.5% |
| Total | 278 | 100.0% |
Internet Access in Leupp
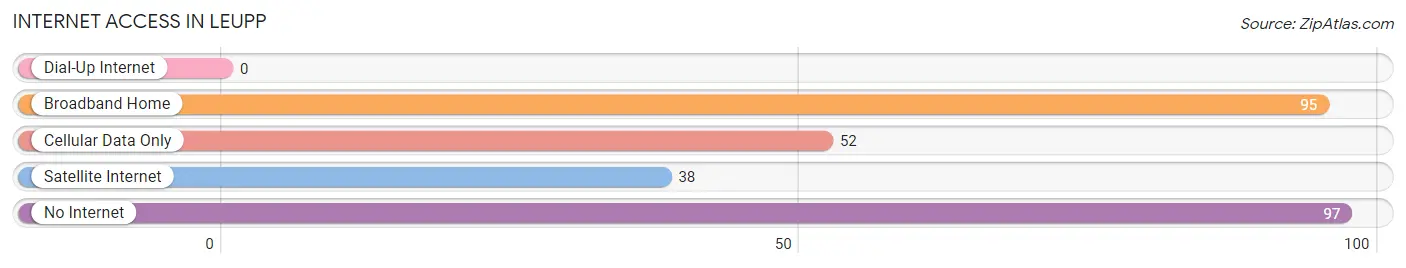
| Internet Type | # Households | % Households |
| Dial-Up Internet | 0 | 0.0% |
| Broadband Home | 95 | 34.2% |
| Cellular Data Only | 52 | 18.7% |
| Satellite Internet | 38 | 13.7% |
| No Internet | 97 | 34.9% |
| Total | 278 | 100.0% |
Leupp Summary
Leupp is a small unincorporated community located in Coconino County, Arizona. It is situated on the Navajo Nation Reservation, approximately 20 miles west of Flagstaff. The population of Leupp was 1,093 at the 2010 census.
History
Leupp was established in 1891 as a trading post for the Navajo people. The trading post was established by the Leupp family, who were of German descent. The Leupps were among the first non-Native Americans to settle in the area. The trading post was a success and the Leupps soon established a school and a post office.
In the early 1900s, the Leupps began to diversify their business interests. They opened a general store, a hotel, and a restaurant. They also began to raise livestock and grow crops. The Leupps were successful in their endeavors and the community of Leupp began to grow.
In the 1920s, the Leupps sold their trading post to the Bureau of Indian Affairs (BIA). The BIA then established a boarding school for Navajo children. The school was designed to teach the children English and to assimilate them into mainstream American culture. The school was in operation until the 1950s.
In the 1950s, the Leupps sold their other businesses to the BIA. The BIA then established a trading post and a health clinic. The trading post and health clinic are still in operation today.
Geography
Leupp is located in Coconino County, Arizona. It is situated on the Navajo Nation Reservation, approximately 20 miles west of Flagstaff. The area is mostly flat and is surrounded by desert. The climate is arid and the average temperature is around 70 degrees Fahrenheit.
Economy
The economy of Leupp is largely based on agriculture and tourism. The area is home to several farms and ranches that produce a variety of crops and livestock. The area is also popular with tourists who come to visit the nearby Grand Canyon and other attractions.
The Leupp Trading Post is a major employer in the area. The trading post sells a variety of goods, including groceries, clothing, and jewelry. The trading post also provides employment to many of the local residents.
Demographics
As of the 2010 census, the population of Leupp was 1,093. The population is mostly Native American, with the majority being Navajo. The median age is 33.7 years and the median household income is $25,000.
Leupp is a small, rural community with a rich history and culture. The area is home to many farms and ranches, as well as a trading post and health clinic. The area is popular with tourists who come to visit the nearby Grand Canyon and other attractions. The population is mostly Native American, with the majority being Navajo. The median age is 33.7 years and the median household income is $25,000.
Common Questions
What is Per Capita Income in Leupp?
Per Capita income in Leupp is $15,686.
What is the Median Family Income in Leupp?
Median Family Income in Leupp is $48,333.
What is the Median Household income in Leupp?
Median Household Income in Leupp is $47,083.
What is Income or Wage Gap in Leupp?
Income or Wage Gap in Leupp is 4.3%.
Women in Leupp earn 95.7 cents for every dollar earned by a man.
What is Inequality or Gini Index in Leupp?
Inequality or Gini Index in Leupp is 0.41.
What is the Total Population of Leupp?
Total Population of Leupp is 1,179.
What is the Total Male Population of Leupp?
Total Male Population of Leupp is 518.
What is the Total Female Population of Leupp?
Total Female Population of Leupp is 661.
What is the Ratio of Males per 100 Females in Leupp?
There are 78.37 Males per 100 Females in Leupp.
What is the Ratio of Females per 100 Males in Leupp?
There are 127.61 Females per 100 Males in Leupp.
What is the Median Population Age in Leupp?
Median Population Age in Leupp is 30.8 Years.
What is the Average Family Size in Leupp
Average Family Size in Leupp is 4.6 People.
What is the Average Household Size in Leupp
Average Household Size in Leupp is 4.2 People.
How Large is the Labor Force in Leupp?
There are 482 People in the Labor Forcein in Leupp.
What is the Percentage of People in the Labor Force in Leupp?
57.8% of People are in the Labor Force in Leupp.
What is the Unemployment Rate in Leupp?
Unemployment Rate in Leupp is 12.9%.