Guadalupe, AZ Map & Demographics
Guadalupe Map
Guadalupe Overview
$26,814
PER CAPITA INCOME
$74,773
AVG FAMILY INCOME
$56,423
AVG HOUSEHOLD INCOME
57.3%
WAGE / INCOME GAP [ % ]
42.7¢/ $1
WAGE / INCOME GAP [ $ ]
0.54
INEQUALITY / GINI INDEX
5,335
TOTAL POPULATION
2,434
MALE POPULATION
2,901
FEMALE POPULATION
83.90
MALES / 100 FEMALES
119.19
FEMALES / 100 MALES
35.2
MEDIAN AGE
3.9
AVG FAMILY SIZE
3.3
AVG HOUSEHOLD SIZE
2,728
LABOR FORCE [ PEOPLE ]
64.0%
PERCENT IN LABOR FORCE
4.5%
UNEMPLOYMENT RATE
Income in Guadalupe
Income Overview in Guadalupe
Per Capita Income in Guadalupe is $26,814, while median incomes of families and households are $74,773 and $56,423 respectively.
| Characteristic | Number | Measure |
| Per Capita Income | 5,335 | $26,814 |
| Median Family Income | 1,188 | $74,773 |
| Mean Family Income | 1,188 | $100,651 |
| Median Household Income | 1,614 | $56,423 |
| Mean Household Income | 1,614 | $82,037 |
| Income Deficit | 1,188 | $0 |
| Wage / Income Gap (%) | 5,335 | 57.29% |
| Wage / Income Gap ($) | 5,335 | 42.71¢ per $1 |
| Gini / Inequality Index | 5,335 | 0.54 |
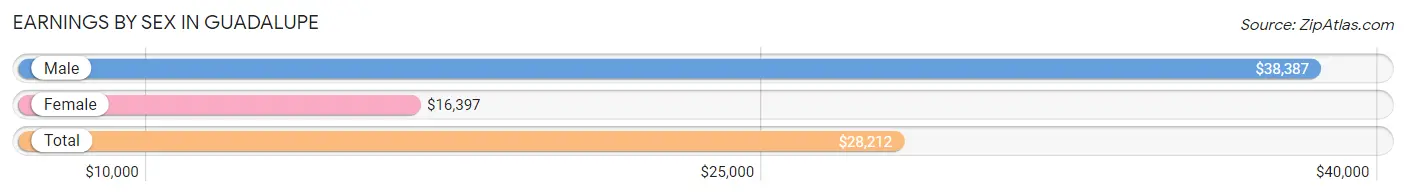
Earnings by Sex in Guadalupe
Average Earnings in Guadalupe are $28,212, $38,387 for men and $16,397 for women, a difference of 57.3%.
| Sex | Number | Average Earnings |
| Male | 1,372 (50.6%) | $38,387 |
| Female | 1,339 (49.4%) | $16,397 |
| Total | 2,711 (100.0%) | $28,212 |
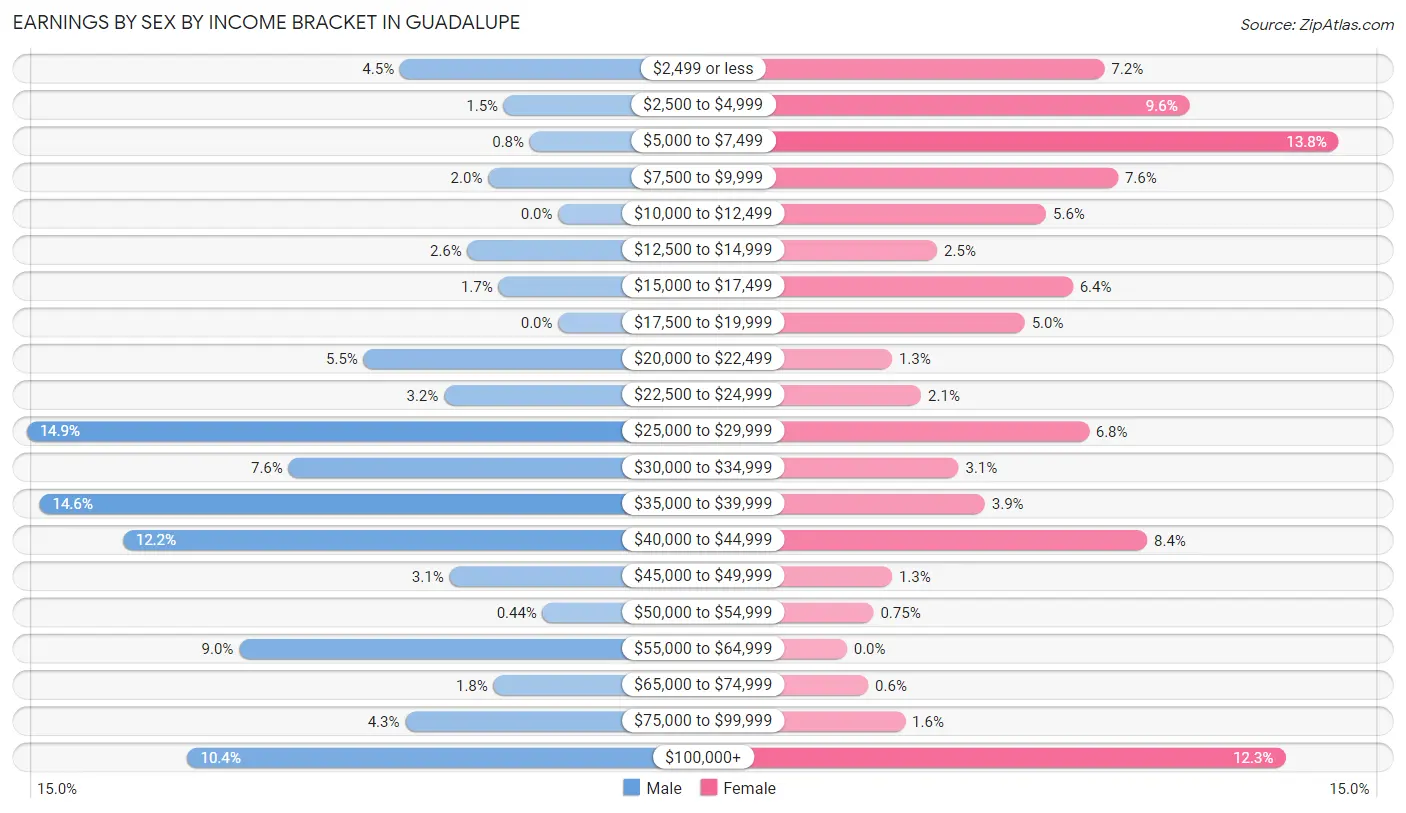
Earnings by Sex by Income Bracket in Guadalupe
The most common earnings brackets in Guadalupe are $25,000 to $29,999 for men (205 | 14.9%) and $5,000 to $7,499 for women (185 | 13.8%).
| Income | Male | Female |
| $2,499 or less | 61 (4.4%) | 97 (7.2%) |
| $2,500 to $4,999 | 21 (1.5%) | 129 (9.6%) |
| $5,000 to $7,499 | 11 (0.8%) | 185 (13.8%) |
| $7,500 to $9,999 | 27 (2.0%) | 102 (7.6%) |
| $10,000 to $12,499 | 0 (0.0%) | 75 (5.6%) |
| $12,500 to $14,999 | 35 (2.5%) | 34 (2.5%) |
| $15,000 to $17,499 | 23 (1.7%) | 85 (6.4%) |
| $17,500 to $19,999 | 0 (0.0%) | 67 (5.0%) |
| $20,000 to $22,499 | 75 (5.5%) | 17 (1.3%) |
| $22,500 to $24,999 | 44 (3.2%) | 28 (2.1%) |
| $25,000 to $29,999 | 205 (14.9%) | 91 (6.8%) |
| $30,000 to $34,999 | 104 (7.6%) | 42 (3.1%) |
| $35,000 to $39,999 | 200 (14.6%) | 52 (3.9%) |
| $40,000 to $44,999 | 168 (12.2%) | 113 (8.4%) |
| $45,000 to $49,999 | 42 (3.1%) | 17 (1.3%) |
| $50,000 to $54,999 | 6 (0.4%) | 10 (0.7%) |
| $55,000 to $64,999 | 123 (9.0%) | 0 (0.0%) |
| $65,000 to $74,999 | 25 (1.8%) | 8 (0.6%) |
| $75,000 to $99,999 | 59 (4.3%) | 22 (1.6%) |
| $100,000+ | 143 (10.4%) | 165 (12.3%) |
| Total | 1,372 (100.0%) | 1,339 (100.0%) |
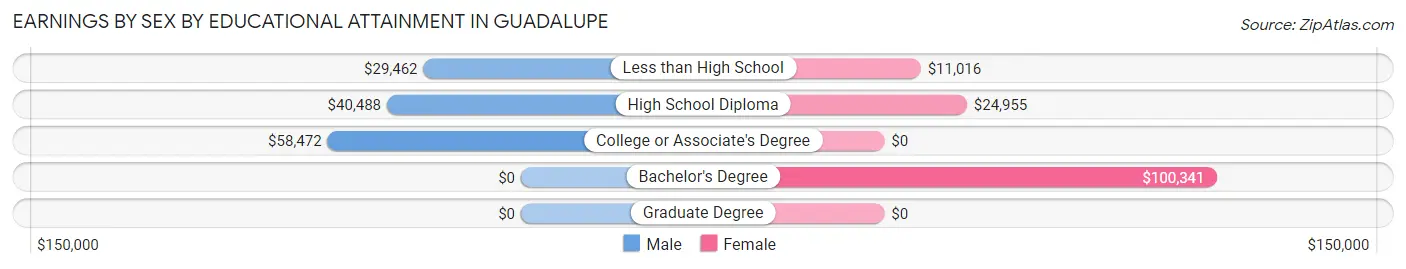
Earnings by Sex by Educational Attainment in Guadalupe
Average earnings in Guadalupe are $39,630 for men and $17,368 for women, a difference of 56.2%. Men with an educational attainment of college or associate's degree enjoy the highest average annual earnings of $58,472, while those with less than high school education earn the least with $29,462. Women with an educational attainment of bachelor's degree earn the most with the average annual earnings of $100,341, while those with less than high school education have the smallest earnings of $11,016.
| Educational Attainment | Male Income | Female Income |
| Less than High School | $29,462 | $11,016 |
| High School Diploma | $40,488 | $24,955 |
| College or Associate's Degree | $58,472 | $0 |
| Bachelor's Degree | - | - |
| Graduate Degree | - | - |
| Total | $39,630 | $17,368 |
Family Income in Guadalupe
Family Income Brackets in Guadalupe
According to the Guadalupe family income data, there are 225 families falling into the $75,000 to $99,999 income range, which is the most common income bracket and makes up 18.9% of all families. Conversely, the $25,000 to $34,999 income bracket is the least frequent group with only 12 families (1.0%) belonging to this category.
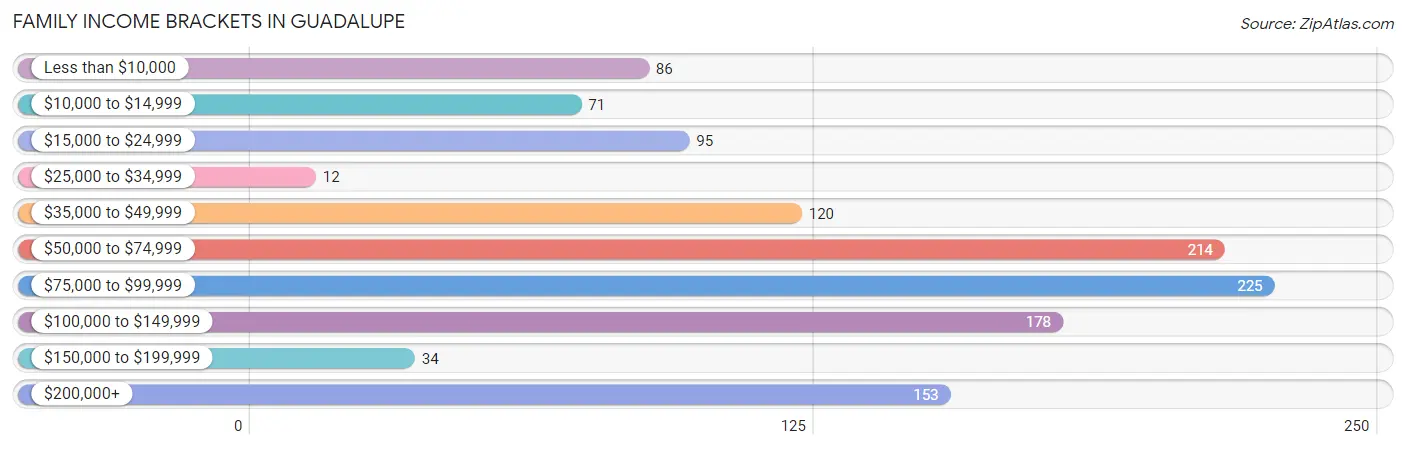
| Income Bracket | # Families | % Families |
| Less than $10,000 | 86 | 7.2% |
| $10,000 to $14,999 | 71 | 6.0% |
| $15,000 to $24,999 | 95 | 8.0% |
| $25,000 to $34,999 | 12 | 1.0% |
| $35,000 to $49,999 | 120 | 10.1% |
| $50,000 to $74,999 | 214 | 18.0% |
| $75,000 to $99,999 | 225 | 18.9% |
| $100,000 to $149,999 | 178 | 15.0% |
| $150,000 to $199,999 | 34 | 2.9% |
| $200,000+ | 153 | 12.9% |
Family Income by Famaliy Size in Guadalupe
7+ person families (103 | 8.7%) account for the highest median family income in Guadalupe with $93,958 per family, while 2-person families (364 | 30.6%) have the highest median income of $37,206 per family member.
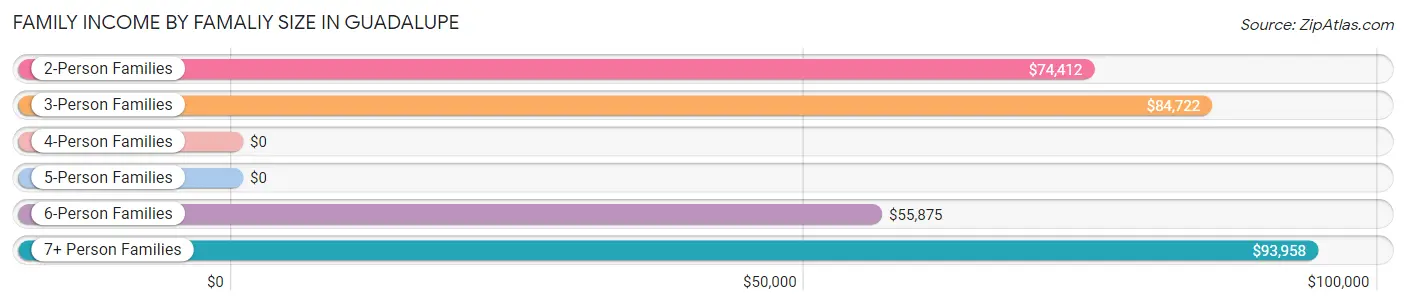
| Income Bracket | # Families | Median Income |
| 2-Person Families | 364 (30.6%) | $74,412 |
| 3-Person Families | 254 (21.4%) | $84,722 |
| 4-Person Families | 255 (21.5%) | $0 |
| 5-Person Families | 119 (10.0%) | $0 |
| 6-Person Families | 93 (7.8%) | $55,875 |
| 7+ Person Families | 103 (8.7%) | $93,958 |
| Total | 1,188 (100.0%) | $74,773 |
Family Income by Number of Earners in Guadalupe
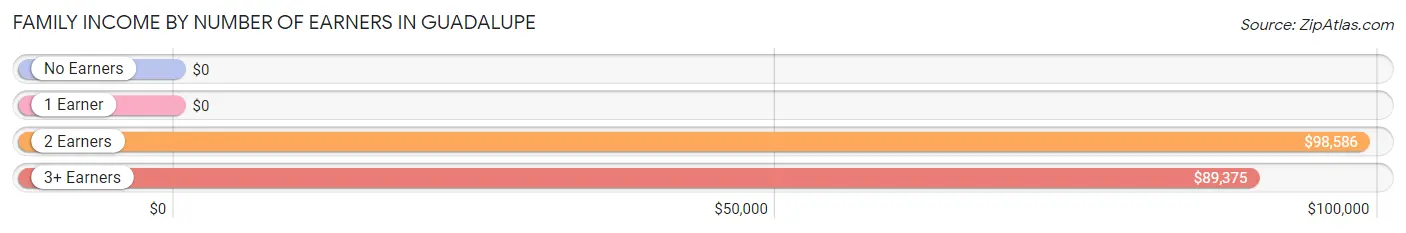
| Number of Earners | # Families | Median Income |
| No Earners | 148 (12.5%) | $0 |
| 1 Earner | 262 (22.1%) | $0 |
| 2 Earners | 451 (38.0%) | $98,586 |
| 3+ Earners | 327 (27.5%) | $89,375 |
| Total | 1,188 (100.0%) | $74,773 |
Household Income in Guadalupe
Household Income Brackets in Guadalupe
With 245 households falling in the category, the $50,000 to $74,999 income range is the most frequent in Guadalupe, accounting for 15.2% of all households. In contrast, only 34 households (2.1%) fall into the $150,000 to $199,999 income bracket, making it the least populous group.
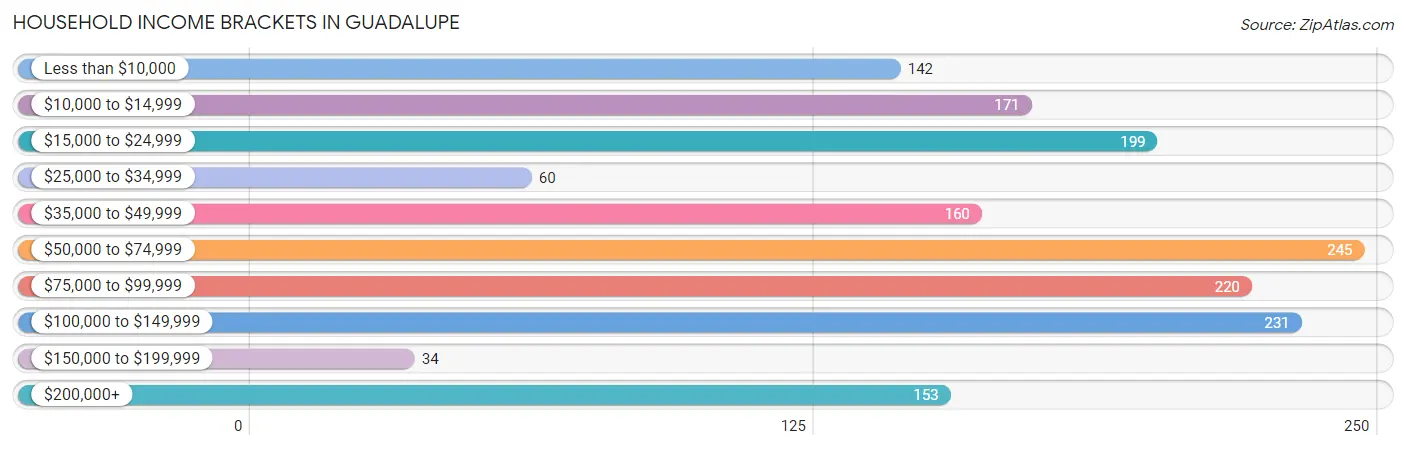
| Income Bracket | # Households | % Households |
| Less than $10,000 | 142 | 8.8% |
| $10,000 to $14,999 | 171 | 10.6% |
| $15,000 to $24,999 | 199 | 12.3% |
| $25,000 to $34,999 | 60 | 3.7% |
| $35,000 to $49,999 | 160 | 9.9% |
| $50,000 to $74,999 | 245 | 15.2% |
| $75,000 to $99,999 | 220 | 13.6% |
| $100,000 to $149,999 | 231 | 14.3% |
| $150,000 to $199,999 | 34 | 2.1% |
| $200,000+ | 153 | 9.5% |
Household Income by Householder Age in Guadalupe
The median household income in Guadalupe is $56,423, with the highest median household income of $79,738 found in the 45 to 64 years age bracket for the primary householder. A total of 787 households (48.8%) fall into this category. Meanwhile, the 15 to 24 years age bracket for the primary householder has the lowest median household income of $0, with 14 households (0.9%) in this group.
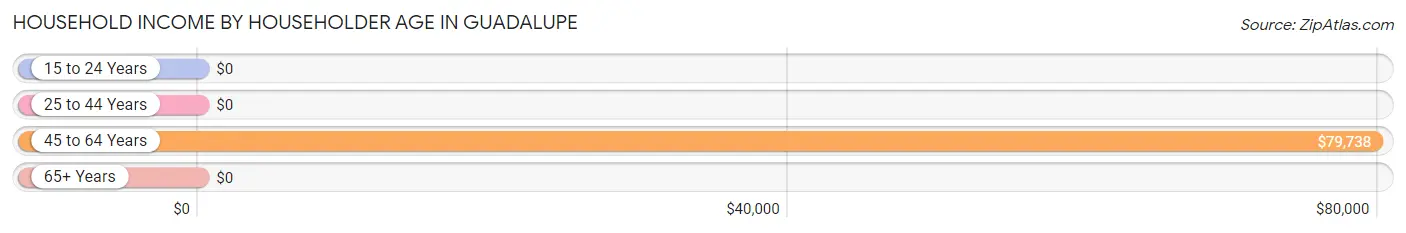
| Income Bracket | # Households | Median Income |
| 15 to 24 Years | 14 (0.9%) | $0 |
| 25 to 44 Years | 409 (25.3%) | $0 |
| 45 to 64 Years | 787 (48.8%) | $79,738 |
| 65+ Years | 404 (25.0%) | $0 |
| Total | 1,614 (100.0%) | $56,423 |
Poverty in Guadalupe
Income Below Poverty by Sex and Age in Guadalupe
With 14.5% poverty level for males and 30.5% for females among the residents of Guadalupe, 12 to 14 year old males and 6 to 11 year old females are the most vulnerable to poverty, with 51 males (70.8%) and 113 females (58.0%) in their respective age groups living below the poverty level.
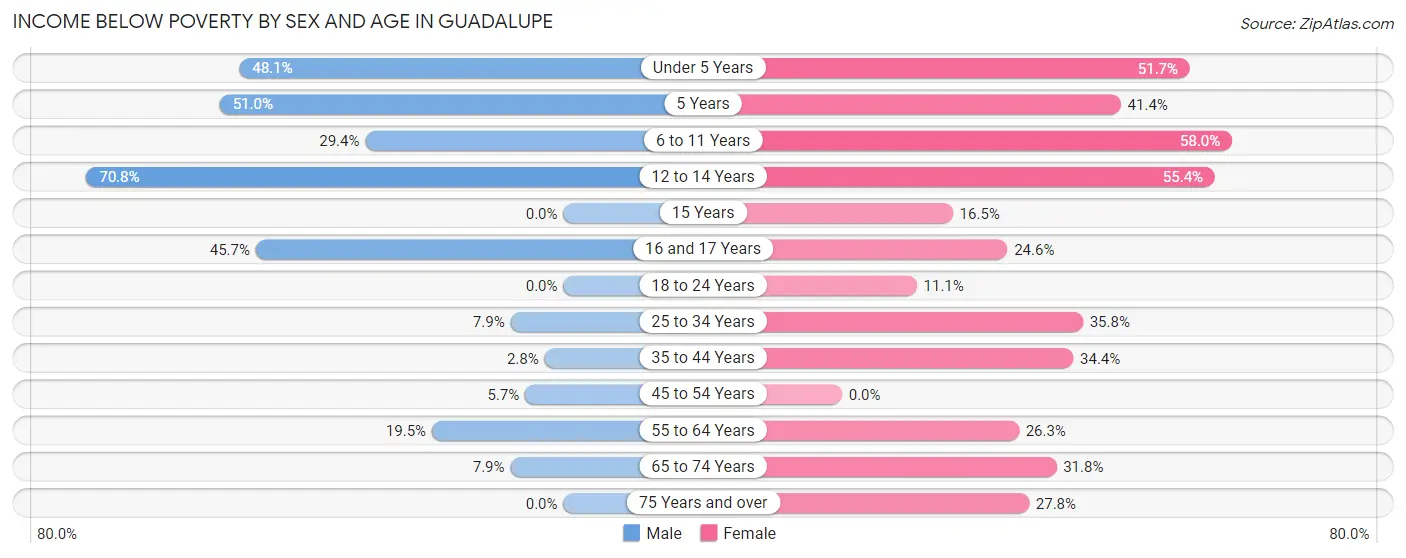
| Age Bracket | Male | Female |
| Under 5 Years | 51 (48.1%) | 77 (51.7%) |
| 5 Years | 25 (51.0%) | 53 (41.4%) |
| 6 to 11 Years | 25 (29.4%) | 113 (58.0%) |
| 12 to 14 Years | 51 (70.8%) | 77 (55.4%) |
| 15 Years | 0 (0.0%) | 13 (16.5%) |
| 16 and 17 Years | 58 (45.7%) | 43 (24.6%) |
| 18 to 24 Years | 0 (0.0%) | 16 (11.1%) |
| 25 to 34 Years | 34 (7.9%) | 161 (35.8%) |
| 35 to 44 Years | 8 (2.8%) | 101 (34.4%) |
| 45 to 54 Years | 22 (5.7%) | 0 (0.0%) |
| 55 to 64 Years | 65 (19.5%) | 119 (26.3%) |
| 65 to 74 Years | 10 (7.9%) | 78 (31.8%) |
| 75 Years and over | 0 (0.0%) | 35 (27.8%) |
| Total | 349 (14.5%) | 886 (30.5%) |
Income Above Poverty by Sex and Age in Guadalupe
According to the poverty statistics in Guadalupe, males aged 15 years and females aged 45 to 54 years are the age groups that are most secure financially, with 100.0% of males and 100.0% of females in these age groups living above the poverty line.
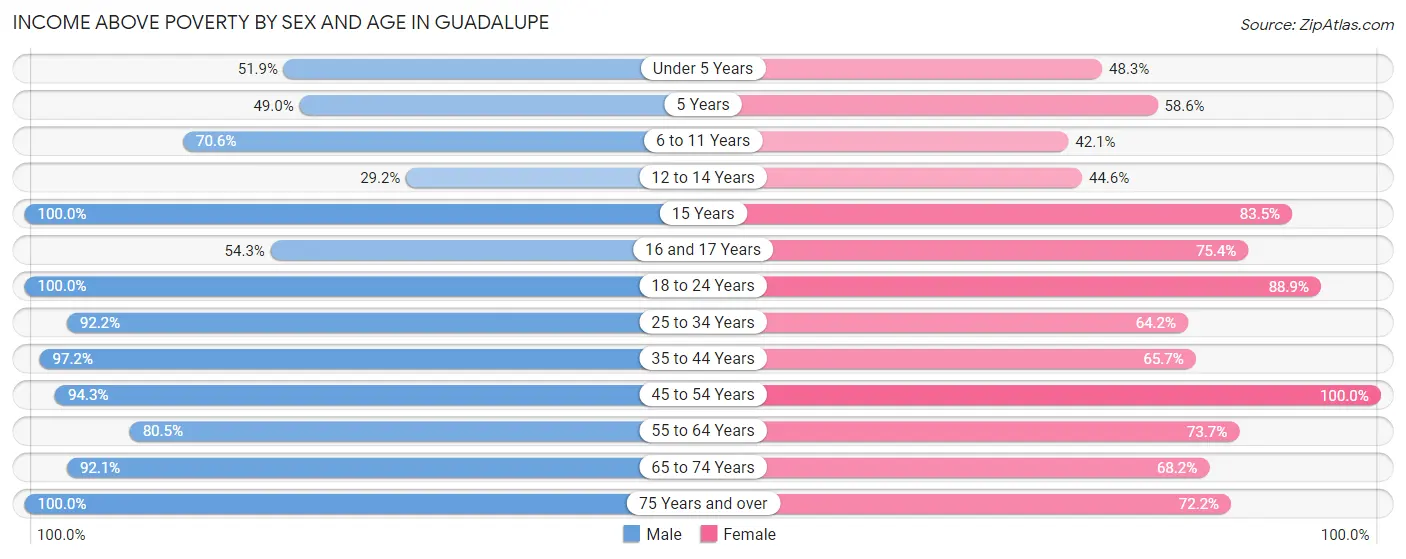
| Age Bracket | Male | Female |
| Under 5 Years | 55 (51.9%) | 72 (48.3%) |
| 5 Years | 24 (49.0%) | 75 (58.6%) |
| 6 to 11 Years | 60 (70.6%) | 82 (42.0%) |
| 12 to 14 Years | 21 (29.2%) | 62 (44.6%) |
| 15 Years | 40 (100.0%) | 66 (83.5%) |
| 16 and 17 Years | 69 (54.3%) | 132 (75.4%) |
| 18 to 24 Years | 259 (100.0%) | 128 (88.9%) |
| 25 to 34 Years | 399 (92.1%) | 289 (64.2%) |
| 35 to 44 Years | 279 (97.2%) | 193 (65.6%) |
| 45 to 54 Years | 365 (94.3%) | 324 (100.0%) |
| 55 to 64 Years | 268 (80.5%) | 334 (73.7%) |
| 65 to 74 Years | 117 (92.1%) | 167 (68.2%) |
| 75 Years and over | 99 (100.0%) | 91 (72.2%) |
| Total | 2,055 (85.5%) | 2,015 (69.5%) |
Income Below Poverty Among Married-Couple Families in Guadalupe
The poverty statistics for married-couple families in Guadalupe show that 2.5% or 16 of the total 631 families live below the poverty line. Families with 3 or 4 children have the highest poverty rate of 26.2%, comprising of 16 families. On the other hand, families with no children have the lowest poverty rate of 0.0%, which includes 0 families.
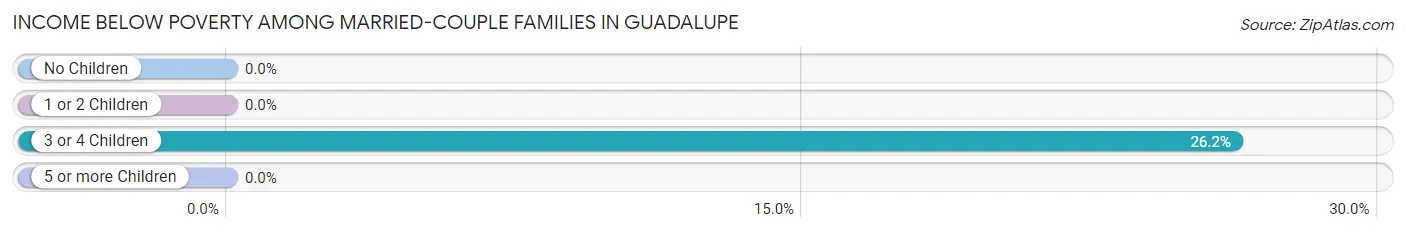
| Children | Above Poverty | Below Poverty |
| No Children | 456 (100.0%) | 0 (0.0%) |
| 1 or 2 Children | 114 (100.0%) | 0 (0.0%) |
| 3 or 4 Children | 45 (73.8%) | 16 (26.2%) |
| 5 or more Children | 0 (0.0%) | 0 (0.0%) |
| Total | 615 (97.5%) | 16 (2.5%) |
Income Below Poverty Among Single-Parent Households in Guadalupe
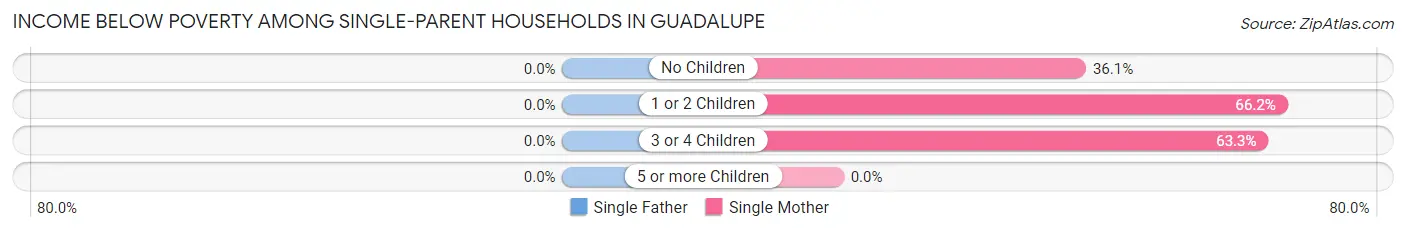
| Children | Single Father | Single Mother |
| No Children | 0 (0.0%) | 26 (36.1%) |
| 1 or 2 Children | 0 (0.0%) | 86 (66.1%) |
| 3 or 4 Children | 0 (0.0%) | 124 (63.3%) |
| 5 or more Children | 0 (0.0%) | 0 (0.0%) |
| Total | 0 (0.0%) | 236 (59.3%) |
Income Below Poverty Among Married-Couple vs Single-Parent Households in Guadalupe
The poverty data for Guadalupe shows that 16 of the married-couple family households (2.5%) and 236 of the single-parent households (42.4%) are living below the poverty level. Within the married-couple family households, those with 3 or 4 children have the highest poverty rate, with 16 households (26.2%) falling below the poverty line. Among the single-parent households, those with 3 or 4 children have the highest poverty rate, with 124 household (63.3%) living below poverty.
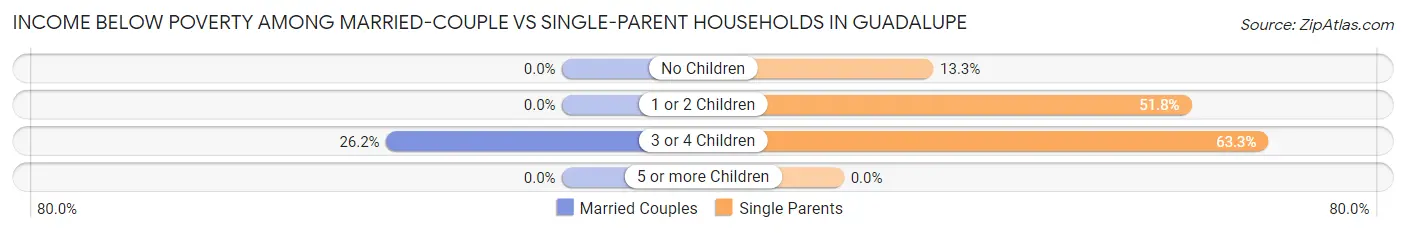
| Children | Married-Couple Families | Single-Parent Households |
| No Children | 0 (0.0%) | 26 (13.3%) |
| 1 or 2 Children | 0 (0.0%) | 86 (51.8%) |
| 3 or 4 Children | 16 (26.2%) | 124 (63.3%) |
| 5 or more Children | 0 (0.0%) | 0 (0.0%) |
| Total | 16 (2.5%) | 236 (42.4%) |
Race in Guadalupe
The most populous races in Guadalupe are Hispanic or Latino (4,043 | 75.8%), Native / Alaskan (1,786 | 33.5%), and White / Caucasian (1,721 | 32.3%).
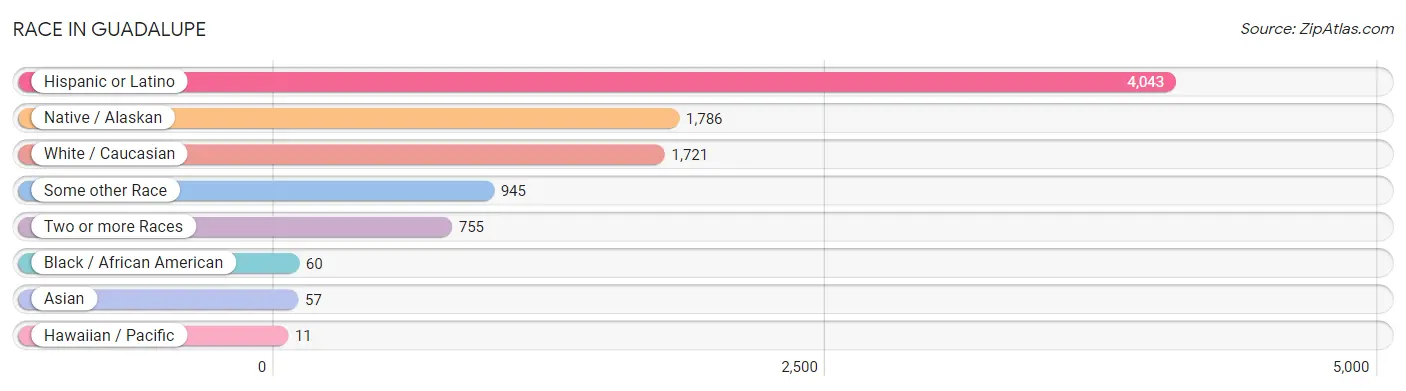
| Race | # Population | % Population |
| Asian | 57 | 1.1% |
| Black / African American | 60 | 1.1% |
| Hawaiian / Pacific | 11 | 0.2% |
| Hispanic or Latino | 4,043 | 75.8% |
| Native / Alaskan | 1,786 | 33.5% |
| White / Caucasian | 1,721 | 32.3% |
| Two or more Races | 755 | 14.1% |
| Some other Race | 945 | 17.7% |
| Total | 5,335 | 100.0% |
Ancestry in Guadalupe
The most populous ancestries reported in Guadalupe are Mexican (3,888 | 72.9%), Yaqui (1,367 | 25.6%), Dominican (82 | 1.5%), Korean (57 | 1.1%), and Central American Indian (47 | 0.9%), together accounting for 102.0% of all Guadalupe residents.
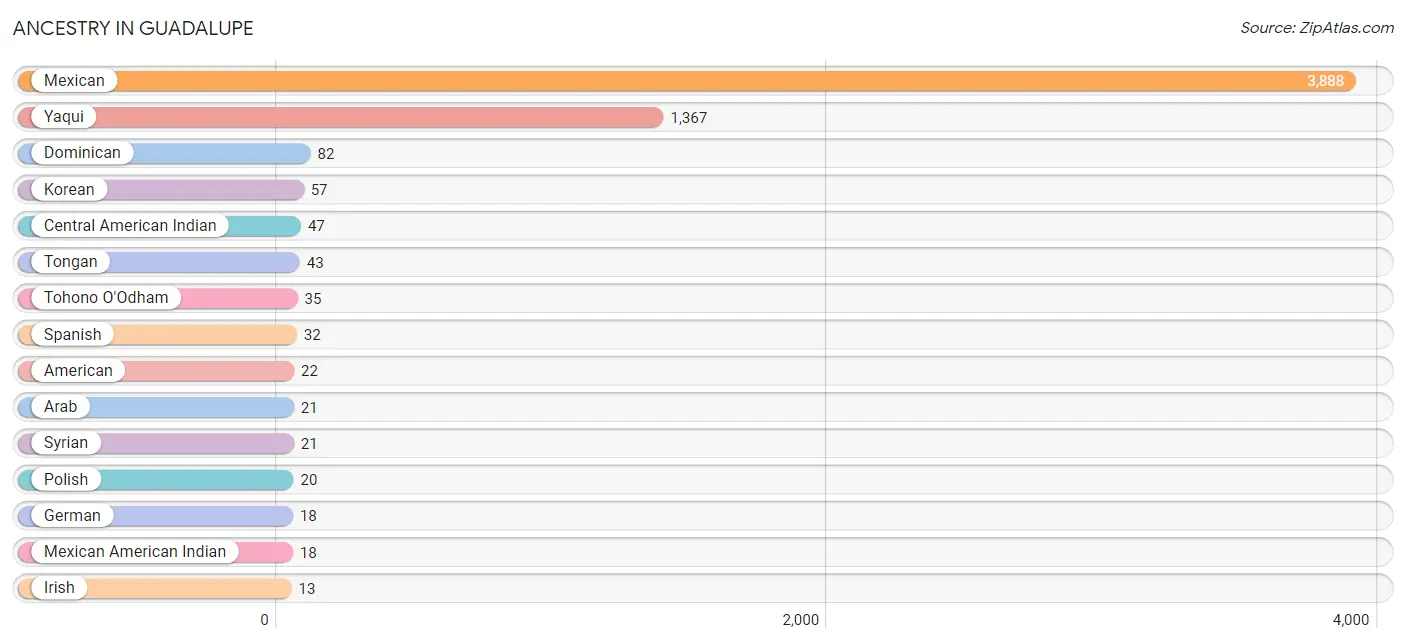
| Ancestry | # Population | % Population |
| African | 8 | 0.2% |
| American | 22 | 0.4% |
| Arab | 21 | 0.4% |
| Central American Indian | 47 | 0.9% |
| Cherokee | 12 | 0.2% |
| Danish | 8 | 0.2% |
| Dominican | 82 | 1.5% |
| English | 8 | 0.2% |
| European | 12 | 0.2% |
| French | 8 | 0.2% |
| German | 18 | 0.3% |
| Irish | 13 | 0.2% |
| Korean | 57 | 1.1% |
| Mexican | 3,888 | 72.9% |
| Mexican American Indian | 18 | 0.3% |
| Polish | 20 | 0.4% |
| Puerto Rican | 8 | 0.2% |
| Scottish | 8 | 0.2% |
| Spanish | 32 | 0.6% |
| Subsaharan African | 8 | 0.2% |
| Swedish | 8 | 0.2% |
| Syrian | 21 | 0.4% |
| Tohono O'Odham | 35 | 0.7% |
| Tongan | 43 | 0.8% |
| Yaqui | 1,367 | 25.6% | View All 25 Rows |
Immigrants in Guadalupe
The most numerous immigrant groups reported in Guadalupe came from Latin America (484 | 9.1%), Central America (392 | 7.3%), Mexico (379 | 7.1%), Caribbean (92 | 1.7%), and Dominican Republic (92 | 1.7%), together accounting for 27.0% of all Guadalupe residents.

| Immigration Origin | # Population | % Population |
| Africa | 8 | 0.2% |
| Asia | 57 | 1.1% |
| Caribbean | 92 | 1.7% |
| Central America | 392 | 7.3% |
| Dominican Republic | 92 | 1.7% |
| El Salvador | 13 | 0.2% |
| Latin America | 484 | 9.1% |
| Mexico | 379 | 7.1% |
| Northern Africa | 8 | 0.2% |
| Philippines | 57 | 1.1% |
| South Eastern Asia | 57 | 1.1% |
| Sudan | 8 | 0.2% | View All 12 Rows |
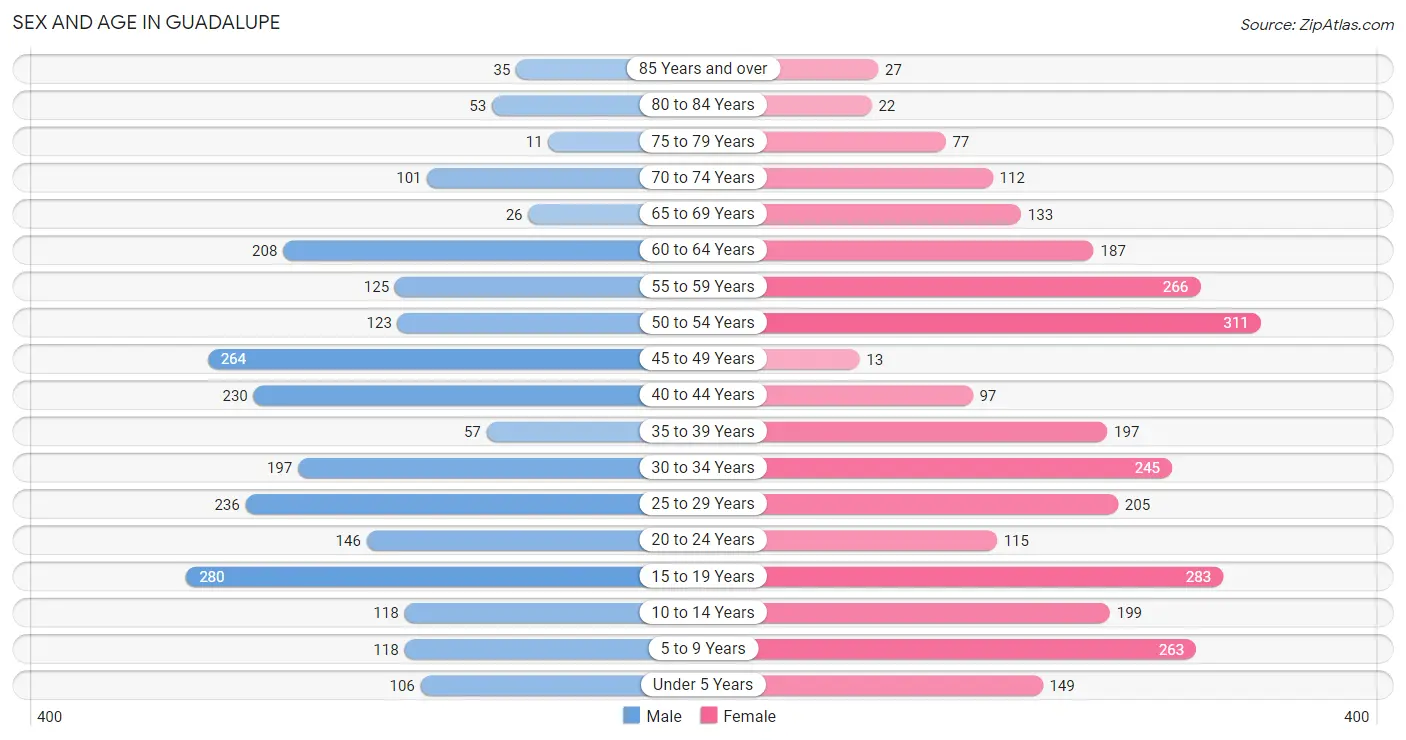
Sex and Age in Guadalupe
Sex and Age in Guadalupe
The most populous age groups in Guadalupe are 15 to 19 Years (280 | 11.5%) for men and 50 to 54 Years (311 | 10.7%) for women.
| Age Bracket | Male | Female |
| Under 5 Years | 106 (4.3%) | 149 (5.1%) |
| 5 to 9 Years | 118 (4.9%) | 263 (9.1%) |
| 10 to 14 Years | 118 (4.9%) | 199 (6.9%) |
| 15 to 19 Years | 280 (11.5%) | 283 (9.8%) |
| 20 to 24 Years | 146 (6.0%) | 115 (4.0%) |
| 25 to 29 Years | 236 (9.7%) | 205 (7.1%) |
| 30 to 34 Years | 197 (8.1%) | 245 (8.5%) |
| 35 to 39 Years | 57 (2.3%) | 197 (6.8%) |
| 40 to 44 Years | 230 (9.5%) | 97 (3.3%) |
| 45 to 49 Years | 264 (10.8%) | 13 (0.4%) |
| 50 to 54 Years | 123 (5.1%) | 311 (10.7%) |
| 55 to 59 Years | 125 (5.1%) | 266 (9.2%) |
| 60 to 64 Years | 208 (8.6%) | 187 (6.5%) |
| 65 to 69 Years | 26 (1.1%) | 133 (4.6%) |
| 70 to 74 Years | 101 (4.2%) | 112 (3.9%) |
| 75 to 79 Years | 11 (0.4%) | 77 (2.6%) |
| 80 to 84 Years | 53 (2.2%) | 22 (0.8%) |
| 85 Years and over | 35 (1.4%) | 27 (0.9%) |
| Total | 2,434 (100.0%) | 2,901 (100.0%) |
Families and Households in Guadalupe
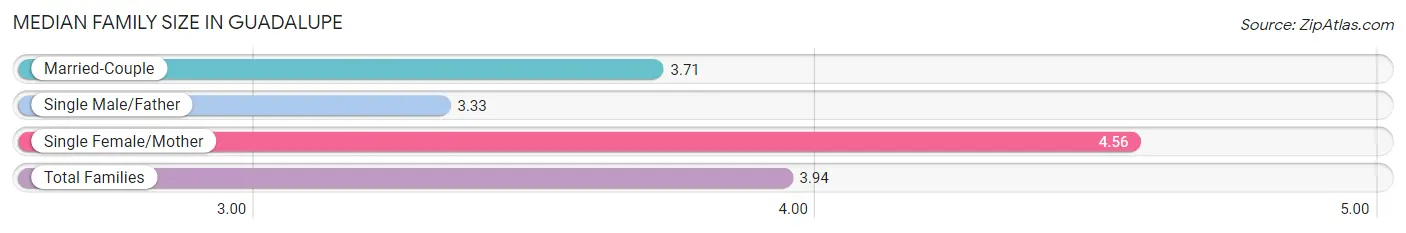
Median Family Size in Guadalupe
The median family size in Guadalupe is 3.94 persons per family, with single female/mother families (398 | 33.5%) accounting for the largest median family size of 4.56 persons per family. On the other hand, single male/father families (159 | 13.4%) represent the smallest median family size with 3.33 persons per family.
| Family Type | # Families | Family Size |
| Married-Couple | 631 (53.1%) | 3.71 |
| Single Male/Father | 159 (13.4%) | 3.33 |
| Single Female/Mother | 398 (33.5%) | 4.56 |
| Total Families | 1,188 (100.0%) | 3.94 |
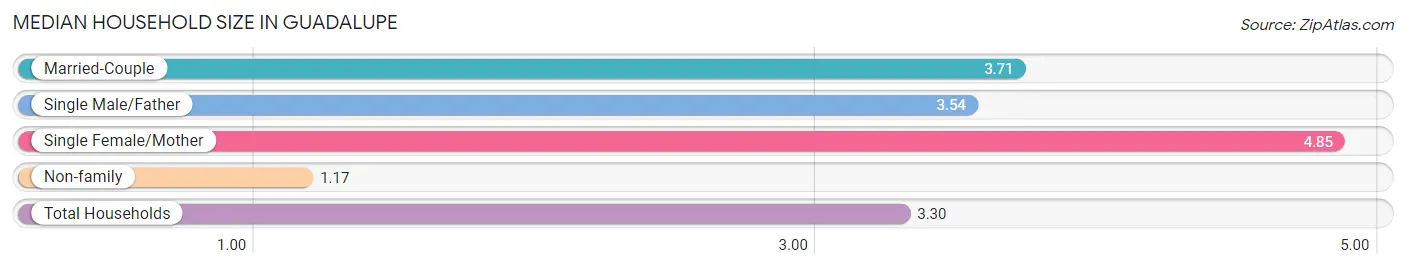
Median Household Size in Guadalupe
The median household size in Guadalupe is 3.30 persons per household, with single female/mother households (398 | 24.7%) accounting for the largest median household size of 4.85 persons per household. non-family households (426 | 26.4%) represent the smallest median household size with 1.17 persons per household.
| Household Type | # Households | Household Size |
| Married-Couple | 631 (39.1%) | 3.71 |
| Single Male/Father | 159 (9.9%) | 3.54 |
| Single Female/Mother | 398 (24.7%) | 4.85 |
| Non-family | 426 (26.4%) | 1.17 |
| Total Households | 1,614 (100.0%) | 3.30 |
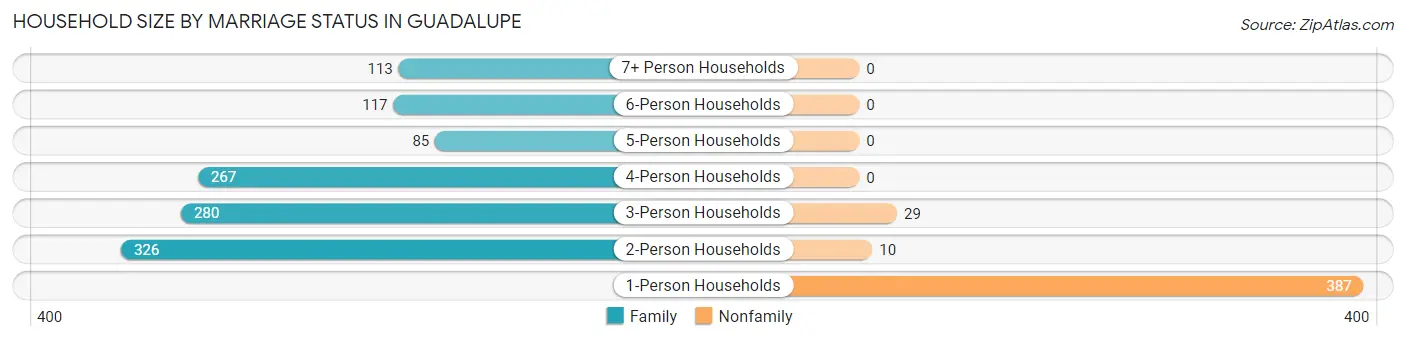
Household Size by Marriage Status in Guadalupe
Out of a total of 1,614 households in Guadalupe, 1,188 (73.6%) are family households, while 426 (26.4%) are nonfamily households. The most numerous type of family households are 2-person households, comprising 326, and the most common type of nonfamily households are 1-person households, comprising 387.
| Household Size | Family Households | Nonfamily Households |
| 1-Person Households | - | 387 (24.0%) |
| 2-Person Households | 326 (20.2%) | 10 (0.6%) |
| 3-Person Households | 280 (17.3%) | 29 (1.8%) |
| 4-Person Households | 267 (16.5%) | 0 (0.0%) |
| 5-Person Households | 85 (5.3%) | 0 (0.0%) |
| 6-Person Households | 117 (7.2%) | 0 (0.0%) |
| 7+ Person Households | 113 (7.0%) | 0 (0.0%) |
| Total | 1,188 (73.6%) | 426 (26.4%) |
Female Fertility in Guadalupe
Fertility by Age in Guadalupe
Average fertility rate in Guadalupe is 48.0 births per 1,000 women. Women in the age bracket of 15 to 19 years have the highest fertility rate with 106.0 births per 1,000 women. Women in the age bracket of 15 to 19 years acount for 54.5% of all women with births.
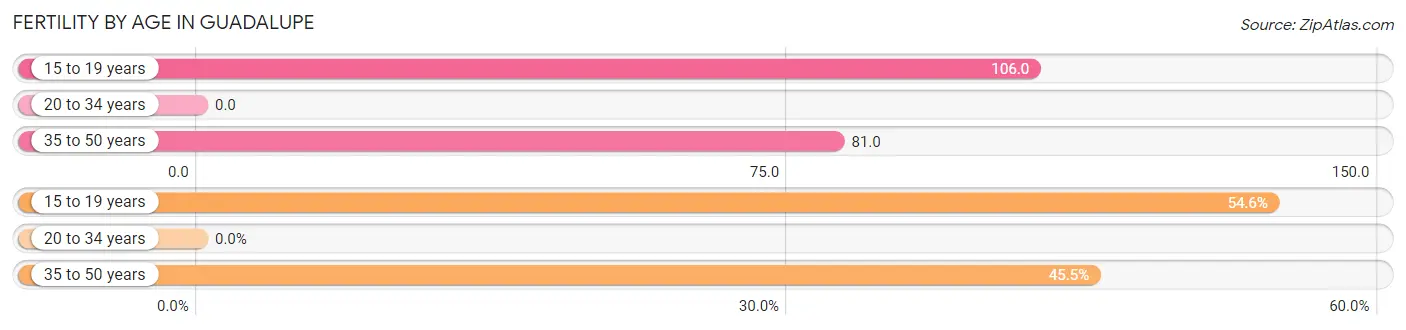
| Age Bracket | Women with Births | Births / 1,000 Women |
| 15 to 19 years | 30 (54.5%) | 106.0 |
| 20 to 34 years | 0 (0.0%) | 0.0 |
| 35 to 50 years | 25 (45.5%) | 81.0 |
| Total | 55 (100.0%) | 48.0 |
Fertility by Age by Marriage Status in Guadalupe
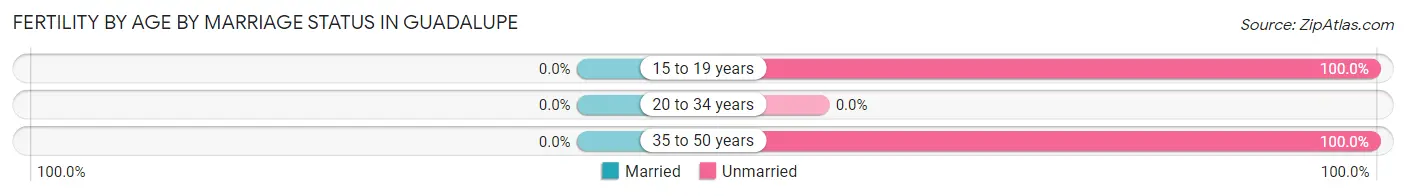
| Age Bracket | Married | Unmarried |
| 15 to 19 years | 0 (0.0%) | 30 (100.0%) |
| 20 to 34 years | 0 (0.0%) | 0 (0.0%) |
| 35 to 50 years | 0 (0.0%) | 25 (100.0%) |
| Total | 0 (0.0%) | 55 (100.0%) |
Fertility by Education in Guadalupe
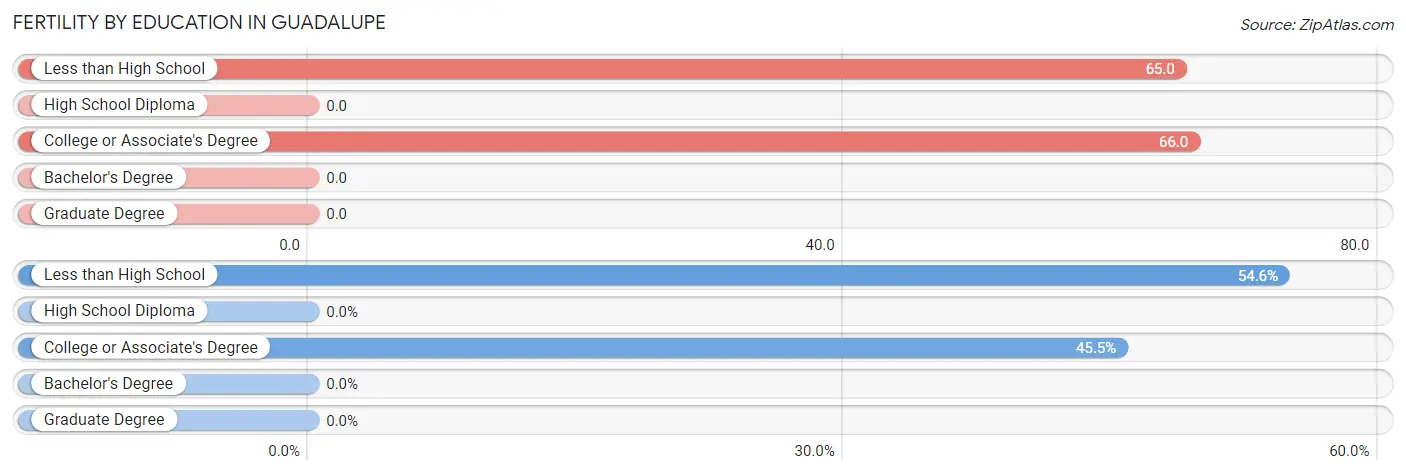
| Educational Attainment | Women with Births | Births / 1,000 Women |
| Less than High School | 30 (54.5%) | 65.0 |
| High School Diploma | 0 (0.0%) | 0.0 |
| College or Associate's Degree | 25 (45.5%) | 66.0 |
| Bachelor's Degree | 0 (0.0%) | 0.0 |
| Graduate Degree | 0 (0.0%) | 0.0 |
| Total | 55 (100.0%) | 48.0 |
Fertility by Education by Marriage Status in Guadalupe
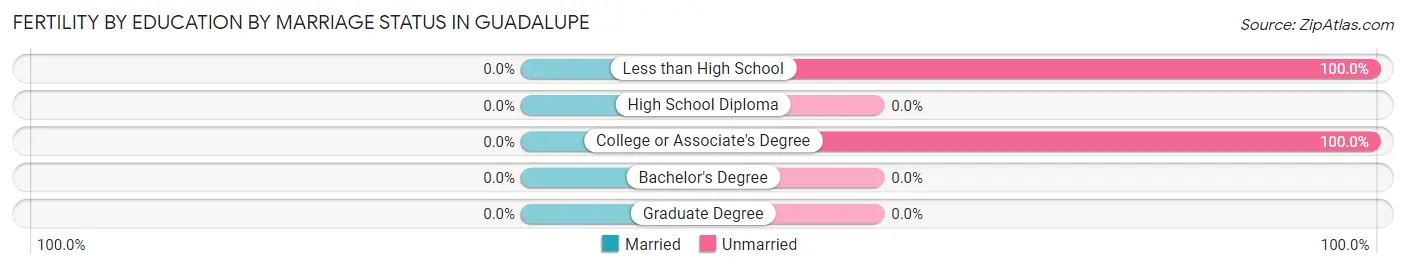
| Educational Attainment | Married | Unmarried |
| Less than High School | 0 (0.0%) | 30 (100.0%) |
| High School Diploma | 0 (0.0%) | 0 (0.0%) |
| College or Associate's Degree | 0 (0.0%) | 25 (100.0%) |
| Bachelor's Degree | 0 (0.0%) | 0 (0.0%) |
| Graduate Degree | 0 (0.0%) | 0 (0.0%) |
| Total | 0 (0.0%) | 55 (100.0%) |
Employment Characteristics in Guadalupe
Employment by Class of Employer in Guadalupe
Among the 2,460 employed individuals in Guadalupe, private company employees (1,649 | 67.0%), local government employees (535 | 21.7%), and self-employed (not incorporated) (102 | 4.2%) make up the most common classes of employment.
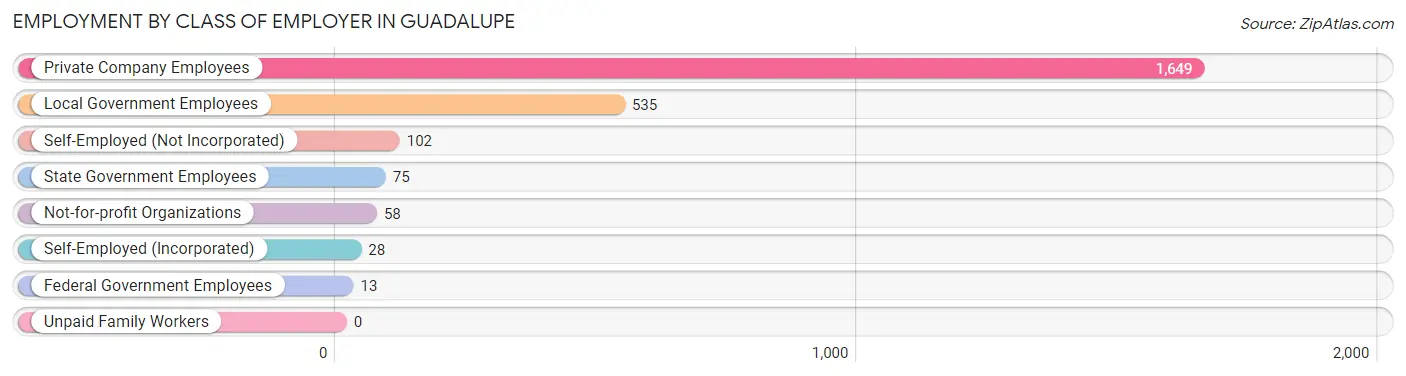
| Employer Class | # Employees | % Employees |
| Private Company Employees | 1,649 | 67.0% |
| Self-Employed (Incorporated) | 28 | 1.1% |
| Self-Employed (Not Incorporated) | 102 | 4.2% |
| Not-for-profit Organizations | 58 | 2.4% |
| Local Government Employees | 535 | 21.7% |
| State Government Employees | 75 | 3.0% |
| Federal Government Employees | 13 | 0.5% |
| Unpaid Family Workers | 0 | 0.0% |
| Total | 2,460 | 100.0% |
Employment Status by Age in Guadalupe
According to the labor force statistics for Guadalupe, out of the total population over 16 years of age (4,263), 64.0% or 2,728 individuals are in the labor force, with 4.5% or 123 of them unemployed. The age group with the highest labor force participation rate is 20 to 24 years, with 100.0% or 261 individuals in the labor force. Within the labor force, the 65 to 74 years age range has the highest percentage of unemployed individuals, with 10.8% or 8 of them being unemployed.
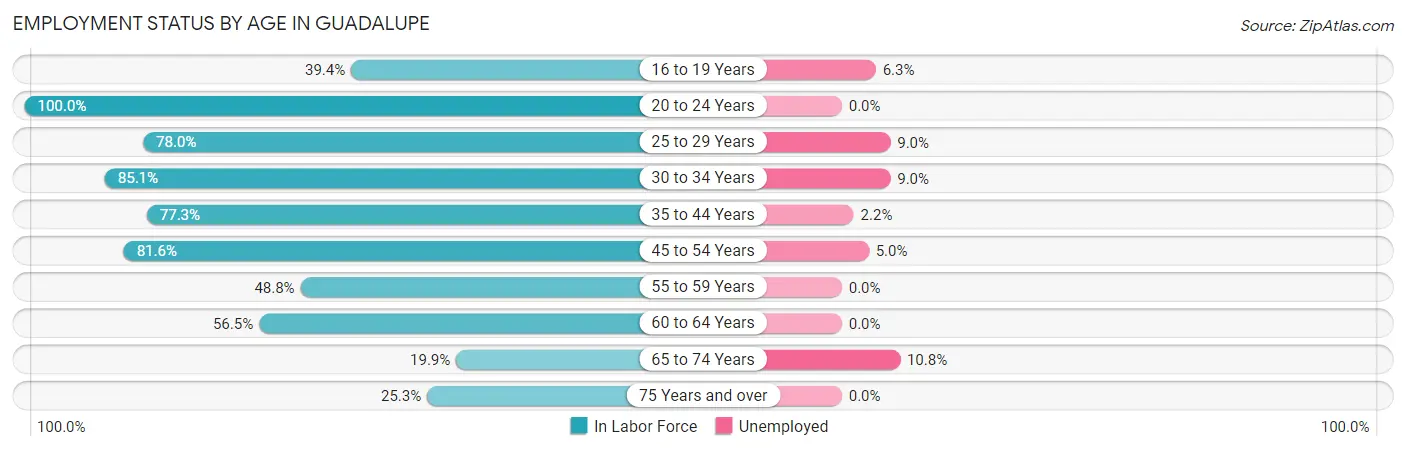
| Age Bracket | In Labor Force | Unemployed |
| 16 to 19 Years | 175 (39.4%) | 11 (6.3%) |
| 20 to 24 Years | 261 (100.0%) | 0 (0.0%) |
| 25 to 29 Years | 344 (78.0%) | 31 (9.0%) |
| 30 to 34 Years | 376 (85.1%) | 34 (9.0%) |
| 35 to 44 Years | 449 (77.3%) | 10 (2.2%) |
| 45 to 54 Years | 580 (81.6%) | 29 (5.0%) |
| 55 to 59 Years | 191 (48.8%) | 0 (0.0%) |
| 60 to 64 Years | 223 (56.5%) | 0 (0.0%) |
| 65 to 74 Years | 74 (19.9%) | 8 (10.8%) |
| 75 Years and over | 57 (25.3%) | 0 (0.0%) |
| Total | 2,728 (64.0%) | 123 (4.5%) |
Employment Status by Educational Attainment in Guadalupe
According to labor force statistics for Guadalupe, 73.0% of individuals (2,162) out of the total population between 25 and 64 years of age (2,961) are in the labor force, with 4.8% or 104 of them being unemployed. The group with the highest labor force participation rate are those with the educational attainment of college / associate degree, with 80.3% or 575 individuals in the labor force. Within the labor force, individuals with high school diploma education have the highest percentage of unemployment, with 11.1% or 75 of them being unemployed.
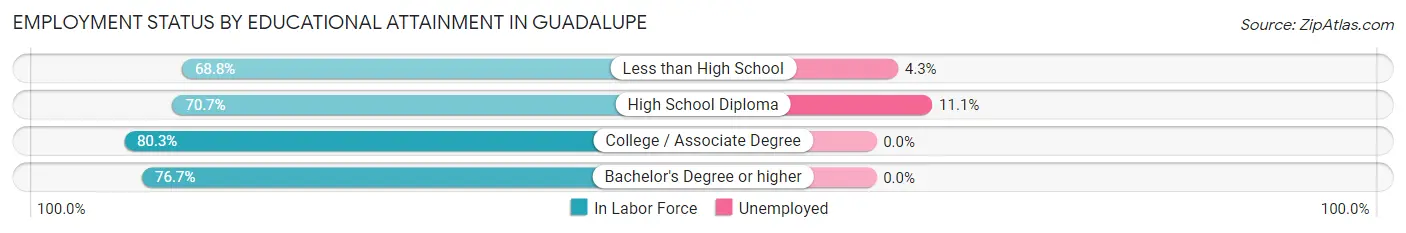
| Educational Attainment | In Labor Force | Unemployed |
| Less than High School | 668 (68.8%) | 42 (4.3%) |
| High School Diploma | 677 (70.7%) | 106 (11.1%) |
| College / Associate Degree | 575 (80.3%) | 0 (0.0%) |
| Bachelor's Degree or higher | 243 (76.7%) | 0 (0.0%) |
| Total | 2,162 (73.0%) | 142 (4.8%) |
Employment Occupations by Sex in Guadalupe
Management, Business, Science and Arts Occupations
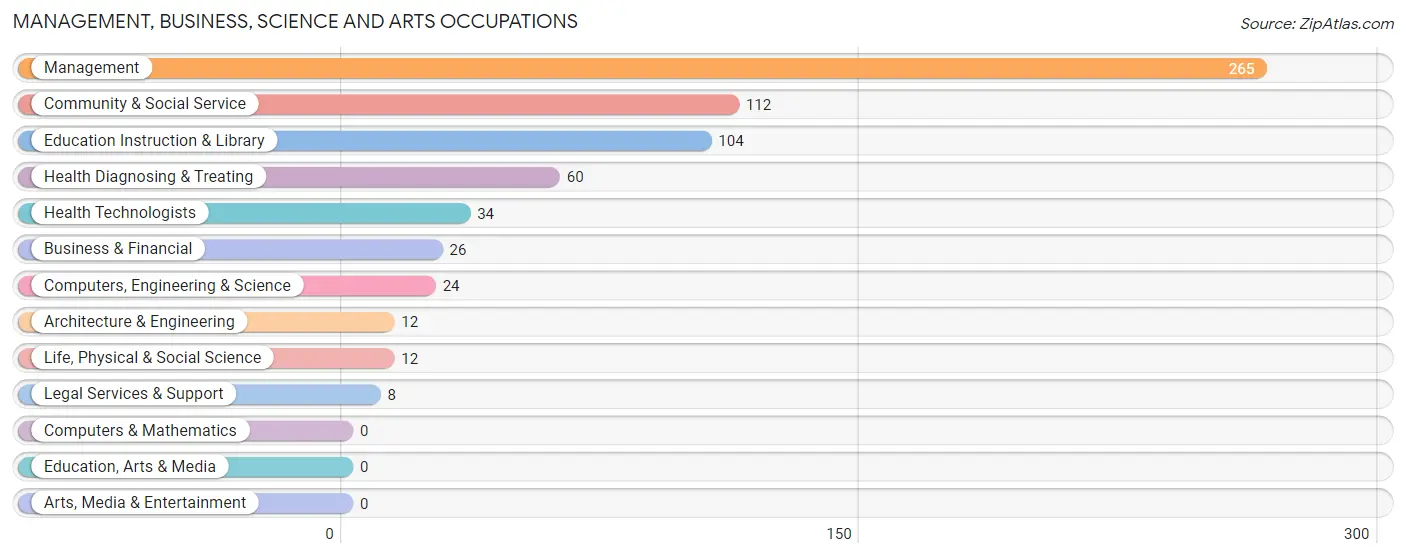
The most common Management, Business, Science and Arts occupations in Guadalupe are Management (265 | 10.2%), Community & Social Service (112 | 4.3%), Education Instruction & Library (104 | 4.0%), Health Diagnosing & Treating (60 | 2.3%), and Health Technologists (34 | 1.3%).
Management, Business, Science and Arts Occupations by Sex
Within the Management, Business, Science and Arts occupations in Guadalupe, the most male-oriented occupations are Life, Physical & Social Science (100.0%), Education Instruction & Library (53.8%), and Computers, Engineering & Science (50.0%), while the most female-oriented occupations are Business & Financial (100.0%), Architecture & Engineering (100.0%), and Legal Services & Support (100.0%).
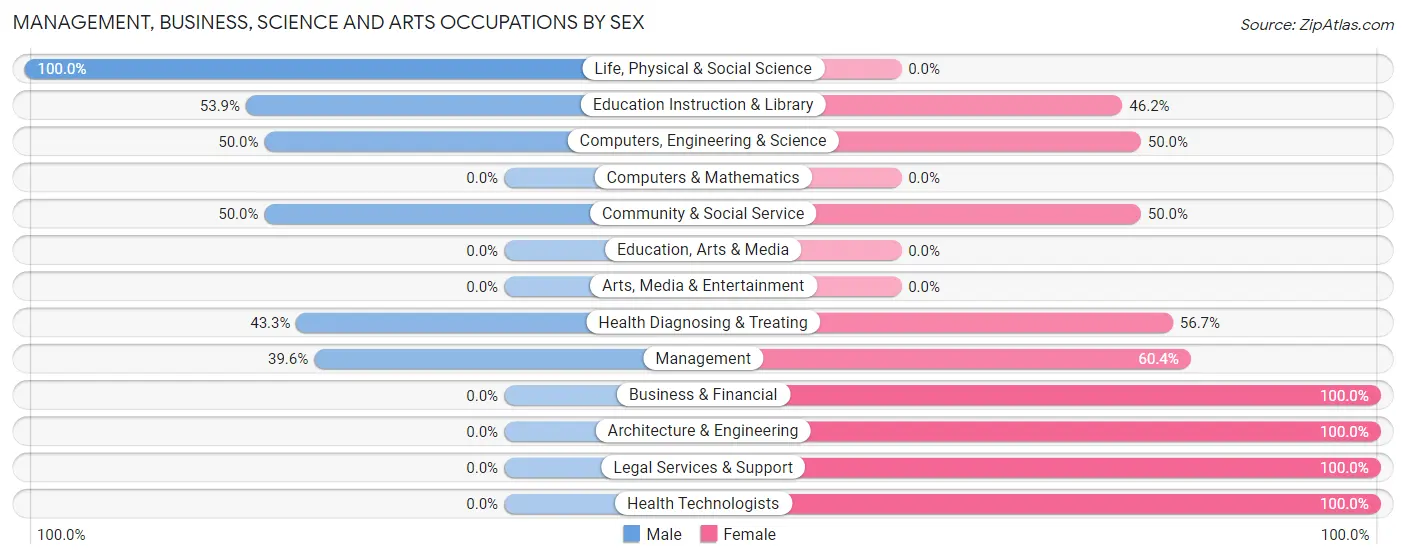
| Occupation | Male | Female |
| Management | 105 (39.6%) | 160 (60.4%) |
| Business & Financial | 0 (0.0%) | 26 (100.0%) |
| Computers, Engineering & Science | 12 (50.0%) | 12 (50.0%) |
| Computers & Mathematics | 0 (0.0%) | 0 (0.0%) |
| Architecture & Engineering | 0 (0.0%) | 12 (100.0%) |
| Life, Physical & Social Science | 12 (100.0%) | 0 (0.0%) |
| Community & Social Service | 56 (50.0%) | 56 (50.0%) |
| Education, Arts & Media | 0 (0.0%) | 0 (0.0%) |
| Legal Services & Support | 0 (0.0%) | 8 (100.0%) |
| Education Instruction & Library | 56 (53.8%) | 48 (46.2%) |
| Arts, Media & Entertainment | 0 (0.0%) | 0 (0.0%) |
| Health Diagnosing & Treating | 26 (43.3%) | 34 (56.7%) |
| Health Technologists | 0 (0.0%) | 34 (100.0%) |
| Total (Category) | 199 (40.9%) | 288 (59.1%) |
| Total (Overall) | 1,300 (49.9%) | 1,307 (50.1%) |
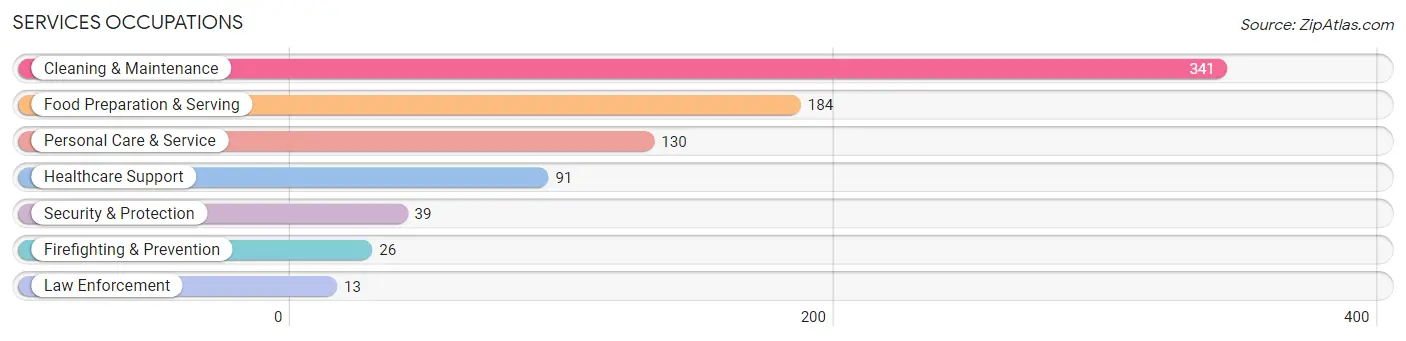
Services Occupations
The most common Services occupations in Guadalupe are Cleaning & Maintenance (341 | 13.1%), Food Preparation & Serving (184 | 7.1%), Personal Care & Service (130 | 5.0%), Healthcare Support (91 | 3.5%), and Security & Protection (39 | 1.5%).
Services Occupations by Sex
Within the Services occupations in Guadalupe, the most male-oriented occupations are Security & Protection (100.0%), Firefighting & Prevention (100.0%), and Law Enforcement (100.0%), while the most female-oriented occupations are Healthcare Support (100.0%), Personal Care & Service (100.0%), and Food Preparation & Serving (73.9%).
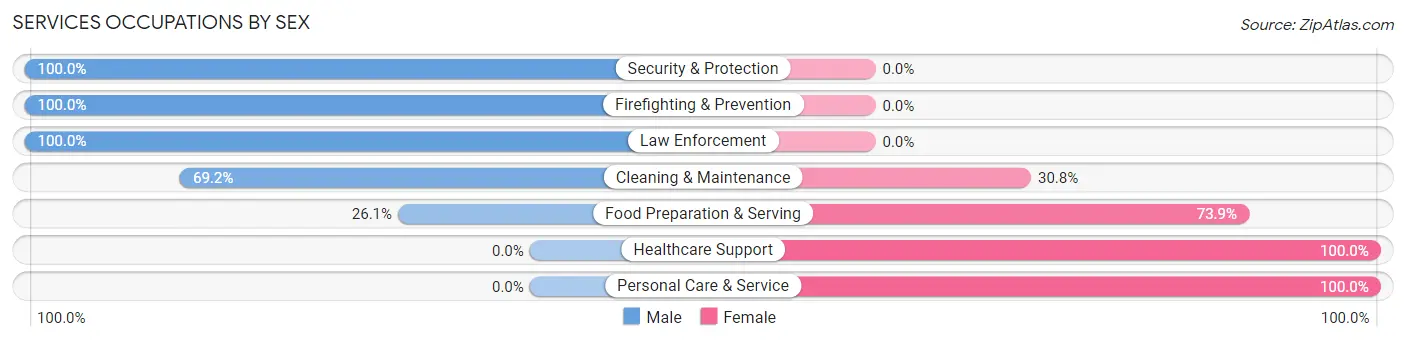
| Occupation | Male | Female |
| Healthcare Support | 0 (0.0%) | 91 (100.0%) |
| Security & Protection | 39 (100.0%) | 0 (0.0%) |
| Firefighting & Prevention | 26 (100.0%) | 0 (0.0%) |
| Law Enforcement | 13 (100.0%) | 0 (0.0%) |
| Food Preparation & Serving | 48 (26.1%) | 136 (73.9%) |
| Cleaning & Maintenance | 236 (69.2%) | 105 (30.8%) |
| Personal Care & Service | 0 (0.0%) | 130 (100.0%) |
| Total (Category) | 323 (41.1%) | 462 (58.9%) |
| Total (Overall) | 1,300 (49.9%) | 1,307 (50.1%) |
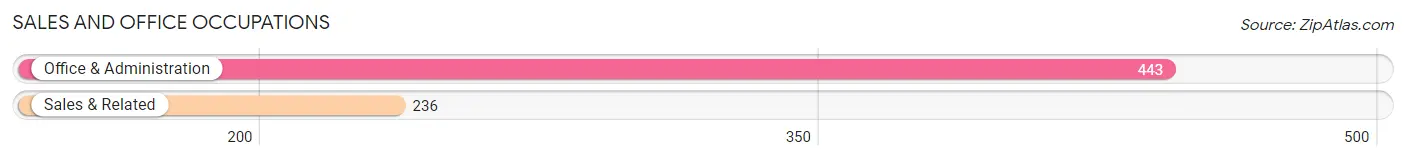
Sales and Office Occupations
The most common Sales and Office occupations in Guadalupe are Office & Administration (443 | 17.0%), and Sales & Related (236 | 9.0%).
Sales and Office Occupations by Sex
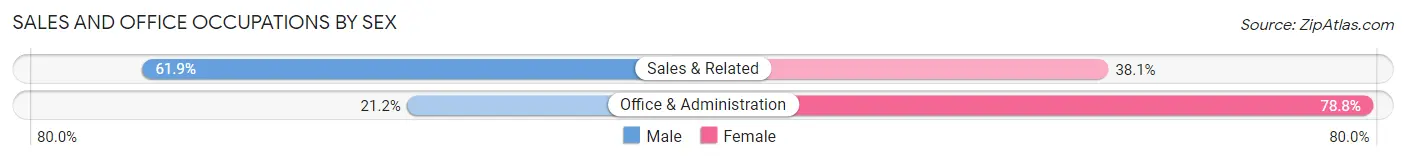
| Occupation | Male | Female |
| Sales & Related | 146 (61.9%) | 90 (38.1%) |
| Office & Administration | 94 (21.2%) | 349 (78.8%) |
| Total (Category) | 240 (35.3%) | 439 (64.6%) |
| Total (Overall) | 1,300 (49.9%) | 1,307 (50.1%) |
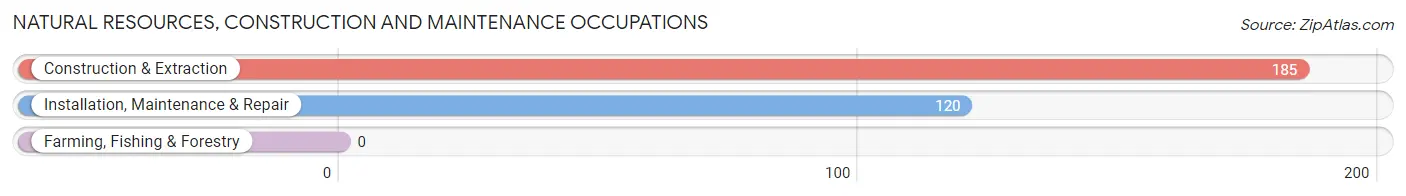
Natural Resources, Construction and Maintenance Occupations
The most common Natural Resources, Construction and Maintenance occupations in Guadalupe are Construction & Extraction (185 | 7.1%), and Installation, Maintenance & Repair (120 | 4.6%).
Natural Resources, Construction and Maintenance Occupations by Sex
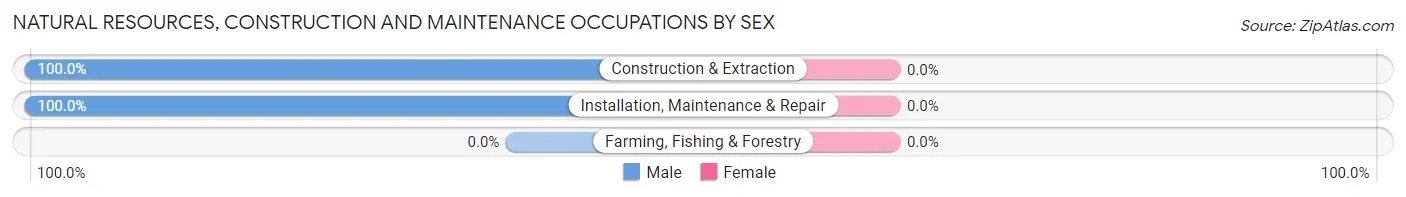
| Occupation | Male | Female |
| Farming, Fishing & Forestry | 0 (0.0%) | 0 (0.0%) |
| Construction & Extraction | 185 (100.0%) | 0 (0.0%) |
| Installation, Maintenance & Repair | 120 (100.0%) | 0 (0.0%) |
| Total (Category) | 305 (100.0%) | 0 (0.0%) |
| Total (Overall) | 1,300 (49.9%) | 1,307 (50.1%) |
Production, Transportation and Moving Occupations
The most common Production, Transportation and Moving occupations in Guadalupe are Transportation (153 | 5.9%), Material Moving (121 | 4.6%), and Production (77 | 2.9%).
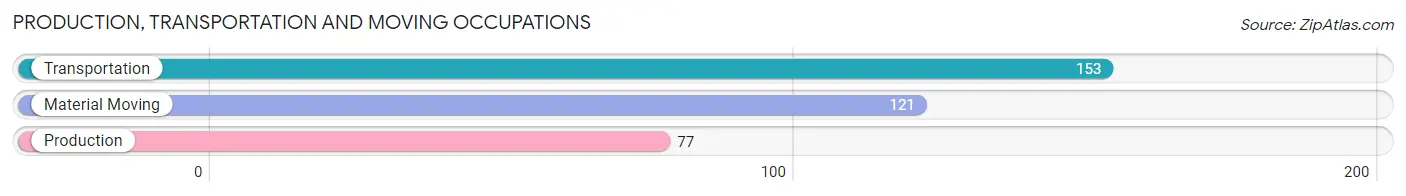
Production, Transportation and Moving Occupations by Sex
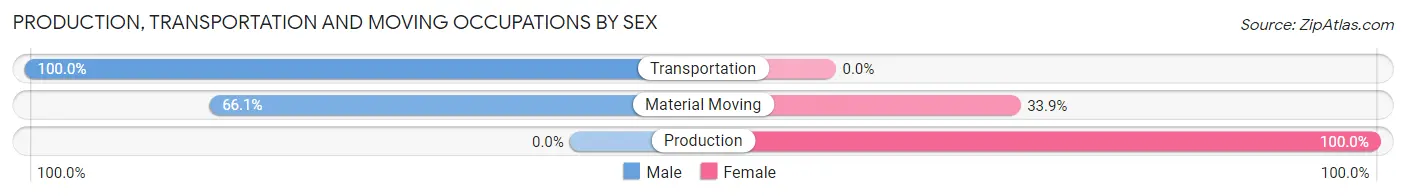
| Occupation | Male | Female |
| Production | 0 (0.0%) | 77 (100.0%) |
| Transportation | 153 (100.0%) | 0 (0.0%) |
| Material Moving | 80 (66.1%) | 41 (33.9%) |
| Total (Category) | 233 (66.4%) | 118 (33.6%) |
| Total (Overall) | 1,300 (49.9%) | 1,307 (50.1%) |
Employment Industries by Sex in Guadalupe
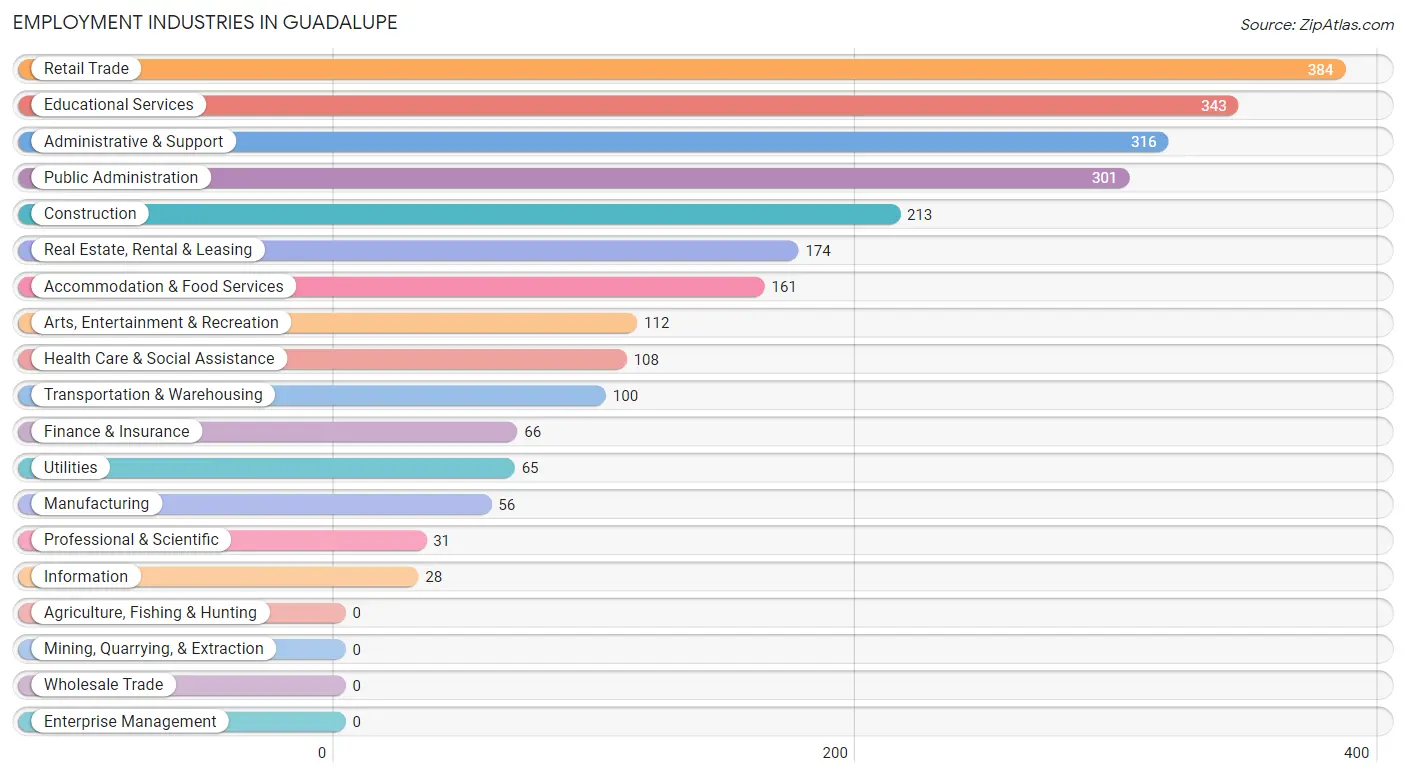
Employment Industries in Guadalupe
The major employment industries in Guadalupe include Retail Trade (384 | 14.7%), Educational Services (343 | 13.2%), Administrative & Support (316 | 12.1%), Public Administration (301 | 11.6%), and Construction (213 | 8.2%).
Employment Industries by Sex in Guadalupe
The Guadalupe industries that see more men than women are Construction (100.0%), Information (100.0%), and Professional & Scientific (100.0%), whereas the industries that tend to have a higher number of women are Utilities (100.0%), Finance & Insurance (100.0%), and Real Estate, Rental & Leasing (100.0%).
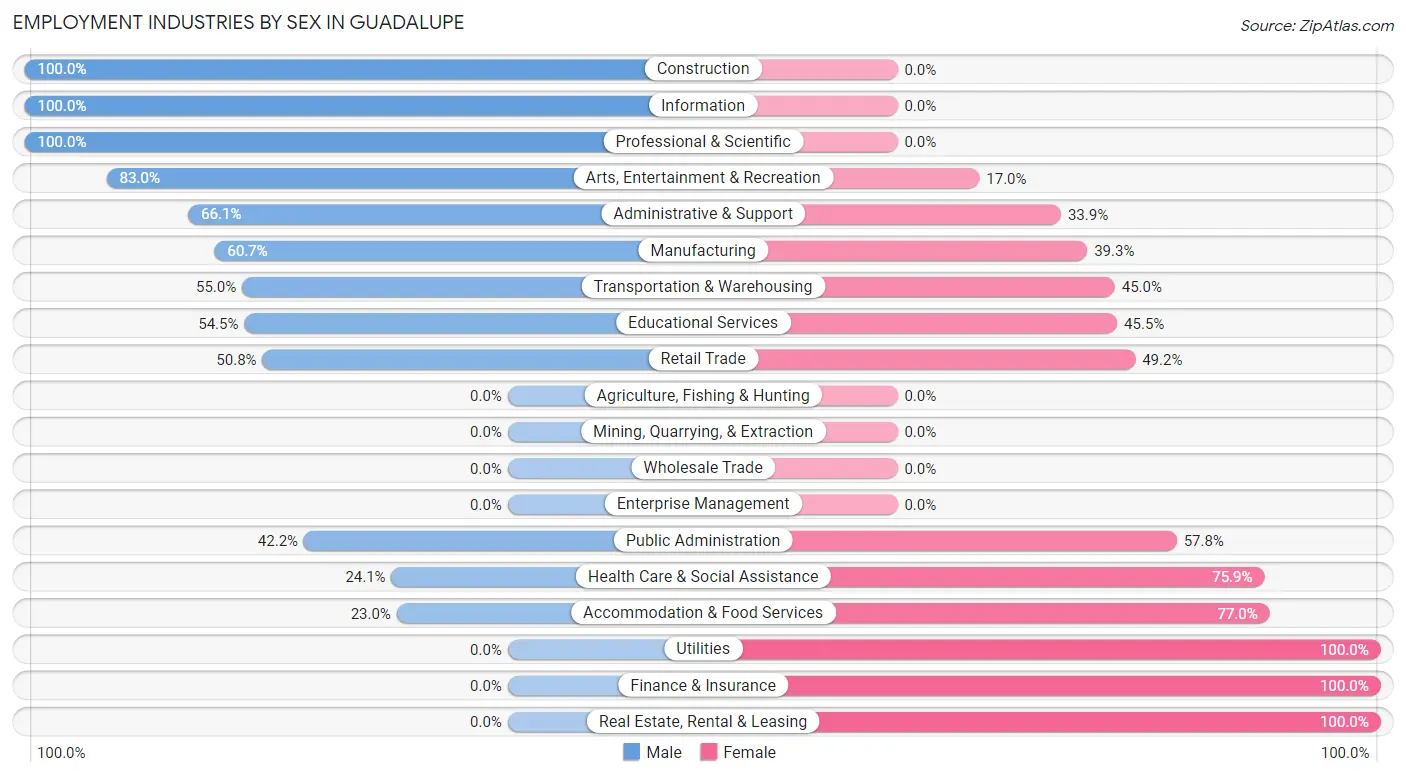
| Industry | Male | Female |
| Agriculture, Fishing & Hunting | 0 (0.0%) | 0 (0.0%) |
| Mining, Quarrying, & Extraction | 0 (0.0%) | 0 (0.0%) |
| Construction | 213 (100.0%) | 0 (0.0%) |
| Manufacturing | 34 (60.7%) | 22 (39.3%) |
| Wholesale Trade | 0 (0.0%) | 0 (0.0%) |
| Retail Trade | 195 (50.8%) | 189 (49.2%) |
| Transportation & Warehousing | 55 (55.0%) | 45 (45.0%) |
| Utilities | 0 (0.0%) | 65 (100.0%) |
| Information | 28 (100.0%) | 0 (0.0%) |
| Finance & Insurance | 0 (0.0%) | 66 (100.0%) |
| Real Estate, Rental & Leasing | 0 (0.0%) | 174 (100.0%) |
| Professional & Scientific | 31 (100.0%) | 0 (0.0%) |
| Enterprise Management | 0 (0.0%) | 0 (0.0%) |
| Administrative & Support | 209 (66.1%) | 107 (33.9%) |
| Educational Services | 187 (54.5%) | 156 (45.5%) |
| Health Care & Social Assistance | 26 (24.1%) | 82 (75.9%) |
| Arts, Entertainment & Recreation | 93 (83.0%) | 19 (17.0%) |
| Accommodation & Food Services | 37 (23.0%) | 124 (77.0%) |
| Public Administration | 127 (42.2%) | 174 (57.8%) |
| Total | 1,300 (49.9%) | 1,307 (50.1%) |
Education in Guadalupe
School Enrollment in Guadalupe
The most common levels of schooling among the 1,335 students in Guadalupe are high school (485 | 36.3%), middle school (298 | 22.3%), and college / undergraduate (210 | 15.7%).
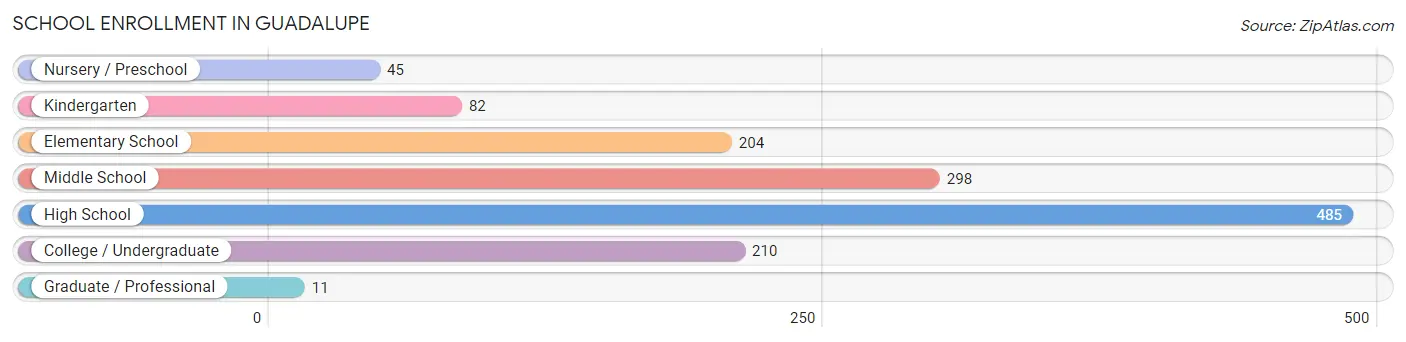
| School Level | # Students | % Students |
| Nursery / Preschool | 45 | 3.4% |
| Kindergarten | 82 | 6.1% |
| Elementary School | 204 | 15.3% |
| Middle School | 298 | 22.3% |
| High School | 485 | 36.3% |
| College / Undergraduate | 210 | 15.7% |
| Graduate / Professional | 11 | 0.8% |
| Total | 1,335 | 100.0% |
School Enrollment by Age by Funding Source in Guadalupe
Out of a total of 1,335 students who are enrolled in schools in Guadalupe, 53 (4.0%) attend a private institution, while the remaining 1,282 (96.0%) are enrolled in public schools. The age group of 15 to 17 year olds has the highest likelihood of being enrolled in private schools, with 54 (12.8% in the age bracket) enrolled. Conversely, the age group of 3 to 4 year olds has the lowest likelihood of being enrolled in a private school, with 21 (100.0% in the age bracket) attending a public institution.
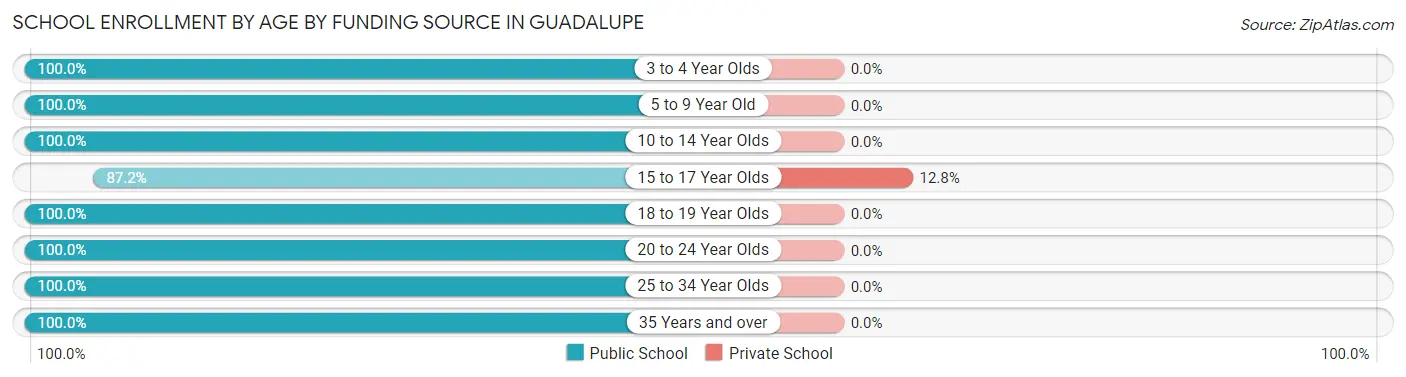
| Age Bracket | Public School | Private School |
| 3 to 4 Year Olds | 21 (100.0%) | 0 (0.0%) |
| 5 to 9 Year Old | 310 (100.0%) | 0 (0.0%) |
| 10 to 14 Year Olds | 317 (100.0%) | 0 (0.0%) |
| 15 to 17 Year Olds | 367 (87.2%) | 54 (12.8%) |
| 18 to 19 Year Olds | 73 (100.0%) | 0 (0.0%) |
| 20 to 24 Year Olds | 92 (100.0%) | 0 (0.0%) |
| 25 to 34 Year Olds | 45 (100.0%) | 0 (0.0%) |
| 35 Years and over | 56 (100.0%) | 0 (0.0%) |
| Total | 1,282 (96.0%) | 53 (4.0%) |
Educational Attainment by Field of Study in Guadalupe
Business (139 | 33.3%), arts & humanities (114 | 27.3%), physical & health sciences (49 | 11.7%), visual & performing arts (41 | 9.8%), and psychology (26 | 6.2%) are the most common fields of study among 418 individuals in Guadalupe who have obtained a bachelor's degree or higher.
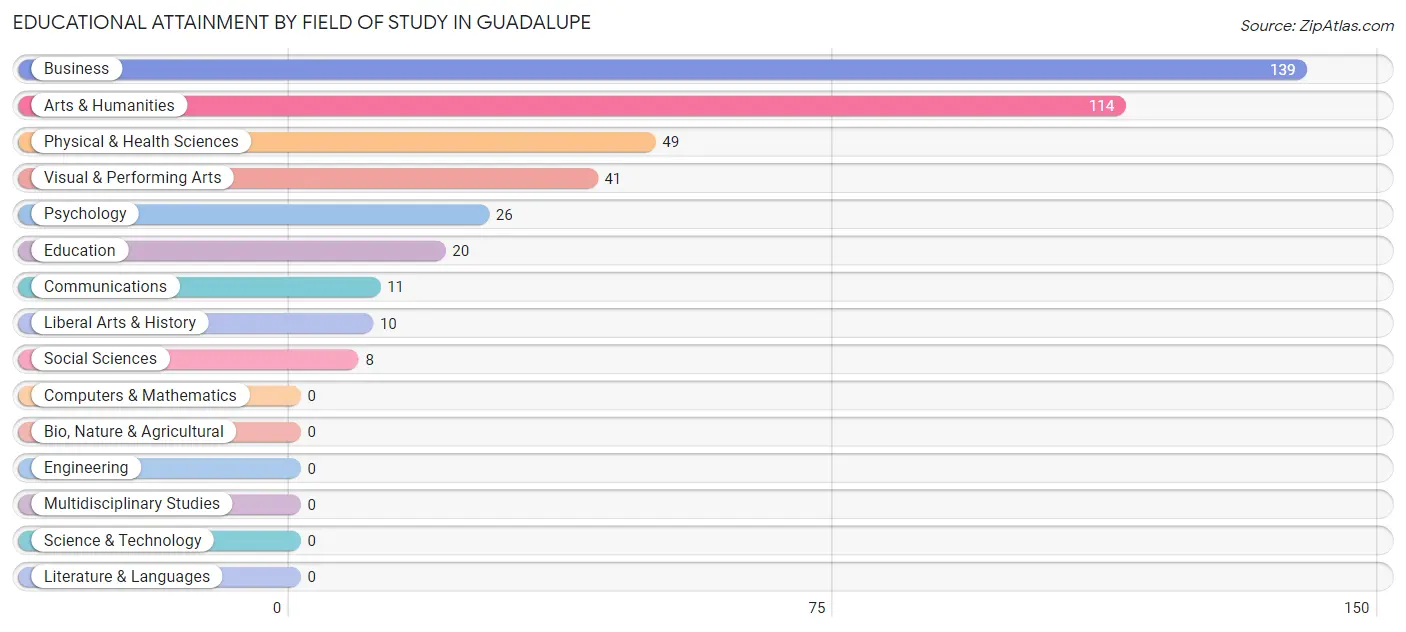
| Field of Study | # Graduates | % Graduates |
| Computers & Mathematics | 0 | 0.0% |
| Bio, Nature & Agricultural | 0 | 0.0% |
| Physical & Health Sciences | 49 | 11.7% |
| Psychology | 26 | 6.2% |
| Social Sciences | 8 | 1.9% |
| Engineering | 0 | 0.0% |
| Multidisciplinary Studies | 0 | 0.0% |
| Science & Technology | 0 | 0.0% |
| Business | 139 | 33.3% |
| Education | 20 | 4.8% |
| Literature & Languages | 0 | 0.0% |
| Liberal Arts & History | 10 | 2.4% |
| Visual & Performing Arts | 41 | 9.8% |
| Communications | 11 | 2.6% |
| Arts & Humanities | 114 | 27.3% |
| Total | 418 | 100.0% |
Transportation & Commute in Guadalupe
Vehicle Availability by Sex in Guadalupe
The most prevalent vehicle ownership categories in Guadalupe are males with 2 vehicles (436, accounting for 35.1%) and females with 2 vehicles (357, making up 35.8%).
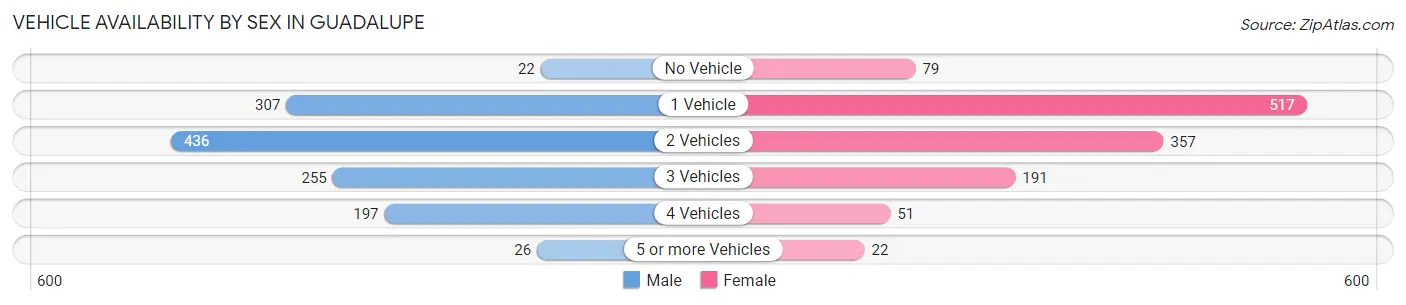
| Vehicles Available | Male | Female |
| No Vehicle | 22 (1.8%) | 79 (6.5%) |
| 1 Vehicle | 307 (24.7%) | 517 (42.5%) |
| 2 Vehicles | 436 (35.1%) | 357 (29.3%) |
| 3 Vehicles | 255 (20.5%) | 191 (15.7%) |
| 4 Vehicles | 197 (15.9%) | 51 (4.2%) |
| 5 or more Vehicles | 26 (2.1%) | 22 (1.8%) |
| Total | 1,243 (100.0%) | 1,217 (100.0%) |
Commute Time in Guadalupe
The most frequently occuring commute durations in Guadalupe are 10 to 14 minutes (726 commuters, 30.3%), 20 to 24 minutes (412 commuters, 17.2%), and 15 to 19 minutes (308 commuters, 12.9%).
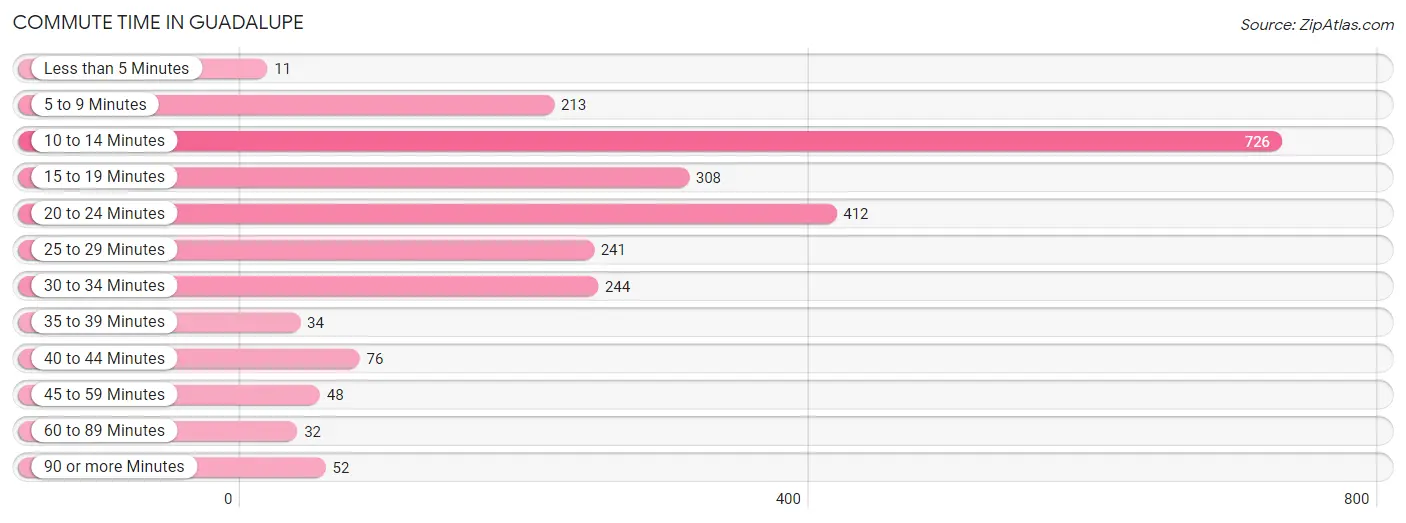
| Commute Time | # Commuters | % Commuters |
| Less than 5 Minutes | 11 | 0.5% |
| 5 to 9 Minutes | 213 | 8.9% |
| 10 to 14 Minutes | 726 | 30.3% |
| 15 to 19 Minutes | 308 | 12.9% |
| 20 to 24 Minutes | 412 | 17.2% |
| 25 to 29 Minutes | 241 | 10.1% |
| 30 to 34 Minutes | 244 | 10.2% |
| 35 to 39 Minutes | 34 | 1.4% |
| 40 to 44 Minutes | 76 | 3.2% |
| 45 to 59 Minutes | 48 | 2.0% |
| 60 to 89 Minutes | 32 | 1.3% |
| 90 or more Minutes | 52 | 2.2% |
Commute Time by Sex in Guadalupe
The most common commute times in Guadalupe are 20 to 24 minutes (271 commuters, 22.5%) for males and 10 to 14 minutes (484 commuters, 40.6%) for females.
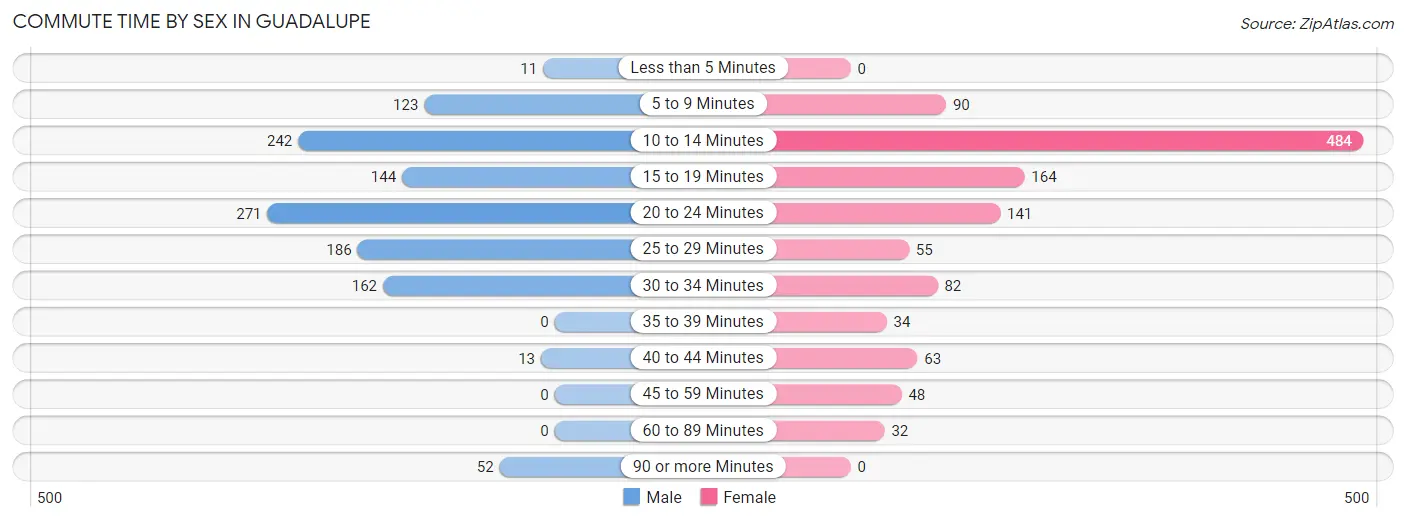
| Commute Time | Male | Female |
| Less than 5 Minutes | 11 (0.9%) | 0 (0.0%) |
| 5 to 9 Minutes | 123 (10.2%) | 90 (7.5%) |
| 10 to 14 Minutes | 242 (20.1%) | 484 (40.6%) |
| 15 to 19 Minutes | 144 (12.0%) | 164 (13.8%) |
| 20 to 24 Minutes | 271 (22.5%) | 141 (11.8%) |
| 25 to 29 Minutes | 186 (15.4%) | 55 (4.6%) |
| 30 to 34 Minutes | 162 (13.5%) | 82 (6.9%) |
| 35 to 39 Minutes | 0 (0.0%) | 34 (2.9%) |
| 40 to 44 Minutes | 13 (1.1%) | 63 (5.3%) |
| 45 to 59 Minutes | 0 (0.0%) | 48 (4.0%) |
| 60 to 89 Minutes | 0 (0.0%) | 32 (2.7%) |
| 90 or more Minutes | 52 (4.3%) | 0 (0.0%) |
Time of Departure to Work by Sex in Guadalupe
The most frequent times of departure to work in Guadalupe are 7:30 AM to 7:59 AM (211, 17.5%) for males and 8:00 AM to 8:29 AM (415, 34.8%) for females.
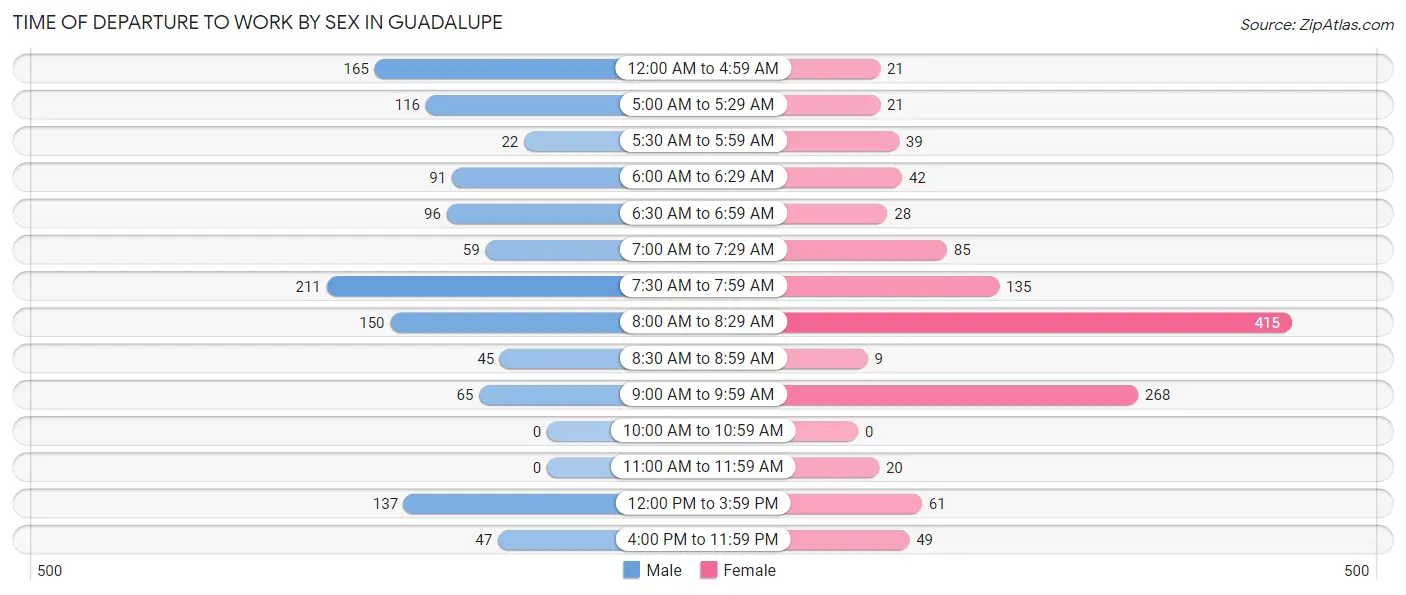
| Time of Departure | Male | Female |
| 12:00 AM to 4:59 AM | 165 (13.7%) | 21 (1.8%) |
| 5:00 AM to 5:29 AM | 116 (9.6%) | 21 (1.8%) |
| 5:30 AM to 5:59 AM | 22 (1.8%) | 39 (3.3%) |
| 6:00 AM to 6:29 AM | 91 (7.6%) | 42 (3.5%) |
| 6:30 AM to 6:59 AM | 96 (8.0%) | 28 (2.4%) |
| 7:00 AM to 7:29 AM | 59 (4.9%) | 85 (7.1%) |
| 7:30 AM to 7:59 AM | 211 (17.5%) | 135 (11.3%) |
| 8:00 AM to 8:29 AM | 150 (12.5%) | 415 (34.8%) |
| 8:30 AM to 8:59 AM | 45 (3.7%) | 9 (0.7%) |
| 9:00 AM to 9:59 AM | 65 (5.4%) | 268 (22.5%) |
| 10:00 AM to 10:59 AM | 0 (0.0%) | 0 (0.0%) |
| 11:00 AM to 11:59 AM | 0 (0.0%) | 20 (1.7%) |
| 12:00 PM to 3:59 PM | 137 (11.4%) | 61 (5.1%) |
| 4:00 PM to 11:59 PM | 47 (3.9%) | 49 (4.1%) |
| Total | 1,204 (100.0%) | 1,193 (100.0%) |
Housing Occupancy in Guadalupe
Occupancy by Ownership in Guadalupe
Of the total 1,614 dwellings in Guadalupe, owner-occupied units account for 874 (54.1%), while renter-occupied units make up 740 (45.9%).
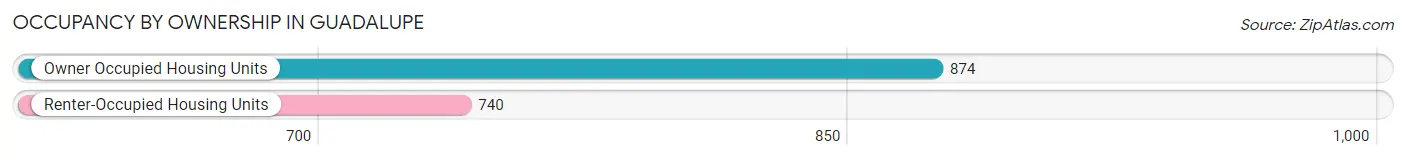
| Occupancy | # Housing Units | % Housing Units |
| Owner Occupied Housing Units | 874 | 54.1% |
| Renter-Occupied Housing Units | 740 | 45.9% |
| Total Occupied Housing Units | 1,614 | 100.0% |
Occupancy by Household Size in Guadalupe
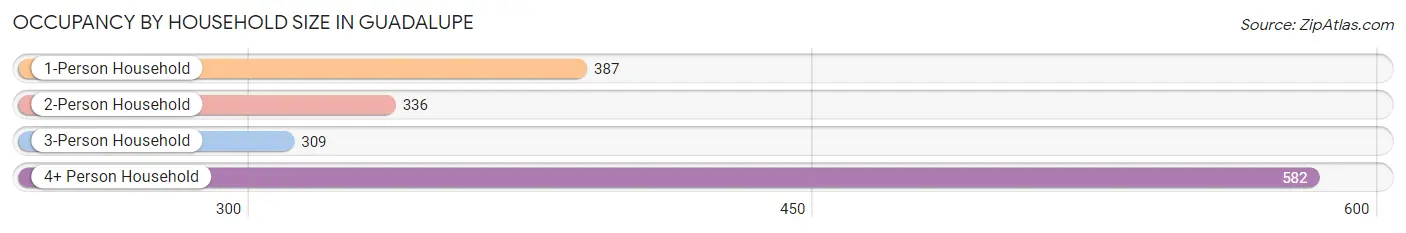
| Household Size | # Housing Units | % Housing Units |
| 1-Person Household | 387 | 24.0% |
| 2-Person Household | 336 | 20.8% |
| 3-Person Household | 309 | 19.1% |
| 4+ Person Household | 582 | 36.1% |
| Total Housing Units | 1,614 | 100.0% |
Occupancy by Ownership by Household Size in Guadalupe
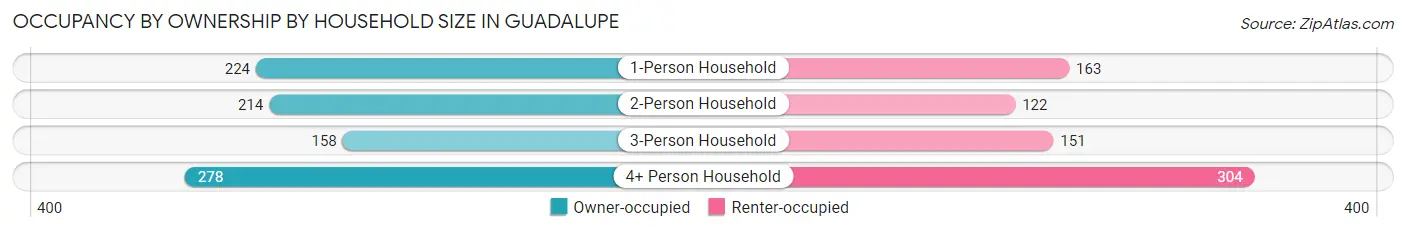
| Household Size | Owner-occupied | Renter-occupied |
| 1-Person Household | 224 (57.9%) | 163 (42.1%) |
| 2-Person Household | 214 (63.7%) | 122 (36.3%) |
| 3-Person Household | 158 (51.1%) | 151 (48.9%) |
| 4+ Person Household | 278 (47.8%) | 304 (52.2%) |
| Total Housing Units | 874 (54.1%) | 740 (45.9%) |
Occupancy by Educational Attainment in Guadalupe
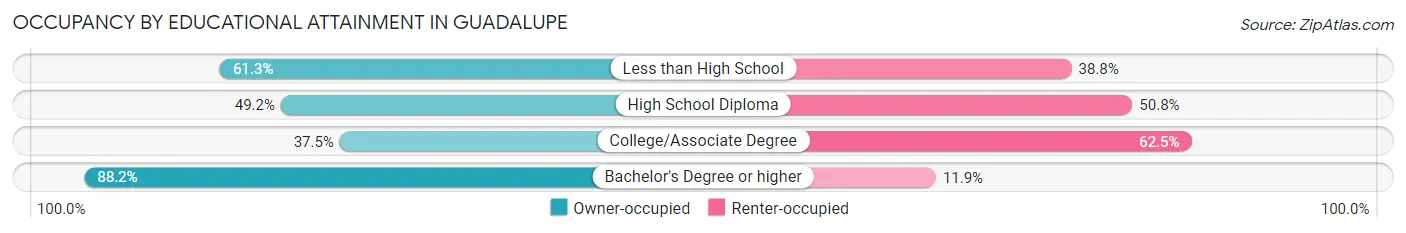
| Household Size | Owner-occupied | Renter-occupied |
| Less than High School | 403 (61.3%) | 255 (38.8%) |
| High School Diploma | 185 (49.2%) | 191 (50.8%) |
| College/Associate Degree | 167 (37.5%) | 278 (62.5%) |
| Bachelor's Degree or higher | 119 (88.1%) | 16 (11.8%) |
Occupancy by Age of Householder in Guadalupe
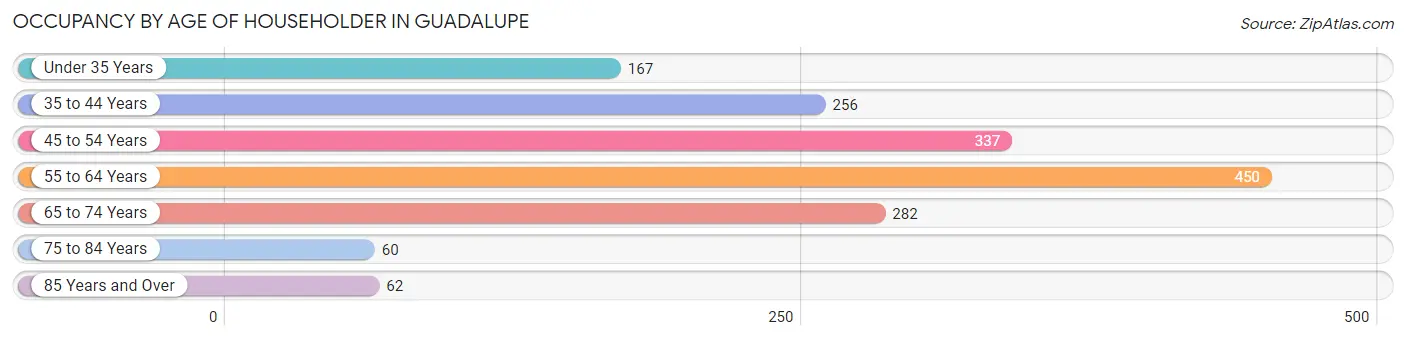
| Age Bracket | # Households | % Households |
| Under 35 Years | 167 | 10.3% |
| 35 to 44 Years | 256 | 15.9% |
| 45 to 54 Years | 337 | 20.9% |
| 55 to 64 Years | 450 | 27.9% |
| 65 to 74 Years | 282 | 17.5% |
| 75 to 84 Years | 60 | 3.7% |
| 85 Years and Over | 62 | 3.8% |
| Total | 1,614 | 100.0% |
Housing Finances in Guadalupe
Median Income by Occupancy in Guadalupe
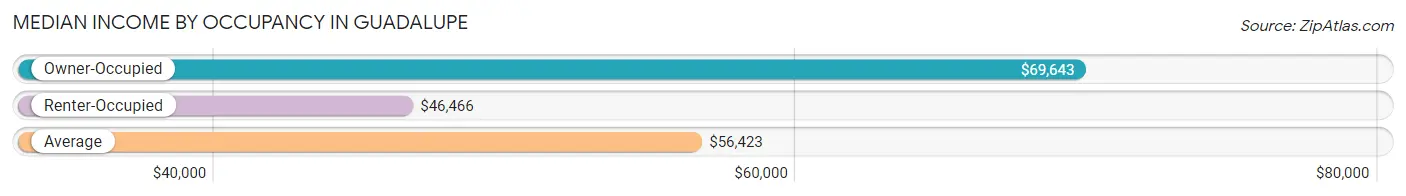
| Occupancy Type | # Households | Median Income |
| Owner-Occupied | 874 (54.1%) | $69,643 |
| Renter-Occupied | 740 (45.9%) | $46,466 |
| Average | 1,614 (100.0%) | $56,423 |
Occupancy by Householder Income Bracket in Guadalupe
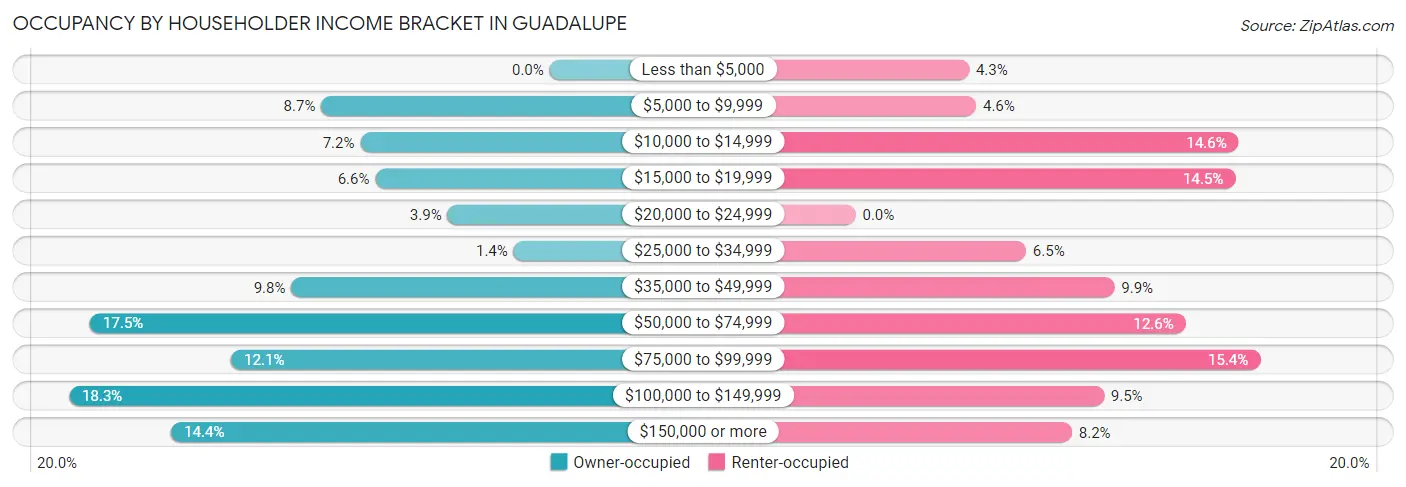
| Income Bracket | Owner-occupied | Renter-occupied |
| Less than $5,000 | 0 (0.0%) | 32 (4.3%) |
| $5,000 to $9,999 | 76 (8.7%) | 34 (4.6%) |
| $10,000 to $14,999 | 63 (7.2%) | 108 (14.6%) |
| $15,000 to $19,999 | 58 (6.6%) | 107 (14.5%) |
| $20,000 to $24,999 | 34 (3.9%) | 0 (0.0%) |
| $25,000 to $34,999 | 12 (1.4%) | 48 (6.5%) |
| $35,000 to $49,999 | 86 (9.8%) | 73 (9.9%) |
| $50,000 to $74,999 | 153 (17.5%) | 93 (12.6%) |
| $75,000 to $99,999 | 106 (12.1%) | 114 (15.4%) |
| $100,000 to $149,999 | 160 (18.3%) | 70 (9.5%) |
| $150,000 or more | 126 (14.4%) | 61 (8.2%) |
| Total | 874 (100.0%) | 740 (100.0%) |
Monthly Housing Cost Tiers in Guadalupe
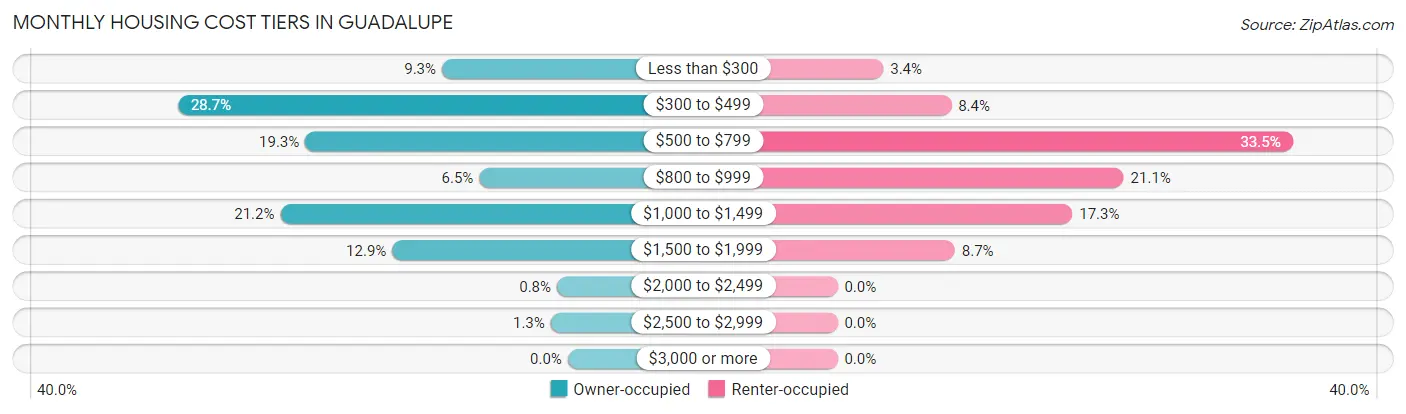
| Monthly Cost | Owner-occupied | Renter-occupied |
| Less than $300 | 81 (9.3%) | 25 (3.4%) |
| $300 to $499 | 251 (28.7%) | 62 (8.4%) |
| $500 to $799 | 169 (19.3%) | 248 (33.5%) |
| $800 to $999 | 57 (6.5%) | 156 (21.1%) |
| $1,000 to $1,499 | 185 (21.2%) | 128 (17.3%) |
| $1,500 to $1,999 | 113 (12.9%) | 64 (8.6%) |
| $2,000 to $2,499 | 7 (0.8%) | 0 (0.0%) |
| $2,500 to $2,999 | 11 (1.3%) | 0 (0.0%) |
| $3,000 or more | 0 (0.0%) | 0 (0.0%) |
| Total | 874 (100.0%) | 740 (100.0%) |
Physical Housing Characteristics in Guadalupe
Housing Structures in Guadalupe
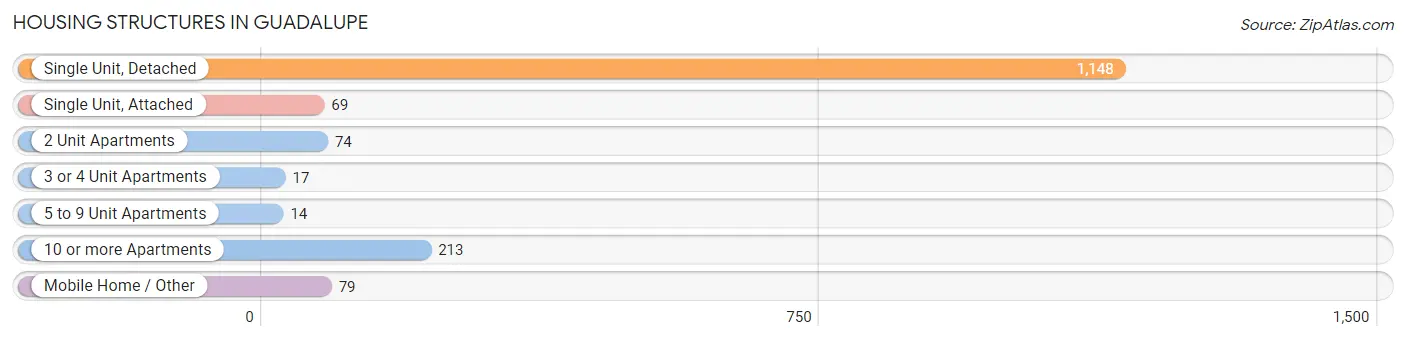
| Structure Type | # Housing Units | % Housing Units |
| Single Unit, Detached | 1,148 | 71.1% |
| Single Unit, Attached | 69 | 4.3% |
| 2 Unit Apartments | 74 | 4.6% |
| 3 or 4 Unit Apartments | 17 | 1.1% |
| 5 to 9 Unit Apartments | 14 | 0.9% |
| 10 or more Apartments | 213 | 13.2% |
| Mobile Home / Other | 79 | 4.9% |
| Total | 1,614 | 100.0% |
Housing Structures by Occupancy in Guadalupe
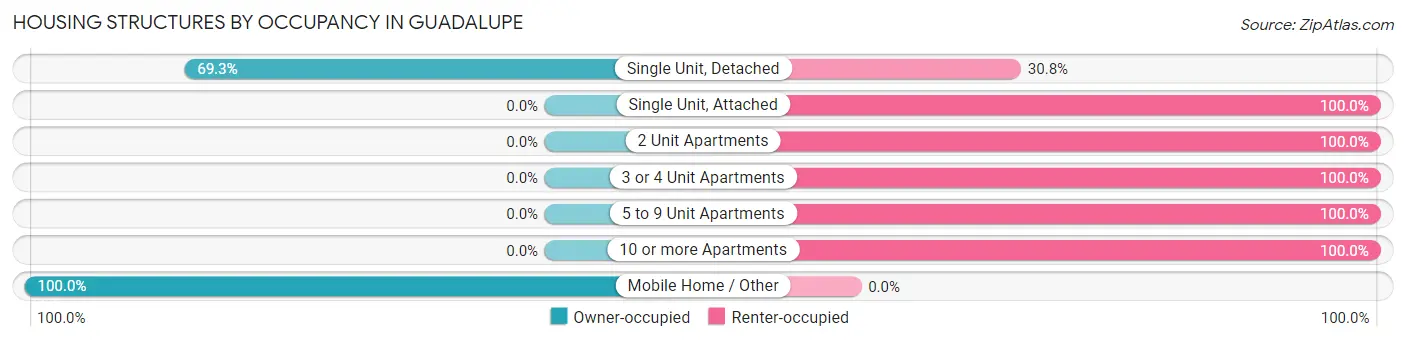
| Structure Type | Owner-occupied | Renter-occupied |
| Single Unit, Detached | 795 (69.3%) | 353 (30.7%) |
| Single Unit, Attached | 0 (0.0%) | 69 (100.0%) |
| 2 Unit Apartments | 0 (0.0%) | 74 (100.0%) |
| 3 or 4 Unit Apartments | 0 (0.0%) | 17 (100.0%) |
| 5 to 9 Unit Apartments | 0 (0.0%) | 14 (100.0%) |
| 10 or more Apartments | 0 (0.0%) | 213 (100.0%) |
| Mobile Home / Other | 79 (100.0%) | 0 (0.0%) |
| Total | 874 (54.1%) | 740 (45.9%) |
Housing Structures by Number of Rooms in Guadalupe
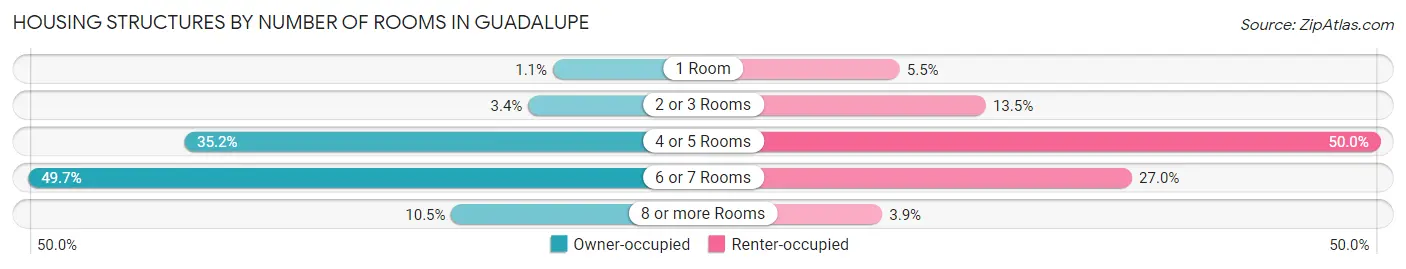
| Number of Rooms | Owner-occupied | Renter-occupied |
| 1 Room | 10 (1.1%) | 41 (5.5%) |
| 2 or 3 Rooms | 30 (3.4%) | 100 (13.5%) |
| 4 or 5 Rooms | 308 (35.2%) | 370 (50.0%) |
| 6 or 7 Rooms | 434 (49.7%) | 200 (27.0%) |
| 8 or more Rooms | 92 (10.5%) | 29 (3.9%) |
| Total | 874 (100.0%) | 740 (100.0%) |
Housing Structure by Heating Type in Guadalupe
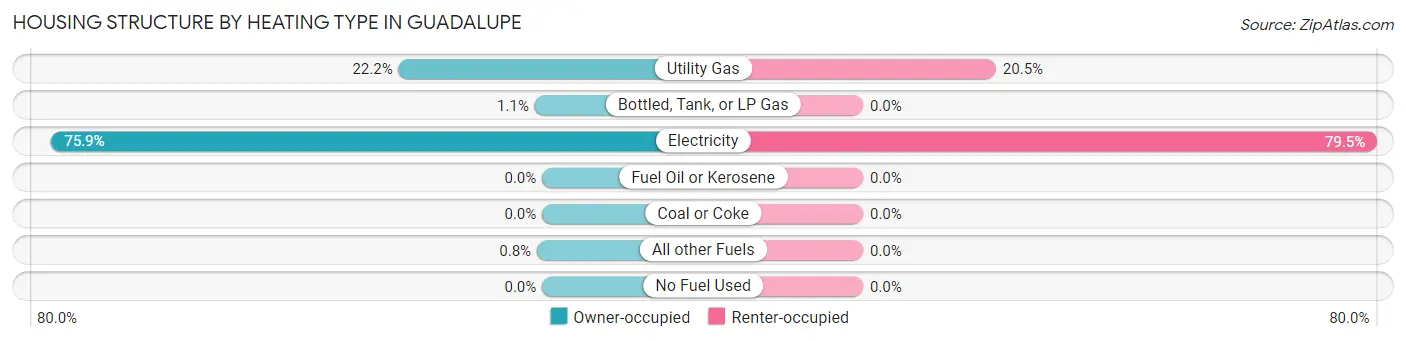
| Heating Type | Owner-occupied | Renter-occupied |
| Utility Gas | 194 (22.2%) | 152 (20.5%) |
| Bottled, Tank, or LP Gas | 10 (1.1%) | 0 (0.0%) |
| Electricity | 663 (75.9%) | 588 (79.5%) |
| Fuel Oil or Kerosene | 0 (0.0%) | 0 (0.0%) |
| Coal or Coke | 0 (0.0%) | 0 (0.0%) |
| All other Fuels | 7 (0.8%) | 0 (0.0%) |
| No Fuel Used | 0 (0.0%) | 0 (0.0%) |
| Total | 874 (100.0%) | 740 (100.0%) |
Household Vehicle Usage in Guadalupe
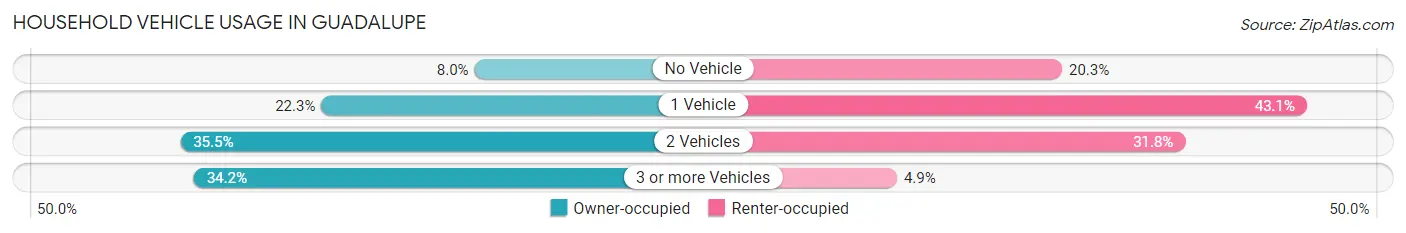
| Vehicles per Household | Owner-occupied | Renter-occupied |
| No Vehicle | 70 (8.0%) | 150 (20.3%) |
| 1 Vehicle | 195 (22.3%) | 319 (43.1%) |
| 2 Vehicles | 310 (35.5%) | 235 (31.8%) |
| 3 or more Vehicles | 299 (34.2%) | 36 (4.9%) |
| Total | 874 (100.0%) | 740 (100.0%) |
Real Estate & Mortgages in Guadalupe
Real Estate and Mortgage Overview in Guadalupe
| Characteristic | Without Mortgage | With Mortgage |
| Housing Units | 419 | 455 |
| Median Property Value | $149,400 | $235,200 |
| Median Household Income | $57,824 | $93 |
| Monthly Housing Costs | $444 | $0 |
| Real Estate Taxes | $718 | $96 |
Property Value by Mortgage Status in Guadalupe
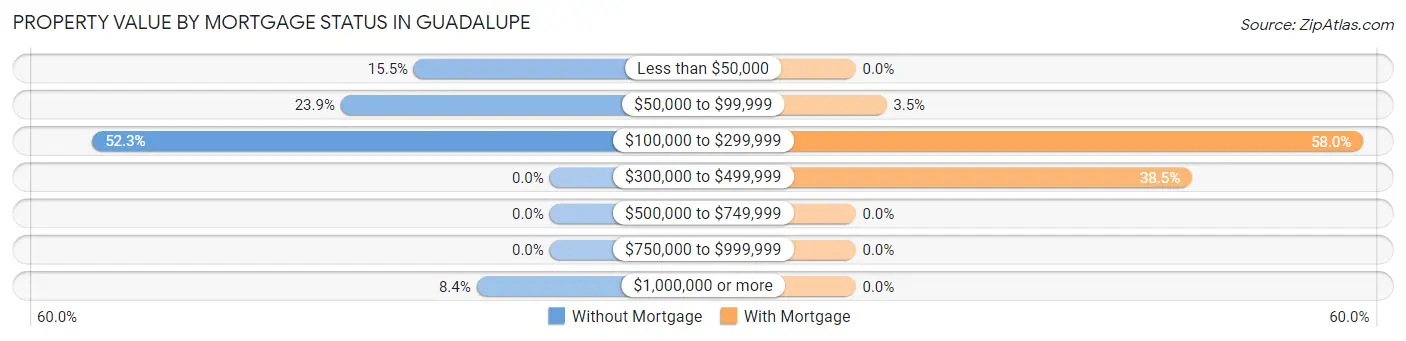
| Property Value | Without Mortgage | With Mortgage |
| Less than $50,000 | 65 (15.5%) | 0 (0.0%) |
| $50,000 to $99,999 | 100 (23.9%) | 16 (3.5%) |
| $100,000 to $299,999 | 219 (52.3%) | 264 (58.0%) |
| $300,000 to $499,999 | 0 (0.0%) | 175 (38.5%) |
| $500,000 to $749,999 | 0 (0.0%) | 0 (0.0%) |
| $750,000 to $999,999 | 0 (0.0%) | 0 (0.0%) |
| $1,000,000 or more | 35 (8.4%) | 0 (0.0%) |
| Total | 419 (100.0%) | 455 (100.0%) |
Household Income by Mortgage Status in Guadalupe
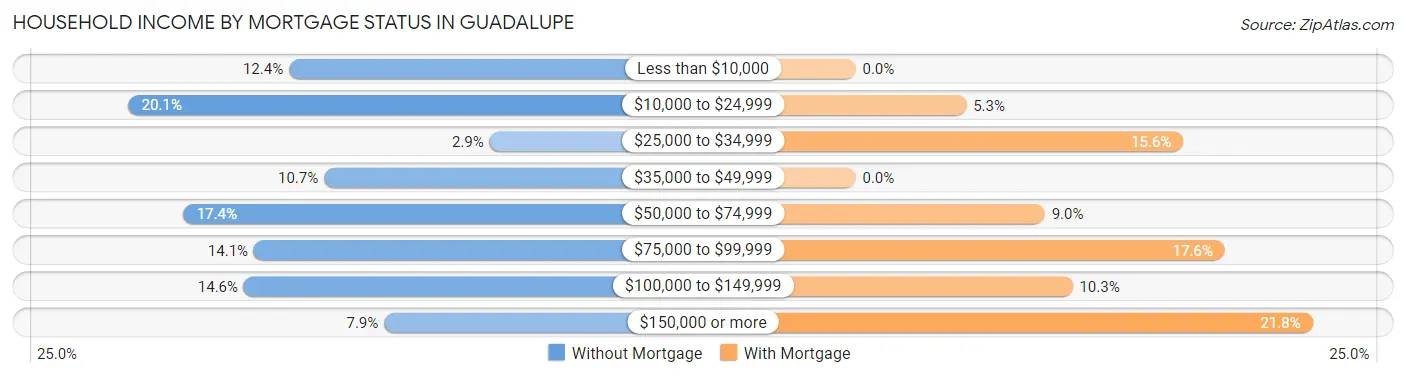
| Household Income | Without Mortgage | With Mortgage |
| Less than $10,000 | 52 (12.4%) | 0 (0.0%) |
| $10,000 to $24,999 | 84 (20.1%) | 24 (5.3%) |
| $25,000 to $34,999 | 12 (2.9%) | 71 (15.6%) |
| $35,000 to $49,999 | 45 (10.7%) | 0 (0.0%) |
| $50,000 to $74,999 | 73 (17.4%) | 41 (9.0%) |
| $75,000 to $99,999 | 59 (14.1%) | 80 (17.6%) |
| $100,000 to $149,999 | 61 (14.6%) | 47 (10.3%) |
| $150,000 or more | 33 (7.9%) | 99 (21.8%) |
| Total | 419 (100.0%) | 455 (100.0%) |
Property Value to Household Income Ratio in Guadalupe
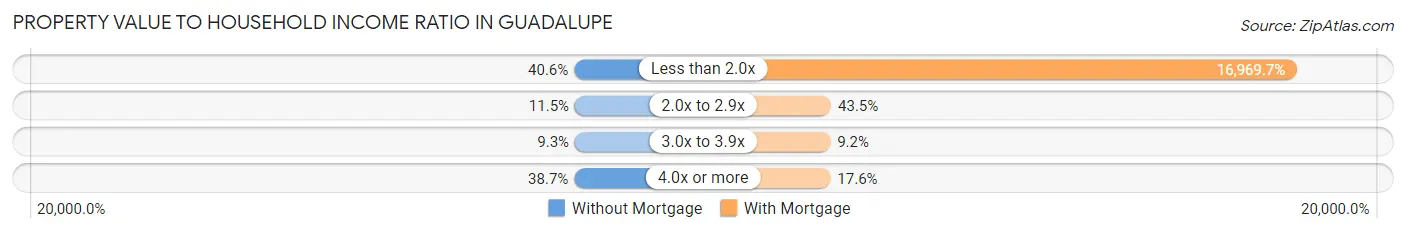
| Value-to-Income Ratio | Without Mortgage | With Mortgage |
| Less than 2.0x | 170 (40.6%) | 77,212 (16,969.7%) |
| 2.0x to 2.9x | 48 (11.5%) | 198 (43.5%) |
| 3.0x to 3.9x | 39 (9.3%) | 42 (9.2%) |
| 4.0x or more | 162 (38.7%) | 80 (17.6%) |
| Total | 419 (100.0%) | 455 (100.0%) |
Real Estate Taxes by Mortgage Status in Guadalupe
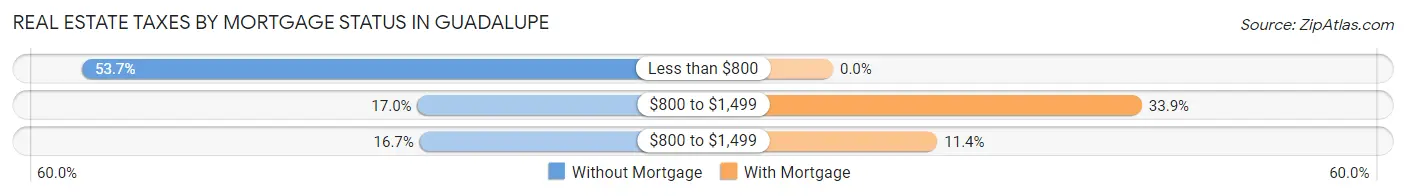
| Property Taxes | Without Mortgage | With Mortgage |
| Less than $800 | 225 (53.7%) | 0 (0.0%) |
| $800 to $1,499 | 71 (17.0%) | 154 (33.9%) |
| $800 to $1,499 | 70 (16.7%) | 52 (11.4%) |
| Total | 419 (100.0%) | 455 (100.0%) |
Health & Disability in Guadalupe
Health Insurance Coverage by Age in Guadalupe
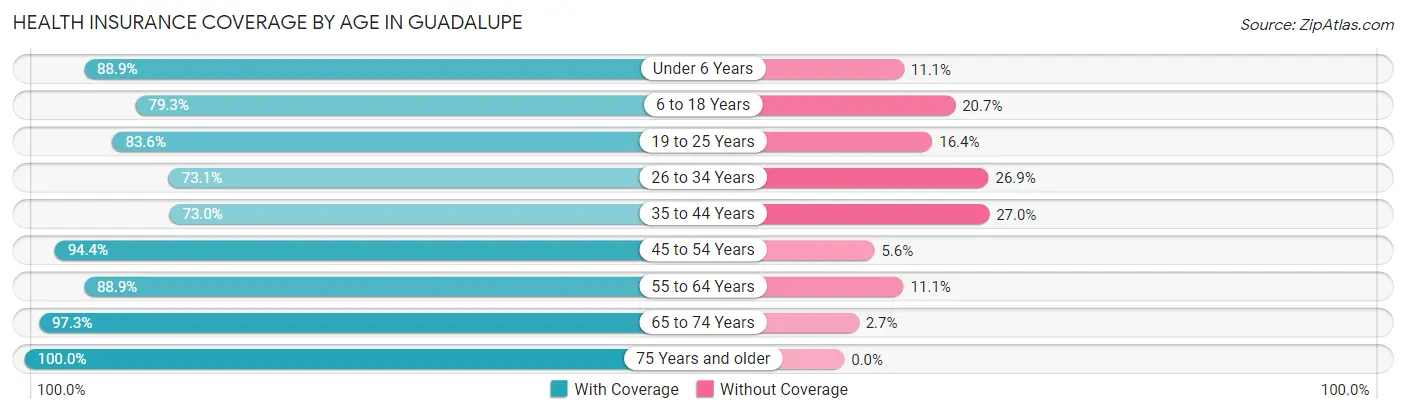
| Age Bracket | With Coverage | Without Coverage |
| Under 6 Years | 384 (88.9%) | 48 (11.1%) |
| 6 to 18 Years | 828 (79.3%) | 216 (20.7%) |
| 19 to 25 Years | 331 (83.6%) | 65 (16.4%) |
| 26 to 34 Years | 576 (73.1%) | 212 (26.9%) |
| 35 to 44 Years | 424 (73.0%) | 157 (27.0%) |
| 45 to 54 Years | 671 (94.4%) | 40 (5.6%) |
| 55 to 64 Years | 699 (88.9%) | 87 (11.1%) |
| 65 to 74 Years | 362 (97.3%) | 10 (2.7%) |
| 75 Years and older | 225 (100.0%) | 0 (0.0%) |
| Total | 4,500 (84.4%) | 835 (15.7%) |
Health Insurance Coverage by Citizenship Status in Guadalupe
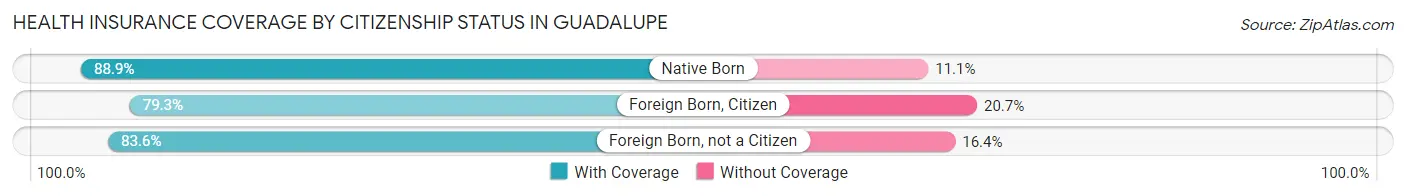
| Citizenship Status | With Coverage | Without Coverage |
| Native Born | 384 (88.9%) | 48 (11.1%) |
| Foreign Born, Citizen | 828 (79.3%) | 216 (20.7%) |
| Foreign Born, not a Citizen | 331 (83.6%) | 65 (16.4%) |
Health Insurance Coverage by Household Income in Guadalupe
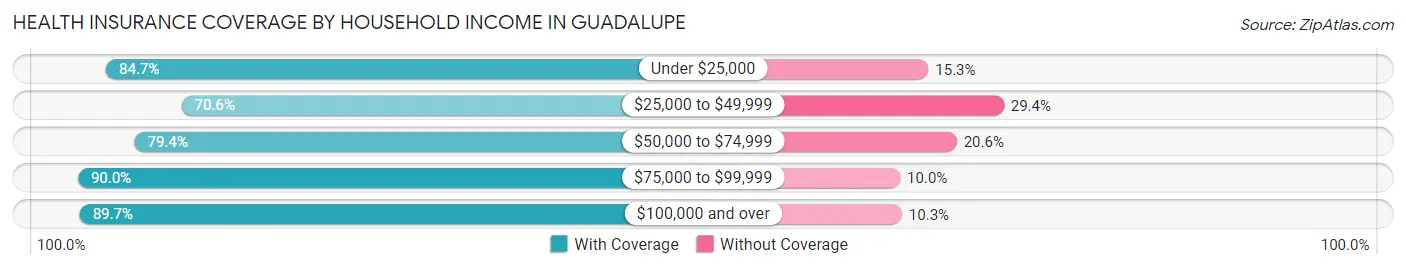
| Household Income | With Coverage | Without Coverage |
| Under $25,000 | 1,020 (84.7%) | 184 (15.3%) |
| $25,000 to $49,999 | 511 (70.6%) | 213 (29.4%) |
| $50,000 to $74,999 | 686 (79.4%) | 178 (20.6%) |
| $75,000 to $99,999 | 693 (90.0%) | 77 (10.0%) |
| $100,000 and over | 1,588 (89.7%) | 183 (10.3%) |
Public vs Private Health Insurance Coverage by Age in Guadalupe
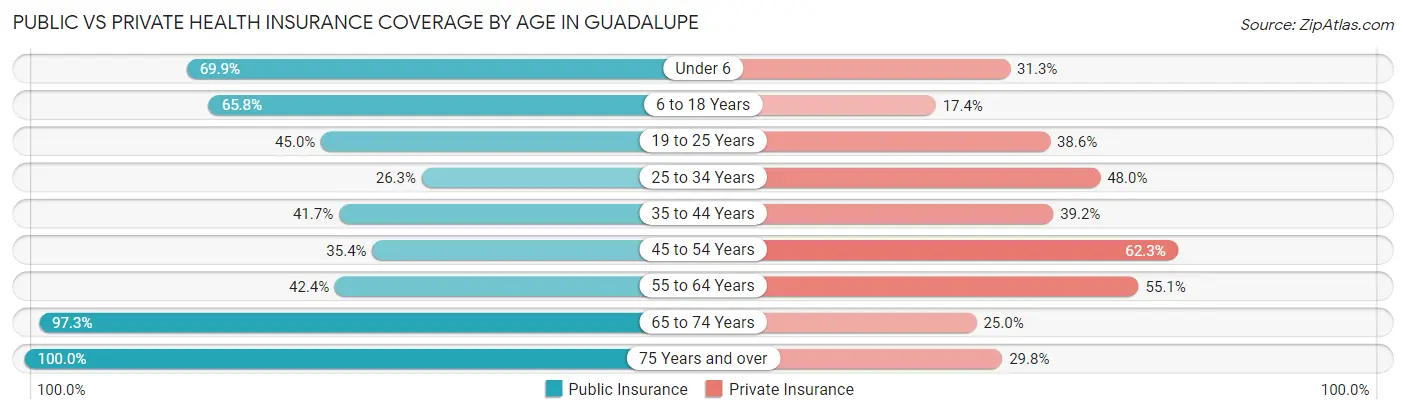
| Age Bracket | Public Insurance | Private Insurance |
| Under 6 | 302 (69.9%) | 135 (31.2%) |
| 6 to 18 Years | 687 (65.8%) | 182 (17.4%) |
| 19 to 25 Years | 178 (45.0%) | 153 (38.6%) |
| 25 to 34 Years | 207 (26.3%) | 378 (48.0%) |
| 35 to 44 Years | 242 (41.6%) | 228 (39.2%) |
| 45 to 54 Years | 252 (35.4%) | 443 (62.3%) |
| 55 to 64 Years | 333 (42.4%) | 433 (55.1%) |
| 65 to 74 Years | 362 (97.3%) | 93 (25.0%) |
| 75 Years and over | 225 (100.0%) | 67 (29.8%) |
| Total | 2,788 (52.3%) | 2,112 (39.6%) |
Disability Status by Sex by Age in Guadalupe
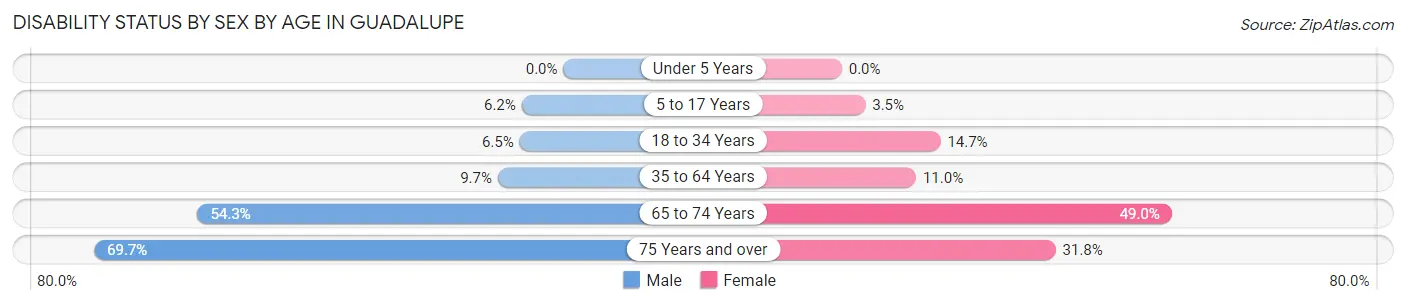
| Age Bracket | Male | Female |
| Under 5 Years | 0 (0.0%) | 0 (0.0%) |
| 5 to 17 Years | 25 (6.2%) | 25 (3.5%) |
| 18 to 34 Years | 45 (6.5%) | 87 (14.6%) |
| 35 to 64 Years | 98 (9.7%) | 118 (11.0%) |
| 65 to 74 Years | 69 (54.3%) | 120 (49.0%) |
| 75 Years and over | 69 (69.7%) | 40 (31.8%) |
Disability Class by Sex by Age in Guadalupe
Disability Class: Hearing Difficulty
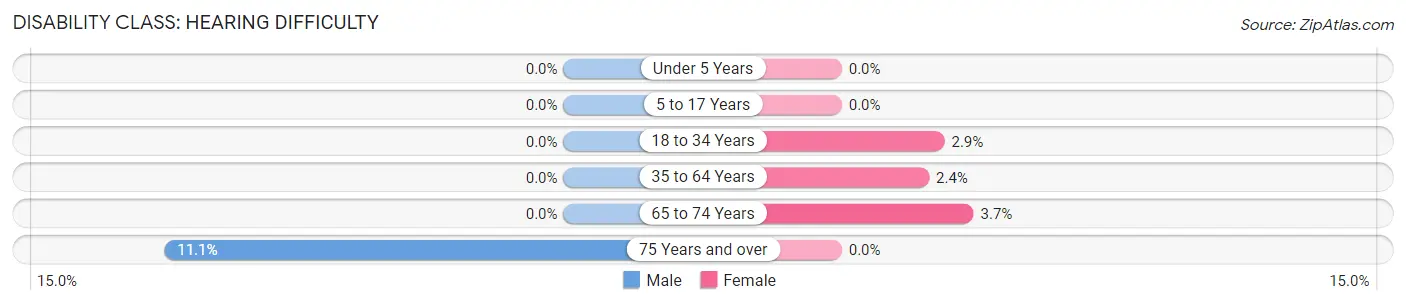
| Age Bracket | Male | Female |
| Under 5 Years | 0 (0.0%) | 0 (0.0%) |
| 5 to 17 Years | 0 (0.0%) | 0 (0.0%) |
| 18 to 34 Years | 0 (0.0%) | 17 (2.9%) |
| 35 to 64 Years | 0 (0.0%) | 26 (2.4%) |
| 65 to 74 Years | 0 (0.0%) | 9 (3.7%) |
| 75 Years and over | 11 (11.1%) | 0 (0.0%) |
Disability Class: Vision Difficulty
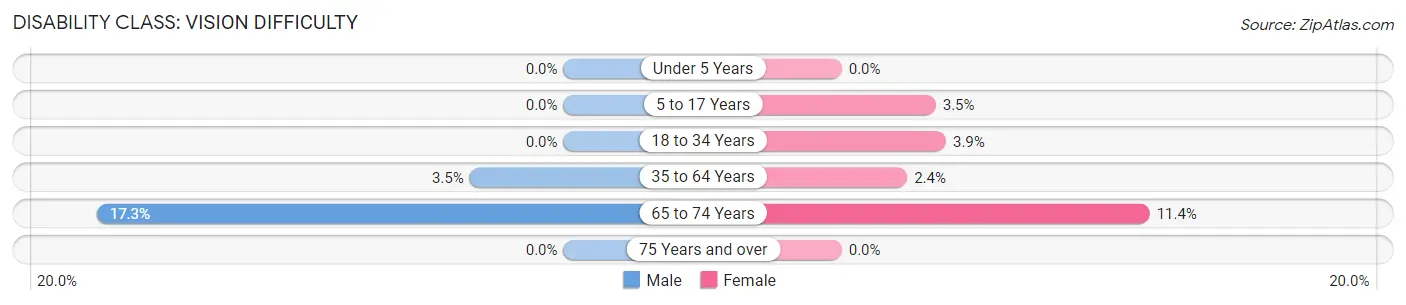
| Age Bracket | Male | Female |
| Under 5 Years | 0 (0.0%) | 0 (0.0%) |
| 5 to 17 Years | 0 (0.0%) | 25 (3.5%) |
| 18 to 34 Years | 0 (0.0%) | 23 (3.9%) |
| 35 to 64 Years | 35 (3.5%) | 26 (2.4%) |
| 65 to 74 Years | 22 (17.3%) | 28 (11.4%) |
| 75 Years and over | 0 (0.0%) | 0 (0.0%) |
Disability Class: Cognitive Difficulty
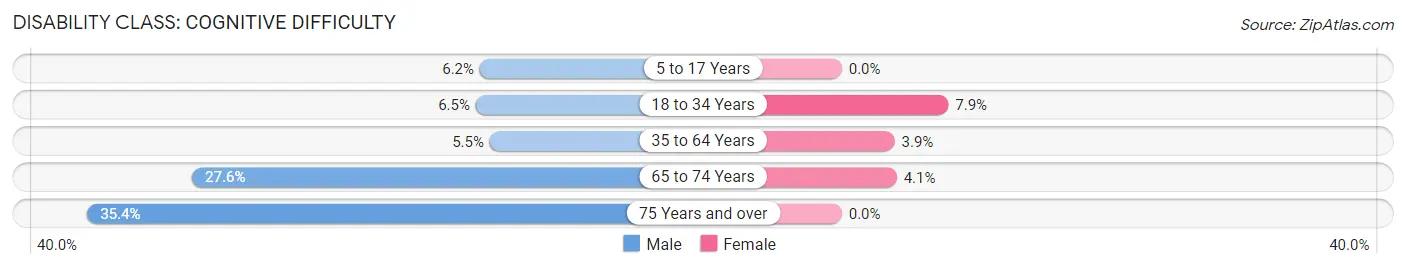
| Age Bracket | Male | Female |
| 5 to 17 Years | 25 (6.2%) | 0 (0.0%) |
| 18 to 34 Years | 45 (6.5%) | 47 (7.9%) |
| 35 to 64 Years | 55 (5.5%) | 42 (3.9%) |
| 65 to 74 Years | 35 (27.6%) | 10 (4.1%) |
| 75 Years and over | 35 (35.3%) | 0 (0.0%) |
Disability Class: Ambulatory Difficulty
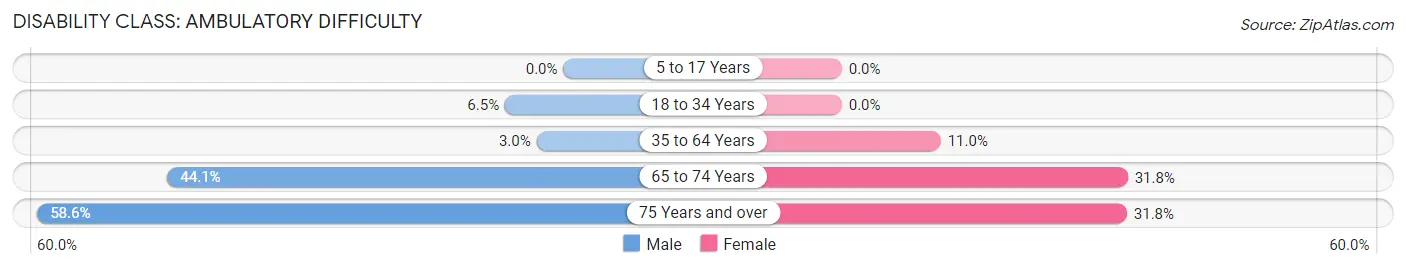
| Age Bracket | Male | Female |
| 5 to 17 Years | 0 (0.0%) | 0 (0.0%) |
| 18 to 34 Years | 45 (6.5%) | 0 (0.0%) |
| 35 to 64 Years | 30 (3.0%) | 118 (11.0%) |
| 65 to 74 Years | 56 (44.1%) | 78 (31.8%) |
| 75 Years and over | 58 (58.6%) | 40 (31.8%) |
Disability Class: Self-Care Difficulty
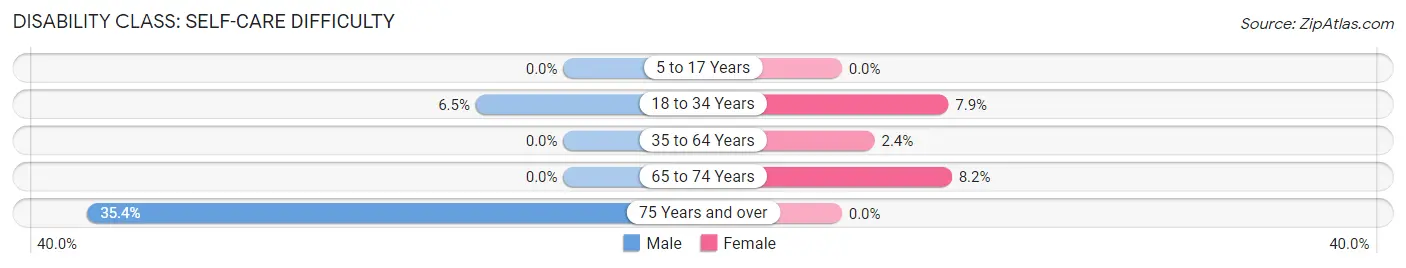
| Age Bracket | Male | Female |
| 5 to 17 Years | 0 (0.0%) | 0 (0.0%) |
| 18 to 34 Years | 45 (6.5%) | 47 (7.9%) |
| 35 to 64 Years | 0 (0.0%) | 26 (2.4%) |
| 65 to 74 Years | 0 (0.0%) | 20 (8.2%) |
| 75 Years and over | 35 (35.3%) | 0 (0.0%) |
Technology Access in Guadalupe
Computing Device Access in Guadalupe
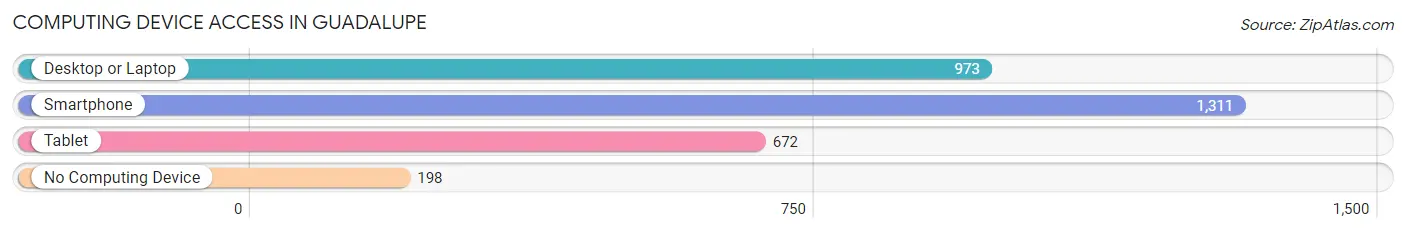
| Device Type | # Households | % Households |
| Desktop or Laptop | 973 | 60.3% |
| Smartphone | 1,311 | 81.2% |
| Tablet | 672 | 41.6% |
| No Computing Device | 198 | 12.3% |
| Total | 1,614 | 100.0% |
Internet Access in Guadalupe
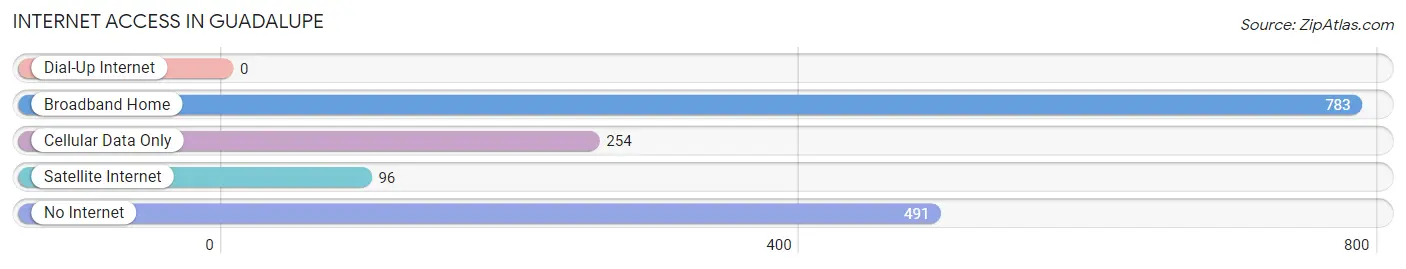
| Internet Type | # Households | % Households |
| Dial-Up Internet | 0 | 0.0% |
| Broadband Home | 783 | 48.5% |
| Cellular Data Only | 254 | 15.7% |
| Satellite Internet | 96 | 5.9% |
| No Internet | 491 | 30.4% |
| Total | 1,614 | 100.0% |
Guadalupe Summary
Guadalupe, Arizona is a small town located in Maricopa County, Arizona. It is situated in the Sonoran Desert, approximately 20 miles west of Phoenix. The town was founded in 1883 by a group of Mexican settlers who named it after the Virgin of Guadalupe. The population of Guadalupe was 2,228 as of the 2010 census.
History
Guadalupe was founded in 1883 by a group of Mexican settlers who named it after the Virgin of Guadalupe. The town was originally a farming community, with the main crops being cotton, alfalfa, and wheat. The town was also home to a number of small businesses, including a general store, a blacksmith shop, and a saloon.
In the early 1900s, the town began to grow and develop. The first school was built in 1910, and the first church was built in 1912. The town also had a post office, a bank, and a newspaper.
In the 1920s, the town experienced a period of growth and prosperity. The population increased from 500 to 1,000, and the town had a number of businesses, including a movie theater, a hotel, and a grocery store.
In the 1930s, the Great Depression hit the town hard. Many of the businesses closed, and the population decreased to 500. The town was able to survive, however, and by the 1940s, the population had increased to 1,000 again.
In the 1950s, the town experienced a period of growth and development. The population increased to 1,500, and the town had a number of businesses, including a gas station, a hardware store, and a restaurant.
In the 1960s, the town experienced a period of decline. The population decreased to 1,000, and many of the businesses closed. The town was able to survive, however, and by the 1970s, the population had increased to 1,500 again.
In the 1980s, the town experienced a period of growth and development. The population increased to 2,000, and the town had a number of businesses, including a grocery store, a hardware store, and a restaurant.
Geography
Guadalupe is located in Maricopa County, Arizona. It is situated in the Sonoran Desert, approximately 20 miles west of Phoenix. The town is located at an elevation of 1,400 feet above sea level.
The town is surrounded by desert and mountains. The nearby mountains include the Sierra Estrella, the White Tank Mountains, and the Gila Mountains. The nearby desert includes the Sonoran Desert and the Mohave Desert.
Economy
The economy of Guadalupe is largely based on agriculture. The main crops are cotton, alfalfa, and wheat. The town also has a number of small businesses, including a grocery store, a hardware store, and a restaurant.
Demographics
As of the 2010 census, the population of Guadalupe was 2,228. The racial makeup of the town was 75.3% White, 0.7% African American, 0.7% Native American, 0.3% Asian, 0.1% Pacific Islander, 20.2% from other races, and 2.9% from two or more races. Hispanic or Latino of any race were 44.2% of the population.
The median household income in Guadalupe was $30,938, and the median family income was $35,625. The per capita income was $14,945. About 20.2% of the population was below the poverty line.
Common Questions
What is Per Capita Income in Guadalupe?
Per Capita income in Guadalupe is $26,814.
What is the Median Family Income in Guadalupe?
Median Family Income in Guadalupe is $74,773.
What is the Median Household income in Guadalupe?
Median Household Income in Guadalupe is $56,423.
What is Income or Wage Gap in Guadalupe?
Income or Wage Gap in Guadalupe is 57.3%.
Women in Guadalupe earn 42.7 cents for every dollar earned by a man.
What is Inequality or Gini Index in Guadalupe?
Inequality or Gini Index in Guadalupe is 0.54.
What is the Total Population of Guadalupe?
Total Population of Guadalupe is 5,335.
What is the Total Male Population of Guadalupe?
Total Male Population of Guadalupe is 2,434.
What is the Total Female Population of Guadalupe?
Total Female Population of Guadalupe is 2,901.
What is the Ratio of Males per 100 Females in Guadalupe?
There are 83.90 Males per 100 Females in Guadalupe.
What is the Ratio of Females per 100 Males in Guadalupe?
There are 119.19 Females per 100 Males in Guadalupe.
What is the Median Population Age in Guadalupe?
Median Population Age in Guadalupe is 35.2 Years.
What is the Average Family Size in Guadalupe
Average Family Size in Guadalupe is 3.9 People.
What is the Average Household Size in Guadalupe
Average Household Size in Guadalupe is 3.3 People.
How Large is the Labor Force in Guadalupe?
There are 2,728 People in the Labor Forcein in Guadalupe.
What is the Percentage of People in the Labor Force in Guadalupe?
64.0% of People are in the Labor Force in Guadalupe.
What is the Unemployment Rate in Guadalupe?
Unemployment Rate in Guadalupe is 4.5%.