Nelson, AZ Map & Demographics
Nelson Map
Nelson Overview
$22,876
PER CAPITA INCOME
$47,154
AVG FAMILY INCOME
$52,300
AVG HOUSEHOLD INCOME
0.32
INEQUALITY / GINI INDEX
387
TOTAL POPULATION
258
MALE POPULATION
129
FEMALE POPULATION
200.00
MALES / 100 FEMALES
50.00
FEMALES / 100 MALES
34.2
MEDIAN AGE
3.4
AVG FAMILY SIZE
3.4
AVG HOUSEHOLD SIZE
117
LABOR FORCE [ PEOPLE ]
49.2%
PERCENT IN LABOR FORCE
Income in Nelson
Income Overview in Nelson
Per Capita Income in Nelson is $22,876, while median incomes of families and households are $47,154 and $52,300 respectively.
| Characteristic | Number | Measure |
| Per Capita Income | 387 | $22,876 |
| Median Family Income | 85 | $47,154 |
| Mean Family Income | 85 | $55,366 |
| Median Household Income | 114 | $52,300 |
| Mean Household Income | 114 | $78,985 |
| Income Deficit | 85 | $0 |
| Wage / Income Gap (%) | 387 | 0.00% |
| Wage / Income Gap ($) | 387 | 100.00¢ per $1 |
| Gini / Inequality Index | 387 | 0.32 |
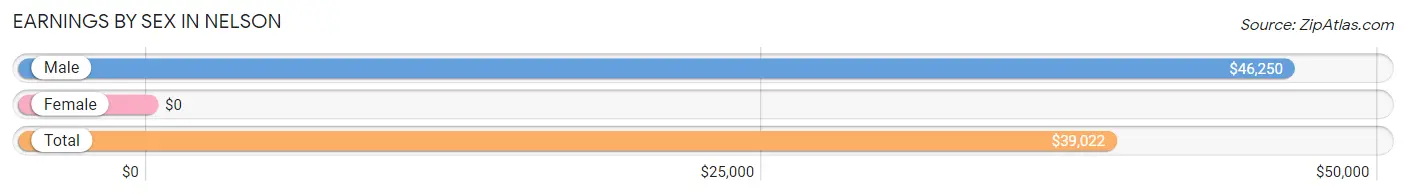
Earnings by Sex in Nelson
| Sex | Number | Average Earnings |
| Male | 93 (49.5%) | $46,250 |
| Female | 95 (50.5%) | $0 |
| Total | 188 (100.0%) | $39,022 |
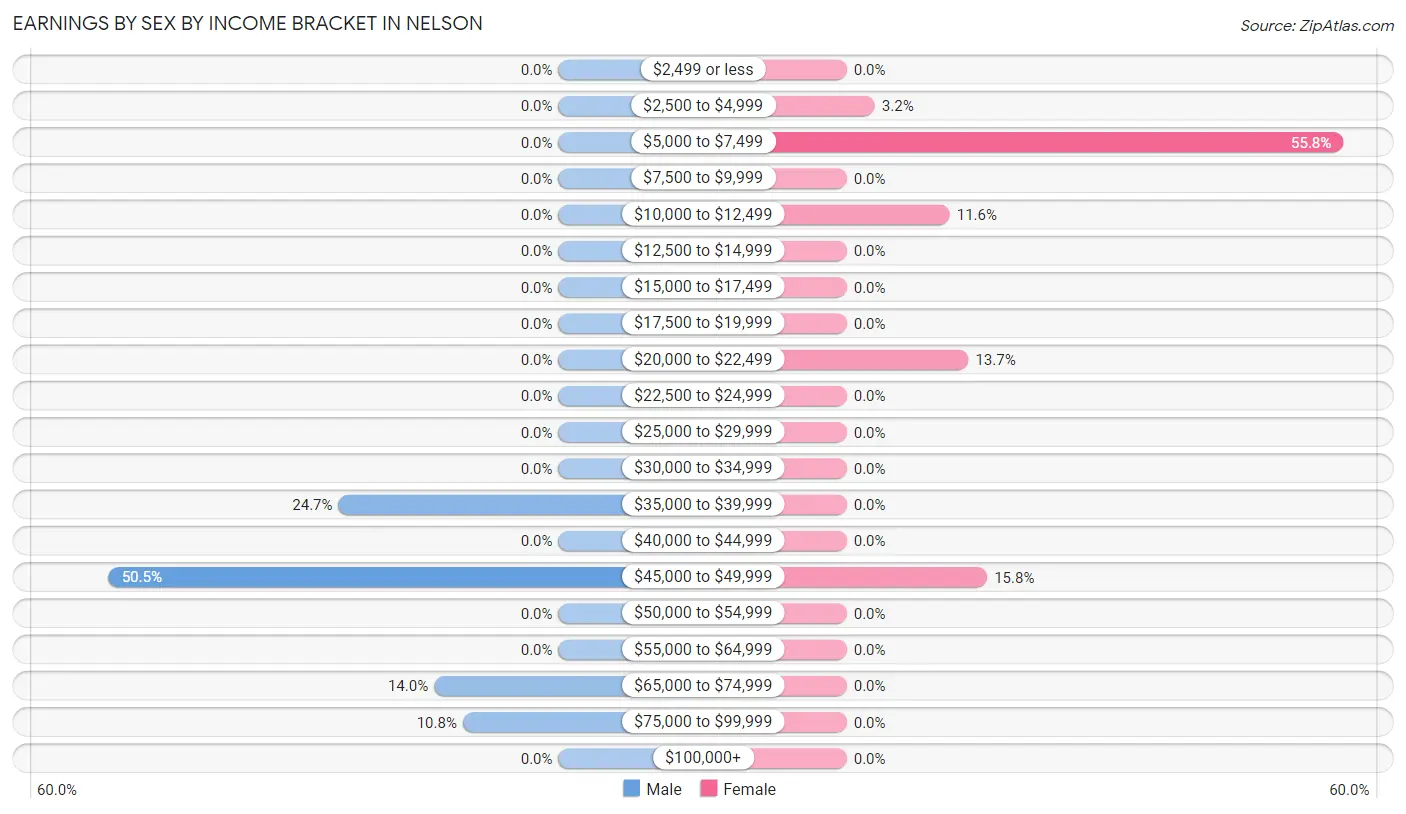
Earnings by Sex by Income Bracket in Nelson
The most common earnings brackets in Nelson are $45,000 to $49,999 for men (47 | 50.5%) and $5,000 to $7,499 for women (53 | 55.8%).
| Income | Male | Female |
| $2,499 or less | 0 (0.0%) | 0 (0.0%) |
| $2,500 to $4,999 | 0 (0.0%) | 3 (3.2%) |
| $5,000 to $7,499 | 0 (0.0%) | 53 (55.8%) |
| $7,500 to $9,999 | 0 (0.0%) | 0 (0.0%) |
| $10,000 to $12,499 | 0 (0.0%) | 11 (11.6%) |
| $12,500 to $14,999 | 0 (0.0%) | 0 (0.0%) |
| $15,000 to $17,499 | 0 (0.0%) | 0 (0.0%) |
| $17,500 to $19,999 | 0 (0.0%) | 0 (0.0%) |
| $20,000 to $22,499 | 0 (0.0%) | 13 (13.7%) |
| $22,500 to $24,999 | 0 (0.0%) | 0 (0.0%) |
| $25,000 to $29,999 | 0 (0.0%) | 0 (0.0%) |
| $30,000 to $34,999 | 0 (0.0%) | 0 (0.0%) |
| $35,000 to $39,999 | 23 (24.7%) | 0 (0.0%) |
| $40,000 to $44,999 | 0 (0.0%) | 0 (0.0%) |
| $45,000 to $49,999 | 47 (50.5%) | 15 (15.8%) |
| $50,000 to $54,999 | 0 (0.0%) | 0 (0.0%) |
| $55,000 to $64,999 | 0 (0.0%) | 0 (0.0%) |
| $65,000 to $74,999 | 13 (14.0%) | 0 (0.0%) |
| $75,000 to $99,999 | 10 (10.7%) | 0 (0.0%) |
| $100,000+ | 0 (0.0%) | 0 (0.0%) |
| Total | 93 (100.0%) | 95 (100.0%) |
Earnings by Sex by Educational Attainment in Nelson
| Educational Attainment | Male Income | Female Income |
| Less than High School | - | - |
| High School Diploma | - | - |
| College or Associate's Degree | - | - |
| Bachelor's Degree | - | - |
| Graduate Degree | - | - |
| Total | $46,250 | $0 |
Family Income in Nelson
Family Income Brackets in Nelson
According to the Nelson family income data, there are 47 families falling into the $35,000 to $49,999 income range, which is the most common income bracket and makes up 55.3% of all families.
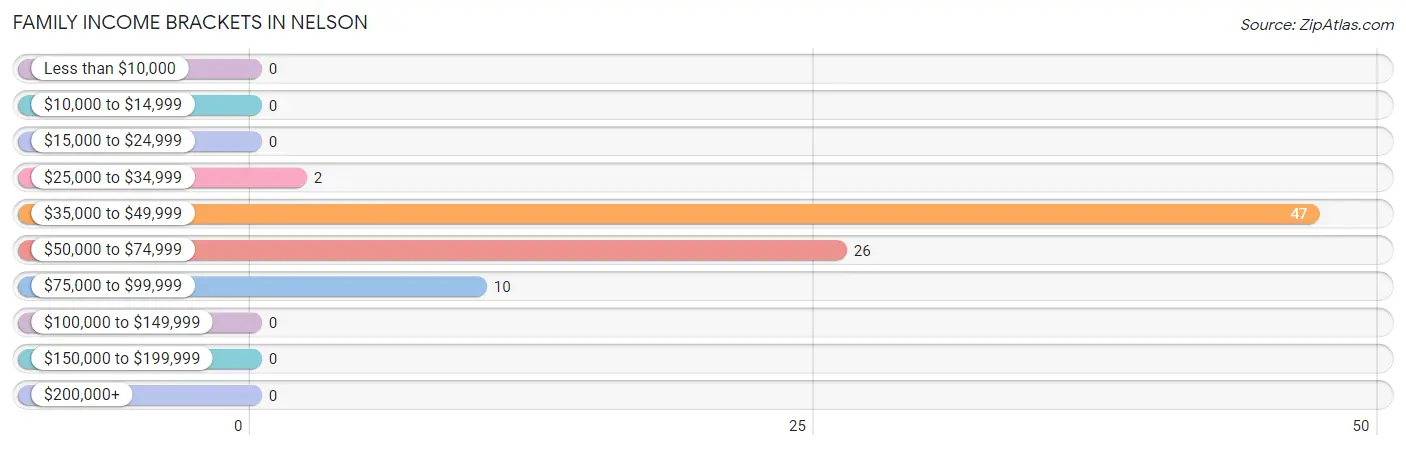
| Income Bracket | # Families | % Families |
| Less than $10,000 | 0 | 0.0% |
| $10,000 to $14,999 | 0 | 0.0% |
| $15,000 to $24,999 | 0 | 0.0% |
| $25,000 to $34,999 | 2 | 2.4% |
| $35,000 to $49,999 | 47 | 55.3% |
| $50,000 to $74,999 | 26 | 30.6% |
| $75,000 to $99,999 | 10 | 11.8% |
| $100,000 to $149,999 | 0 | 0.0% |
| $150,000 to $199,999 | 0 | 0.0% |
| $200,000+ | 0 | 0.0% |
Family Income by Famaliy Size in Nelson
2-person families (26 | 30.6%) account for the highest median family income in Nelson with $58,889 per family, while 2-person families (26 | 30.6%) have the highest median income of $29,444 per family member.
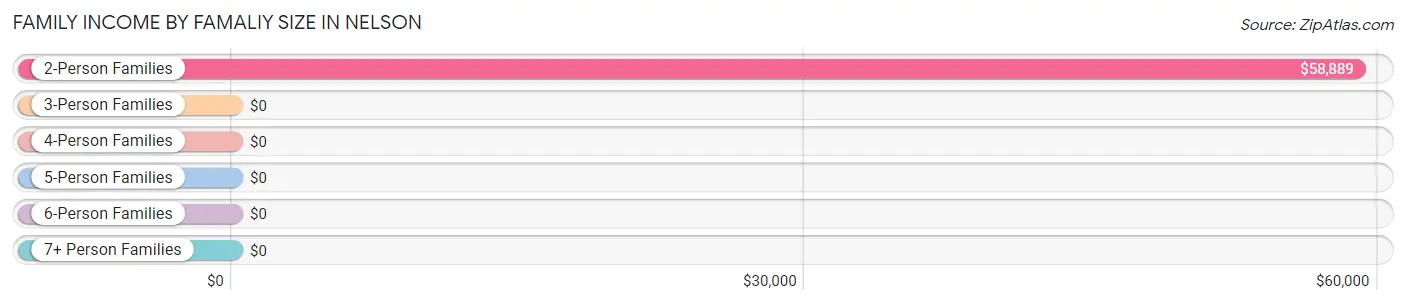
| Income Bracket | # Families | Median Income |
| 2-Person Families | 26 (30.6%) | $58,889 |
| 3-Person Families | 12 (14.1%) | $0 |
| 4-Person Families | 0 (0.0%) | $0 |
| 5-Person Families | 47 (55.3%) | $0 |
| 6-Person Families | 0 (0.0%) | $0 |
| 7+ Person Families | 0 (0.0%) | $0 |
| Total | 85 (100.0%) | $47,154 |
Family Income by Number of Earners in Nelson
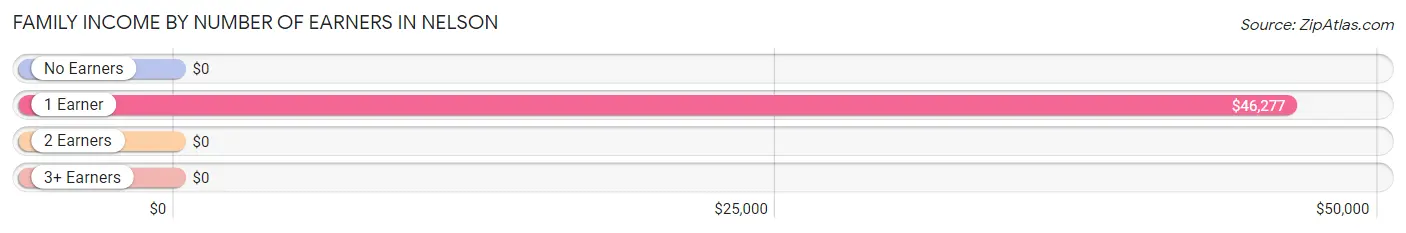
| Number of Earners | # Families | Median Income |
| No Earners | 5 (5.9%) | $0 |
| 1 Earner | 52 (61.2%) | $46,277 |
| 2 Earners | 28 (32.9%) | $0 |
| 3+ Earners | 0 (0.0%) | $0 |
| Total | 85 (100.0%) | $47,154 |
Household Income in Nelson
Household Income Brackets in Nelson
With 73 households falling in the category, the $50,000 to $74,999 income range is the most frequent in Nelson, accounting for 64.0% of all households.
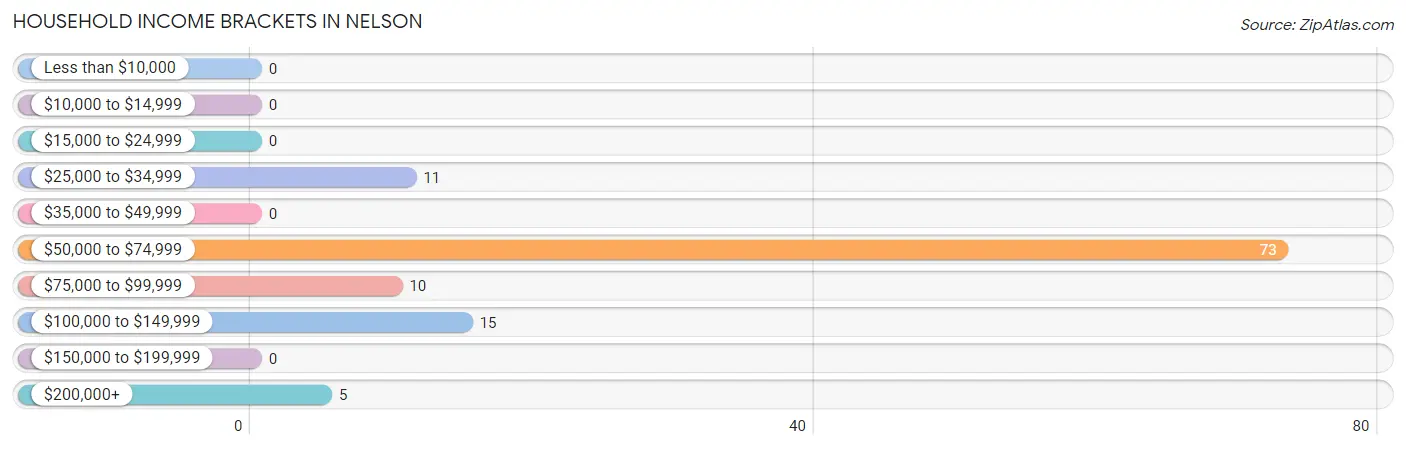
| Income Bracket | # Households | % Households |
| Less than $10,000 | 0 | 0.0% |
| $10,000 to $14,999 | 0 | 0.0% |
| $15,000 to $24,999 | 0 | 0.0% |
| $25,000 to $34,999 | 11 | 9.6% |
| $35,000 to $49,999 | 0 | 0.0% |
| $50,000 to $74,999 | 73 | 64.0% |
| $75,000 to $99,999 | 10 | 8.8% |
| $100,000 to $149,999 | 15 | 13.2% |
| $150,000 to $199,999 | 0 | 0.0% |
| $200,000+ | 5 | 4.4% |
Household Income by Householder Age in Nelson
| Income Bracket | # Households | Median Income |
| 15 to 24 Years | 0 (0.0%) | $0 |
| 25 to 44 Years | 62 (54.4%) | $0 |
| 45 to 64 Years | 35 (30.7%) | $0 |
| 65+ Years | 17 (14.9%) | $0 |
| Total | 114 (100.0%) | $52,300 |
Poverty in Nelson
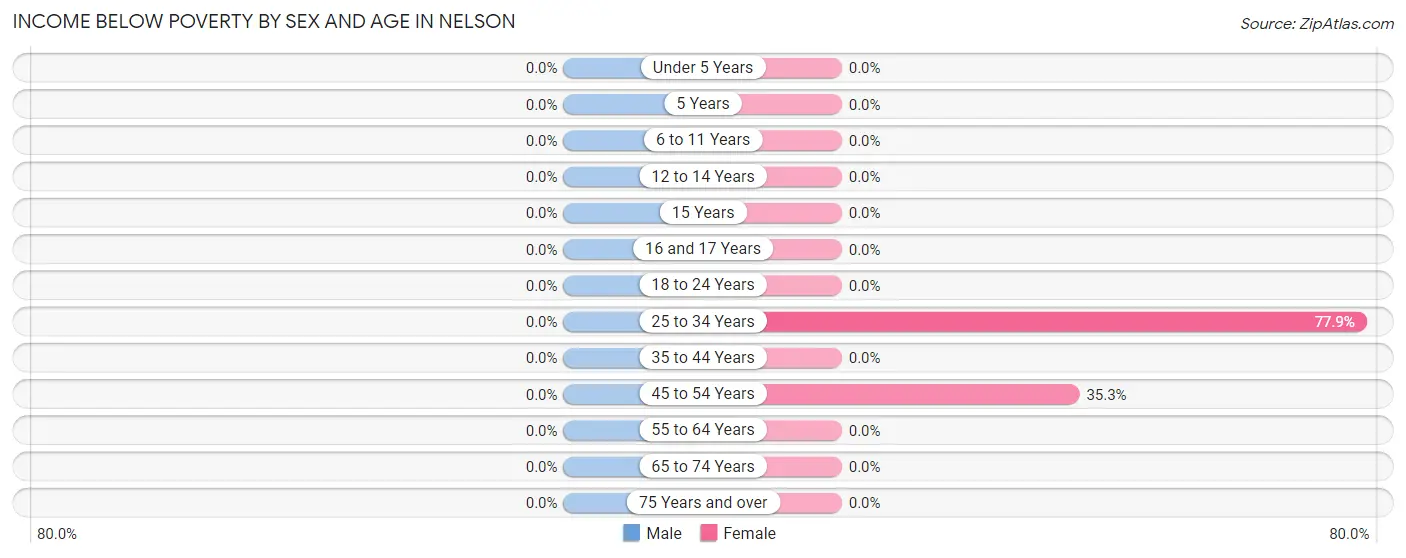
Income Below Poverty by Sex and Age in Nelson
| Age Bracket | Male | Female |
| Under 5 Years | 0 (0.0%) | 0 (0.0%) |
| 5 Years | 0 (0.0%) | 0 (0.0%) |
| 6 to 11 Years | 0 (0.0%) | 0 (0.0%) |
| 12 to 14 Years | 0 (0.0%) | 0 (0.0%) |
| 15 Years | 0 (0.0%) | 0 (0.0%) |
| 16 and 17 Years | 0 (0.0%) | 0 (0.0%) |
| 18 to 24 Years | 0 (0.0%) | 0 (0.0%) |
| 25 to 34 Years | 0 (0.0%) | 53 (77.9%) |
| 35 to 44 Years | 0 (0.0%) | 0 (0.0%) |
| 45 to 54 Years | 0 (0.0%) | 6 (35.3%) |
| 55 to 64 Years | 0 (0.0%) | 0 (0.0%) |
| 65 to 74 Years | 0 (0.0%) | 0 (0.0%) |
| 75 Years and over | 0 (0.0%) | 0 (0.0%) |
| Total | 0 (0.0%) | 59 (45.7%) |
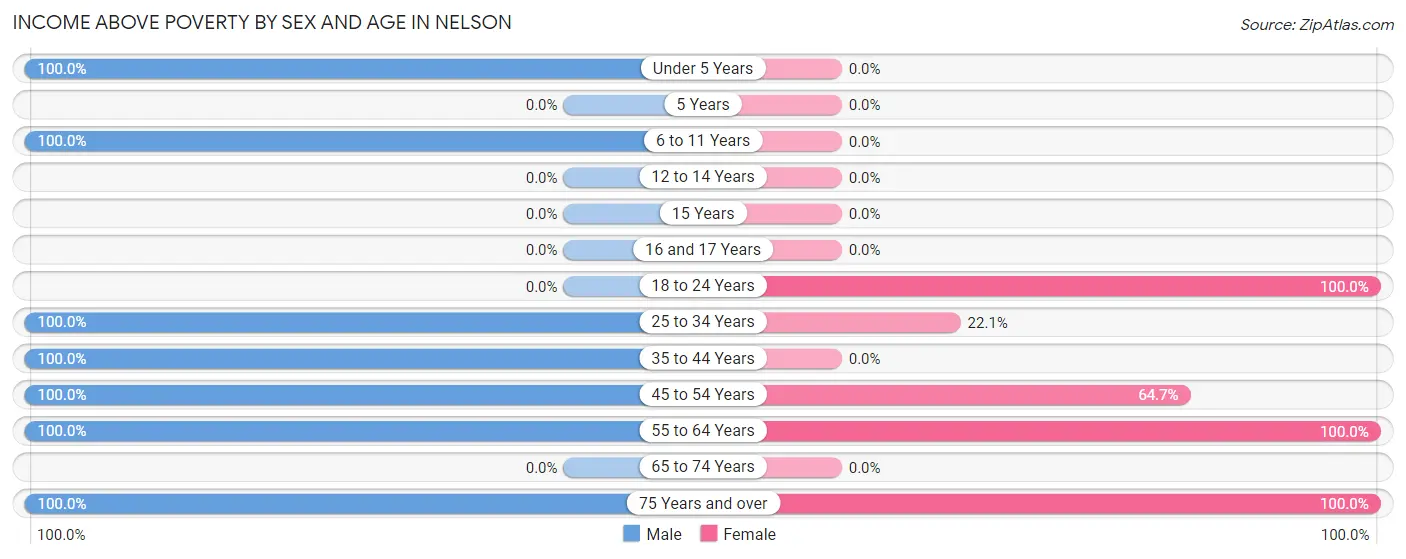
Income Above Poverty by Sex and Age in Nelson
According to the poverty statistics in Nelson, males aged under 5 years and females aged 18 to 24 years are the age groups that are most secure financially, with 100.0% of males and 100.0% of females in these age groups living above the poverty line.
| Age Bracket | Male | Female |
| Under 5 Years | 64 (100.0%) | 0 (0.0%) |
| 5 Years | 0 (0.0%) | 0 (0.0%) |
| 6 to 11 Years | 85 (100.0%) | 0 (0.0%) |
| 12 to 14 Years | 0 (0.0%) | 0 (0.0%) |
| 15 Years | 0 (0.0%) | 0 (0.0%) |
| 16 and 17 Years | 0 (0.0%) | 0 (0.0%) |
| 18 to 24 Years | 0 (0.0%) | 17 (100.0%) |
| 25 to 34 Years | 13 (100.0%) | 15 (22.1%) |
| 35 to 44 Years | 47 (100.0%) | 0 (0.0%) |
| 45 to 54 Years | 5 (100.0%) | 11 (64.7%) |
| 55 to 64 Years | 30 (100.0%) | 20 (100.0%) |
| 65 to 74 Years | 0 (0.0%) | 0 (0.0%) |
| 75 Years and over | 14 (100.0%) | 7 (100.0%) |
| Total | 258 (100.0%) | 70 (54.3%) |
Income Below Poverty Among Married-Couple Families in Nelson
| Children | Above Poverty | Below Poverty |
| No Children | 35 (100.0%) | 0 (0.0%) |
| 1 or 2 Children | 0 (0.0%) | 0 (0.0%) |
| 3 or 4 Children | 0 (0.0%) | 0 (0.0%) |
| 5 or more Children | 0 (0.0%) | 0 (0.0%) |
| Total | 35 (100.0%) | 0 (0.0%) |
Income Below Poverty Among Single-Parent Households in Nelson
| Children | Single Father | Single Mother |
| No Children | 0 (0.0%) | 0 (0.0%) |
| 1 or 2 Children | 0 (0.0%) | 0 (0.0%) |
| 3 or 4 Children | 0 (0.0%) | 0 (0.0%) |
| 5 or more Children | 0 (0.0%) | 0 (0.0%) |
| Total | 0 (0.0%) | 0 (0.0%) |
Income Below Poverty Among Married-Couple vs Single-Parent Households in Nelson
| Children | Married-Couple Families | Single-Parent Households |
| No Children | 0 (0.0%) | 0 (0.0%) |
| 1 or 2 Children | 0 (0.0%) | 0 (0.0%) |
| 3 or 4 Children | 0 (0.0%) | 0 (0.0%) |
| 5 or more Children | 0 (0.0%) | 0 (0.0%) |
| Total | 0 (0.0%) | 0 (0.0%) |
Race in Nelson
The most populous races in Nelson are Hispanic or Latino (249 | 64.3%), Some other Race (249 | 64.3%), and White / Caucasian (120 | 31.0%).
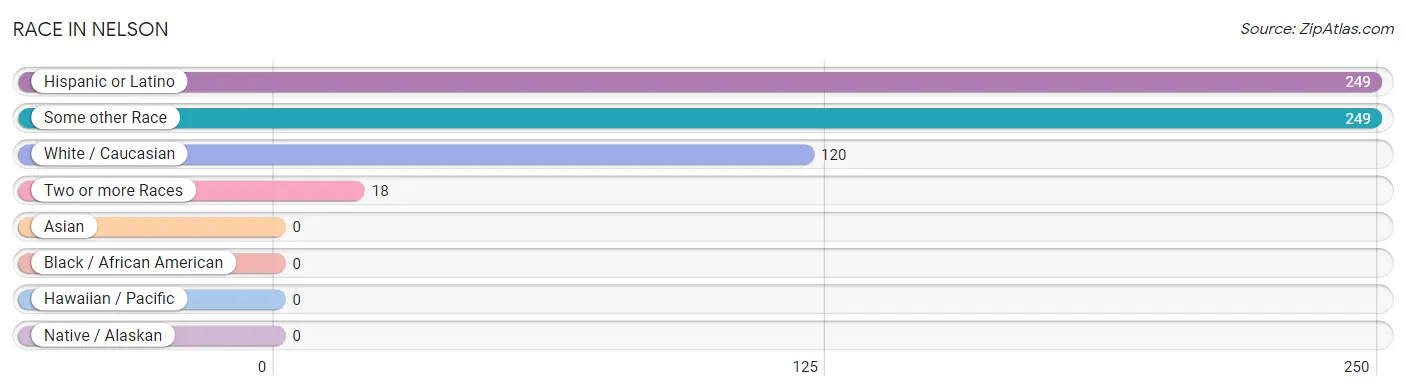
| Race | # Population | % Population |
| Asian | 0 | 0.0% |
| Black / African American | 0 | 0.0% |
| Hawaiian / Pacific | 0 | 0.0% |
| Hispanic or Latino | 249 | 64.3% |
| Native / Alaskan | 0 | 0.0% |
| White / Caucasian | 120 | 31.0% |
| Two or more Races | 18 | 4.6% |
| Some other Race | 249 | 64.3% |
| Total | 387 | 100.0% |
Ancestry in Nelson
The most populous ancestries reported in Nelson are Mexican (249 | 64.3%), German (74 | 19.1%), Norwegian (28 | 7.2%), Swedish (26 | 6.7%), and Dutch (24 | 6.2%), together accounting for 103.6% of all Nelson residents.
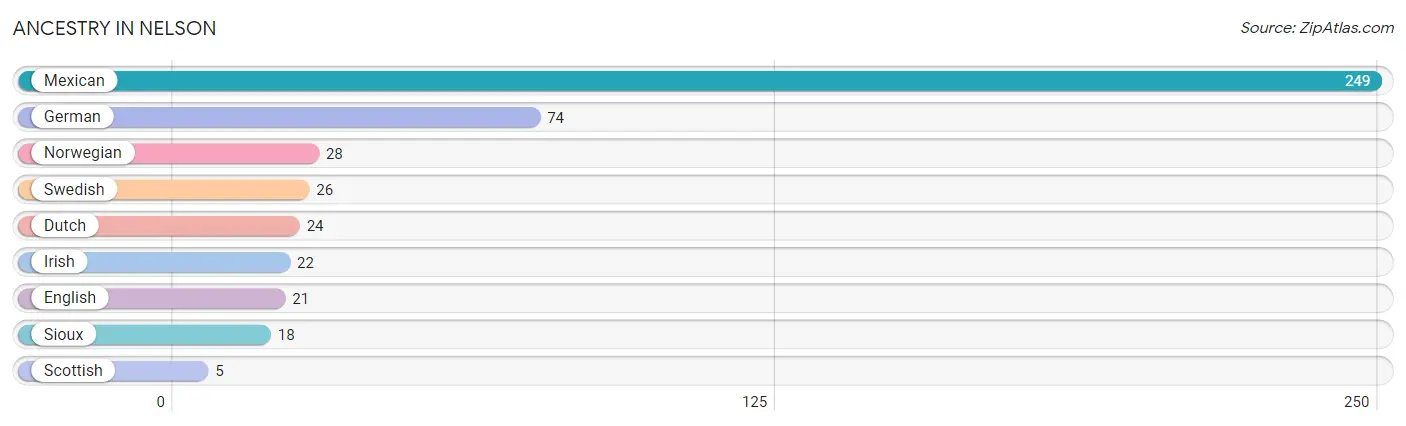
| Ancestry | # Population | % Population |
| Dutch | 24 | 6.2% |
| English | 21 | 5.4% |
| German | 74 | 19.1% |
| Irish | 22 | 5.7% |
| Mexican | 249 | 64.3% |
| Norwegian | 28 | 7.2% |
| Scottish | 5 | 1.3% |
| Sioux | 18 | 4.6% |
| Swedish | 26 | 6.7% | View All 9 Rows |
Immigrants in Nelson

| Immigration Origin | # Population | % Population | View All 0 Rows |
Sex and Age in Nelson
Sex and Age in Nelson
The most populous age groups in Nelson are Under 5 Years (64 | 24.8%) for men and 30 to 34 Years (53 | 41.1%) for women.
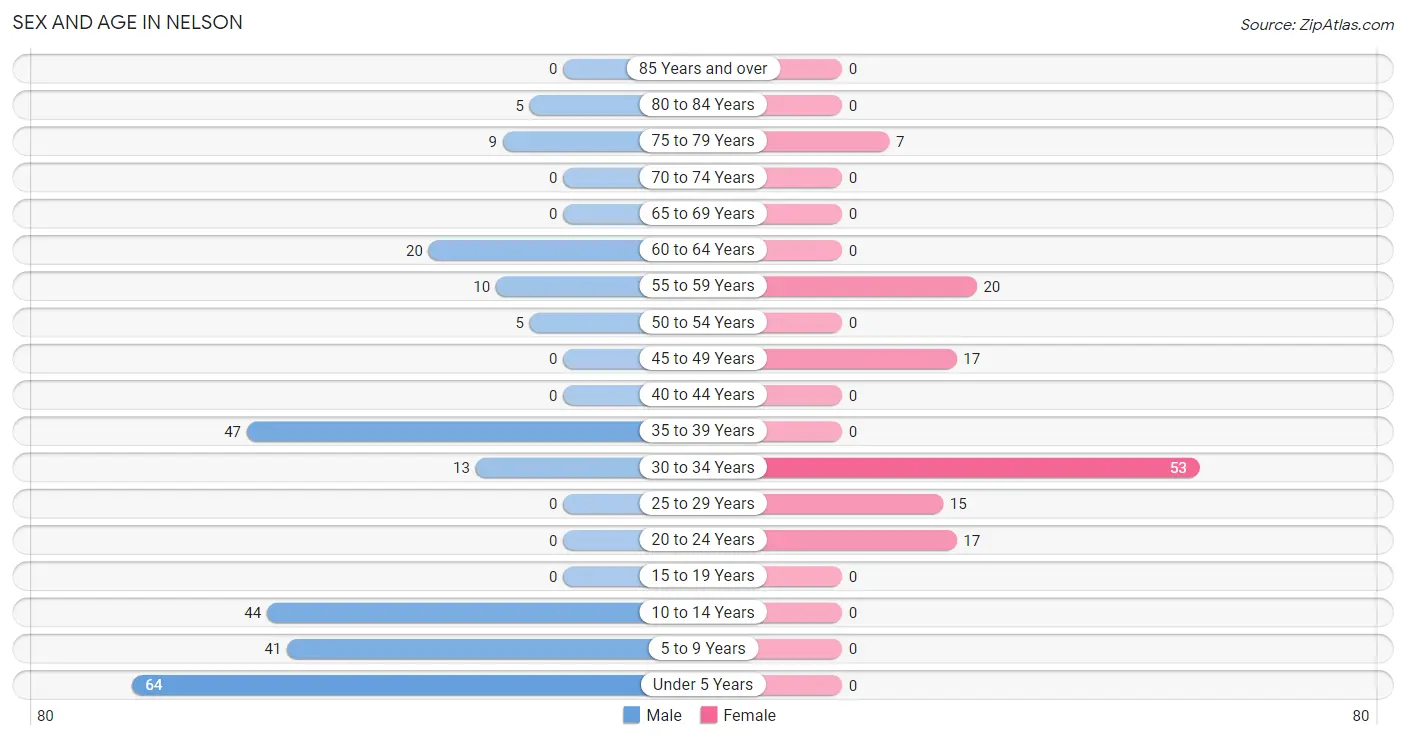
| Age Bracket | Male | Female |
| Under 5 Years | 64 (24.8%) | 0 (0.0%) |
| 5 to 9 Years | 41 (15.9%) | 0 (0.0%) |
| 10 to 14 Years | 44 (17.1%) | 0 (0.0%) |
| 15 to 19 Years | 0 (0.0%) | 0 (0.0%) |
| 20 to 24 Years | 0 (0.0%) | 17 (13.2%) |
| 25 to 29 Years | 0 (0.0%) | 15 (11.6%) |
| 30 to 34 Years | 13 (5.0%) | 53 (41.1%) |
| 35 to 39 Years | 47 (18.2%) | 0 (0.0%) |
| 40 to 44 Years | 0 (0.0%) | 0 (0.0%) |
| 45 to 49 Years | 0 (0.0%) | 17 (13.2%) |
| 50 to 54 Years | 5 (1.9%) | 0 (0.0%) |
| 55 to 59 Years | 10 (3.9%) | 20 (15.5%) |
| 60 to 64 Years | 20 (7.7%) | 0 (0.0%) |
| 65 to 69 Years | 0 (0.0%) | 0 (0.0%) |
| 70 to 74 Years | 0 (0.0%) | 0 (0.0%) |
| 75 to 79 Years | 9 (3.5%) | 7 (5.4%) |
| 80 to 84 Years | 5 (1.9%) | 0 (0.0%) |
| 85 Years and over | 0 (0.0%) | 0 (0.0%) |
| Total | 258 (100.0%) | 129 (100.0%) |
Families and Households in Nelson
Median Family Size in Nelson
The median family size in Nelson is 3.36 persons per family, with single male/father families (47 | 55.3%) accounting for the largest median family size of 4.17 persons per family. On the other hand, married-couple families (35 | 41.2%) represent the smallest median family size with 2.34 persons per family.
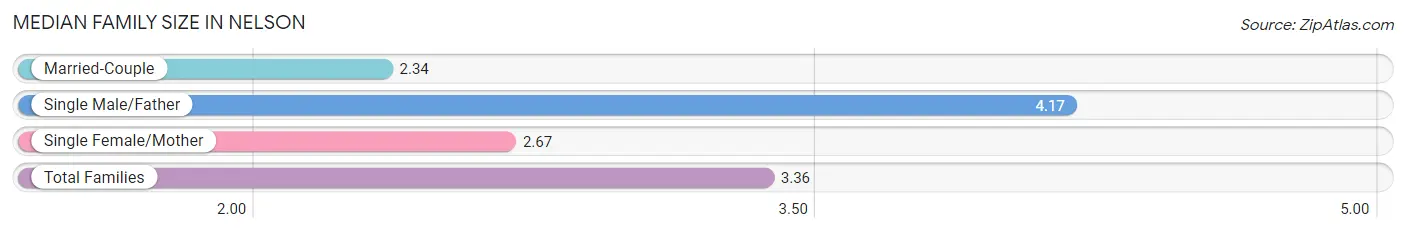
| Family Type | # Families | Family Size |
| Married-Couple | 35 (41.2%) | 2.34 |
| Single Male/Father | 47 (55.3%) | 4.17 |
| Single Female/Mother | 3 (3.5%) | 2.67 |
| Total Families | 85 (100.0%) | 3.36 |
Median Household Size in Nelson
The median household size in Nelson is 3.39 persons per household, with single male/father households (47 | 41.2%) accounting for the largest median household size of 5.3 persons per household. non-family households (29 | 25.4%) represent the smallest median household size with 1.45 persons per household.
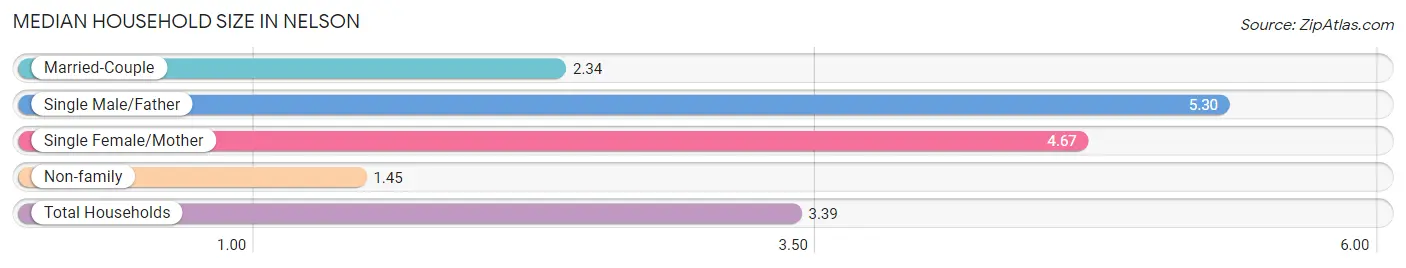
| Household Type | # Households | Household Size |
| Married-Couple | 35 (30.7%) | 2.34 |
| Single Male/Father | 47 (41.2%) | 5.30 |
| Single Female/Mother | 3 (2.6%) | 4.67 |
| Non-family | 29 (25.4%) | 1.45 |
| Total Households | 114 (100.0%) | 3.39 |
Household Size by Marriage Status in Nelson
Out of a total of 114 households in Nelson, 85 (74.6%) are family households, while 29 (25.4%) are nonfamily households. The most numerous type of family households are 6-person households, comprising 47, and the most common type of nonfamily households are 2-person households, comprising 15.
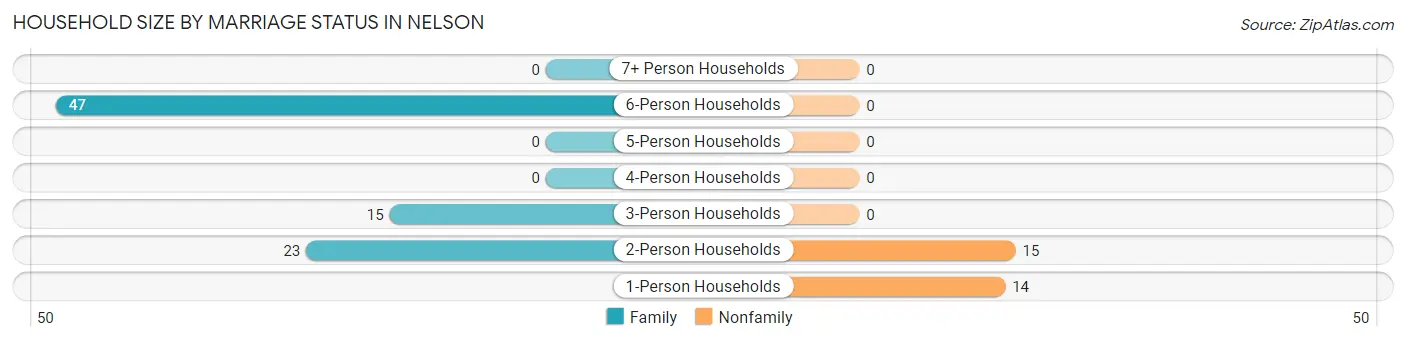
| Household Size | Family Households | Nonfamily Households |
| 1-Person Households | - | 14 (12.3%) |
| 2-Person Households | 23 (20.2%) | 15 (13.2%) |
| 3-Person Households | 15 (13.2%) | 0 (0.0%) |
| 4-Person Households | 0 (0.0%) | 0 (0.0%) |
| 5-Person Households | 0 (0.0%) | 0 (0.0%) |
| 6-Person Households | 47 (41.2%) | 0 (0.0%) |
| 7+ Person Households | 0 (0.0%) | 0 (0.0%) |
| Total | 85 (74.6%) | 29 (25.4%) |
Female Fertility in Nelson
Fertility by Age in Nelson
| Age Bracket | Women with Births | Births / 1,000 Women |
| 15 to 19 years | 0 (0.0%) | 0.0 |
| 20 to 34 years | 0 (0.0%) | 0.0 |
| 35 to 50 years | 0 (0.0%) | 0.0 |
| Total | 0 (0.0%) | 0.0 |
Fertility by Age by Marriage Status in Nelson
| Age Bracket | Married | Unmarried |
| 15 to 19 years | 0 (0.0%) | 0 (0.0%) |
| 20 to 34 years | 0 (0.0%) | 0 (0.0%) |
| 35 to 50 years | 0 (0.0%) | 0 (0.0%) |
| Total | 0 (0.0%) | 0 (0.0%) |
Fertility by Education in Nelson
| Educational Attainment | Women with Births | Births / 1,000 Women |
| Less than High School | 0 (0.0%) | 0.0 |
| High School Diploma | 0 (0.0%) | 0.0 |
| College or Associate's Degree | 0 (0.0%) | 0.0 |
| Bachelor's Degree | 0 (0.0%) | 0.0 |
| Graduate Degree | 0 (0.0%) | 0.0 |
| Total | 0 (0.0%) | 0.0 |
Fertility by Education by Marriage Status in Nelson
| Educational Attainment | Married | Unmarried |
| Less than High School | 0 (0.0%) | 0 (0.0%) |
| High School Diploma | 0 (0.0%) | 0 (0.0%) |
| College or Associate's Degree | 0 (0.0%) | 0 (0.0%) |
| Bachelor's Degree | 0 (0.0%) | 0 (0.0%) |
| Graduate Degree | 0 (0.0%) | 0 (0.0%) |
| Total | 0 (0.0%) | 0 (0.0%) |
Employment Characteristics in Nelson
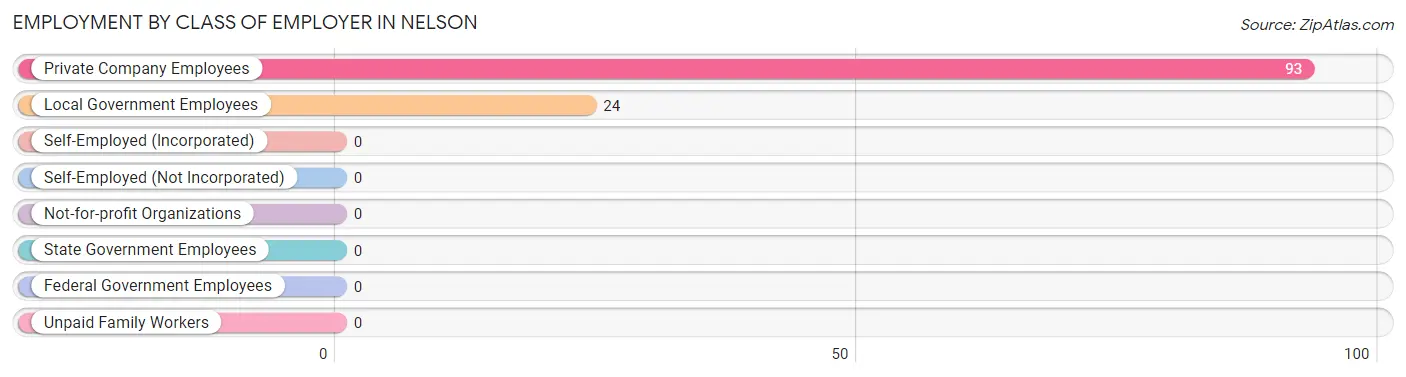
Employment by Class of Employer in Nelson
Among the 117 employed individuals in Nelson, private company employees (93 | 79.5%), and local government employees (24 | 20.5%) make up the most common classes of employment.
| Employer Class | # Employees | % Employees |
| Private Company Employees | 93 | 79.5% |
| Self-Employed (Incorporated) | 0 | 0.0% |
| Self-Employed (Not Incorporated) | 0 | 0.0% |
| Not-for-profit Organizations | 0 | 0.0% |
| Local Government Employees | 24 | 20.5% |
| State Government Employees | 0 | 0.0% |
| Federal Government Employees | 0 | 0.0% |
| Unpaid Family Workers | 0 | 0.0% |
| Total | 117 | 100.0% |
Employment Status by Age in Nelson
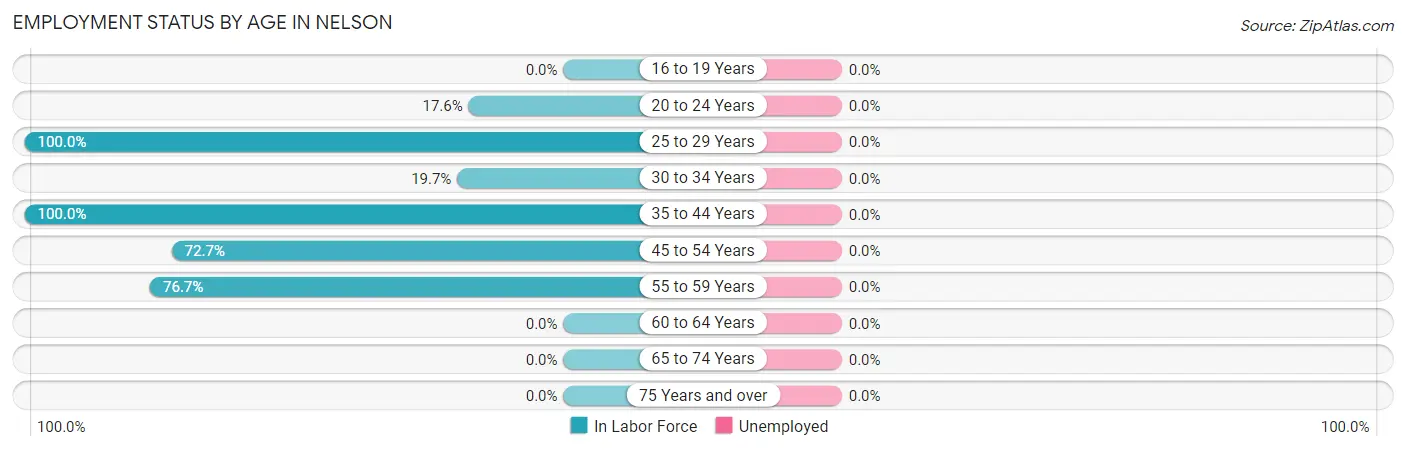
| Age Bracket | In Labor Force | Unemployed |
| 16 to 19 Years | 0 (0.0%) | 0 (0.0%) |
| 20 to 24 Years | 3 (17.6%) | 0 (0.0%) |
| 25 to 29 Years | 15 (100.0%) | 0 (0.0%) |
| 30 to 34 Years | 13 (19.7%) | 0 (0.0%) |
| 35 to 44 Years | 47 (100.0%) | 0 (0.0%) |
| 45 to 54 Years | 16 (72.7%) | 0 (0.0%) |
| 55 to 59 Years | 23 (76.7%) | 0 (0.0%) |
| 60 to 64 Years | 0 (0.0%) | 0 (0.0%) |
| 65 to 74 Years | 0 (0.0%) | 0 (0.0%) |
| 75 Years and over | 0 (0.0%) | 0 (0.0%) |
| Total | 117 (49.2%) | 0 (0.0%) |
Employment Status by Educational Attainment in Nelson
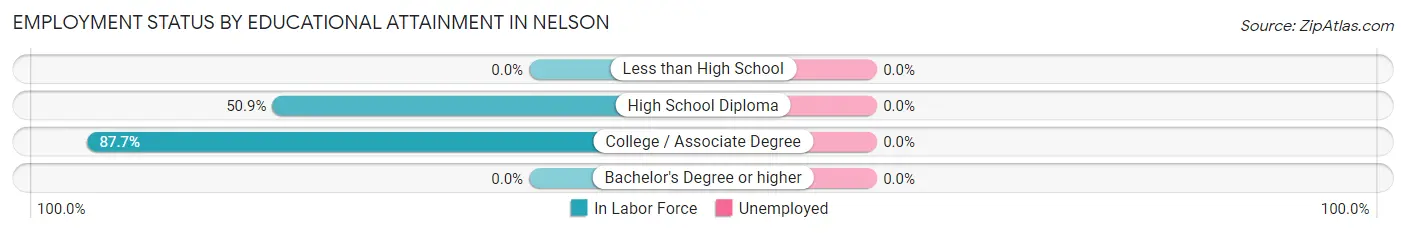
| Educational Attainment | In Labor Force | Unemployed |
| Less than High School | 0 (0.0%) | 0 (0.0%) |
| High School Diploma | 57 (50.9%) | 0 (0.0%) |
| College / Associate Degree | 57 (87.7%) | 0 (0.0%) |
| Bachelor's Degree or higher | 0 (0.0%) | 0 (0.0%) |
| Total | 114 (57.0%) | 0 (0.0%) |
Employment Occupations by Sex in Nelson
Management, Business, Science and Arts Occupations
The most common Management, Business, Science and Arts occupations in Nelson are Community & Social Service (24 | 20.5%), Education Instruction & Library (24 | 20.5%), and Management (15 | 12.8%).
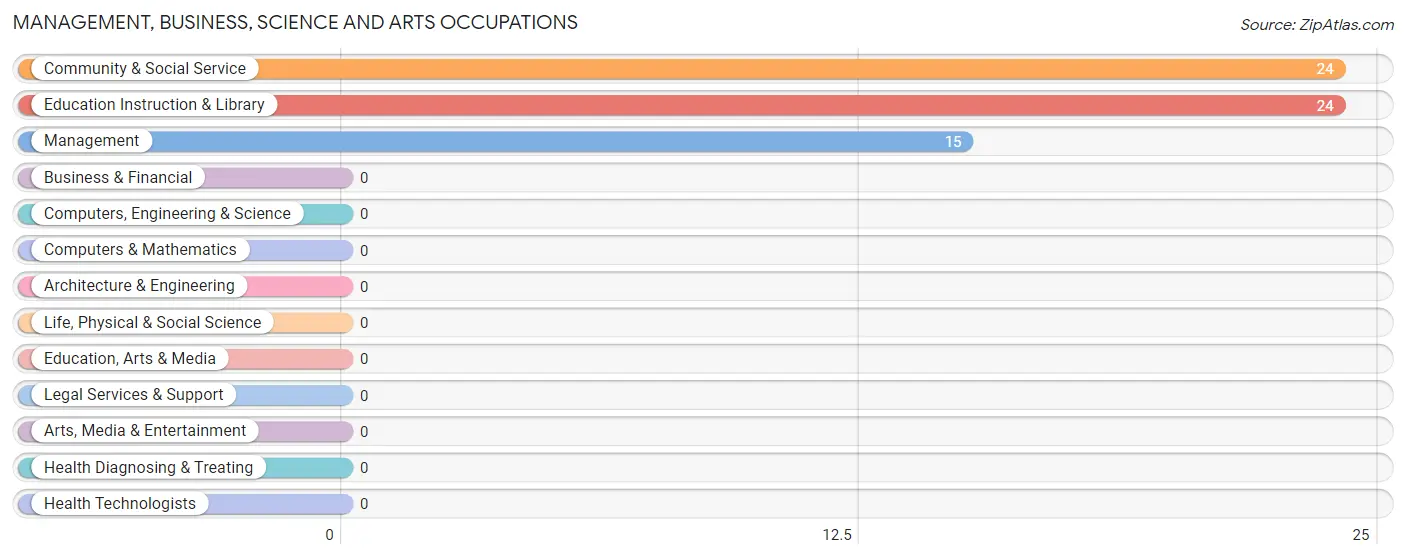
Management, Business, Science and Arts Occupations by Sex
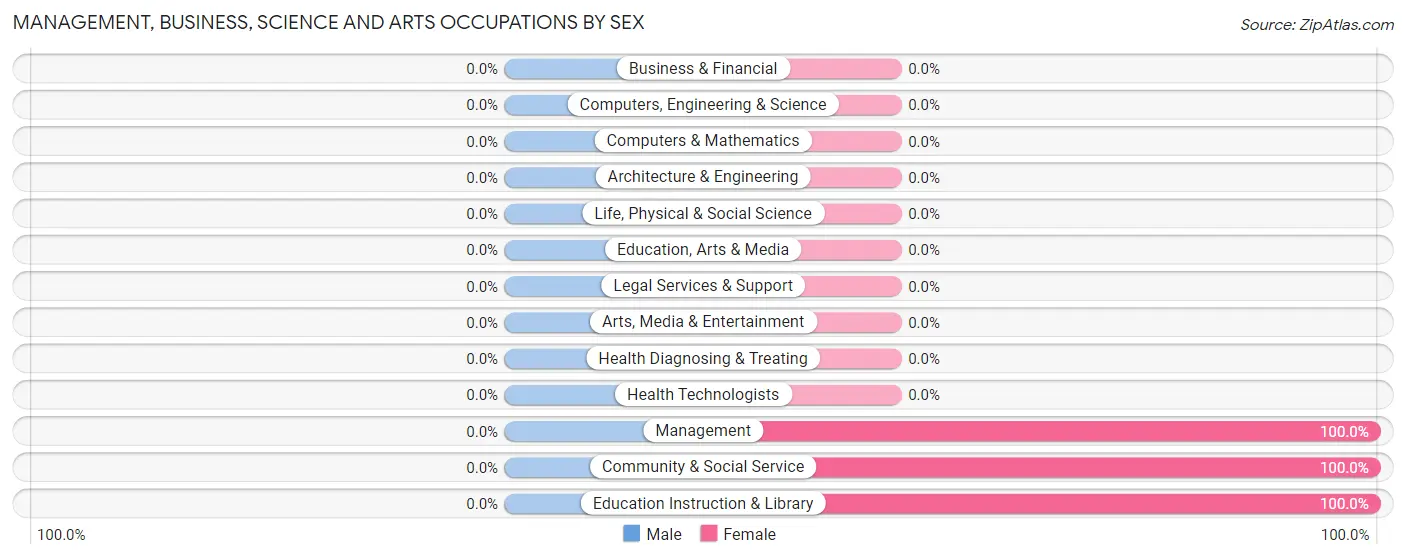
| Occupation | Male | Female |
| Management | 0 (0.0%) | 15 (100.0%) |
| Business & Financial | 0 (0.0%) | 0 (0.0%) |
| Computers, Engineering & Science | 0 (0.0%) | 0 (0.0%) |
| Computers & Mathematics | 0 (0.0%) | 0 (0.0%) |
| Architecture & Engineering | 0 (0.0%) | 0 (0.0%) |
| Life, Physical & Social Science | 0 (0.0%) | 0 (0.0%) |
| Community & Social Service | 0 (0.0%) | 24 (100.0%) |
| Education, Arts & Media | 0 (0.0%) | 0 (0.0%) |
| Legal Services & Support | 0 (0.0%) | 0 (0.0%) |
| Education Instruction & Library | 0 (0.0%) | 24 (100.0%) |
| Arts, Media & Entertainment | 0 (0.0%) | 0 (0.0%) |
| Health Diagnosing & Treating | 0 (0.0%) | 0 (0.0%) |
| Health Technologists | 0 (0.0%) | 0 (0.0%) |
| Total (Category) | 0 (0.0%) | 39 (100.0%) |
| Total (Overall) | 75 (64.1%) | 42 (35.9%) |
Services Occupations
Services Occupations by Sex
| Occupation | Male | Female |
| Healthcare Support | 0 (0.0%) | 0 (0.0%) |
| Security & Protection | 0 (0.0%) | 0 (0.0%) |
| Firefighting & Prevention | 0 (0.0%) | 0 (0.0%) |
| Law Enforcement | 0 (0.0%) | 0 (0.0%) |
| Food Preparation & Serving | 0 (0.0%) | 0 (0.0%) |
| Cleaning & Maintenance | 0 (0.0%) | 0 (0.0%) |
| Personal Care & Service | 0 (0.0%) | 0 (0.0%) |
| Total (Category) | 0 (0.0%) | 0 (0.0%) |
| Total (Overall) | 75 (64.1%) | 42 (35.9%) |
Sales and Office Occupations
Sales and Office Occupations by Sex
| Occupation | Male | Female |
| Sales & Related | 0 (0.0%) | 0 (0.0%) |
| Office & Administration | 0 (0.0%) | 0 (0.0%) |
| Total (Category) | 0 (0.0%) | 0 (0.0%) |
| Total (Overall) | 75 (64.1%) | 42 (35.9%) |
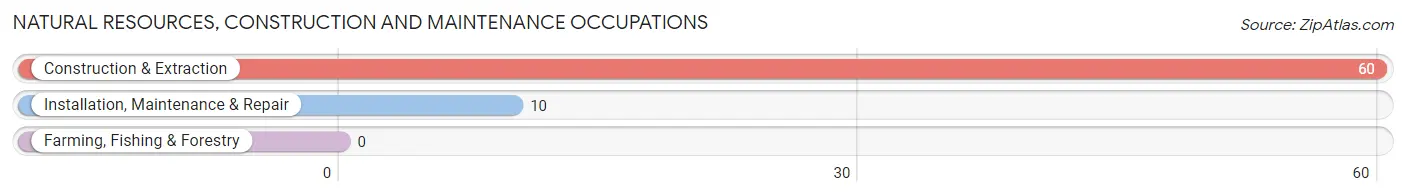
Natural Resources, Construction and Maintenance Occupations
The most common Natural Resources, Construction and Maintenance occupations in Nelson are Construction & Extraction (60 | 51.3%), and Installation, Maintenance & Repair (10 | 8.6%).
Natural Resources, Construction and Maintenance Occupations by Sex
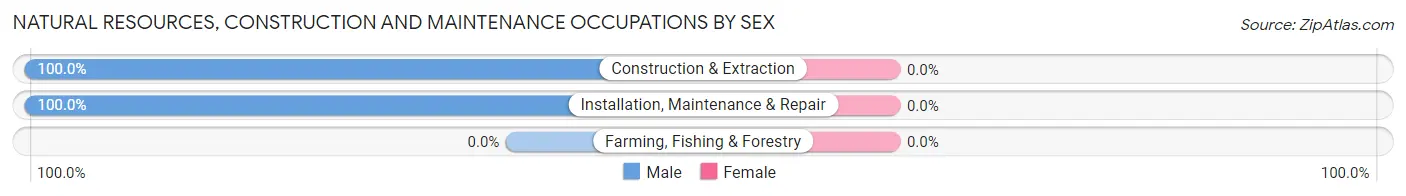
| Occupation | Male | Female |
| Farming, Fishing & Forestry | 0 (0.0%) | 0 (0.0%) |
| Construction & Extraction | 60 (100.0%) | 0 (0.0%) |
| Installation, Maintenance & Repair | 10 (100.0%) | 0 (0.0%) |
| Total (Category) | 70 (100.0%) | 0 (0.0%) |
| Total (Overall) | 75 (64.1%) | 42 (35.9%) |
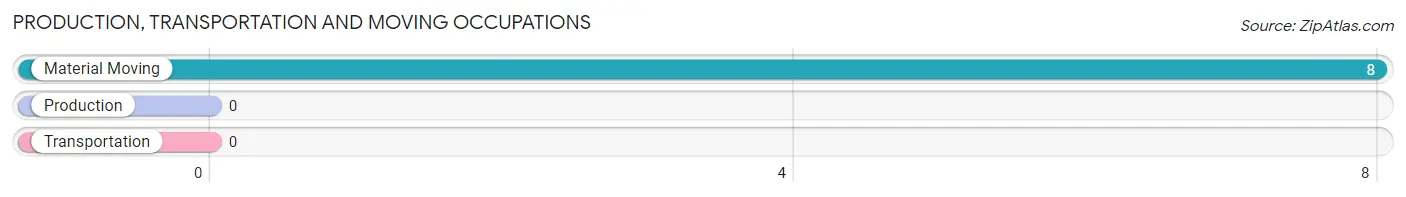
Production, Transportation and Moving Occupations
The most common Production, Transportation and Moving occupations in Nelson are , and Material Moving (8 | 6.8%).
Production, Transportation and Moving Occupations by Sex
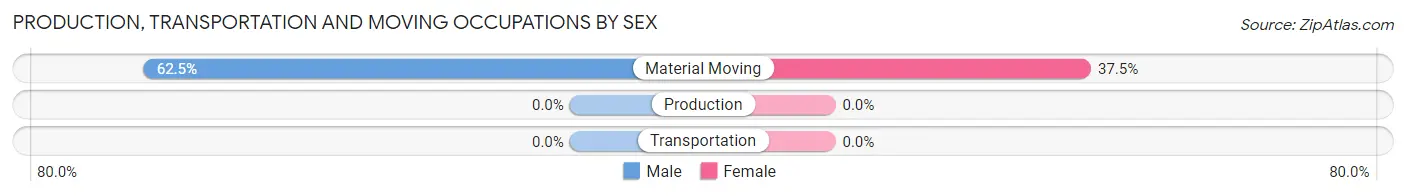
| Occupation | Male | Female |
| Production | 0 (0.0%) | 0 (0.0%) |
| Transportation | 0 (0.0%) | 0 (0.0%) |
| Material Moving | 5 (62.5%) | 3 (37.5%) |
| Total (Category) | 5 (62.5%) | 3 (37.5%) |
| Total (Overall) | 75 (64.1%) | 42 (35.9%) |
Employment Industries by Sex in Nelson
Employment Industries in Nelson
The major employment industries in Nelson include Construction (90 | 76.9%), Educational Services (24 | 20.5%), and Retail Trade (3 | 2.6%).
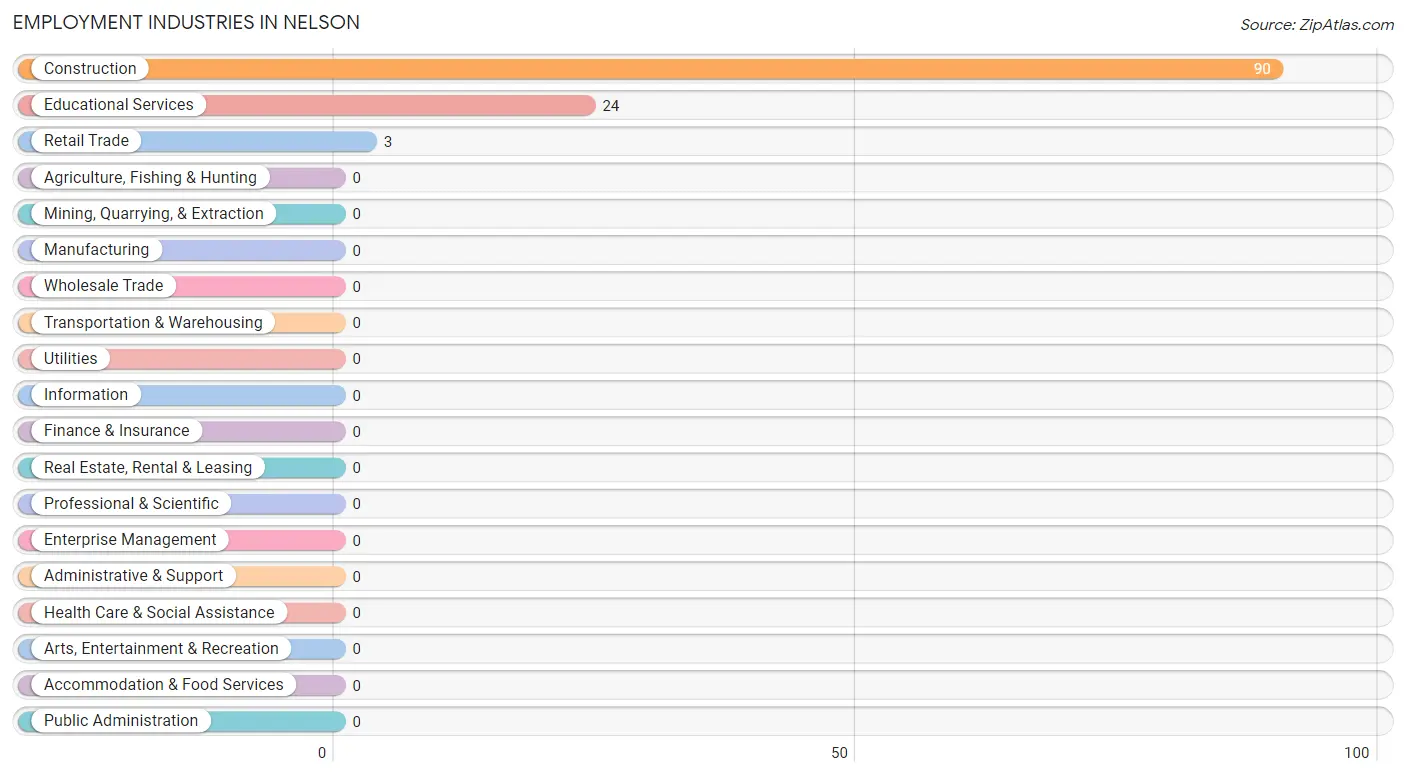
Employment Industries by Sex in Nelson
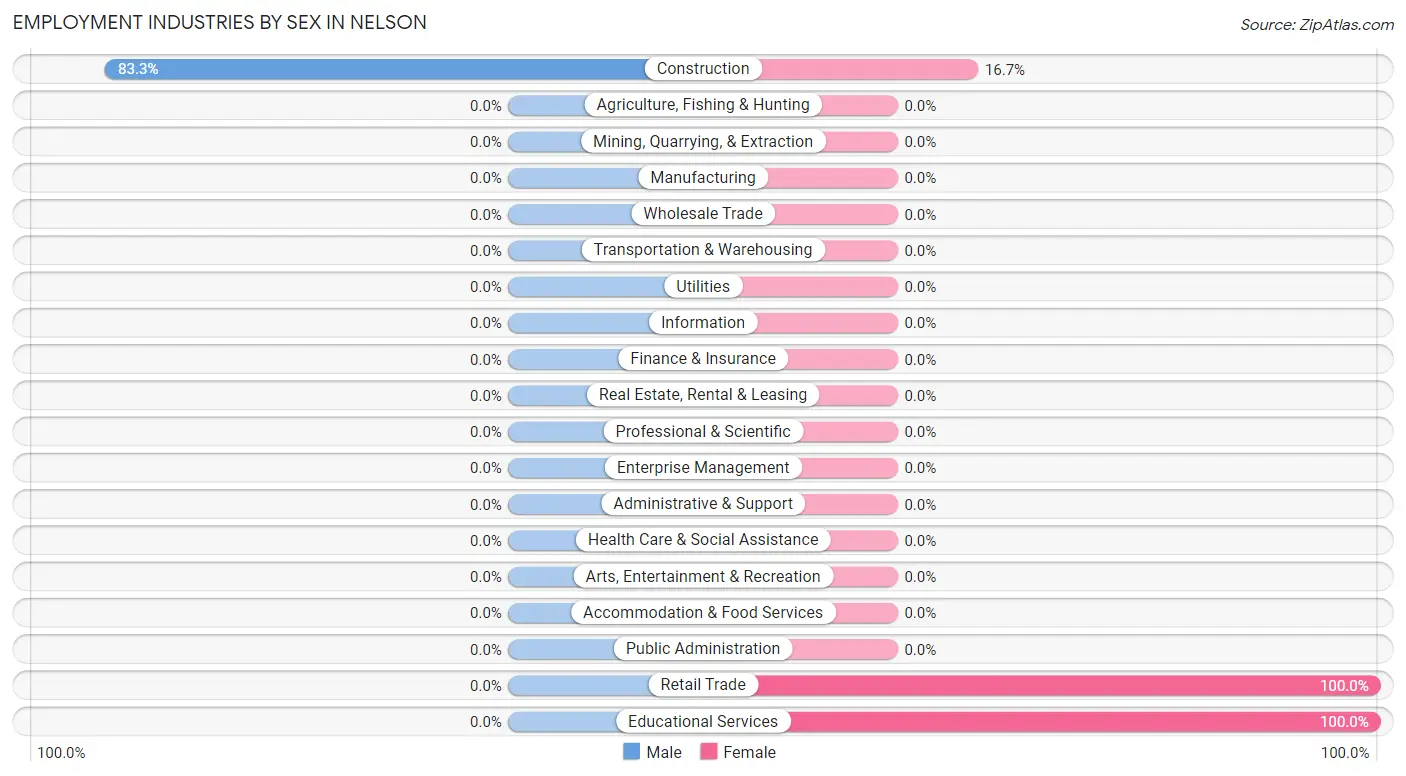
| Industry | Male | Female |
| Agriculture, Fishing & Hunting | 0 (0.0%) | 0 (0.0%) |
| Mining, Quarrying, & Extraction | 0 (0.0%) | 0 (0.0%) |
| Construction | 75 (83.3%) | 15 (16.7%) |
| Manufacturing | 0 (0.0%) | 0 (0.0%) |
| Wholesale Trade | 0 (0.0%) | 0 (0.0%) |
| Retail Trade | 0 (0.0%) | 3 (100.0%) |
| Transportation & Warehousing | 0 (0.0%) | 0 (0.0%) |
| Utilities | 0 (0.0%) | 0 (0.0%) |
| Information | 0 (0.0%) | 0 (0.0%) |
| Finance & Insurance | 0 (0.0%) | 0 (0.0%) |
| Real Estate, Rental & Leasing | 0 (0.0%) | 0 (0.0%) |
| Professional & Scientific | 0 (0.0%) | 0 (0.0%) |
| Enterprise Management | 0 (0.0%) | 0 (0.0%) |
| Administrative & Support | 0 (0.0%) | 0 (0.0%) |
| Educational Services | 0 (0.0%) | 24 (100.0%) |
| Health Care & Social Assistance | 0 (0.0%) | 0 (0.0%) |
| Arts, Entertainment & Recreation | 0 (0.0%) | 0 (0.0%) |
| Accommodation & Food Services | 0 (0.0%) | 0 (0.0%) |
| Public Administration | 0 (0.0%) | 0 (0.0%) |
| Total | 75 (64.1%) | 42 (35.9%) |
Education in Nelson
School Enrollment in Nelson
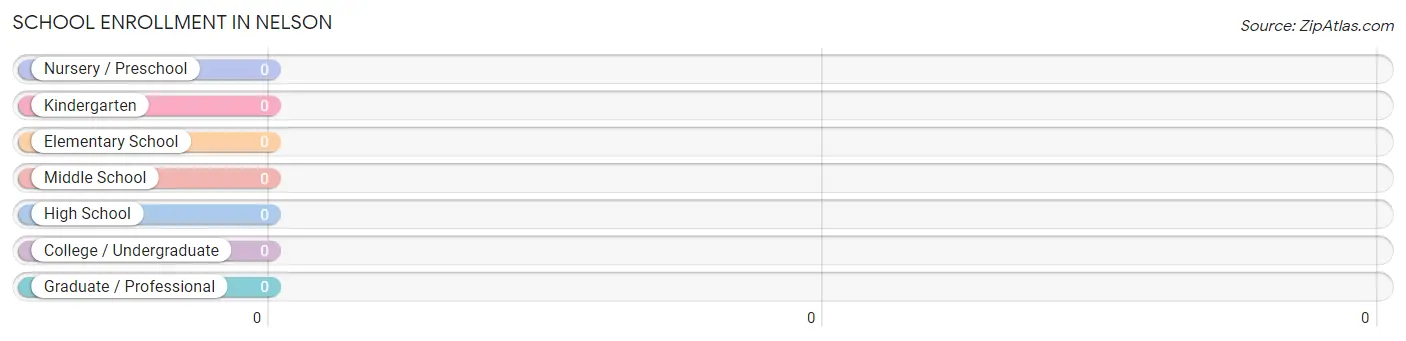
| School Level | # Students | % Students |
| Nursery / Preschool | 0 | 0.0% |
| Kindergarten | 0 | 0.0% |
| Elementary School | 0 | 0.0% |
| Middle School | 0 | 0.0% |
| High School | 0 | 0.0% |
| College / Undergraduate | 0 | 0.0% |
| Graduate / Professional | 0 | 0.0% |
| Total | 0 | 0.0% |
School Enrollment by Age by Funding Source in Nelson
| Age Bracket | Public School | Private School |
| 3 to 4 Year Olds | 0 (0.0%) | 0 (0.0%) |
| 5 to 9 Year Old | 0 (0.0%) | 0 (0.0%) |
| 10 to 14 Year Olds | 0 (0.0%) | 0 (0.0%) |
| 15 to 17 Year Olds | 0 (0.0%) | 0 (0.0%) |
| 18 to 19 Year Olds | 0 (0.0%) | 0 (0.0%) |
| 20 to 24 Year Olds | 0 (0.0%) | 0 (0.0%) |
| 25 to 34 Year Olds | 0 (0.0%) | 0 (0.0%) |
| 35 Years and over | 0 (0.0%) | 0 (0.0%) |
| Total | 0 (0.0%) | 0 (0.0%) |
Educational Attainment by Field of Study in Nelson
, and social sciences (5 | 100.0%) are the most common fields of study among 5 individuals in Nelson who have obtained a bachelor's degree or higher.
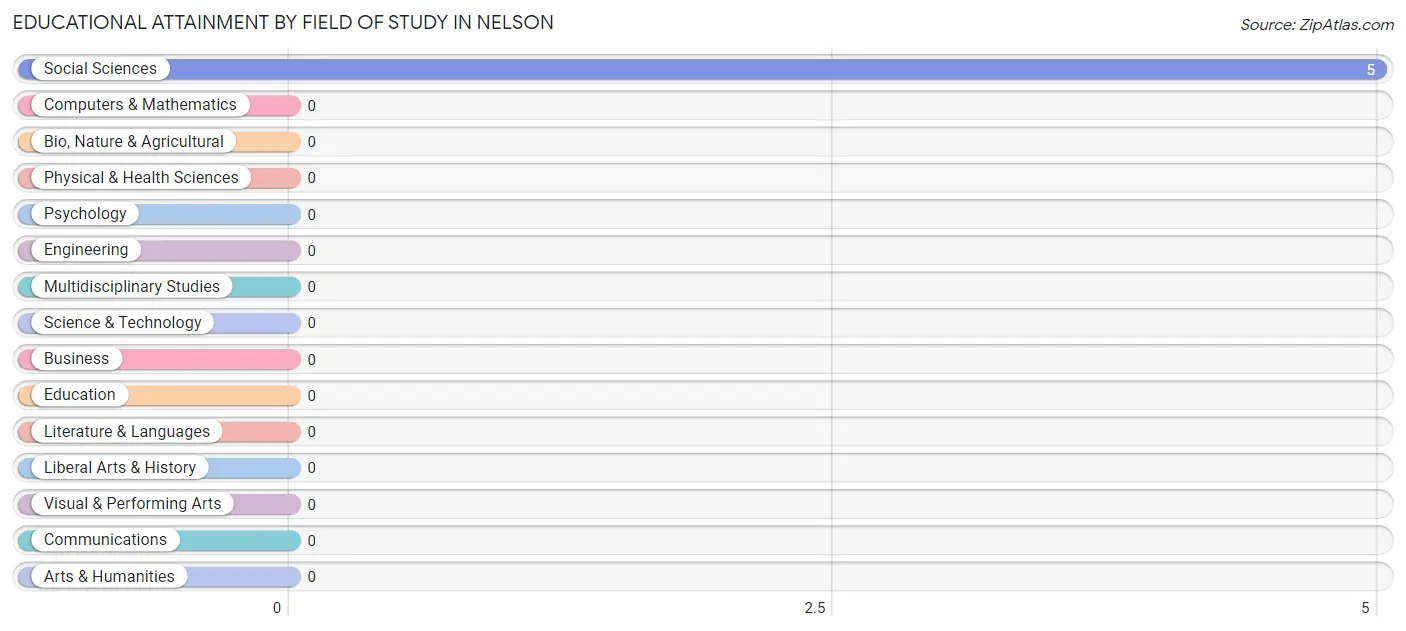
| Field of Study | # Graduates | % Graduates |
| Computers & Mathematics | 0 | 0.0% |
| Bio, Nature & Agricultural | 0 | 0.0% |
| Physical & Health Sciences | 0 | 0.0% |
| Psychology | 0 | 0.0% |
| Social Sciences | 5 | 100.0% |
| Engineering | 0 | 0.0% |
| Multidisciplinary Studies | 0 | 0.0% |
| Science & Technology | 0 | 0.0% |
| Business | 0 | 0.0% |
| Education | 0 | 0.0% |
| Literature & Languages | 0 | 0.0% |
| Liberal Arts & History | 0 | 0.0% |
| Visual & Performing Arts | 0 | 0.0% |
| Communications | 0 | 0.0% |
| Arts & Humanities | 0 | 0.0% |
| Total | 5 | 100.0% |
Transportation & Commute in Nelson
Vehicle Availability by Sex in Nelson
The most prevalent vehicle ownership categories in Nelson are males with 1 vehicle (47, accounting for 62.7%) and females with 1 vehicle (0, making up 111.9%).
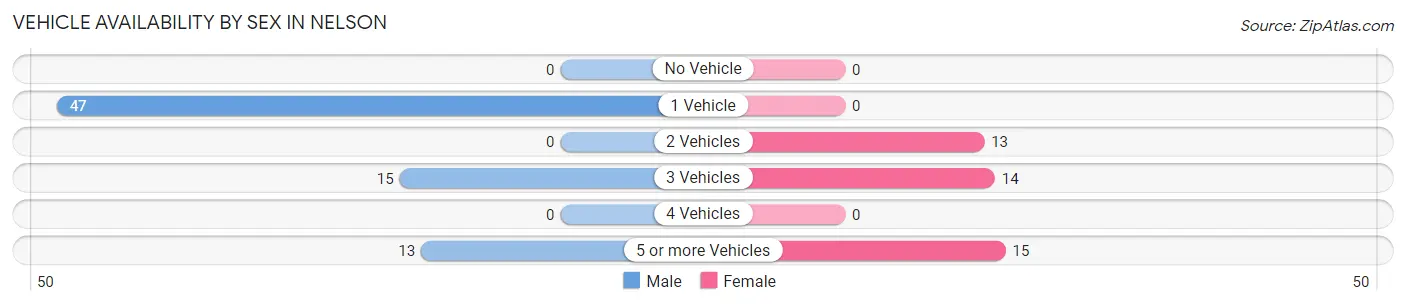
| Vehicles Available | Male | Female |
| No Vehicle | 0 (0.0%) | 0 (0.0%) |
| 1 Vehicle | 47 (62.7%) | 0 (0.0%) |
| 2 Vehicles | 0 (0.0%) | 13 (30.9%) |
| 3 Vehicles | 15 (20.0%) | 14 (33.3%) |
| 4 Vehicles | 0 (0.0%) | 0 (0.0%) |
| 5 or more Vehicles | 13 (17.3%) | 15 (35.7%) |
| Total | 75 (100.0%) | 42 (100.0%) |
Commute Time in Nelson
The most frequently occuring commute durations in Nelson are 45 to 59 minutes (52 commuters, 44.4%), 35 to 39 minutes (28 commuters, 23.9%), and 10 to 14 minutes (13 commuters, 11.1%).
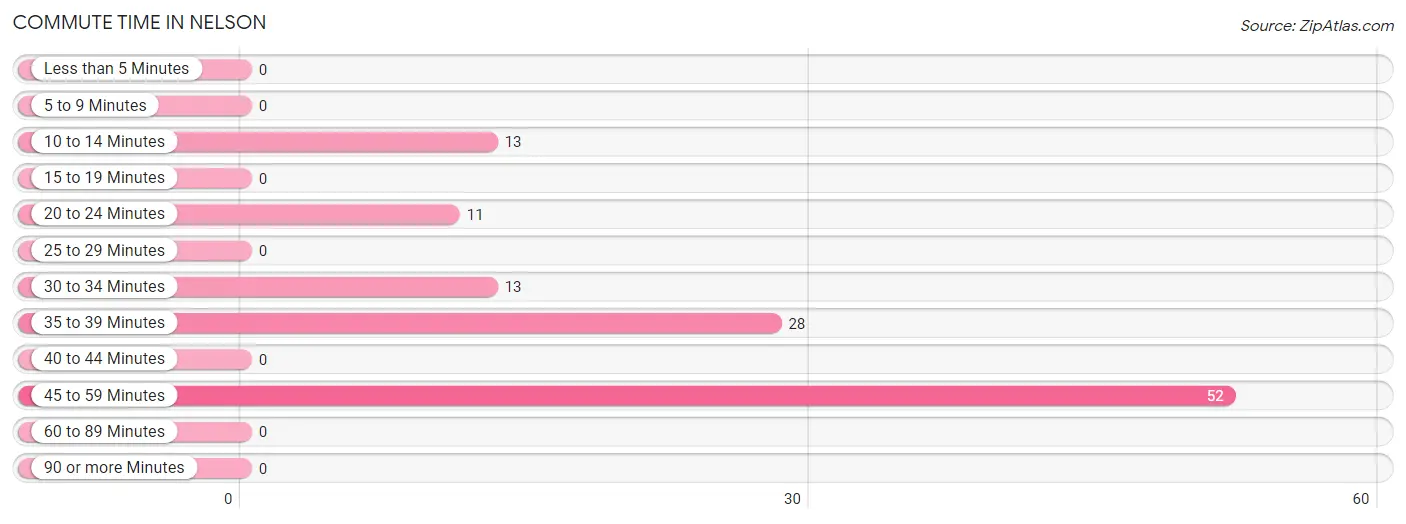
| Commute Time | # Commuters | % Commuters |
| Less than 5 Minutes | 0 | 0.0% |
| 5 to 9 Minutes | 0 | 0.0% |
| 10 to 14 Minutes | 13 | 11.1% |
| 15 to 19 Minutes | 0 | 0.0% |
| 20 to 24 Minutes | 11 | 9.4% |
| 25 to 29 Minutes | 0 | 0.0% |
| 30 to 34 Minutes | 13 | 11.1% |
| 35 to 39 Minutes | 28 | 23.9% |
| 40 to 44 Minutes | 0 | 0.0% |
| 45 to 59 Minutes | 52 | 44.4% |
| 60 to 89 Minutes | 0 | 0.0% |
| 90 or more Minutes | 0 | 0.0% |
Commute Time by Sex in Nelson
The most common commute times in Nelson are 45 to 59 minutes (52 commuters, 69.3%) for males and 35 to 39 minutes (18 commuters, 42.9%) for females.
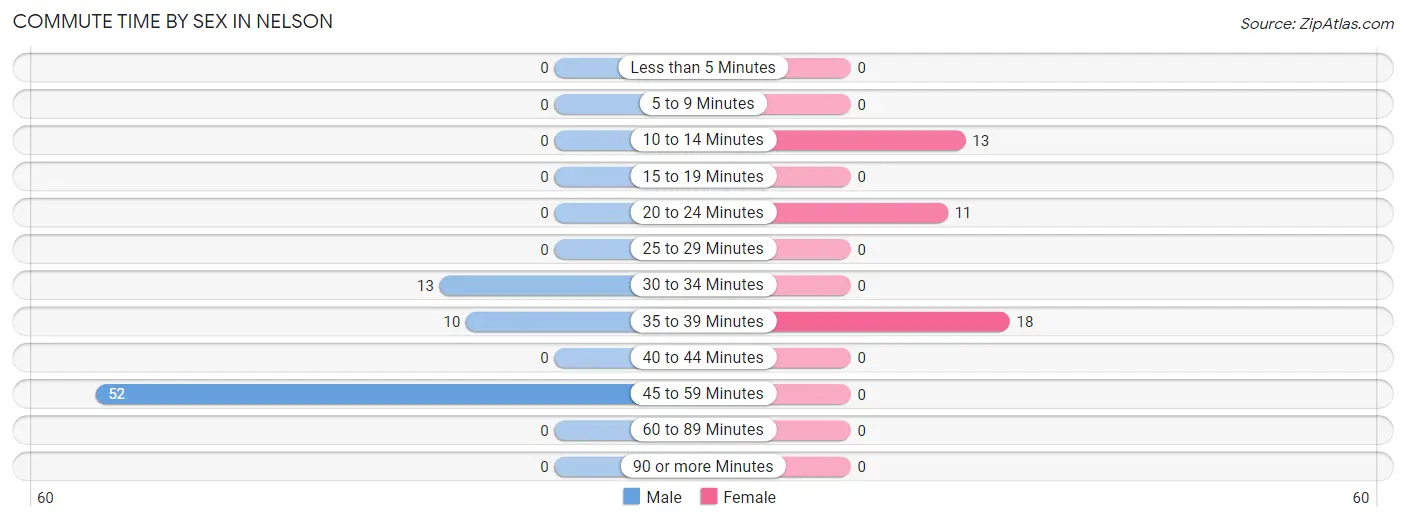
| Commute Time | Male | Female |
| Less than 5 Minutes | 0 (0.0%) | 0 (0.0%) |
| 5 to 9 Minutes | 0 (0.0%) | 0 (0.0%) |
| 10 to 14 Minutes | 0 (0.0%) | 13 (30.9%) |
| 15 to 19 Minutes | 0 (0.0%) | 0 (0.0%) |
| 20 to 24 Minutes | 0 (0.0%) | 11 (26.2%) |
| 25 to 29 Minutes | 0 (0.0%) | 0 (0.0%) |
| 30 to 34 Minutes | 13 (17.3%) | 0 (0.0%) |
| 35 to 39 Minutes | 10 (13.3%) | 18 (42.9%) |
| 40 to 44 Minutes | 0 (0.0%) | 0 (0.0%) |
| 45 to 59 Minutes | 52 (69.3%) | 0 (0.0%) |
| 60 to 89 Minutes | 0 (0.0%) | 0 (0.0%) |
| 90 or more Minutes | 0 (0.0%) | 0 (0.0%) |
Time of Departure to Work by Sex in Nelson
The most frequent times of departure to work in Nelson are 12:00 AM to 4:59 AM (60, 80.0%) for males and 7:30 AM to 7:59 AM (18, 42.9%) for females.
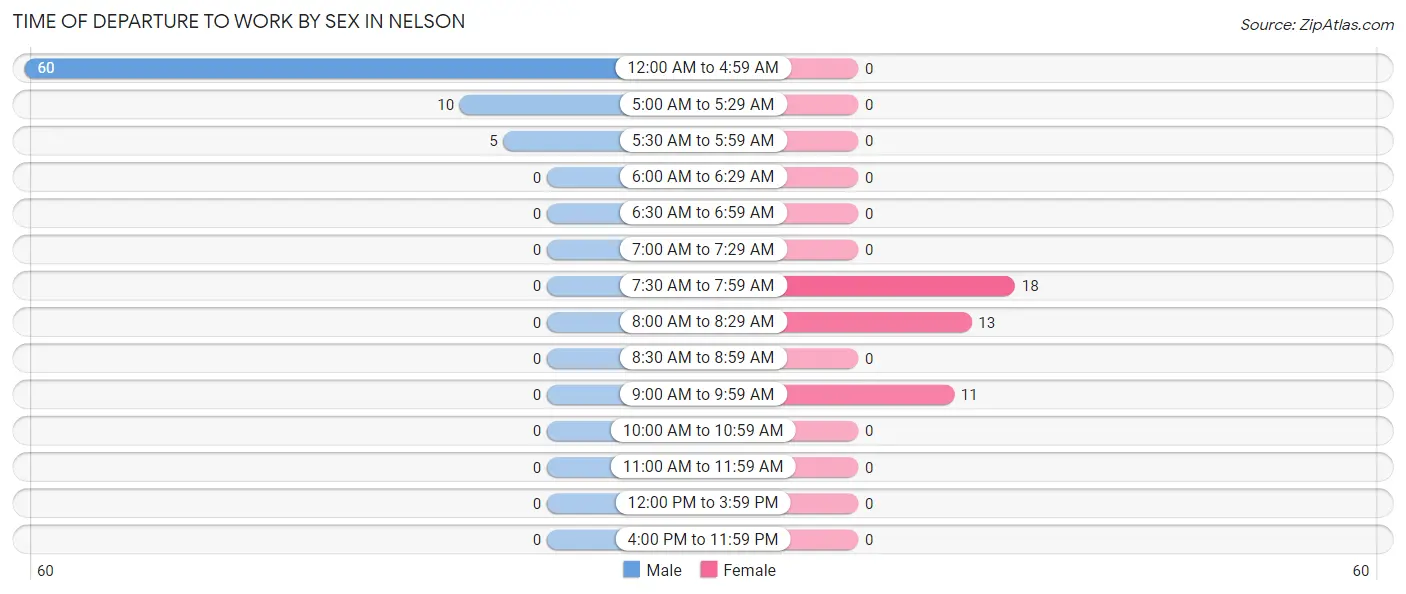
| Time of Departure | Male | Female |
| 12:00 AM to 4:59 AM | 60 (80.0%) | 0 (0.0%) |
| 5:00 AM to 5:29 AM | 10 (13.3%) | 0 (0.0%) |
| 5:30 AM to 5:59 AM | 5 (6.7%) | 0 (0.0%) |
| 6:00 AM to 6:29 AM | 0 (0.0%) | 0 (0.0%) |
| 6:30 AM to 6:59 AM | 0 (0.0%) | 0 (0.0%) |
| 7:00 AM to 7:29 AM | 0 (0.0%) | 0 (0.0%) |
| 7:30 AM to 7:59 AM | 0 (0.0%) | 18 (42.9%) |
| 8:00 AM to 8:29 AM | 0 (0.0%) | 13 (30.9%) |
| 8:30 AM to 8:59 AM | 0 (0.0%) | 0 (0.0%) |
| 9:00 AM to 9:59 AM | 0 (0.0%) | 11 (26.2%) |
| 10:00 AM to 10:59 AM | 0 (0.0%) | 0 (0.0%) |
| 11:00 AM to 11:59 AM | 0 (0.0%) | 0 (0.0%) |
| 12:00 PM to 3:59 PM | 0 (0.0%) | 0 (0.0%) |
| 4:00 PM to 11:59 PM | 0 (0.0%) | 0 (0.0%) |
| Total | 75 (100.0%) | 42 (100.0%) |
Housing Occupancy in Nelson
Occupancy by Ownership in Nelson
Of the total 114 dwellings in Nelson, owner-occupied units account for 99 (86.8%), while renter-occupied units make up 15 (13.2%).
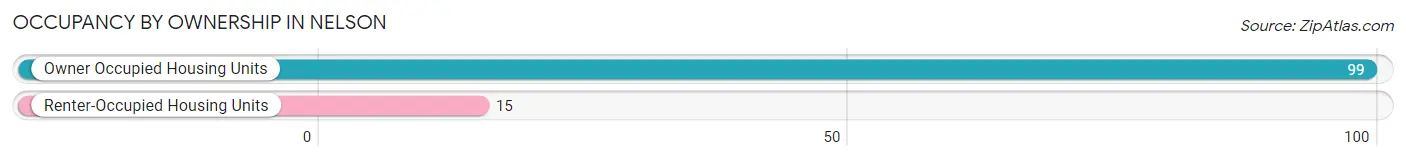
| Occupancy | # Housing Units | % Housing Units |
| Owner Occupied Housing Units | 99 | 86.8% |
| Renter-Occupied Housing Units | 15 | 13.2% |
| Total Occupied Housing Units | 114 | 100.0% |
Occupancy by Household Size in Nelson
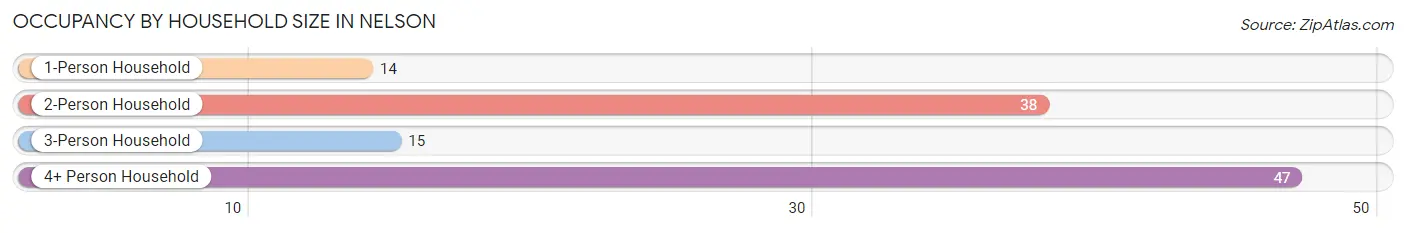
| Household Size | # Housing Units | % Housing Units |
| 1-Person Household | 14 | 12.3% |
| 2-Person Household | 38 | 33.3% |
| 3-Person Household | 15 | 13.2% |
| 4+ Person Household | 47 | 41.2% |
| Total Housing Units | 114 | 100.0% |
Occupancy by Ownership by Household Size in Nelson
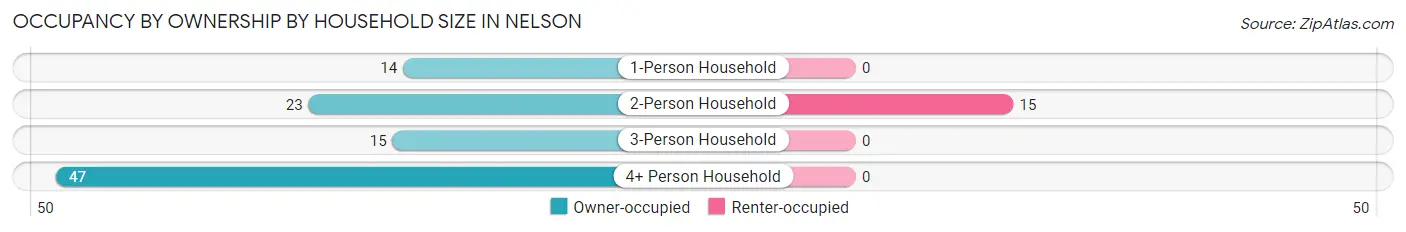
| Household Size | Owner-occupied | Renter-occupied |
| 1-Person Household | 14 (100.0%) | 0 (0.0%) |
| 2-Person Household | 23 (60.5%) | 15 (39.5%) |
| 3-Person Household | 15 (100.0%) | 0 (0.0%) |
| 4+ Person Household | 47 (100.0%) | 0 (0.0%) |
| Total Housing Units | 99 (86.8%) | 15 (13.2%) |
Occupancy by Educational Attainment in Nelson
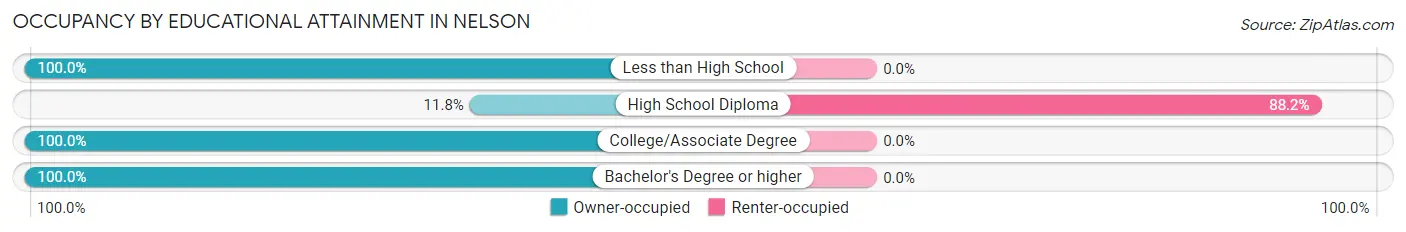
| Household Size | Owner-occupied | Renter-occupied |
| Less than High School | 18 (100.0%) | 0 (0.0%) |
| High School Diploma | 2 (11.8%) | 15 (88.2%) |
| College/Associate Degree | 74 (100.0%) | 0 (0.0%) |
| Bachelor's Degree or higher | 5 (100.0%) | 0 (0.0%) |
Occupancy by Age of Householder in Nelson
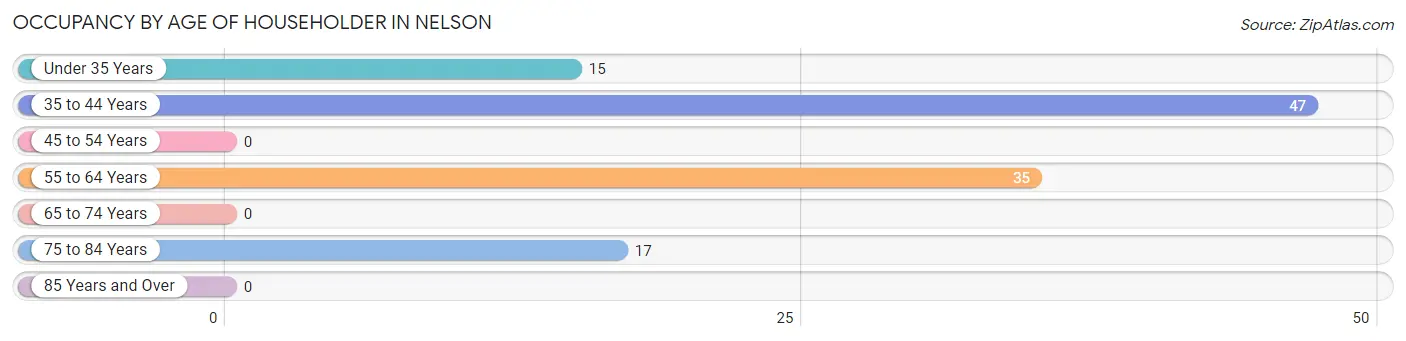
| Age Bracket | # Households | % Households |
| Under 35 Years | 15 | 13.2% |
| 35 to 44 Years | 47 | 41.2% |
| 45 to 54 Years | 0 | 0.0% |
| 55 to 64 Years | 35 | 30.7% |
| 65 to 74 Years | 0 | 0.0% |
| 75 to 84 Years | 17 | 14.9% |
| 85 Years and Over | 0 | 0.0% |
| Total | 114 | 100.0% |
Housing Finances in Nelson
Median Income by Occupancy in Nelson
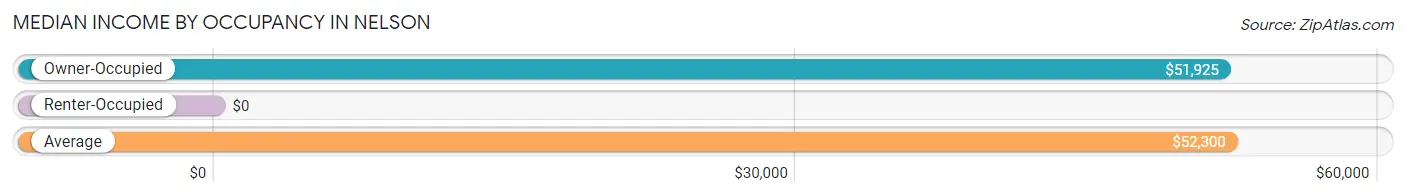
| Occupancy Type | # Households | Median Income |
| Owner-Occupied | 99 (86.8%) | $51,925 |
| Renter-Occupied | 15 (13.2%) | $0 |
| Average | 114 (100.0%) | $52,300 |
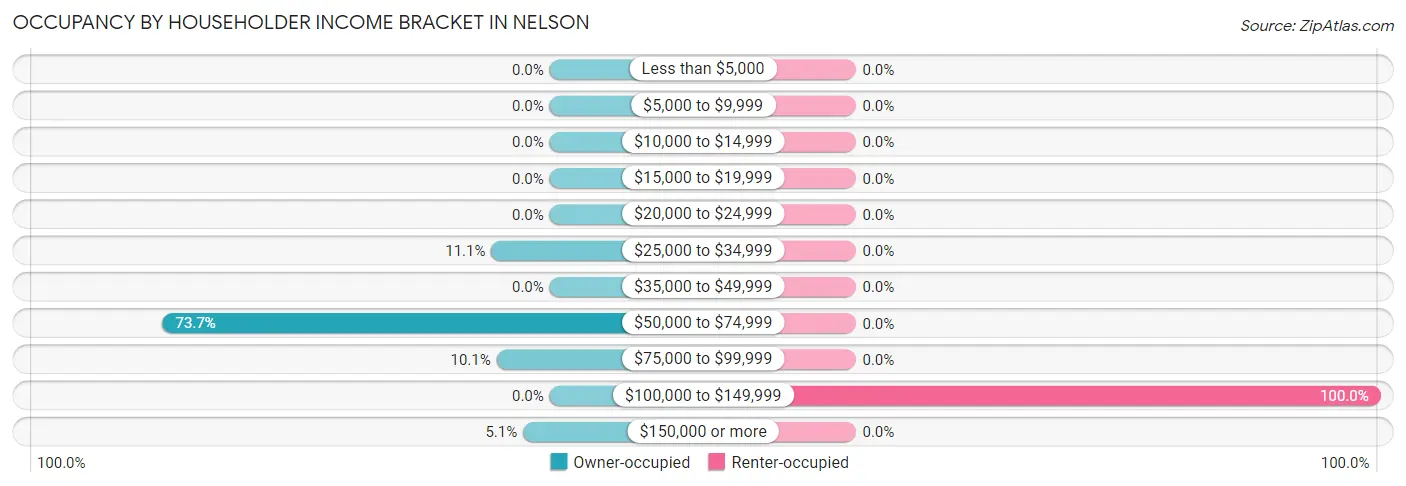
Occupancy by Householder Income Bracket in Nelson
| Income Bracket | Owner-occupied | Renter-occupied |
| Less than $5,000 | 0 (0.0%) | 0 (0.0%) |
| $5,000 to $9,999 | 0 (0.0%) | 0 (0.0%) |
| $10,000 to $14,999 | 0 (0.0%) | 0 (0.0%) |
| $15,000 to $19,999 | 0 (0.0%) | 0 (0.0%) |
| $20,000 to $24,999 | 0 (0.0%) | 0 (0.0%) |
| $25,000 to $34,999 | 11 (11.1%) | 0 (0.0%) |
| $35,000 to $49,999 | 0 (0.0%) | 0 (0.0%) |
| $50,000 to $74,999 | 73 (73.7%) | 0 (0.0%) |
| $75,000 to $99,999 | 10 (10.1%) | 0 (0.0%) |
| $100,000 to $149,999 | 0 (0.0%) | 15 (100.0%) |
| $150,000 or more | 5 (5.1%) | 0 (0.0%) |
| Total | 99 (100.0%) | 15 (100.0%) |
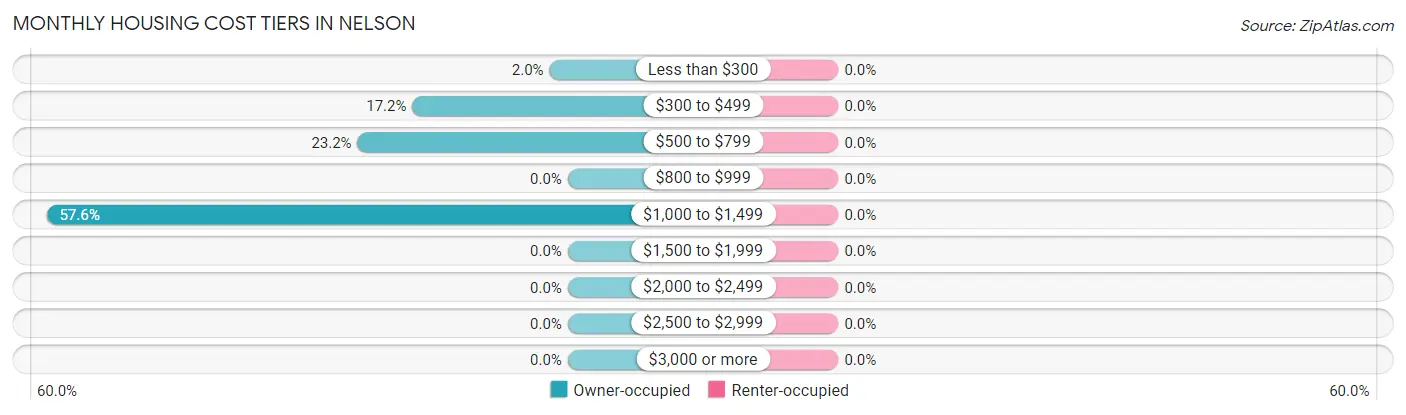
Monthly Housing Cost Tiers in Nelson
| Monthly Cost | Owner-occupied | Renter-occupied |
| Less than $300 | 2 (2.0%) | 0 (0.0%) |
| $300 to $499 | 17 (17.2%) | 0 (0.0%) |
| $500 to $799 | 23 (23.2%) | 0 (0.0%) |
| $800 to $999 | 0 (0.0%) | 0 (0.0%) |
| $1,000 to $1,499 | 57 (57.6%) | 0 (0.0%) |
| $1,500 to $1,999 | 0 (0.0%) | 0 (0.0%) |
| $2,000 to $2,499 | 0 (0.0%) | 0 (0.0%) |
| $2,500 to $2,999 | 0 (0.0%) | 0 (0.0%) |
| $3,000 or more | 0 (0.0%) | 0 (0.0%) |
| Total | 99 (100.0%) | 15 (100.0%) |
Physical Housing Characteristics in Nelson
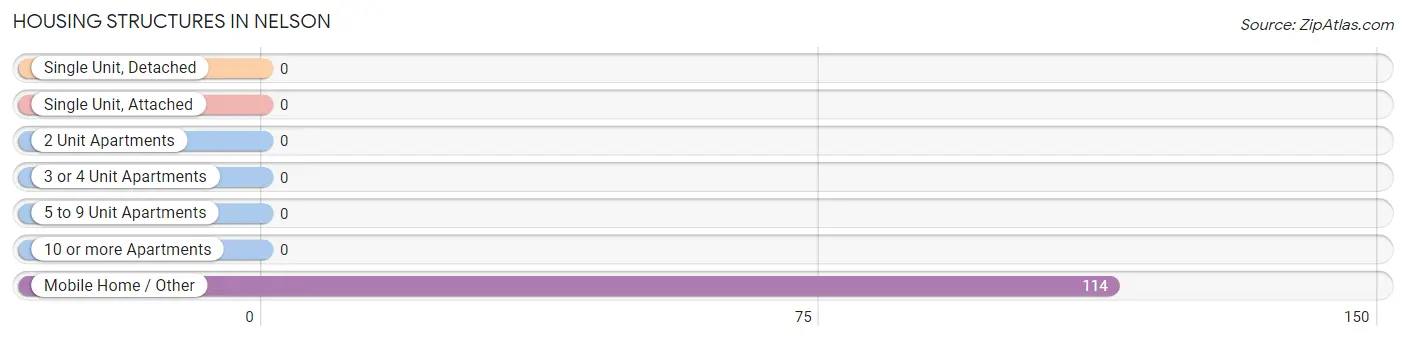
Housing Structures in Nelson
| Structure Type | # Housing Units | % Housing Units |
| Single Unit, Detached | 0 | 0.0% |
| Single Unit, Attached | 0 | 0.0% |
| 2 Unit Apartments | 0 | 0.0% |
| 3 or 4 Unit Apartments | 0 | 0.0% |
| 5 to 9 Unit Apartments | 0 | 0.0% |
| 10 or more Apartments | 0 | 0.0% |
| Mobile Home / Other | 114 | 100.0% |
| Total | 114 | 100.0% |
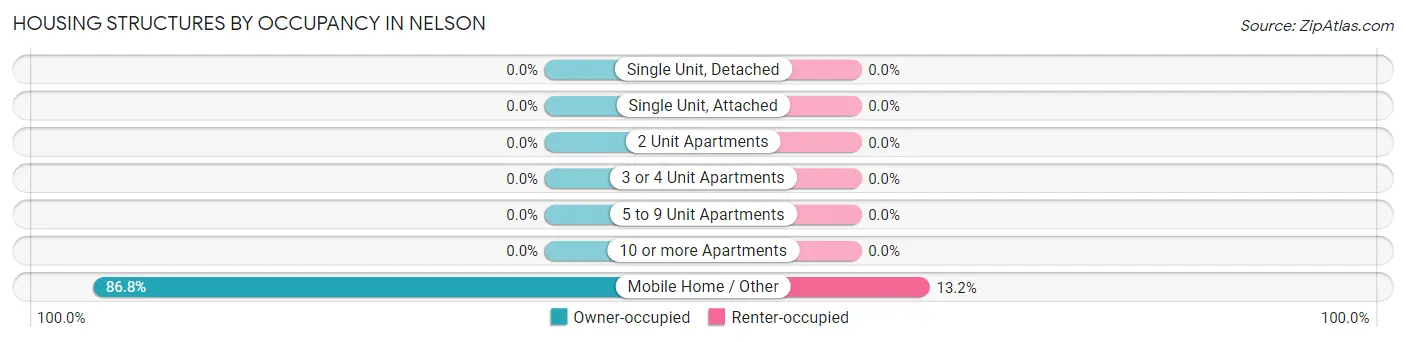
Housing Structures by Occupancy in Nelson
| Structure Type | Owner-occupied | Renter-occupied |
| Single Unit, Detached | 0 (0.0%) | 0 (0.0%) |
| Single Unit, Attached | 0 (0.0%) | 0 (0.0%) |
| 2 Unit Apartments | 0 (0.0%) | 0 (0.0%) |
| 3 or 4 Unit Apartments | 0 (0.0%) | 0 (0.0%) |
| 5 to 9 Unit Apartments | 0 (0.0%) | 0 (0.0%) |
| 10 or more Apartments | 0 (0.0%) | 0 (0.0%) |
| Mobile Home / Other | 99 (86.8%) | 15 (13.2%) |
| Total | 99 (86.8%) | 15 (13.2%) |
Housing Structures by Number of Rooms in Nelson
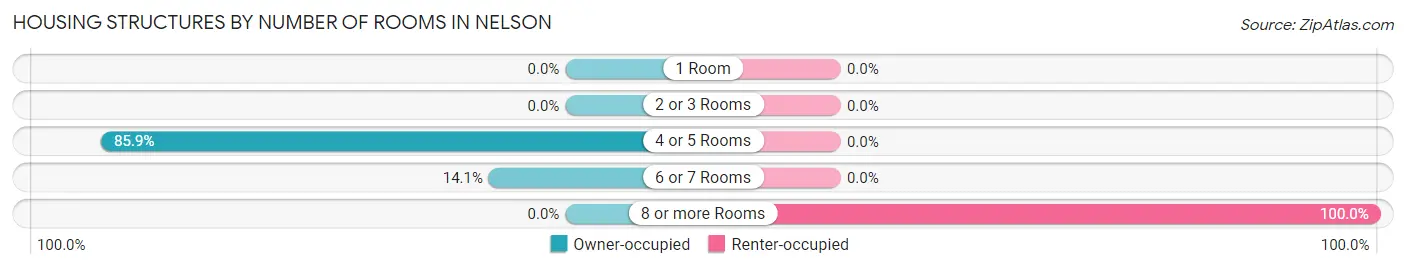
| Number of Rooms | Owner-occupied | Renter-occupied |
| 1 Room | 0 (0.0%) | 0 (0.0%) |
| 2 or 3 Rooms | 0 (0.0%) | 0 (0.0%) |
| 4 or 5 Rooms | 85 (85.9%) | 0 (0.0%) |
| 6 or 7 Rooms | 14 (14.1%) | 0 (0.0%) |
| 8 or more Rooms | 0 (0.0%) | 15 (100.0%) |
| Total | 99 (100.0%) | 15 (100.0%) |
Housing Structure by Heating Type in Nelson
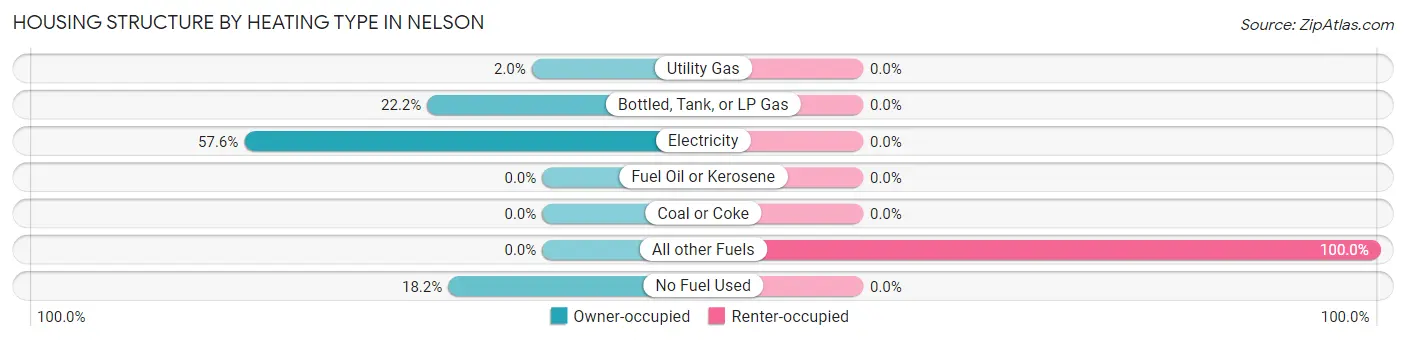
| Heating Type | Owner-occupied | Renter-occupied |
| Utility Gas | 2 (2.0%) | 0 (0.0%) |
| Bottled, Tank, or LP Gas | 22 (22.2%) | 0 (0.0%) |
| Electricity | 57 (57.6%) | 0 (0.0%) |
| Fuel Oil or Kerosene | 0 (0.0%) | 0 (0.0%) |
| Coal or Coke | 0 (0.0%) | 0 (0.0%) |
| All other Fuels | 0 (0.0%) | 15 (100.0%) |
| No Fuel Used | 18 (18.2%) | 0 (0.0%) |
| Total | 99 (100.0%) | 15 (100.0%) |
Household Vehicle Usage in Nelson
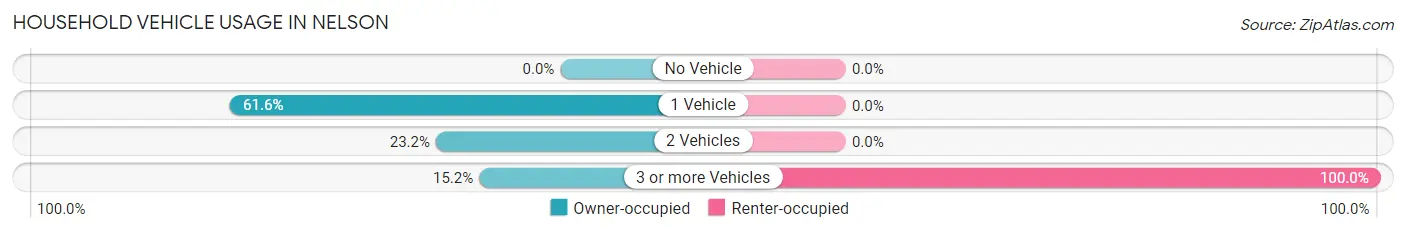
| Vehicles per Household | Owner-occupied | Renter-occupied |
| No Vehicle | 0 (0.0%) | 0 (0.0%) |
| 1 Vehicle | 61 (61.6%) | 0 (0.0%) |
| 2 Vehicles | 23 (23.2%) | 0 (0.0%) |
| 3 or more Vehicles | 15 (15.1%) | 15 (100.0%) |
| Total | 99 (100.0%) | 15 (100.0%) |
Real Estate & Mortgages in Nelson
Real Estate and Mortgage Overview in Nelson
| Characteristic | Without Mortgage | With Mortgage |
| Housing Units | 37 | 62 |
| Median Property Value | $88,600 | $94,500 |
| Median Household Income | $58,125 | $5 |
| Monthly Housing Costs | $497 | $0 |
| Real Estate Taxes | - | - |
Property Value by Mortgage Status in Nelson
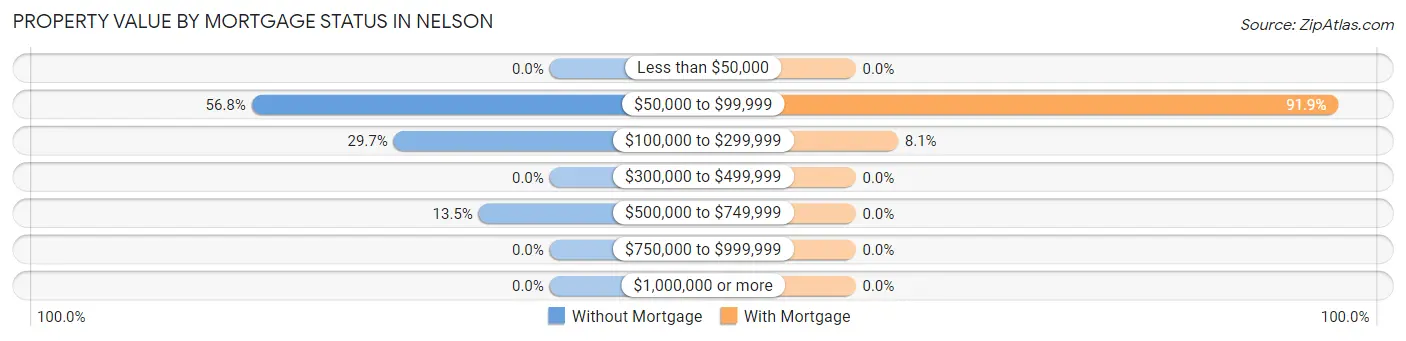
| Property Value | Without Mortgage | With Mortgage |
| Less than $50,000 | 0 (0.0%) | 0 (0.0%) |
| $50,000 to $99,999 | 21 (56.8%) | 57 (91.9%) |
| $100,000 to $299,999 | 11 (29.7%) | 5 (8.1%) |
| $300,000 to $499,999 | 0 (0.0%) | 0 (0.0%) |
| $500,000 to $749,999 | 5 (13.5%) | 0 (0.0%) |
| $750,000 to $999,999 | 0 (0.0%) | 0 (0.0%) |
| $1,000,000 or more | 0 (0.0%) | 0 (0.0%) |
| Total | 37 (100.0%) | 62 (100.0%) |
Household Income by Mortgage Status in Nelson
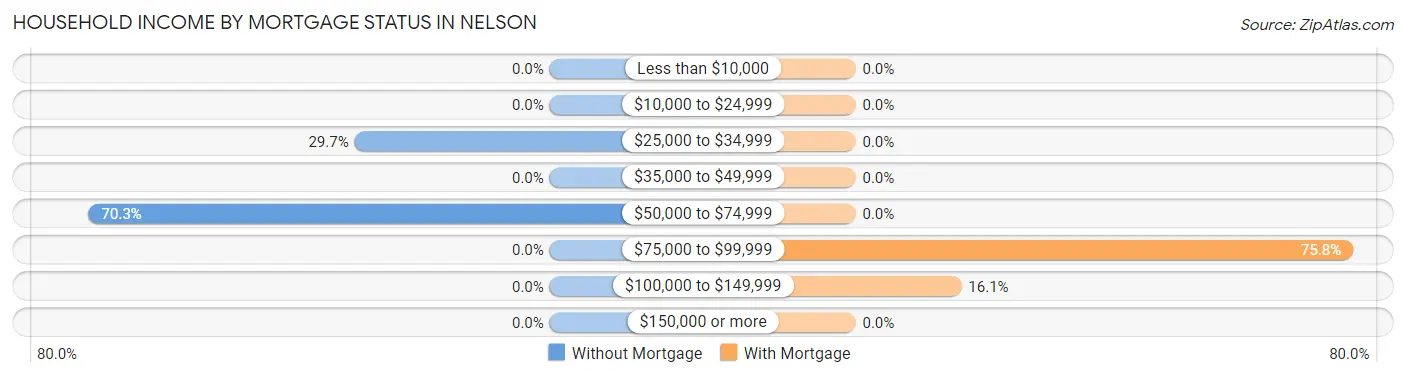
| Household Income | Without Mortgage | With Mortgage |
| Less than $10,000 | 0 (0.0%) | 0 (0.0%) |
| $10,000 to $24,999 | 0 (0.0%) | 0 (0.0%) |
| $25,000 to $34,999 | 11 (29.7%) | 0 (0.0%) |
| $35,000 to $49,999 | 0 (0.0%) | 0 (0.0%) |
| $50,000 to $74,999 | 26 (70.3%) | 0 (0.0%) |
| $75,000 to $99,999 | 0 (0.0%) | 47 (75.8%) |
| $100,000 to $149,999 | 0 (0.0%) | 10 (16.1%) |
| $150,000 or more | 0 (0.0%) | 0 (0.0%) |
| Total | 37 (100.0%) | 62 (100.0%) |
Property Value to Household Income Ratio in Nelson
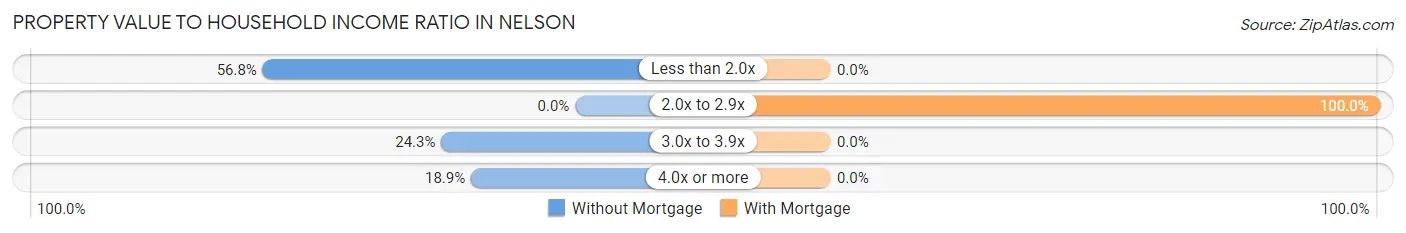
| Value-to-Income Ratio | Without Mortgage | With Mortgage |
| Less than 2.0x | 21 (56.8%) | 0 (0.0%) |
| 2.0x to 2.9x | 0 (0.0%) | 62 (100.0%) |
| 3.0x to 3.9x | 9 (24.3%) | 0 (0.0%) |
| 4.0x or more | 7 (18.9%) | 0 (0.0%) |
| Total | 37 (100.0%) | 62 (100.0%) |
Real Estate Taxes by Mortgage Status in Nelson
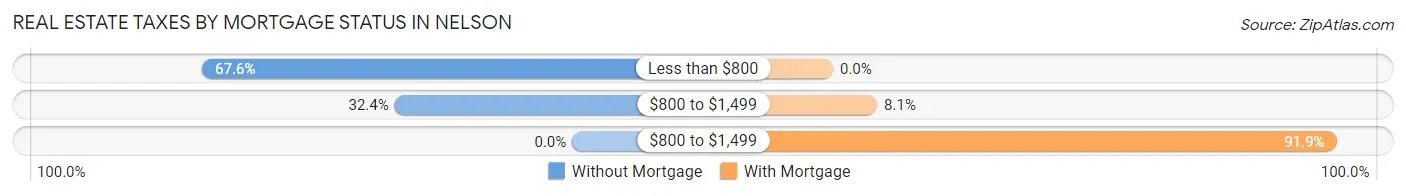
| Property Taxes | Without Mortgage | With Mortgage |
| Less than $800 | 25 (67.6%) | 0 (0.0%) |
| $800 to $1,499 | 12 (32.4%) | 5 (8.1%) |
| $800 to $1,499 | 0 (0.0%) | 57 (91.9%) |
| Total | 37 (100.0%) | 62 (100.0%) |
Health & Disability in Nelson
Health Insurance Coverage by Age in Nelson
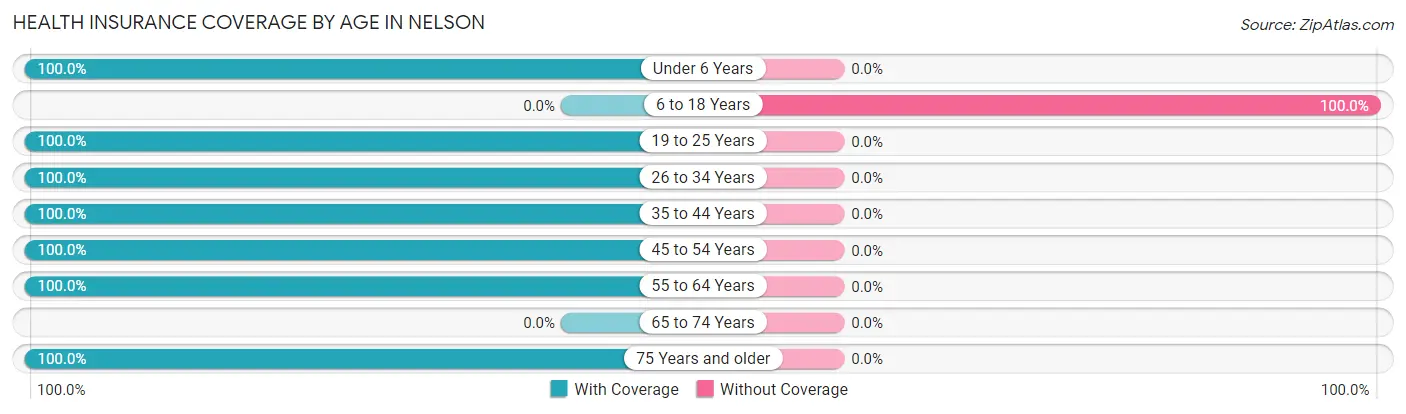
| Age Bracket | With Coverage | Without Coverage |
| Under 6 Years | 64 (100.0%) | 0 (0.0%) |
| 6 to 18 Years | 0 (0.0%) | 85 (100.0%) |
| 19 to 25 Years | 17 (100.0%) | 0 (0.0%) |
| 26 to 34 Years | 81 (100.0%) | 0 (0.0%) |
| 35 to 44 Years | 47 (100.0%) | 0 (0.0%) |
| 45 to 54 Years | 22 (100.0%) | 0 (0.0%) |
| 55 to 64 Years | 50 (100.0%) | 0 (0.0%) |
| 65 to 74 Years | 0 (0.0%) | 0 (0.0%) |
| 75 Years and older | 21 (100.0%) | 0 (0.0%) |
| Total | 302 (78.0%) | 85 (22.0%) |
Health Insurance Coverage by Citizenship Status in Nelson
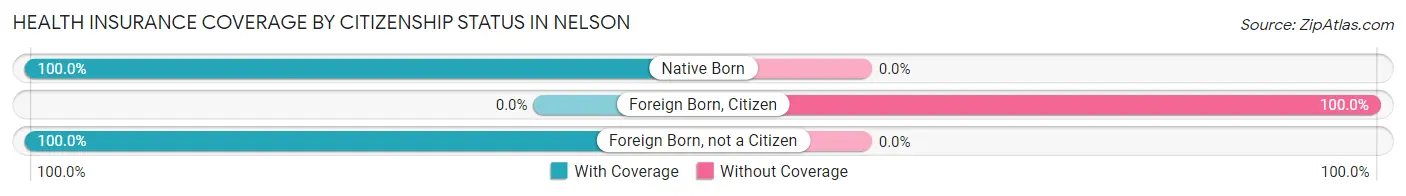
| Citizenship Status | With Coverage | Without Coverage |
| Native Born | 64 (100.0%) | 0 (0.0%) |
| Foreign Born, Citizen | 0 (0.0%) | 85 (100.0%) |
| Foreign Born, not a Citizen | 17 (100.0%) | 0 (0.0%) |
Health Insurance Coverage by Household Income in Nelson
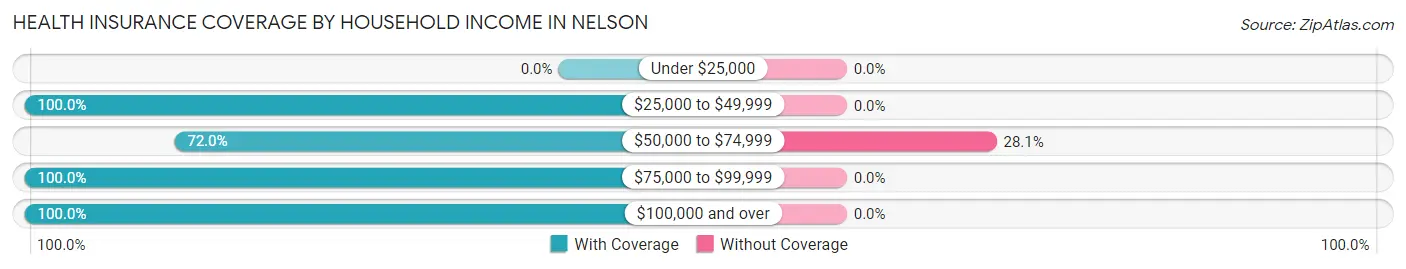
| Household Income | With Coverage | Without Coverage |
| Under $25,000 | 0 (0.0%) | 0 (0.0%) |
| $25,000 to $49,999 | 16 (100.0%) | 0 (0.0%) |
| $50,000 to $74,999 | 218 (72.0%) | 85 (28.1%) |
| $75,000 to $99,999 | 35 (100.0%) | 0 (0.0%) |
| $100,000 and over | 33 (100.0%) | 0 (0.0%) |
Public vs Private Health Insurance Coverage by Age in Nelson
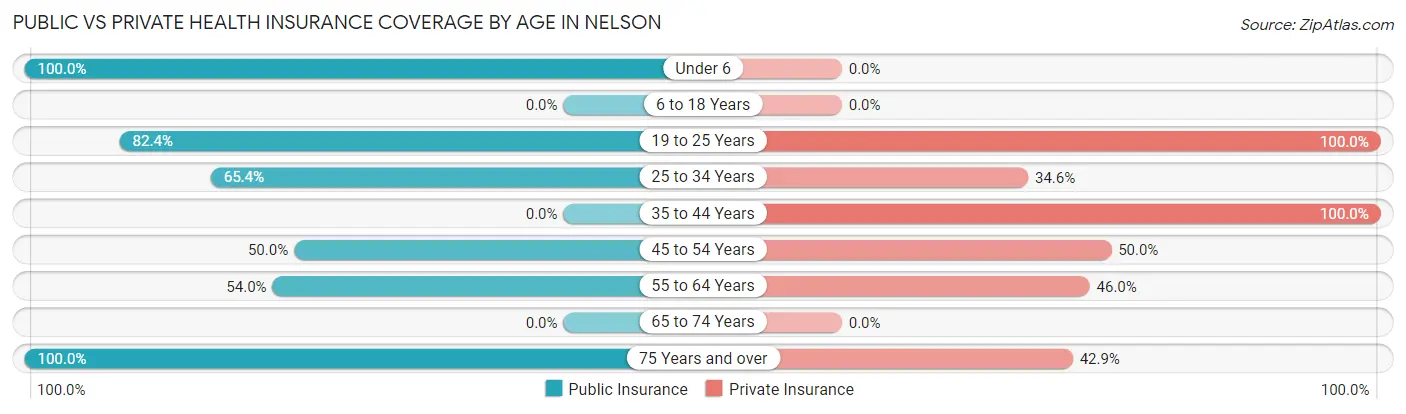
| Age Bracket | Public Insurance | Private Insurance |
| Under 6 | 64 (100.0%) | 0 (0.0%) |
| 6 to 18 Years | 0 (0.0%) | 0 (0.0%) |
| 19 to 25 Years | 14 (82.4%) | 17 (100.0%) |
| 25 to 34 Years | 53 (65.4%) | 28 (34.6%) |
| 35 to 44 Years | 0 (0.0%) | 47 (100.0%) |
| 45 to 54 Years | 11 (50.0%) | 11 (50.0%) |
| 55 to 64 Years | 27 (54.0%) | 23 (46.0%) |
| 65 to 74 Years | 0 (0.0%) | 0 (0.0%) |
| 75 Years and over | 21 (100.0%) | 9 (42.9%) |
| Total | 190 (49.1%) | 135 (34.9%) |
Disability Status by Sex by Age in Nelson
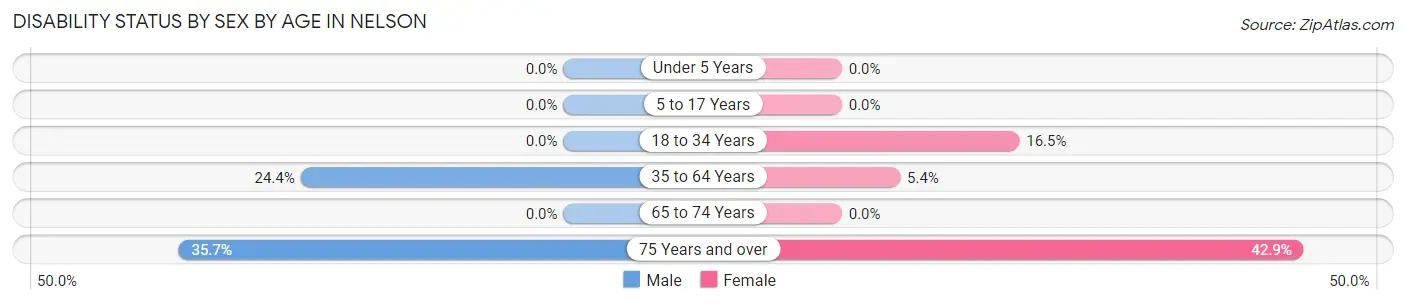
| Age Bracket | Male | Female |
| Under 5 Years | 0 (0.0%) | 0 (0.0%) |
| 5 to 17 Years | 0 (0.0%) | 0 (0.0%) |
| 18 to 34 Years | 0 (0.0%) | 14 (16.5%) |
| 35 to 64 Years | 20 (24.4%) | 2 (5.4%) |
| 65 to 74 Years | 0 (0.0%) | 0 (0.0%) |
| 75 Years and over | 5 (35.7%) | 3 (42.9%) |
Disability Class by Sex by Age in Nelson
Disability Class: Hearing Difficulty
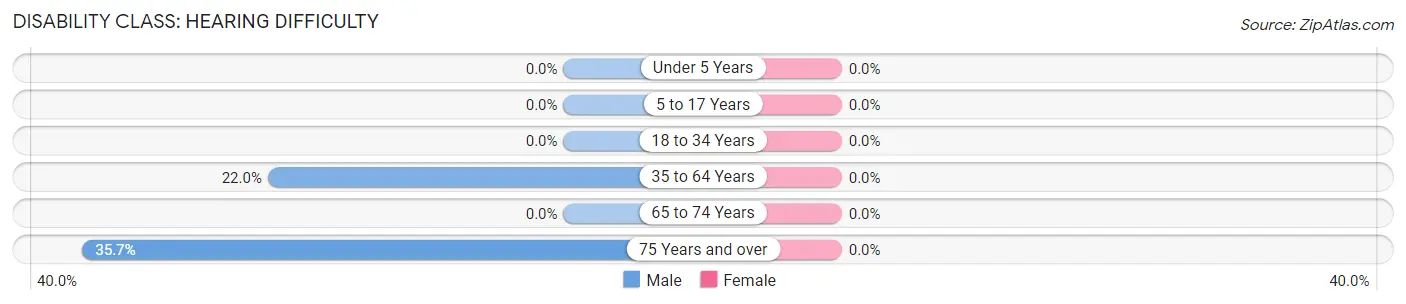
| Age Bracket | Male | Female |
| Under 5 Years | 0 (0.0%) | 0 (0.0%) |
| 5 to 17 Years | 0 (0.0%) | 0 (0.0%) |
| 18 to 34 Years | 0 (0.0%) | 0 (0.0%) |
| 35 to 64 Years | 18 (22.0%) | 0 (0.0%) |
| 65 to 74 Years | 0 (0.0%) | 0 (0.0%) |
| 75 Years and over | 5 (35.7%) | 0 (0.0%) |
Disability Class: Vision Difficulty
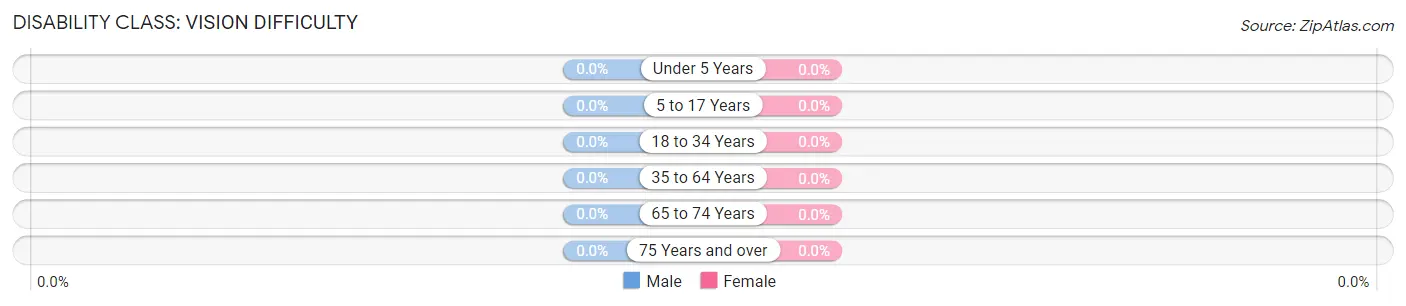
| Age Bracket | Male | Female |
| Under 5 Years | 0 (0.0%) | 0 (0.0%) |
| 5 to 17 Years | 0 (0.0%) | 0 (0.0%) |
| 18 to 34 Years | 0 (0.0%) | 0 (0.0%) |
| 35 to 64 Years | 0 (0.0%) | 0 (0.0%) |
| 65 to 74 Years | 0 (0.0%) | 0 (0.0%) |
| 75 Years and over | 0 (0.0%) | 0 (0.0%) |
Disability Class: Cognitive Difficulty
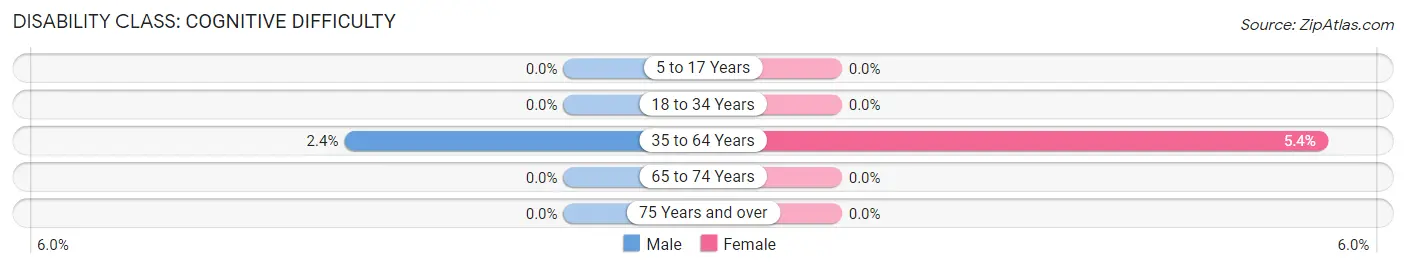
| Age Bracket | Male | Female |
| 5 to 17 Years | 0 (0.0%) | 0 (0.0%) |
| 18 to 34 Years | 0 (0.0%) | 0 (0.0%) |
| 35 to 64 Years | 2 (2.4%) | 2 (5.4%) |
| 65 to 74 Years | 0 (0.0%) | 0 (0.0%) |
| 75 Years and over | 0 (0.0%) | 0 (0.0%) |
Disability Class: Ambulatory Difficulty
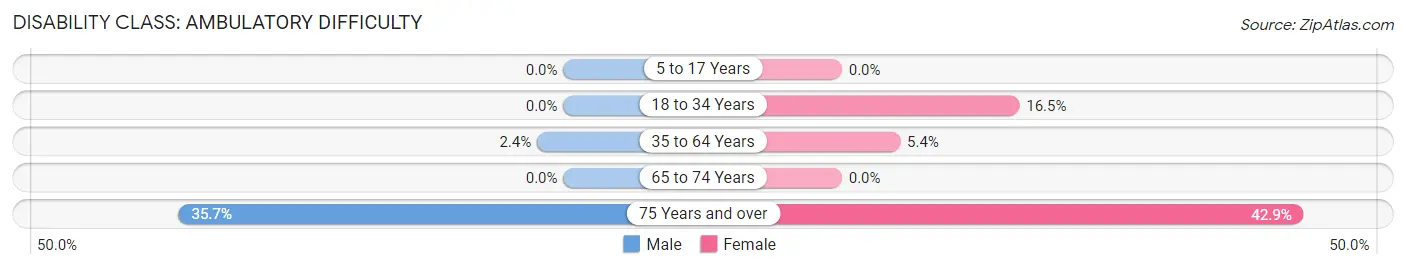
| Age Bracket | Male | Female |
| 5 to 17 Years | 0 (0.0%) | 0 (0.0%) |
| 18 to 34 Years | 0 (0.0%) | 14 (16.5%) |
| 35 to 64 Years | 2 (2.4%) | 2 (5.4%) |
| 65 to 74 Years | 0 (0.0%) | 0 (0.0%) |
| 75 Years and over | 5 (35.7%) | 3 (42.9%) |
Disability Class: Self-Care Difficulty
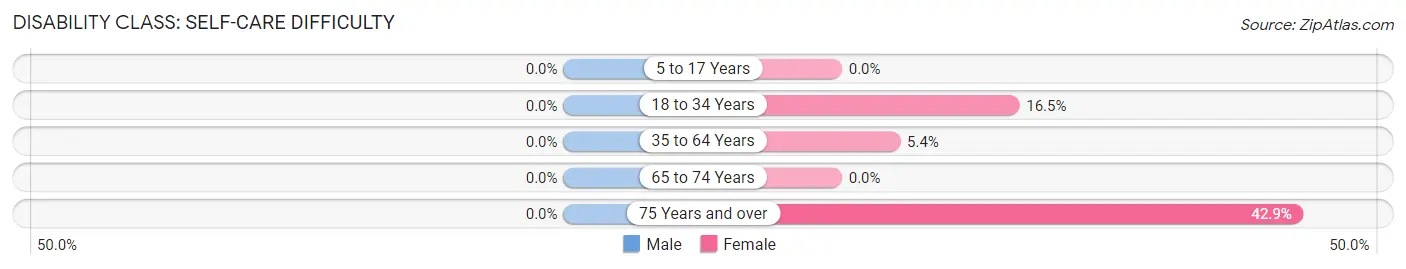
| Age Bracket | Male | Female |
| 5 to 17 Years | 0 (0.0%) | 0 (0.0%) |
| 18 to 34 Years | 0 (0.0%) | 14 (16.5%) |
| 35 to 64 Years | 0 (0.0%) | 2 (5.4%) |
| 65 to 74 Years | 0 (0.0%) | 0 (0.0%) |
| 75 Years and over | 0 (0.0%) | 3 (42.9%) |
Technology Access in Nelson
Computing Device Access in Nelson
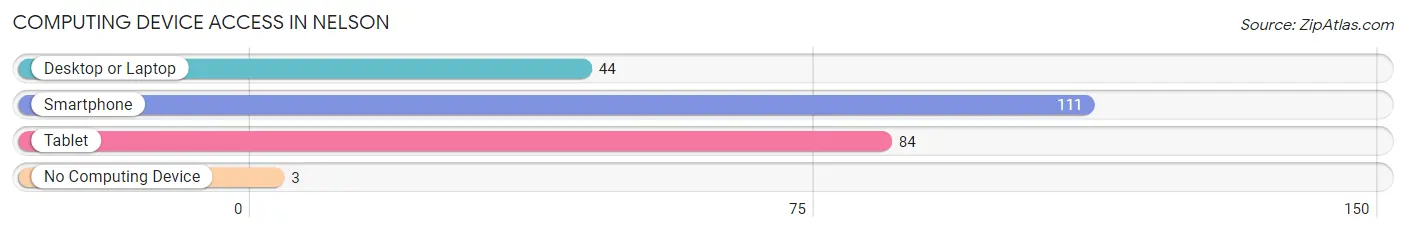
| Device Type | # Households | % Households |
| Desktop or Laptop | 44 | 38.6% |
| Smartphone | 111 | 97.4% |
| Tablet | 84 | 73.7% |
| No Computing Device | 3 | 2.6% |
| Total | 114 | 100.0% |
Internet Access in Nelson
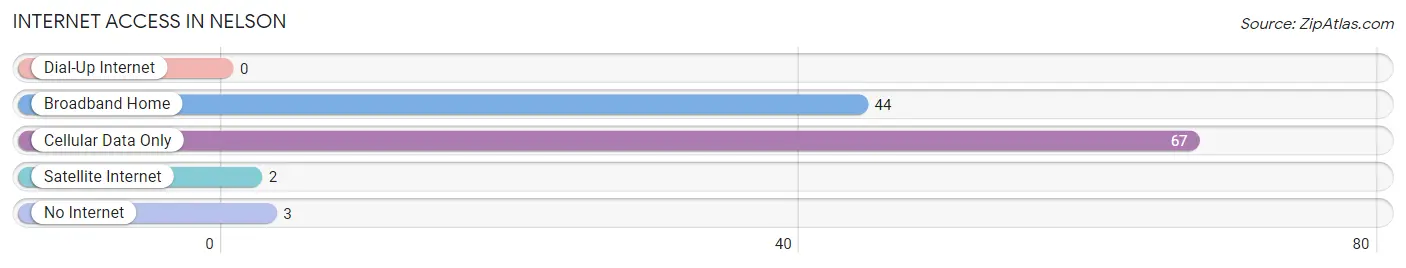
| Internet Type | # Households | % Households |
| Dial-Up Internet | 0 | 0.0% |
| Broadband Home | 44 | 38.6% |
| Cellular Data Only | 67 | 58.8% |
| Satellite Internet | 2 | 1.8% |
| No Internet | 3 | 2.6% |
| Total | 114 | 100.0% |
Nelson Summary
Nelson is a small unincorporated community located in Mohave County, Arizona. It is situated in the western part of the state, approximately 25 miles south of Kingman. The area is known for its rich history, diverse geography, and unique economy.
History
Nelson was founded in 1883 by a group of miners who were searching for gold in the nearby hills. The town was named after one of the miners, William Nelson. The miners quickly discovered that the area was rich in copper, and the town soon became a mining center. The copper mines were operated by the Arizona Copper Company, which was owned by the Phelps Dodge Corporation. The town grew rapidly, and by the early 1900s, it had a population of over 1,000 people.
The town was also home to a number of other businesses, including a hotel, a general store, a post office, and a school. The town was also home to a number of saloons and gambling halls. The town was a popular destination for cowboys and other travelers, and it was known for its wild and rowdy atmosphere.
In the early 1900s, the town began to decline as the copper mines began to run out of ore. By the 1950s, the town had become a ghost town, and the population had dwindled to just a few dozen people. In the late 1970s, the town was revitalized when a new copper mine was opened nearby. The town has since become a popular tourist destination, and it is now home to a number of businesses, including a restaurant, a bar, and a motel.
Geography
Nelson is located in the western part of Arizona, approximately 25 miles south of Kingman. The town is situated in a desert valley, surrounded by mountains and hills. The area is known for its rugged beauty, and it is home to a variety of wildlife, including coyotes, bobcats, and jackrabbits.
The climate in Nelson is arid and hot, with temperatures reaching over 100 degrees Fahrenheit in the summer months. The area receives very little rainfall, and the average annual precipitation is just 8 inches.
Economy
Nelson’s economy is largely based on tourism and mining. The town is home to a number of businesses, including a restaurant, a bar, and a motel. The town is also home to a copper mine, which is operated by the Arizona Copper Company. The mine is the town’s largest employer, and it provides jobs for over 200 people.
The town is also home to a number of small businesses, including a general store, a post office, and a school. The town is also home to a number of artists and craftspeople, who sell their wares at local markets and festivals.
Demographics
As of the 2010 census, the population of Nelson was 1,092. The town is predominantly white, with over 90% of the population identifying as Caucasian. The town is also home to a small Hispanic population, with over 5% of the population identifying as Hispanic or Latino. The median household income in Nelson is $37,000, and the median home value is $90,000.
Common Questions
What is Per Capita Income in Nelson?
Per Capita income in Nelson is $22,876.
What is the Median Family Income in Nelson?
Median Family Income in Nelson is $47,154.
What is the Median Household income in Nelson?
Median Household Income in Nelson is $52,300.
What is Inequality or Gini Index in Nelson?
Inequality or Gini Index in Nelson is 0.32.
What is the Total Population of Nelson?
Total Population of Nelson is 387.
What is the Total Male Population of Nelson?
Total Male Population of Nelson is 258.
What is the Total Female Population of Nelson?
Total Female Population of Nelson is 129.
What is the Ratio of Males per 100 Females in Nelson?
There are 200.00 Males per 100 Females in Nelson.
What is the Ratio of Females per 100 Males in Nelson?
There are 50.00 Females per 100 Males in Nelson.
What is the Median Population Age in Nelson?
Median Population Age in Nelson is 34.2 Years.
What is the Average Family Size in Nelson
Average Family Size in Nelson is 3.4 People.
What is the Average Household Size in Nelson
Average Household Size in Nelson is 3.4 People.
How Large is the Labor Force in Nelson?
There are 117 People in the Labor Forcein in Nelson.
What is the Percentage of People in the Labor Force in Nelson?
49.2% of People are in the Labor Force in Nelson.