Maricopa Colony, AZ Map & Demographics
Maricopa Colony Map
Maricopa Colony Overview
$6,343
PER CAPITA INCOME
$24,821
AVG FAMILY INCOME
$26,339
AVG HOUSEHOLD INCOME
0.39
INEQUALITY / GINI INDEX
615
TOTAL POPULATION
332
MALE POPULATION
283
FEMALE POPULATION
117.31
MALES / 100 FEMALES
85.24
FEMALES / 100 MALES
18.3
MEDIAN AGE
6.1
AVG FAMILY SIZE
4.8
AVG HOUSEHOLD SIZE
71
LABOR FORCE [ PEOPLE ]
21.3%
PERCENT IN LABOR FORCE
Income in Maricopa Colony
Income Overview in Maricopa Colony
Per Capita Income in Maricopa Colony is $6,343, while median incomes of families and households are $24,821 and $26,339 respectively.
| Characteristic | Number | Measure |
| Per Capita Income | 615 | $6,343 |
| Median Family Income | 92 | $24,821 |
| Mean Family Income | 92 | $28,317 |
| Median Household Income | 129 | $26,339 |
| Mean Household Income | 129 | $30,488 |
| Income Deficit | 92 | $0 |
| Wage / Income Gap (%) | 615 | 0.00% |
| Wage / Income Gap ($) | 615 | 100.00¢ per $1 |
| Gini / Inequality Index | 615 | 0.39 |
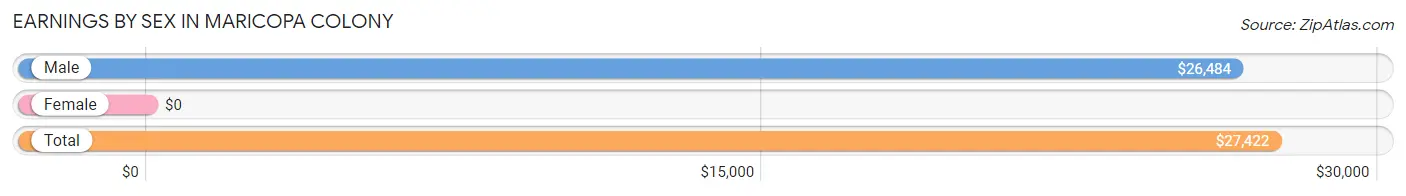
Earnings by Sex in Maricopa Colony
| Sex | Number | Average Earnings |
| Male | 71 (85.5%) | $26,484 |
| Female | 12 (14.5%) | $0 |
| Total | 83 (100.0%) | $27,422 |
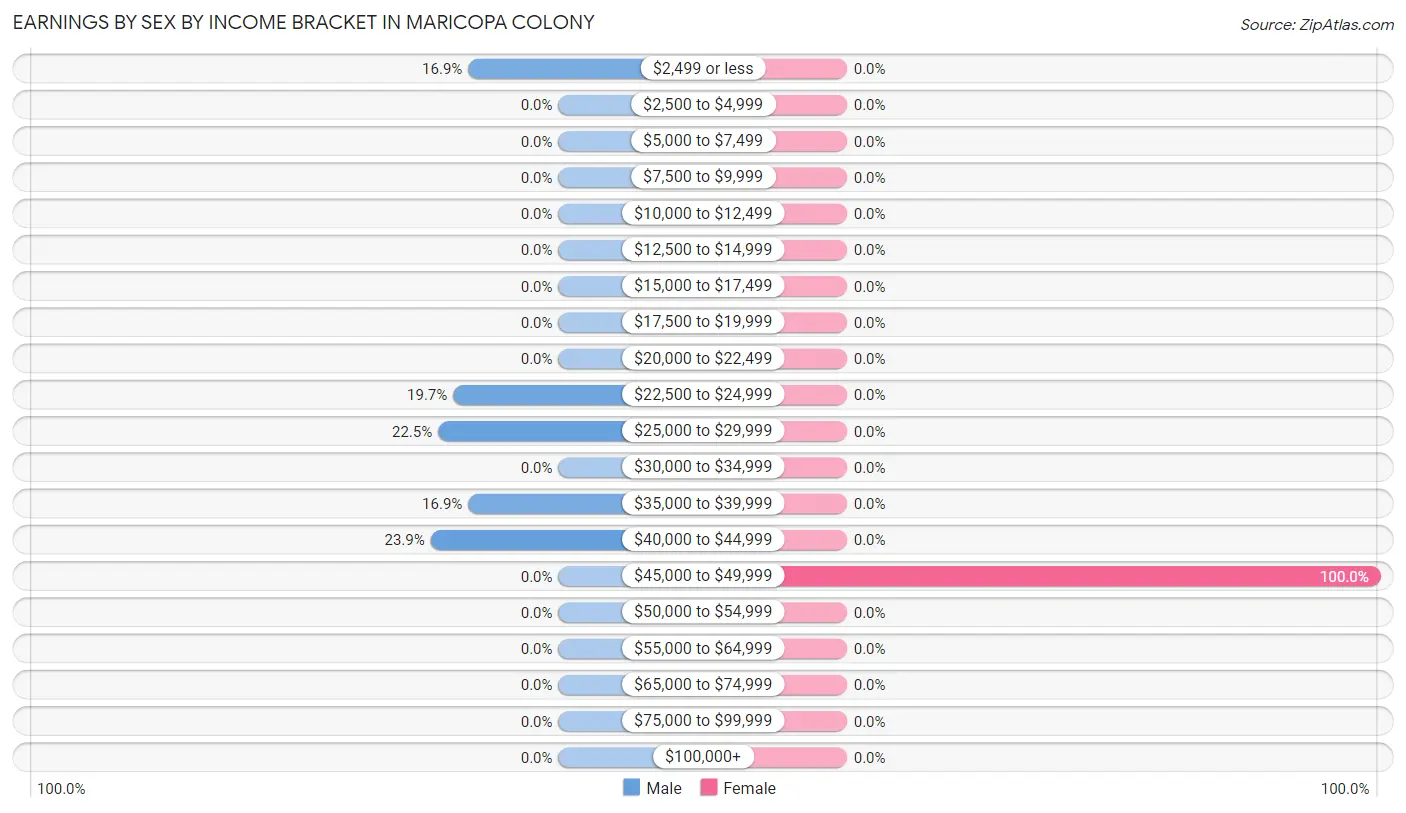
Earnings by Sex by Income Bracket in Maricopa Colony
The most common earnings brackets in Maricopa Colony are $40,000 to $44,999 for men (17 | 23.9%) and $45,000 to $49,999 for women (12 | 100.0%).
| Income | Male | Female |
| $2,499 or less | 12 (16.9%) | 0 (0.0%) |
| $2,500 to $4,999 | 0 (0.0%) | 0 (0.0%) |
| $5,000 to $7,499 | 0 (0.0%) | 0 (0.0%) |
| $7,500 to $9,999 | 0 (0.0%) | 0 (0.0%) |
| $10,000 to $12,499 | 0 (0.0%) | 0 (0.0%) |
| $12,500 to $14,999 | 0 (0.0%) | 0 (0.0%) |
| $15,000 to $17,499 | 0 (0.0%) | 0 (0.0%) |
| $17,500 to $19,999 | 0 (0.0%) | 0 (0.0%) |
| $20,000 to $22,499 | 0 (0.0%) | 0 (0.0%) |
| $22,500 to $24,999 | 14 (19.7%) | 0 (0.0%) |
| $25,000 to $29,999 | 16 (22.5%) | 0 (0.0%) |
| $30,000 to $34,999 | 0 (0.0%) | 0 (0.0%) |
| $35,000 to $39,999 | 12 (16.9%) | 0 (0.0%) |
| $40,000 to $44,999 | 17 (23.9%) | 0 (0.0%) |
| $45,000 to $49,999 | 0 (0.0%) | 12 (100.0%) |
| $50,000 to $54,999 | 0 (0.0%) | 0 (0.0%) |
| $55,000 to $64,999 | 0 (0.0%) | 0 (0.0%) |
| $65,000 to $74,999 | 0 (0.0%) | 0 (0.0%) |
| $75,000 to $99,999 | 0 (0.0%) | 0 (0.0%) |
| $100,000+ | 0 (0.0%) | 0 (0.0%) |
| Total | 71 (100.0%) | 12 (100.0%) |
Earnings by Sex by Educational Attainment in Maricopa Colony
| Educational Attainment | Male Income | Female Income |
| Less than High School | - | - |
| High School Diploma | - | - |
| College or Associate's Degree | - | - |
| Bachelor's Degree | - | - |
| Graduate Degree | - | - |
| Total | $35,104 | $0 |
Family Income in Maricopa Colony
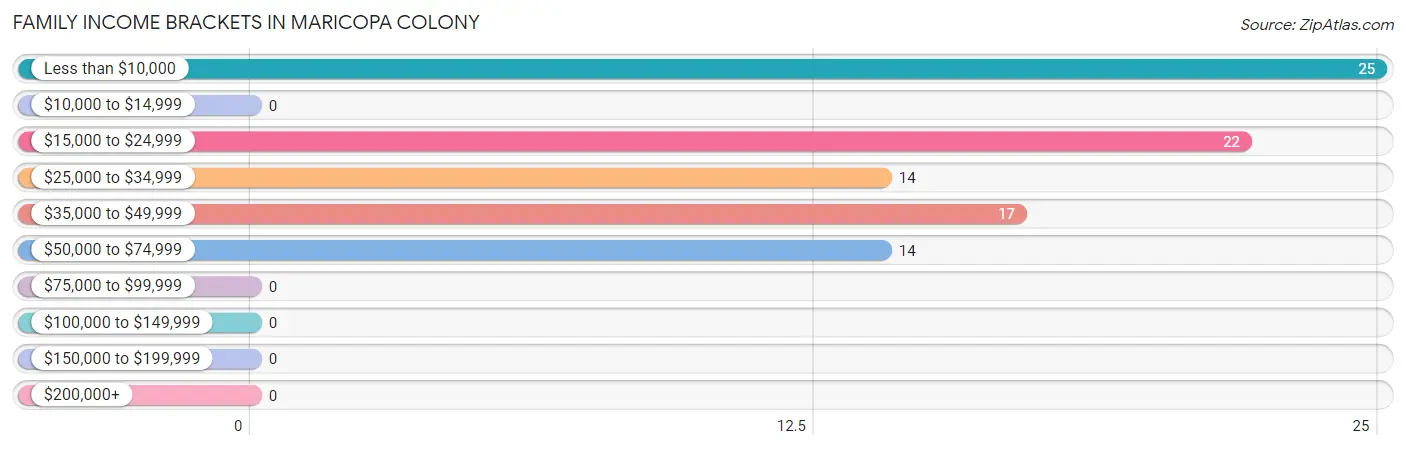
Family Income Brackets in Maricopa Colony
According to the Maricopa Colony family income data, there are 25 families falling into the less than $10,000 income range, which is the most common income bracket and makes up 27.2% of all families.
| Income Bracket | # Families | % Families |
| Less than $10,000 | 25 | 27.2% |
| $10,000 to $14,999 | 0 | 0.0% |
| $15,000 to $24,999 | 22 | 23.9% |
| $25,000 to $34,999 | 14 | 15.2% |
| $35,000 to $49,999 | 17 | 18.5% |
| $50,000 to $74,999 | 14 | 15.2% |
| $75,000 to $99,999 | 0 | 0.0% |
| $100,000 to $149,999 | 0 | 0.0% |
| $150,000 to $199,999 | 0 | 0.0% |
| $200,000+ | 0 | 0.0% |
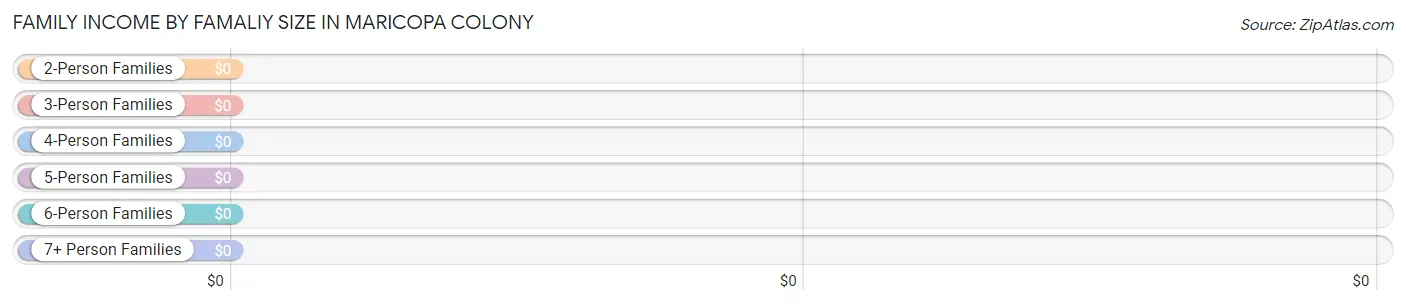
Family Income by Famaliy Size in Maricopa Colony
| Income Bracket | # Families | Median Income |
| 2-Person Families | 22 (23.9%) | $0 |
| 3-Person Families | 17 (18.5%) | $0 |
| 4-Person Families | 0 (0.0%) | $0 |
| 5-Person Families | 0 (0.0%) | $0 |
| 6-Person Families | 0 (0.0%) | $0 |
| 7+ Person Families | 53 (57.6%) | $0 |
| Total | 92 (100.0%) | $24,821 |
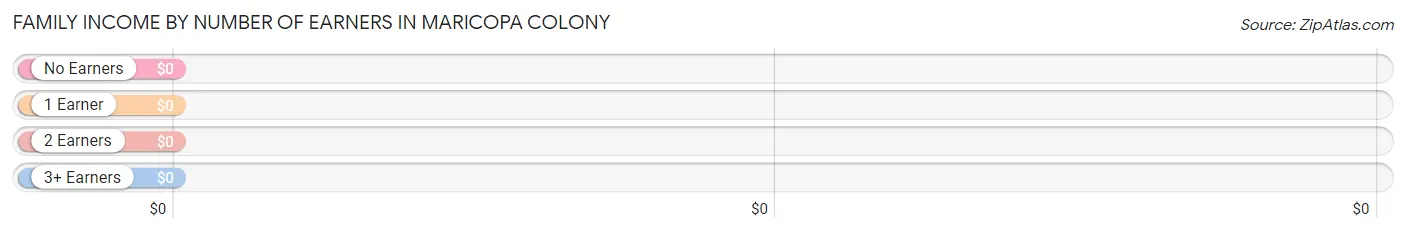
Family Income by Number of Earners in Maricopa Colony
| Number of Earners | # Families | Median Income |
| No Earners | 21 (22.8%) | $0 |
| 1 Earner | 71 (77.2%) | $0 |
| 2 Earners | 0 (0.0%) | $0 |
| 3+ Earners | 0 (0.0%) | $0 |
| Total | 92 (100.0%) | $24,821 |
Household Income in Maricopa Colony
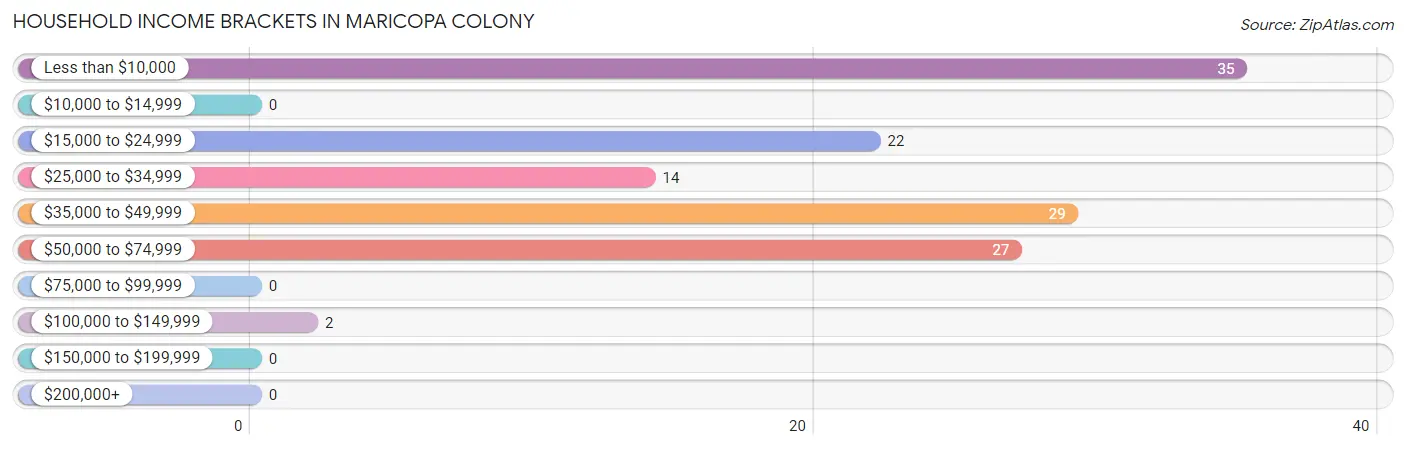
Household Income Brackets in Maricopa Colony
With 35 households falling in the category, the less than $10,000 income range is the most frequent in Maricopa Colony, accounting for 27.1% of all households.
| Income Bracket | # Households | % Households |
| Less than $10,000 | 35 | 27.1% |
| $10,000 to $14,999 | 0 | 0.0% |
| $15,000 to $24,999 | 22 | 17.1% |
| $25,000 to $34,999 | 14 | 10.9% |
| $35,000 to $49,999 | 29 | 22.5% |
| $50,000 to $74,999 | 27 | 20.9% |
| $75,000 to $99,999 | 0 | 0.0% |
| $100,000 to $149,999 | 2 | 1.6% |
| $150,000 to $199,999 | 0 | 0.0% |
| $200,000+ | 0 | 0.0% |
Household Income by Householder Age in Maricopa Colony
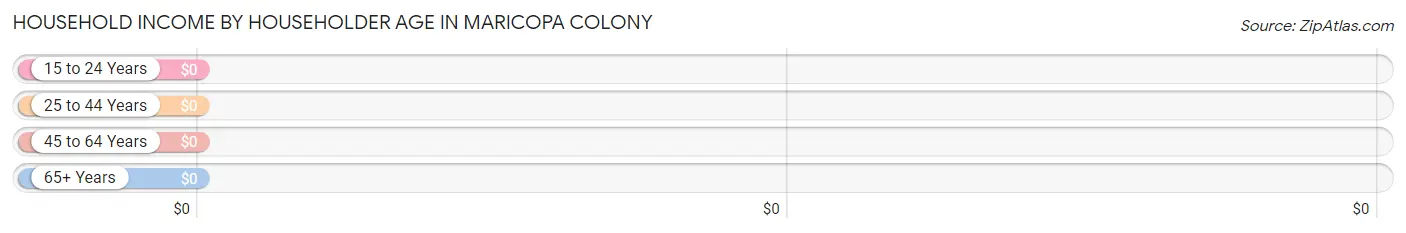
| Income Bracket | # Households | Median Income |
| 15 to 24 Years | 14 (10.8%) | $0 |
| 25 to 44 Years | 12 (9.3%) | $0 |
| 45 to 64 Years | 89 (69.0%) | $0 |
| 65+ Years | 14 (10.8%) | $0 |
| Total | 129 (100.0%) | $26,339 |
Poverty in Maricopa Colony
Income Below Poverty by Sex and Age in Maricopa Colony
With 81.9% poverty level for males and 79.5% for females among the residents of Maricopa Colony, under 5 year old males and under 5 year old females are the most vulnerable to poverty, with 72 males (100.0%) and 61 females (100.0%) in their respective age groups living below the poverty level.
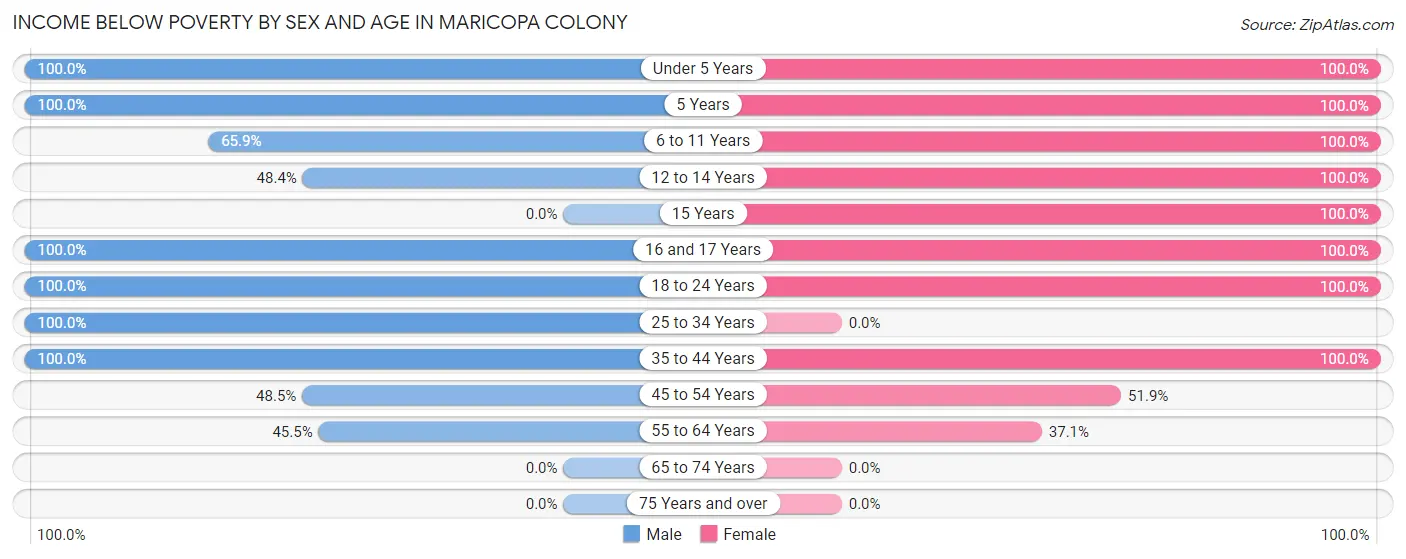
| Age Bracket | Male | Female |
| Under 5 Years | 72 (100.0%) | 61 (100.0%) |
| 5 Years | 17 (100.0%) | 6 (100.0%) |
| 6 to 11 Years | 29 (65.9%) | 13 (100.0%) |
| 12 to 14 Years | 15 (48.4%) | 21 (100.0%) |
| 15 Years | 0 (0.0%) | 16 (100.0%) |
| 16 and 17 Years | 13 (100.0%) | 9 (100.0%) |
| 18 to 24 Years | 69 (100.0%) | 41 (100.0%) |
| 25 to 34 Years | 19 (100.0%) | 0 (0.0%) |
| 35 to 44 Years | 12 (100.0%) | 31 (100.0%) |
| 45 to 54 Years | 16 (48.5%) | 14 (51.8%) |
| 55 to 64 Years | 10 (45.5%) | 13 (37.1%) |
| 65 to 74 Years | 0 (0.0%) | 0 (0.0%) |
| 75 Years and over | 0 (0.0%) | 0 (0.0%) |
| Total | 272 (81.9%) | 225 (79.5%) |
Income Above Poverty by Sex and Age in Maricopa Colony
According to the poverty statistics in Maricopa Colony, males aged 55 to 64 years and females aged 25 to 34 years are the age groups that are most secure financially, with 54.5% of males and 100.0% of females in these age groups living above the poverty line.
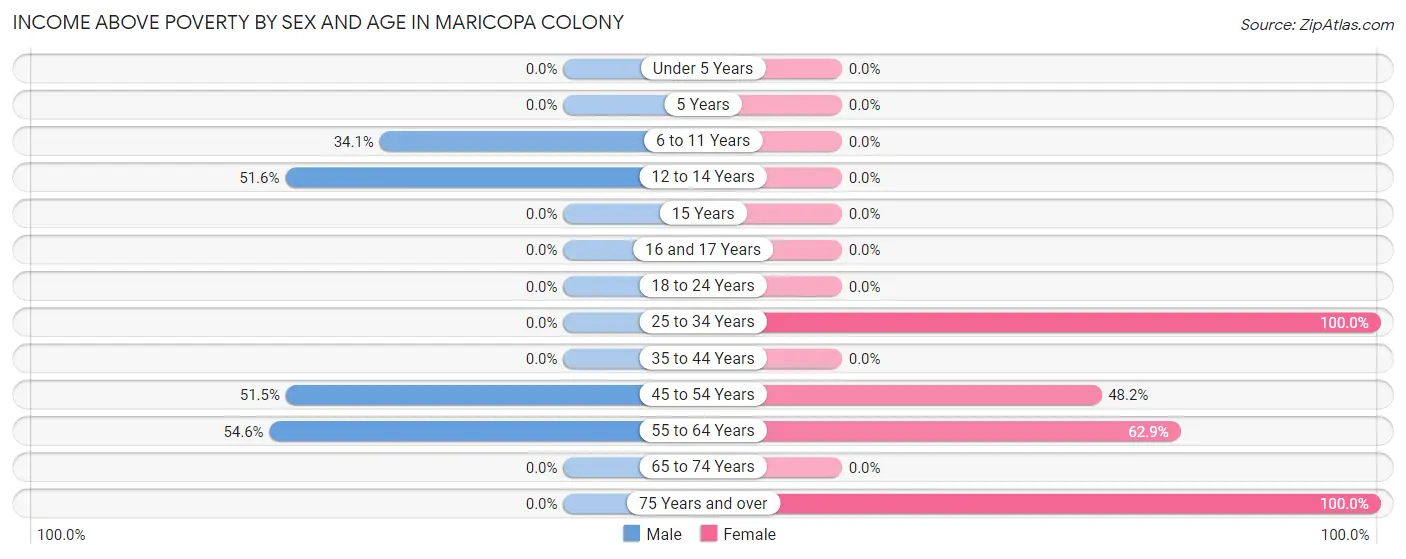
| Age Bracket | Male | Female |
| Under 5 Years | 0 (0.0%) | 0 (0.0%) |
| 5 Years | 0 (0.0%) | 0 (0.0%) |
| 6 to 11 Years | 15 (34.1%) | 0 (0.0%) |
| 12 to 14 Years | 16 (51.6%) | 0 (0.0%) |
| 15 Years | 0 (0.0%) | 0 (0.0%) |
| 16 and 17 Years | 0 (0.0%) | 0 (0.0%) |
| 18 to 24 Years | 0 (0.0%) | 0 (0.0%) |
| 25 to 34 Years | 0 (0.0%) | 9 (100.0%) |
| 35 to 44 Years | 0 (0.0%) | 0 (0.0%) |
| 45 to 54 Years | 17 (51.5%) | 13 (48.1%) |
| 55 to 64 Years | 12 (54.5%) | 22 (62.9%) |
| 65 to 74 Years | 0 (0.0%) | 0 (0.0%) |
| 75 Years and over | 0 (0.0%) | 14 (100.0%) |
| Total | 60 (18.1%) | 58 (20.5%) |
Income Below Poverty Among Married-Couple Families in Maricopa Colony
The poverty statistics for married-couple families in Maricopa Colony show that 100.0% or 26 of the total 26 families live below the poverty line. Families with 5 or more children have the highest poverty rate of 100.0%, comprising of 26 families. On the other hand, families with 5 or more children have the lowest poverty rate of 100.0%, which includes 26 families.
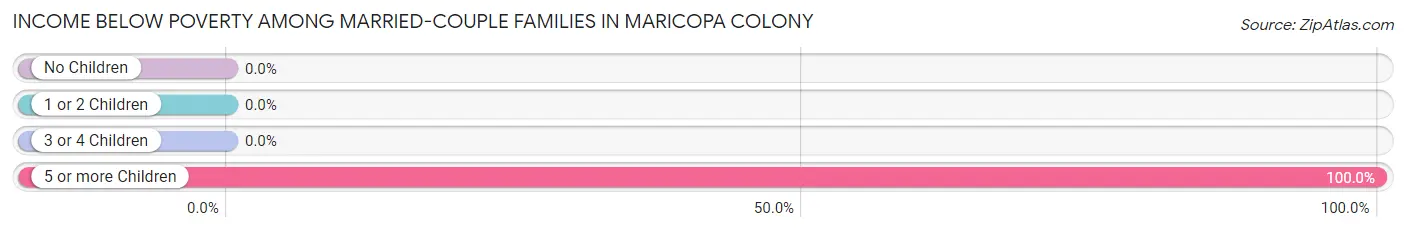
| Children | Above Poverty | Below Poverty |
| No Children | 0 (0.0%) | 0 (0.0%) |
| 1 or 2 Children | 0 (0.0%) | 0 (0.0%) |
| 3 or 4 Children | 0 (0.0%) | 0 (0.0%) |
| 5 or more Children | 0 (0.0%) | 26 (100.0%) |
| Total | 0 (0.0%) | 26 (100.0%) |
Income Below Poverty Among Single-Parent Households in Maricopa Colony
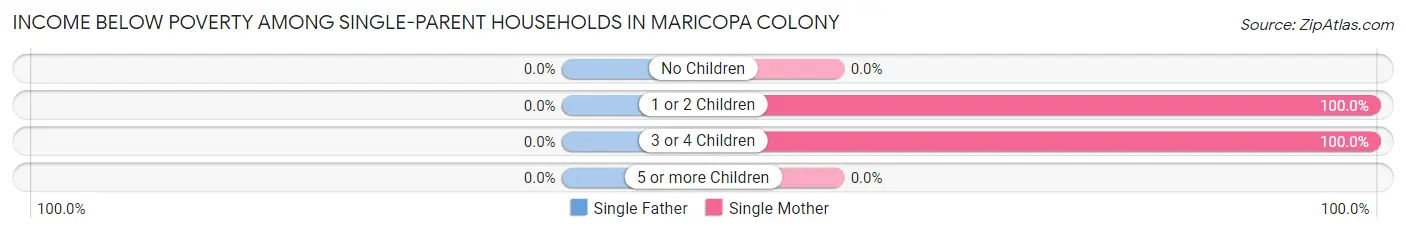
| Children | Single Father | Single Mother |
| No Children | 0 (0.0%) | 0 (0.0%) |
| 1 or 2 Children | 0 (0.0%) | 14 (100.0%) |
| 3 or 4 Children | 0 (0.0%) | 13 (100.0%) |
| 5 or more Children | 0 (0.0%) | 0 (0.0%) |
| Total | 0 (0.0%) | 27 (55.1%) |
Income Below Poverty Among Married-Couple vs Single-Parent Households in Maricopa Colony
The poverty data for Maricopa Colony shows that 26 of the married-couple family households (100.0%) and 27 of the single-parent households (40.9%) are living below the poverty level. Within the married-couple family households, those with 5 or more children have the highest poverty rate, with 26 households (100.0%) falling below the poverty line. Among the single-parent households, those with 3 or 4 children have the highest poverty rate, with 13 household (100.0%) living below poverty.
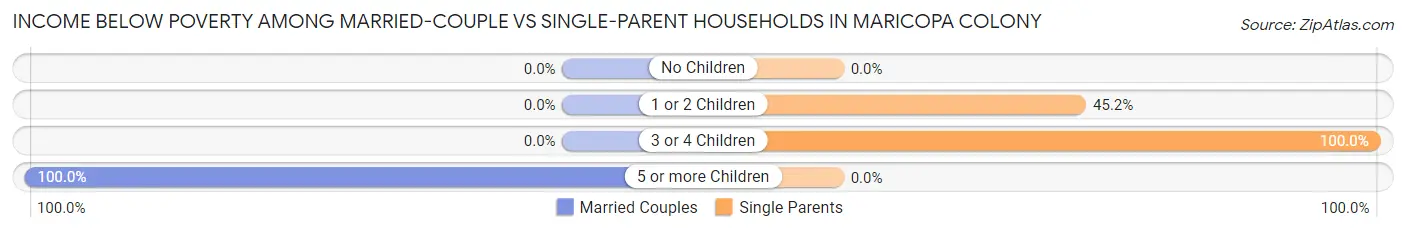
| Children | Married-Couple Families | Single-Parent Households |
| No Children | 0 (0.0%) | 0 (0.0%) |
| 1 or 2 Children | 0 (0.0%) | 14 (45.2%) |
| 3 or 4 Children | 0 (0.0%) | 13 (100.0%) |
| 5 or more Children | 26 (100.0%) | 0 (0.0%) |
| Total | 26 (100.0%) | 27 (40.9%) |
Race in Maricopa Colony
The most populous races in Maricopa Colony are Native / Alaskan (568 | 92.4%), Two or more Races (31 | 5.0%), and Hispanic or Latino (16 | 2.6%).
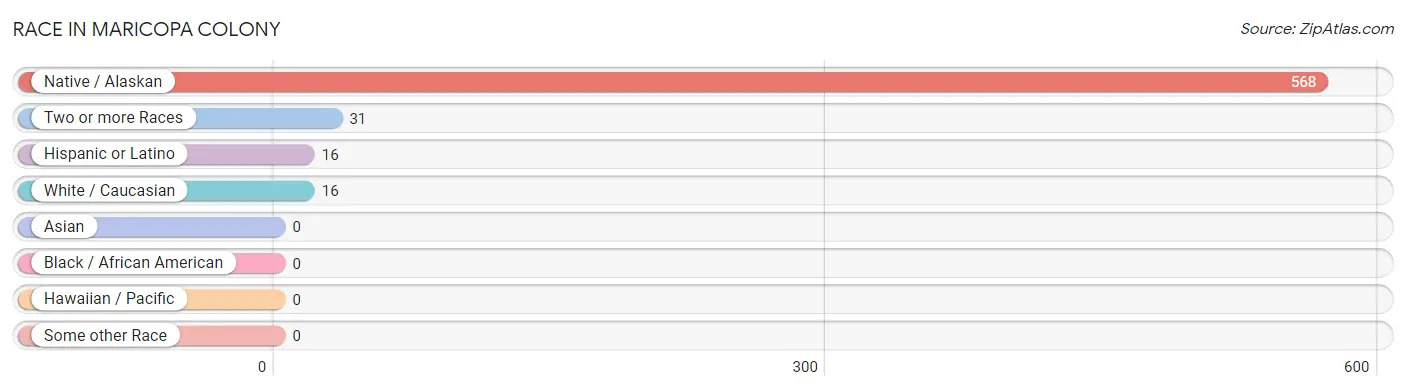
| Race | # Population | % Population |
| Asian | 0 | 0.0% |
| Black / African American | 0 | 0.0% |
| Hawaiian / Pacific | 0 | 0.0% |
| Hispanic or Latino | 16 | 2.6% |
| Native / Alaskan | 568 | 92.4% |
| White / Caucasian | 16 | 2.6% |
| Two or more Races | 31 | 5.0% |
| Some other Race | 0 | 0.0% |
| Total | 615 | 100.0% |
Ancestry in Maricopa Colony
The most populous ancestries reported in Maricopa Colony are Pima (528 | 85.9%), Navajo (48 | 7.8%), Mexican (16 | 2.6%), Yuman (10 | 1.6%), and Tohono O'Odham (9 | 1.5%), together accounting for 99.3% of all Maricopa Colony residents.
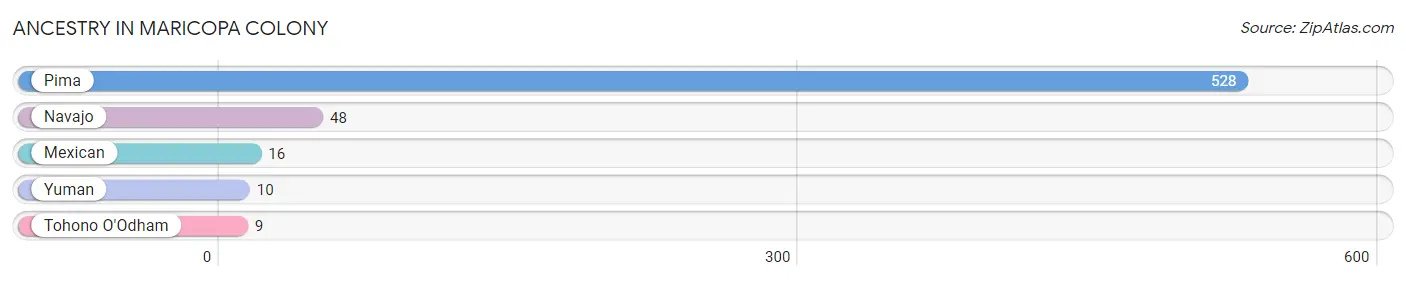
| Ancestry | # Population | % Population |
| Mexican | 16 | 2.6% |
| Navajo | 48 | 7.8% |
| Pima | 528 | 85.9% |
| Tohono O'Odham | 9 | 1.5% |
| Yuman | 10 | 1.6% | View All 5 Rows |
Immigrants in Maricopa Colony

| Immigration Origin | # Population | % Population | View All 0 Rows |
Sex and Age in Maricopa Colony
Sex and Age in Maricopa Colony
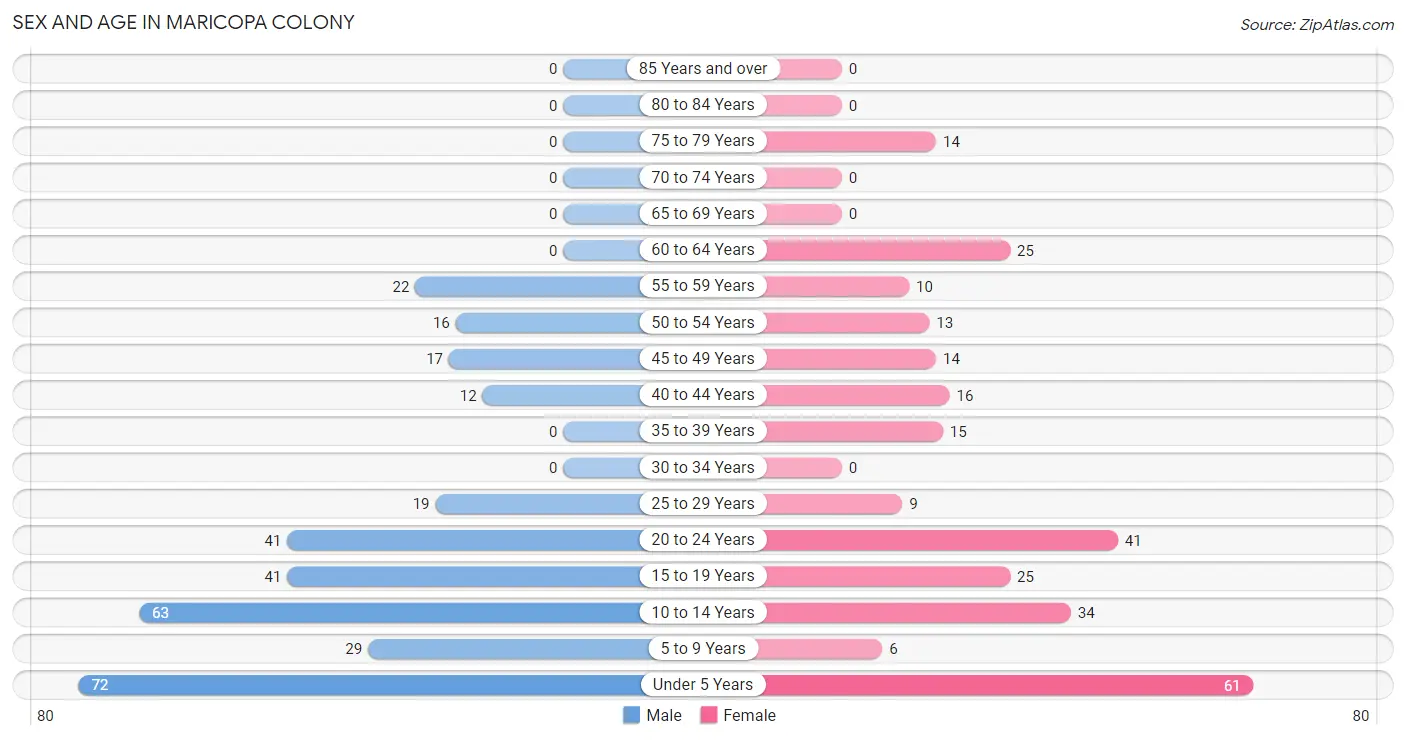
The most populous age groups in Maricopa Colony are Under 5 Years (72 | 21.7%) for men and Under 5 Years (61 | 21.5%) for women.
| Age Bracket | Male | Female |
| Under 5 Years | 72 (21.7%) | 61 (21.5%) |
| 5 to 9 Years | 29 (8.7%) | 6 (2.1%) |
| 10 to 14 Years | 63 (19.0%) | 34 (12.0%) |
| 15 to 19 Years | 41 (12.3%) | 25 (8.8%) |
| 20 to 24 Years | 41 (12.3%) | 41 (14.5%) |
| 25 to 29 Years | 19 (5.7%) | 9 (3.2%) |
| 30 to 34 Years | 0 (0.0%) | 0 (0.0%) |
| 35 to 39 Years | 0 (0.0%) | 15 (5.3%) |
| 40 to 44 Years | 12 (3.6%) | 16 (5.7%) |
| 45 to 49 Years | 17 (5.1%) | 14 (5.0%) |
| 50 to 54 Years | 16 (4.8%) | 13 (4.6%) |
| 55 to 59 Years | 22 (6.6%) | 10 (3.5%) |
| 60 to 64 Years | 0 (0.0%) | 25 (8.8%) |
| 65 to 69 Years | 0 (0.0%) | 0 (0.0%) |
| 70 to 74 Years | 0 (0.0%) | 0 (0.0%) |
| 75 to 79 Years | 0 (0.0%) | 14 (5.0%) |
| 80 to 84 Years | 0 (0.0%) | 0 (0.0%) |
| 85 Years and over | 0 (0.0%) | 0 (0.0%) |
| Total | 332 (100.0%) | 283 (100.0%) |
Families and Households in Maricopa Colony
Median Family Size in Maricopa Colony
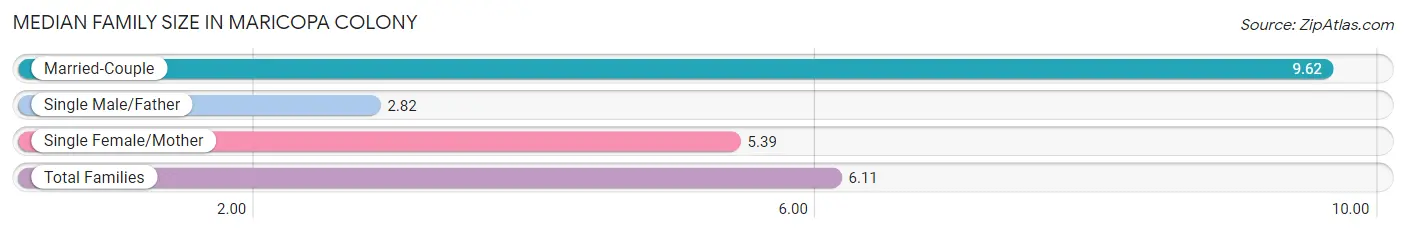
The median family size in Maricopa Colony is 6.11 persons per family, with married-couple families (26 | 28.3%) accounting for the largest median family size of 9.62 persons per family. On the other hand, single male/father families (17 | 18.5%) represent the smallest median family size with 2.82 persons per family.
| Family Type | # Families | Family Size |
| Married-Couple | 26 (28.3%) | 9.62 |
| Single Male/Father | 17 (18.5%) | 2.82 |
| Single Female/Mother | 49 (53.3%) | 5.39 |
| Total Families | 92 (100.0%) | 6.11 |
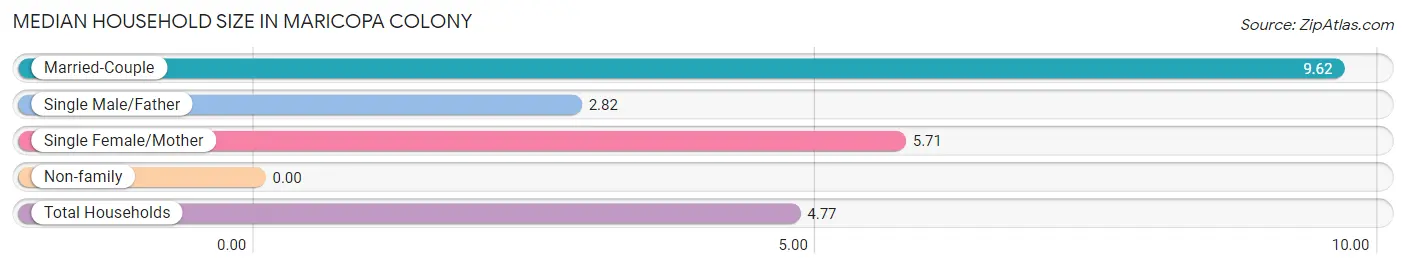
Median Household Size in Maricopa Colony
| Household Type | # Households | Household Size |
| Married-Couple | 26 (20.2%) | 9.62 |
| Single Male/Father | 17 (13.2%) | 2.82 |
| Single Female/Mother | 49 (38.0%) | 5.71 |
| Non-family | 37 (28.7%) | - |
| Total Households | 129 (100.0%) | 4.77 |
Household Size by Marriage Status in Maricopa Colony
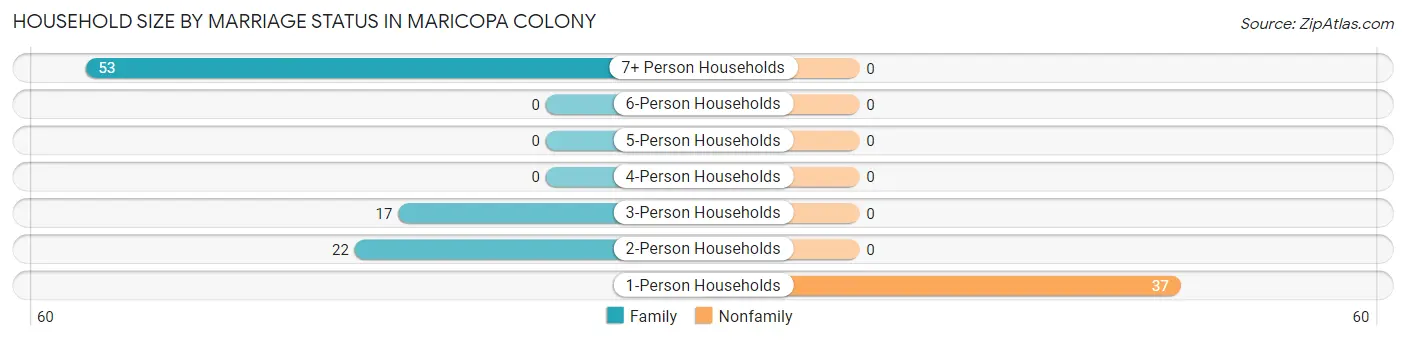
Out of a total of 129 households in Maricopa Colony, 92 (71.3%) are family households, while 37 (28.7%) are nonfamily households. The most numerous type of family households are 7+ person households, comprising 53, and the most common type of nonfamily households are 1-person households, comprising 37.
| Household Size | Family Households | Nonfamily Households |
| 1-Person Households | - | 37 (28.7%) |
| 2-Person Households | 22 (17.1%) | 0 (0.0%) |
| 3-Person Households | 17 (13.2%) | 0 (0.0%) |
| 4-Person Households | 0 (0.0%) | 0 (0.0%) |
| 5-Person Households | 0 (0.0%) | 0 (0.0%) |
| 6-Person Households | 0 (0.0%) | 0 (0.0%) |
| 7+ Person Households | 53 (41.1%) | 0 (0.0%) |
| Total | 92 (71.3%) | 37 (28.7%) |
Female Fertility in Maricopa Colony
Fertility by Age in Maricopa Colony
Average fertility rate in Maricopa Colony is 342.0 births per 1,000 women. Women in the age bracket of 20 to 34 years have the highest fertility rate with 640.0 births per 1,000 women. Women in the age bracket of 20 to 34 years acount for 78.0% of all women with births.
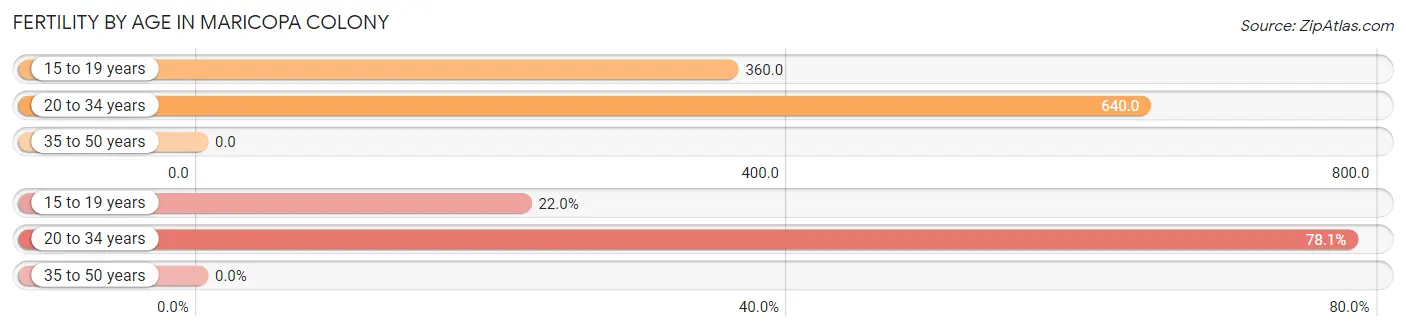
| Age Bracket | Women with Births | Births / 1,000 Women |
| 15 to 19 years | 9 (22.0%) | 360.0 |
| 20 to 34 years | 32 (78.0%) | 640.0 |
| 35 to 50 years | 0 (0.0%) | 0.0 |
| Total | 41 (100.0%) | 342.0 |
Fertility by Age by Marriage Status in Maricopa Colony
36.6% of women with births (41) in Maricopa Colony are married. The highest percentage of unmarried women with births falls into 15 to 19 years age bracket with 100.0% of them unmarried at the time of birth, while the lowest percentage of unmarried women with births belong to 20 to 34 years age bracket with 53.1% of them unmarried.
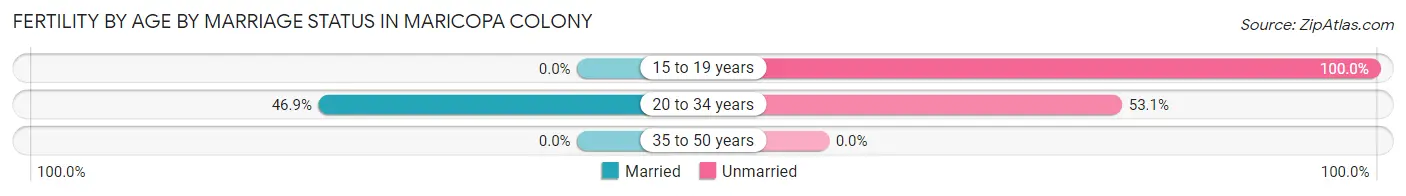
| Age Bracket | Married | Unmarried |
| 15 to 19 years | 0 (0.0%) | 9 (100.0%) |
| 20 to 34 years | 15 (46.9%) | 17 (53.1%) |
| 35 to 50 years | 0 (0.0%) | 0 (0.0%) |
| Total | 15 (36.6%) | 26 (63.4%) |
Fertility by Education in Maricopa Colony
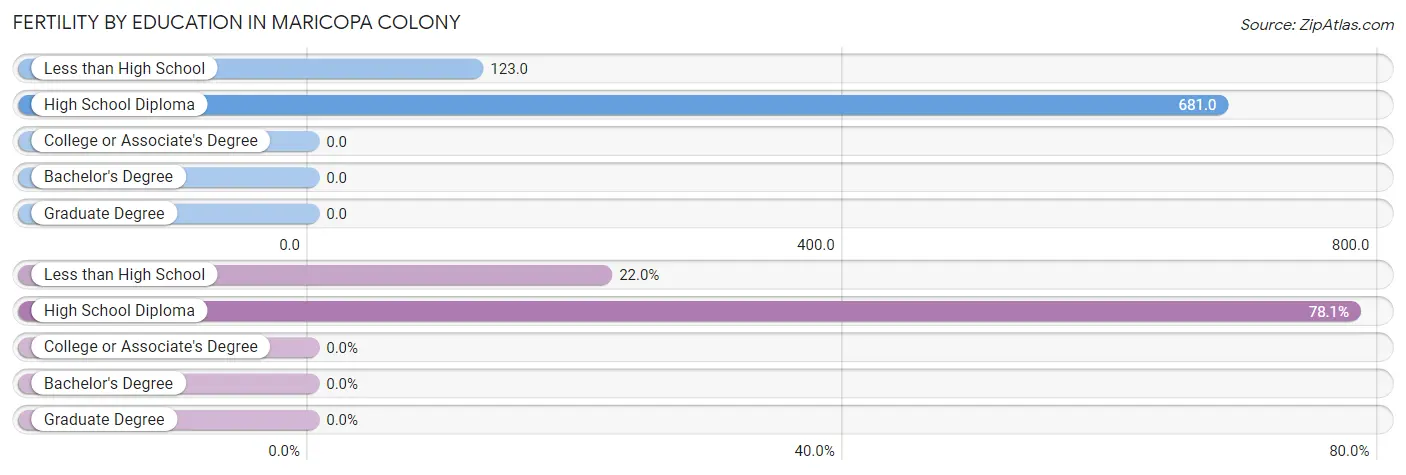
| Educational Attainment | Women with Births | Births / 1,000 Women |
| Less than High School | 9 (22.0%) | 123.0 |
| High School Diploma | 32 (78.0%) | 681.0 |
| College or Associate's Degree | 0 (0.0%) | 0.0 |
| Bachelor's Degree | 0 (0.0%) | 0.0 |
| Graduate Degree | 0 (0.0%) | 0.0 |
| Total | 41 (100.0%) | 342.0 |
Fertility by Education by Marriage Status in Maricopa Colony
63.4% of women with births in Maricopa Colony are unmarried. Women with the educational attainment of high school diploma are most likely to be married with 46.9% of them married at childbirth, while women with the educational attainment of less than high school are least likely to be married with 100.0% of them unmarried at childbirth.
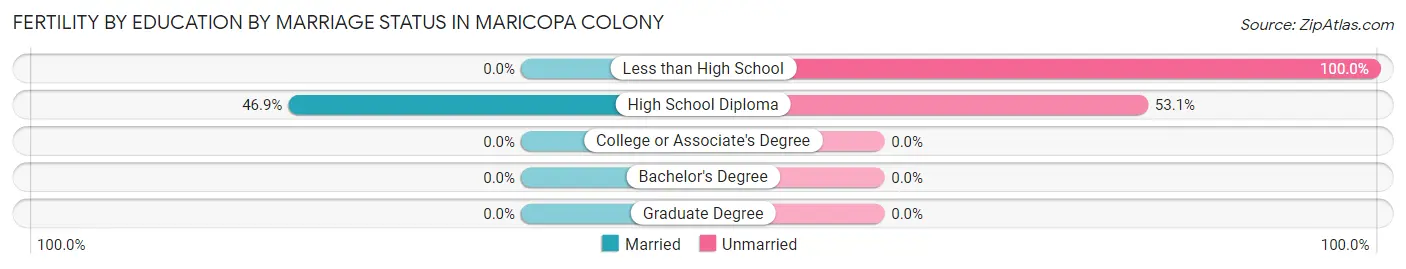
| Educational Attainment | Married | Unmarried |
| Less than High School | 0 (0.0%) | 9 (100.0%) |
| High School Diploma | 15 (46.9%) | 17 (53.1%) |
| College or Associate's Degree | 0 (0.0%) | 0 (0.0%) |
| Bachelor's Degree | 0 (0.0%) | 0 (0.0%) |
| Graduate Degree | 0 (0.0%) | 0 (0.0%) |
| Total | 15 (36.6%) | 26 (63.4%) |
Employment Characteristics in Maricopa Colony
Employment by Class of Employer in Maricopa Colony
Among the 71 employed individuals in Maricopa Colony, private company employees (42 | 59.2%), not-for-profit organizations (17 | 23.9%), and local government employees (12 | 16.9%) make up the most common classes of employment.
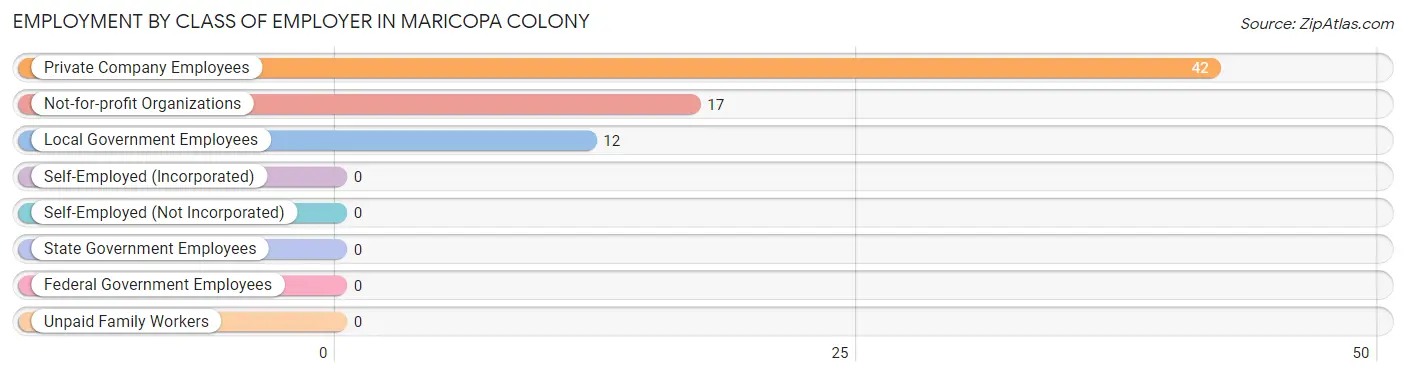
| Employer Class | # Employees | % Employees |
| Private Company Employees | 42 | 59.2% |
| Self-Employed (Incorporated) | 0 | 0.0% |
| Self-Employed (Not Incorporated) | 0 | 0.0% |
| Not-for-profit Organizations | 17 | 23.9% |
| Local Government Employees | 12 | 16.9% |
| State Government Employees | 0 | 0.0% |
| Federal Government Employees | 0 | 0.0% |
| Unpaid Family Workers | 0 | 0.0% |
| Total | 71 | 100.0% |
Employment Status by Age in Maricopa Colony
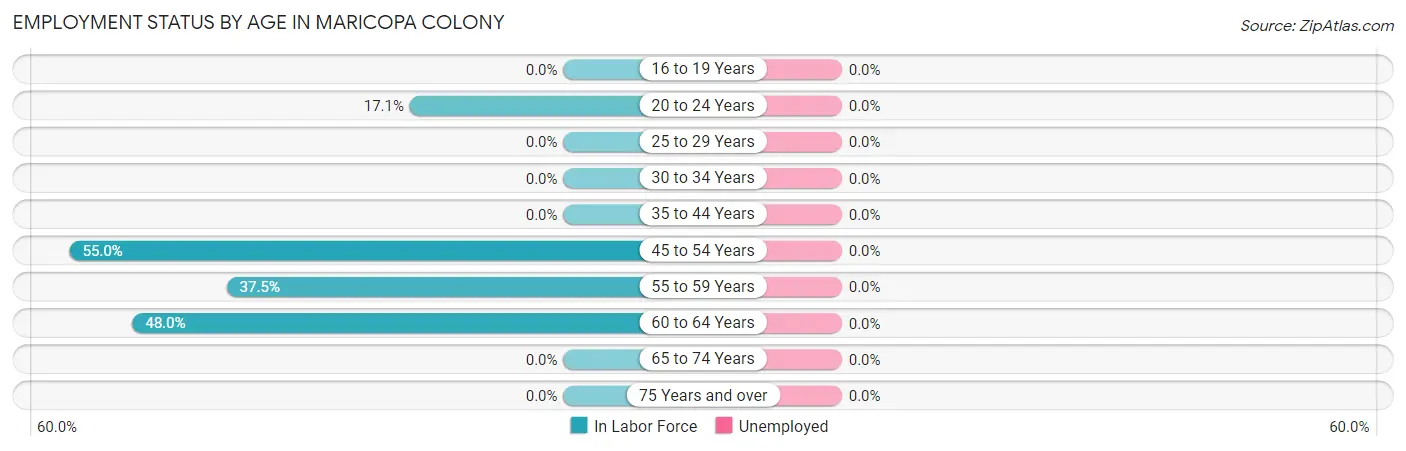
| Age Bracket | In Labor Force | Unemployed |
| 16 to 19 Years | 0 (0.0%) | 0 (0.0%) |
| 20 to 24 Years | 14 (17.1%) | 0 (0.0%) |
| 25 to 29 Years | 0 (0.0%) | 0 (0.0%) |
| 30 to 34 Years | 0 (0.0%) | 0 (0.0%) |
| 35 to 44 Years | 0 (0.0%) | 0 (0.0%) |
| 45 to 54 Years | 33 (55.0%) | 0 (0.0%) |
| 55 to 59 Years | 12 (37.5%) | 0 (0.0%) |
| 60 to 64 Years | 12 (48.0%) | 0 (0.0%) |
| 65 to 74 Years | 0 (0.0%) | 0 (0.0%) |
| 75 Years and over | 0 (0.0%) | 0 (0.0%) |
| Total | 71 (21.3%) | 0 (0.0%) |
Employment Status by Educational Attainment in Maricopa Colony
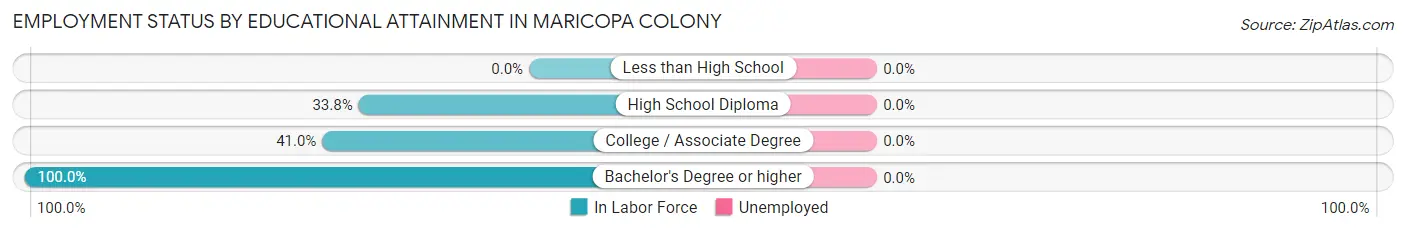
| Educational Attainment | In Labor Force | Unemployed |
| Less than High School | 0 (0.0%) | 0 (0.0%) |
| High School Diploma | 24 (33.8%) | 0 (0.0%) |
| College / Associate Degree | 16 (41.0%) | 0 (0.0%) |
| Bachelor's Degree or higher | 17 (100.0%) | 0 (0.0%) |
| Total | 57 (30.3%) | 0 (0.0%) |
Employment Occupations by Sex in Maricopa Colony
Management, Business, Science and Arts Occupations
The most common Management, Business, Science and Arts occupations in Maricopa Colony are Community & Social Service (12 | 16.9%), and Education, Arts & Media (12 | 16.9%).
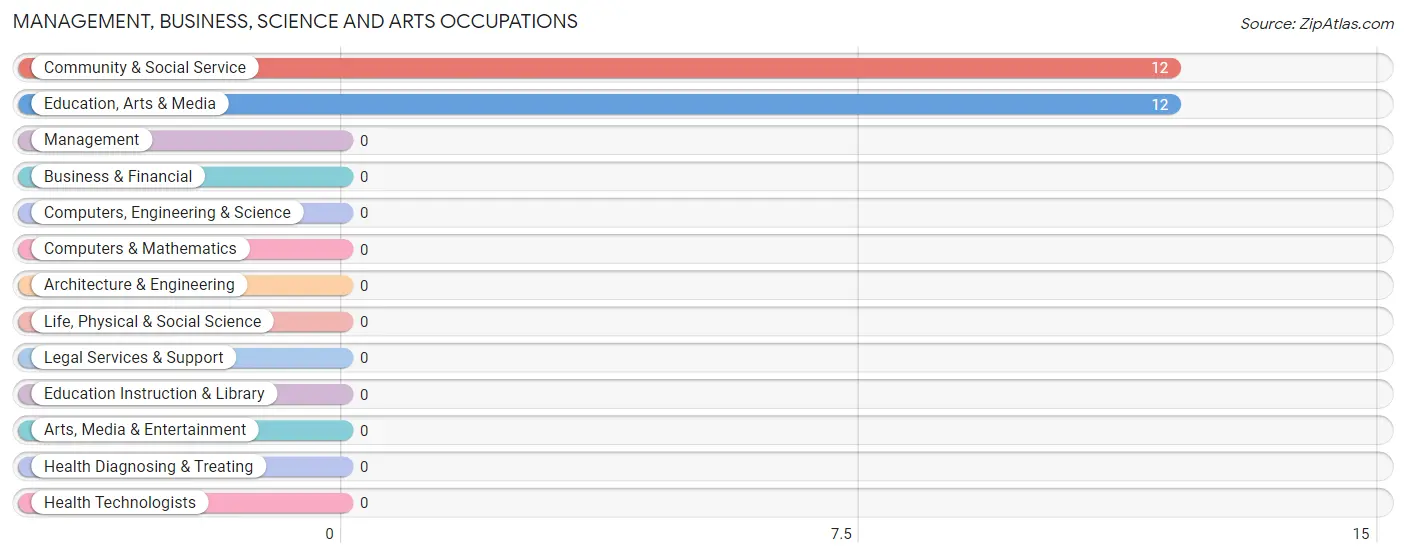
Management, Business, Science and Arts Occupations by Sex
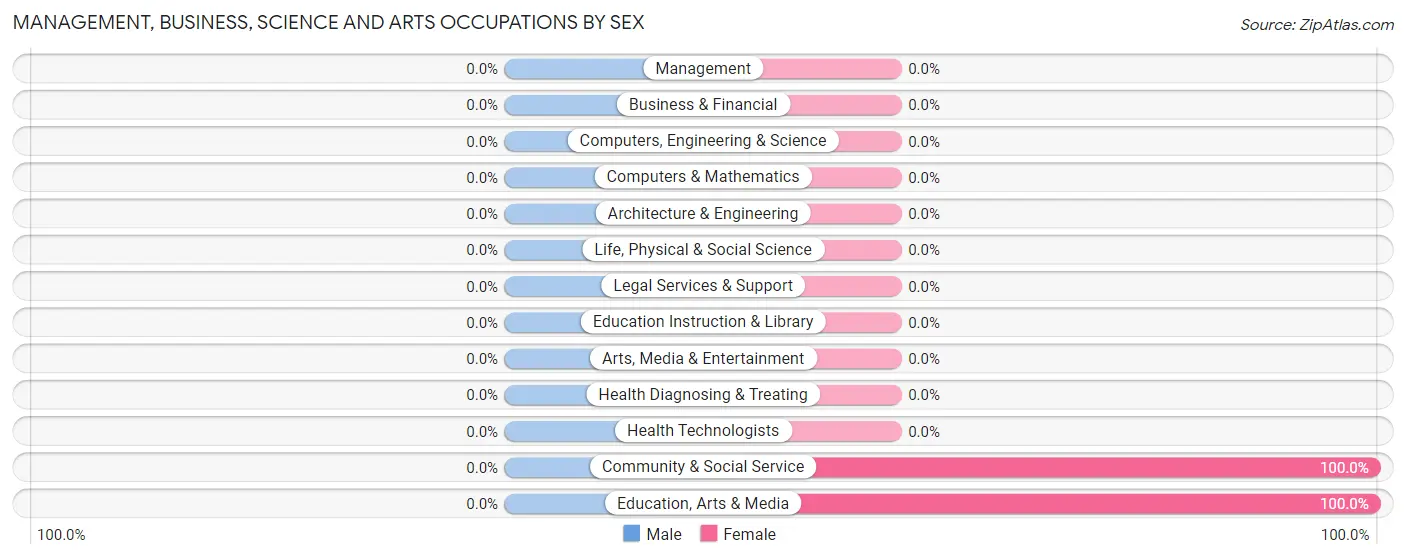
| Occupation | Male | Female |
| Management | 0 (0.0%) | 0 (0.0%) |
| Business & Financial | 0 (0.0%) | 0 (0.0%) |
| Computers, Engineering & Science | 0 (0.0%) | 0 (0.0%) |
| Computers & Mathematics | 0 (0.0%) | 0 (0.0%) |
| Architecture & Engineering | 0 (0.0%) | 0 (0.0%) |
| Life, Physical & Social Science | 0 (0.0%) | 0 (0.0%) |
| Community & Social Service | 0 (0.0%) | 12 (100.0%) |
| Education, Arts & Media | 0 (0.0%) | 12 (100.0%) |
| Legal Services & Support | 0 (0.0%) | 0 (0.0%) |
| Education Instruction & Library | 0 (0.0%) | 0 (0.0%) |
| Arts, Media & Entertainment | 0 (0.0%) | 0 (0.0%) |
| Health Diagnosing & Treating | 0 (0.0%) | 0 (0.0%) |
| Health Technologists | 0 (0.0%) | 0 (0.0%) |
| Total (Category) | 0 (0.0%) | 12 (100.0%) |
| Total (Overall) | 59 (83.1%) | 12 (16.9%) |
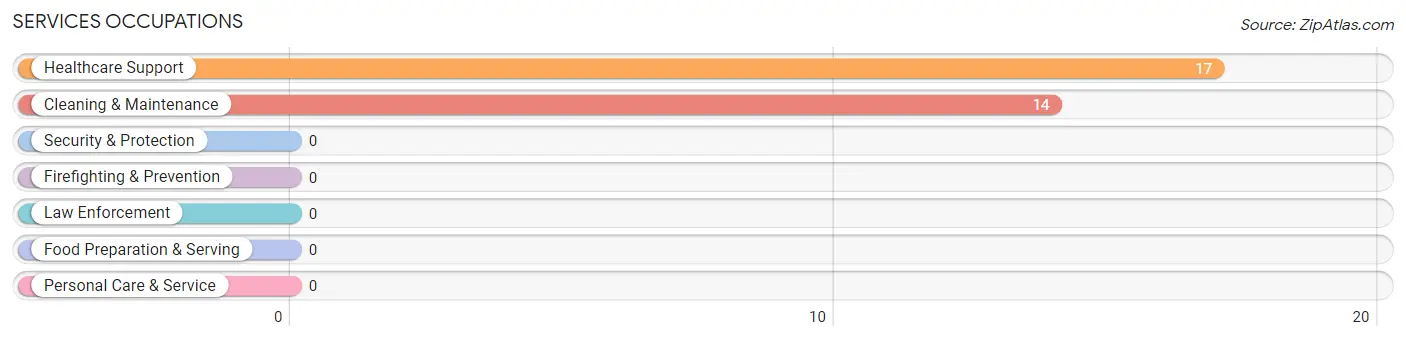
Services Occupations
The most common Services occupations in Maricopa Colony are Healthcare Support (17 | 23.9%), and Cleaning & Maintenance (14 | 19.7%).
Services Occupations by Sex
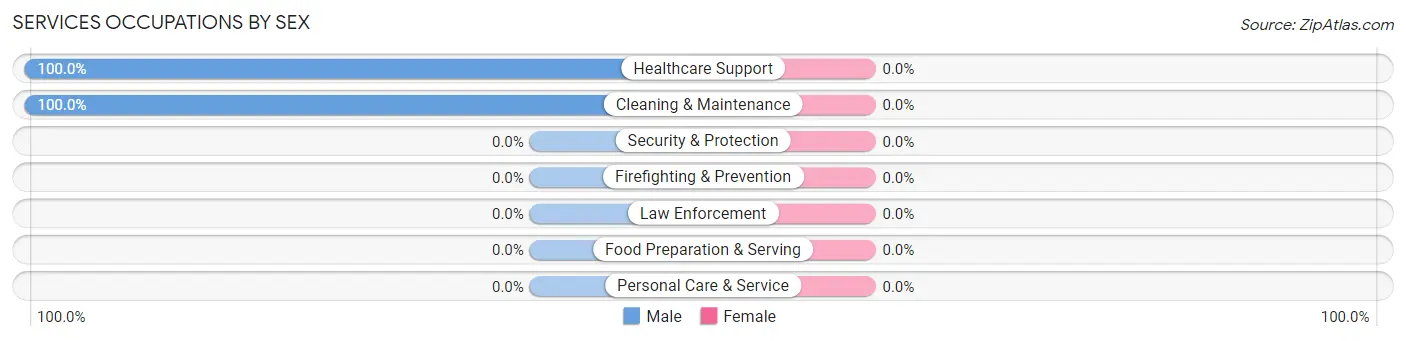
| Occupation | Male | Female |
| Healthcare Support | 17 (100.0%) | 0 (0.0%) |
| Security & Protection | 0 (0.0%) | 0 (0.0%) |
| Firefighting & Prevention | 0 (0.0%) | 0 (0.0%) |
| Law Enforcement | 0 (0.0%) | 0 (0.0%) |
| Food Preparation & Serving | 0 (0.0%) | 0 (0.0%) |
| Cleaning & Maintenance | 14 (100.0%) | 0 (0.0%) |
| Personal Care & Service | 0 (0.0%) | 0 (0.0%) |
| Total (Category) | 31 (100.0%) | 0 (0.0%) |
| Total (Overall) | 59 (83.1%) | 12 (16.9%) |
Sales and Office Occupations
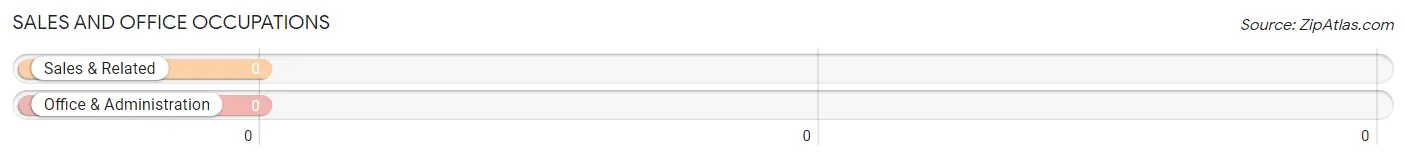
Sales and Office Occupations by Sex
| Occupation | Male | Female |
| Sales & Related | 0 (0.0%) | 0 (0.0%) |
| Office & Administration | 0 (0.0%) | 0 (0.0%) |
| Total (Category) | 0 (0.0%) | 0 (0.0%) |
| Total (Overall) | 59 (83.1%) | 12 (16.9%) |
Natural Resources, Construction and Maintenance Occupations
The most common Natural Resources, Construction and Maintenance occupations in Maricopa Colony are , and Construction & Extraction (12 | 16.9%).
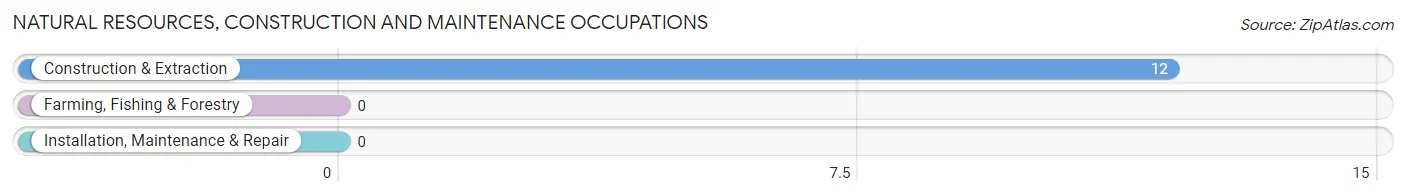
Natural Resources, Construction and Maintenance Occupations by Sex
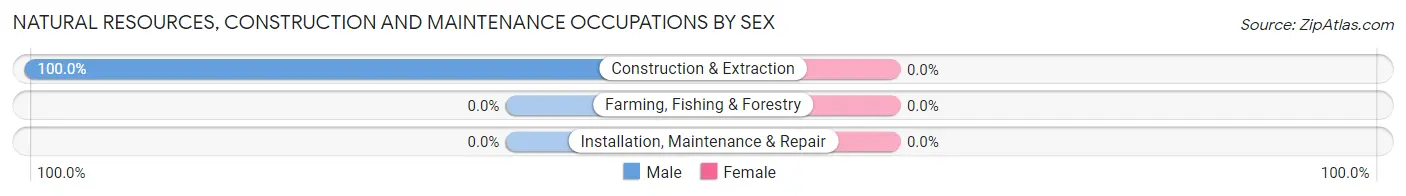
| Occupation | Male | Female |
| Farming, Fishing & Forestry | 0 (0.0%) | 0 (0.0%) |
| Construction & Extraction | 12 (100.0%) | 0 (0.0%) |
| Installation, Maintenance & Repair | 0 (0.0%) | 0 (0.0%) |
| Total (Category) | 12 (100.0%) | 0 (0.0%) |
| Total (Overall) | 59 (83.1%) | 12 (16.9%) |
Production, Transportation and Moving Occupations
The most common Production, Transportation and Moving occupations in Maricopa Colony are , and Transportation (16 | 22.5%).
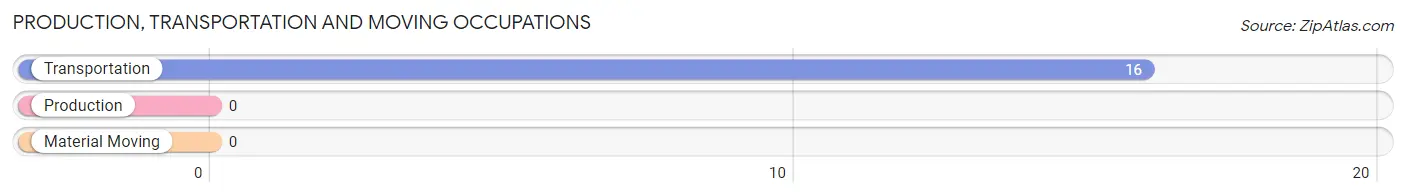
Production, Transportation and Moving Occupations by Sex
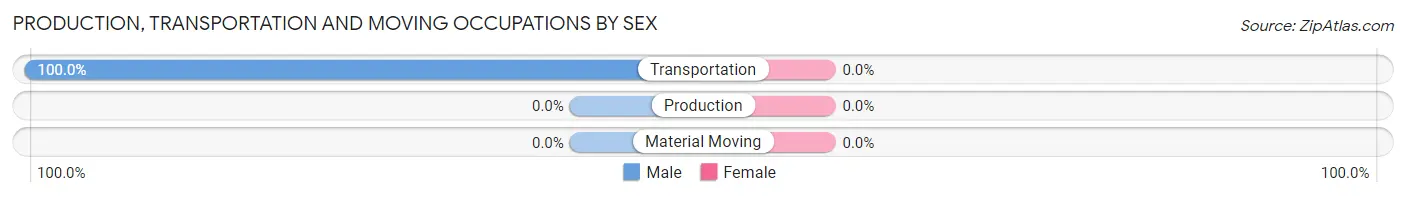
| Occupation | Male | Female |
| Production | 0 (0.0%) | 0 (0.0%) |
| Transportation | 16 (100.0%) | 0 (0.0%) |
| Material Moving | 0 (0.0%) | 0 (0.0%) |
| Total (Category) | 16 (100.0%) | 0 (0.0%) |
| Total (Overall) | 59 (83.1%) | 12 (16.9%) |
Employment Industries by Sex in Maricopa Colony
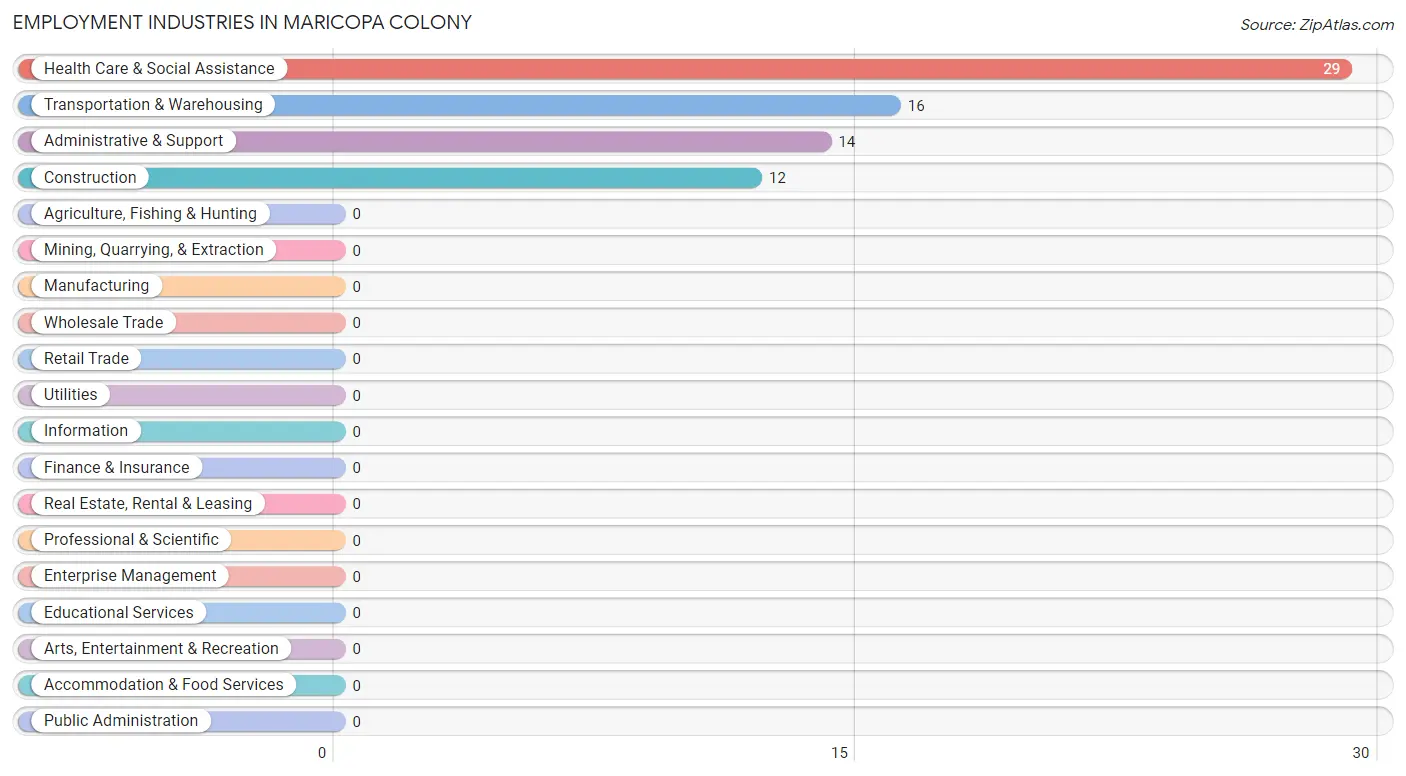
Employment Industries in Maricopa Colony
The major employment industries in Maricopa Colony include Health Care & Social Assistance (29 | 40.8%), Transportation & Warehousing (16 | 22.5%), Administrative & Support (14 | 19.7%), and Construction (12 | 16.9%).
Employment Industries by Sex in Maricopa Colony
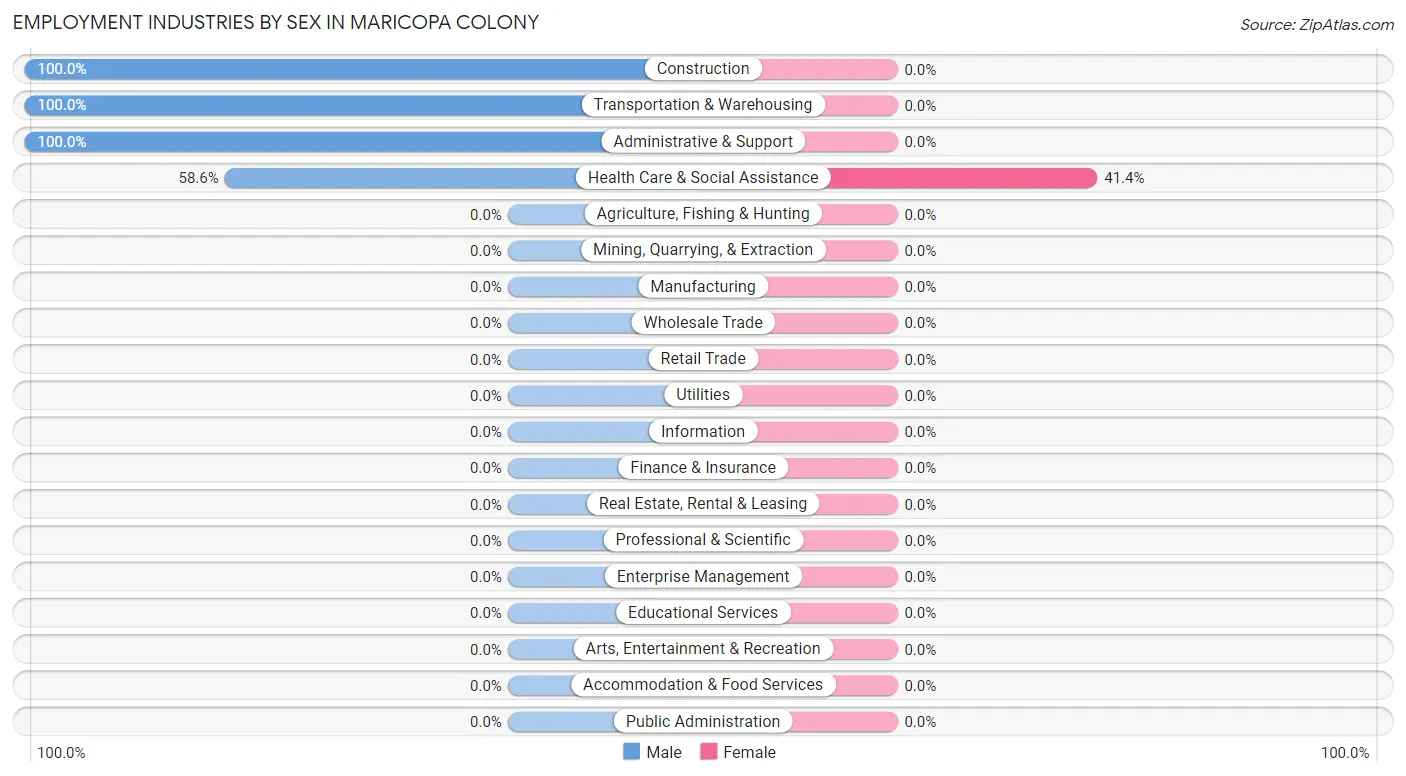
| Industry | Male | Female |
| Agriculture, Fishing & Hunting | 0 (0.0%) | 0 (0.0%) |
| Mining, Quarrying, & Extraction | 0 (0.0%) | 0 (0.0%) |
| Construction | 12 (100.0%) | 0 (0.0%) |
| Manufacturing | 0 (0.0%) | 0 (0.0%) |
| Wholesale Trade | 0 (0.0%) | 0 (0.0%) |
| Retail Trade | 0 (0.0%) | 0 (0.0%) |
| Transportation & Warehousing | 16 (100.0%) | 0 (0.0%) |
| Utilities | 0 (0.0%) | 0 (0.0%) |
| Information | 0 (0.0%) | 0 (0.0%) |
| Finance & Insurance | 0 (0.0%) | 0 (0.0%) |
| Real Estate, Rental & Leasing | 0 (0.0%) | 0 (0.0%) |
| Professional & Scientific | 0 (0.0%) | 0 (0.0%) |
| Enterprise Management | 0 (0.0%) | 0 (0.0%) |
| Administrative & Support | 14 (100.0%) | 0 (0.0%) |
| Educational Services | 0 (0.0%) | 0 (0.0%) |
| Health Care & Social Assistance | 17 (58.6%) | 12 (41.4%) |
| Arts, Entertainment & Recreation | 0 (0.0%) | 0 (0.0%) |
| Accommodation & Food Services | 0 (0.0%) | 0 (0.0%) |
| Public Administration | 0 (0.0%) | 0 (0.0%) |
| Total | 59 (83.1%) | 12 (16.9%) |
Education in Maricopa Colony
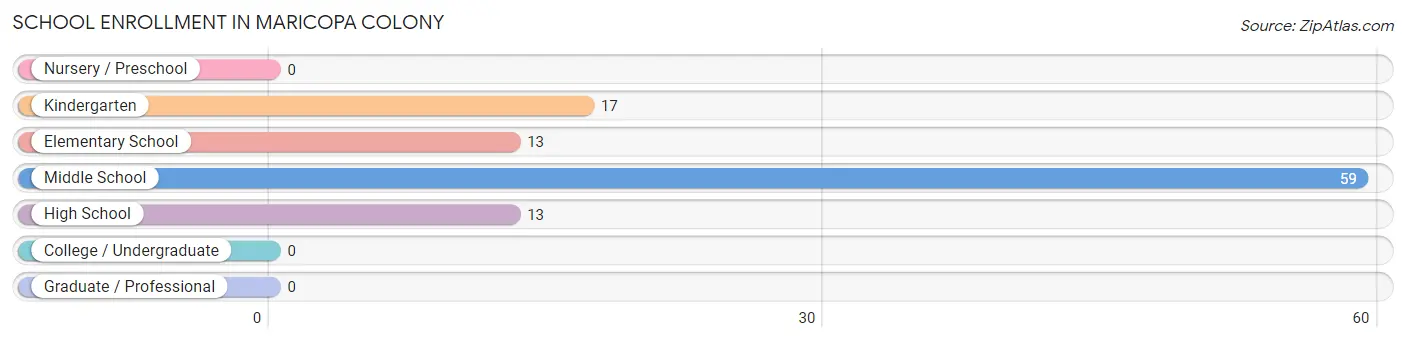
School Enrollment in Maricopa Colony
The most common levels of schooling among the 102 students in Maricopa Colony are middle school (59 | 57.8%), kindergarten (17 | 16.7%), and elementary school (13 | 12.8%).
| School Level | # Students | % Students |
| Nursery / Preschool | 0 | 0.0% |
| Kindergarten | 17 | 16.7% |
| Elementary School | 13 | 12.8% |
| Middle School | 59 | 57.8% |
| High School | 13 | 12.8% |
| College / Undergraduate | 0 | 0.0% |
| Graduate / Professional | 0 | 0.0% |
| Total | 102 | 100.0% |
School Enrollment by Age by Funding Source in Maricopa Colony
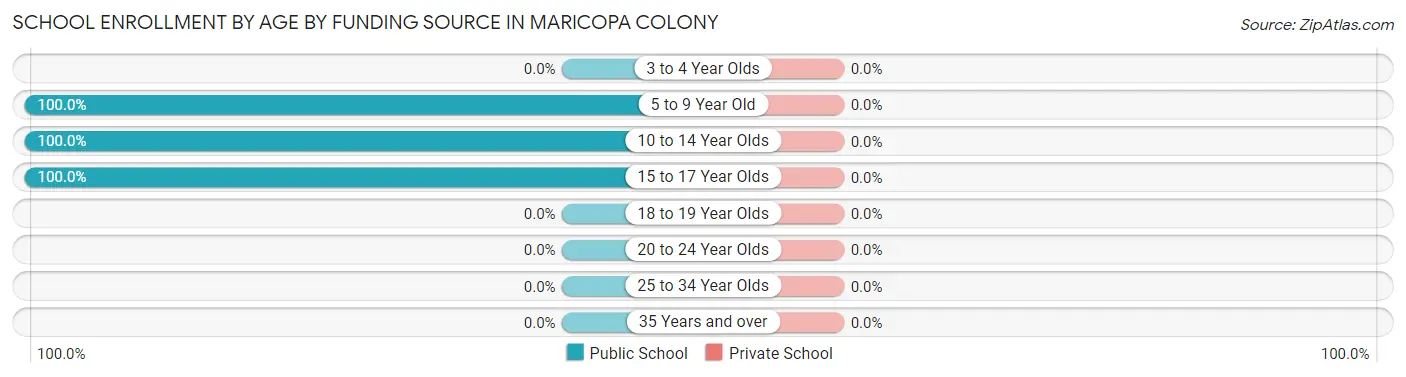
| Age Bracket | Public School | Private School |
| 3 to 4 Year Olds | 0 (0.0%) | 0 (0.0%) |
| 5 to 9 Year Old | 17 (100.0%) | 0 (0.0%) |
| 10 to 14 Year Olds | 72 (100.0%) | 0 (0.0%) |
| 15 to 17 Year Olds | 13 (100.0%) | 0 (0.0%) |
| 18 to 19 Year Olds | 0 (0.0%) | 0 (0.0%) |
| 20 to 24 Year Olds | 0 (0.0%) | 0 (0.0%) |
| 25 to 34 Year Olds | 0 (0.0%) | 0 (0.0%) |
| 35 Years and over | 0 (0.0%) | 0 (0.0%) |
| Total | 102 (100.0%) | 0 (0.0%) |
Educational Attainment by Field of Study in Maricopa Colony
, and business (17 | 100.0%) are the most common fields of study among 17 individuals in Maricopa Colony who have obtained a bachelor's degree or higher.
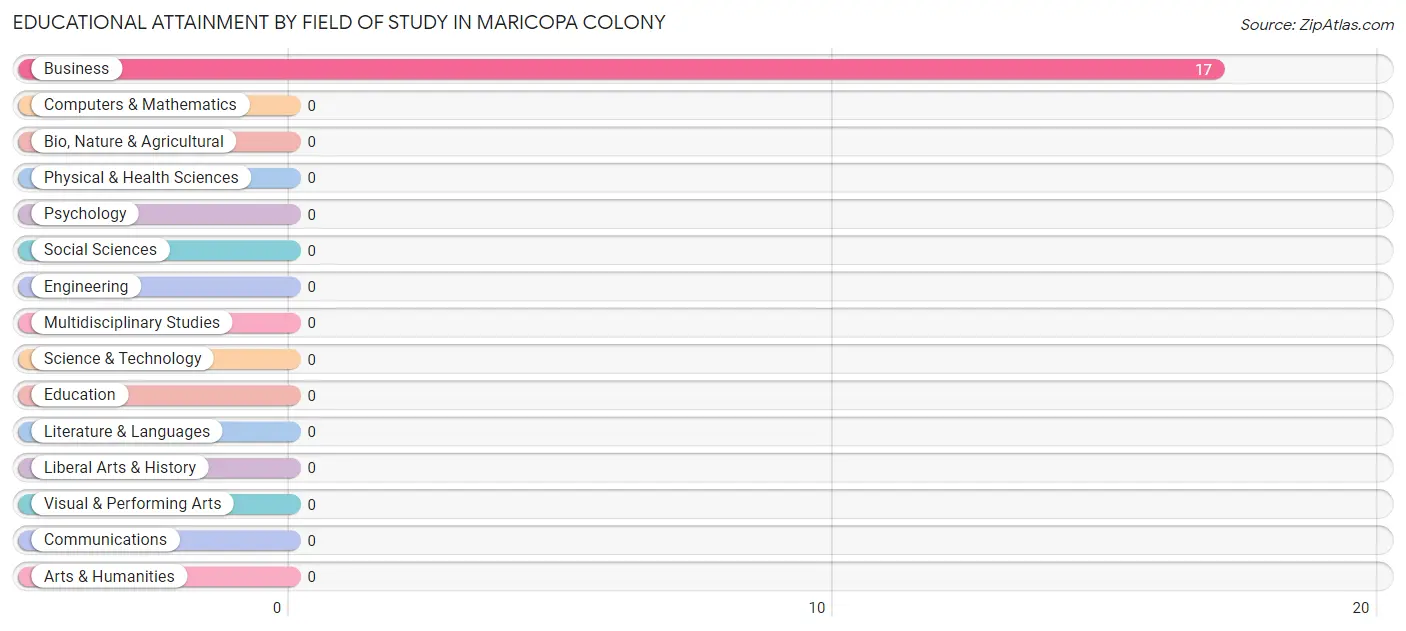
| Field of Study | # Graduates | % Graduates |
| Computers & Mathematics | 0 | 0.0% |
| Bio, Nature & Agricultural | 0 | 0.0% |
| Physical & Health Sciences | 0 | 0.0% |
| Psychology | 0 | 0.0% |
| Social Sciences | 0 | 0.0% |
| Engineering | 0 | 0.0% |
| Multidisciplinary Studies | 0 | 0.0% |
| Science & Technology | 0 | 0.0% |
| Business | 17 | 100.0% |
| Education | 0 | 0.0% |
| Literature & Languages | 0 | 0.0% |
| Liberal Arts & History | 0 | 0.0% |
| Visual & Performing Arts | 0 | 0.0% |
| Communications | 0 | 0.0% |
| Arts & Humanities | 0 | 0.0% |
| Total | 17 | 100.0% |
Transportation & Commute in Maricopa Colony
Vehicle Availability by Sex in Maricopa Colony
The most prevalent vehicle ownership categories in Maricopa Colony are males with 1 vehicle (59, accounting for 100.0%) and females with 1 vehicle (12, making up 491.7%).
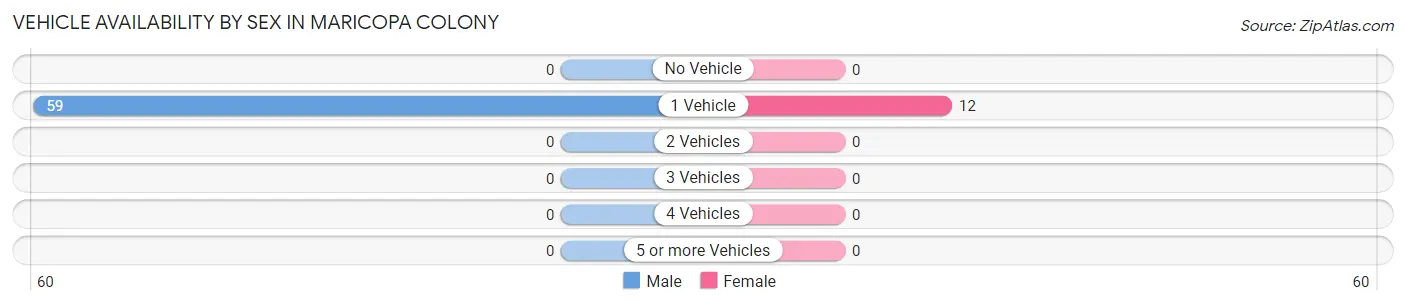
| Vehicles Available | Male | Female |
| No Vehicle | 0 (0.0%) | 0 (0.0%) |
| 1 Vehicle | 59 (100.0%) | 12 (100.0%) |
| 2 Vehicles | 0 (0.0%) | 0 (0.0%) |
| 3 Vehicles | 0 (0.0%) | 0 (0.0%) |
| 4 Vehicles | 0 (0.0%) | 0 (0.0%) |
| 5 or more Vehicles | 0 (0.0%) | 0 (0.0%) |
| Total | 59 (100.0%) | 12 (100.0%) |
Commute Time in Maricopa Colony
The most frequently occuring commute durations in Maricopa Colony are 30 to 34 minutes (26 commuters, 36.6%), 15 to 19 minutes (17 commuters, 23.9%), and 20 to 24 minutes (16 commuters, 22.5%).
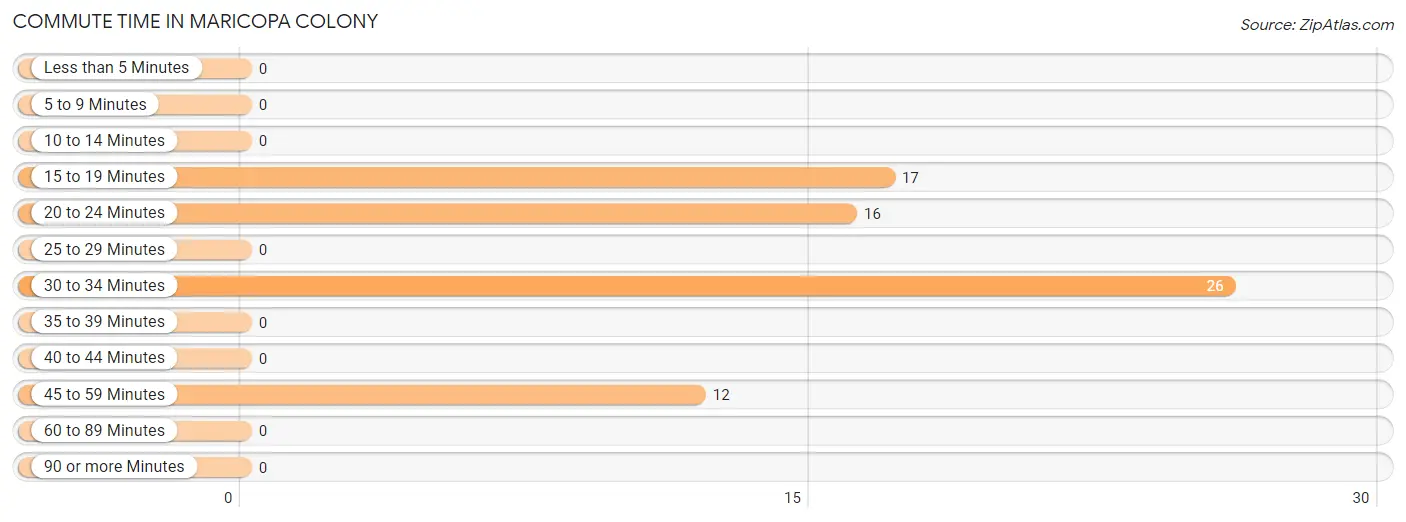
| Commute Time | # Commuters | % Commuters |
| Less than 5 Minutes | 0 | 0.0% |
| 5 to 9 Minutes | 0 | 0.0% |
| 10 to 14 Minutes | 0 | 0.0% |
| 15 to 19 Minutes | 17 | 23.9% |
| 20 to 24 Minutes | 16 | 22.5% |
| 25 to 29 Minutes | 0 | 0.0% |
| 30 to 34 Minutes | 26 | 36.6% |
| 35 to 39 Minutes | 0 | 0.0% |
| 40 to 44 Minutes | 0 | 0.0% |
| 45 to 59 Minutes | 12 | 16.9% |
| 60 to 89 Minutes | 0 | 0.0% |
| 90 or more Minutes | 0 | 0.0% |
Commute Time by Sex in Maricopa Colony
The most common commute times in Maricopa Colony are 30 to 34 minutes (26 commuters, 44.1%) for males and 45 to 59 minutes (12 commuters, 100.0%) for females.
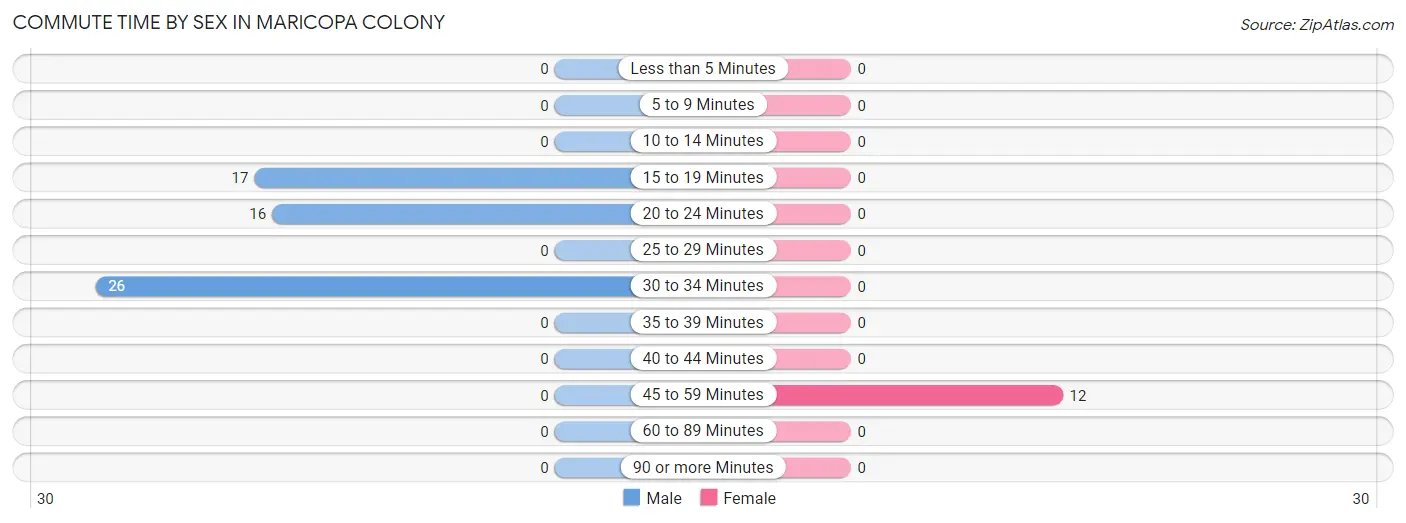
| Commute Time | Male | Female |
| Less than 5 Minutes | 0 (0.0%) | 0 (0.0%) |
| 5 to 9 Minutes | 0 (0.0%) | 0 (0.0%) |
| 10 to 14 Minutes | 0 (0.0%) | 0 (0.0%) |
| 15 to 19 Minutes | 17 (28.8%) | 0 (0.0%) |
| 20 to 24 Minutes | 16 (27.1%) | 0 (0.0%) |
| 25 to 29 Minutes | 0 (0.0%) | 0 (0.0%) |
| 30 to 34 Minutes | 26 (44.1%) | 0 (0.0%) |
| 35 to 39 Minutes | 0 (0.0%) | 0 (0.0%) |
| 40 to 44 Minutes | 0 (0.0%) | 0 (0.0%) |
| 45 to 59 Minutes | 0 (0.0%) | 12 (100.0%) |
| 60 to 89 Minutes | 0 (0.0%) | 0 (0.0%) |
| 90 or more Minutes | 0 (0.0%) | 0 (0.0%) |
Time of Departure to Work by Sex in Maricopa Colony
The most frequent times of departure to work in Maricopa Colony are 5:30 AM to 5:59 AM (26, 44.1%) for males and 6:00 AM to 6:29 AM (12, 100.0%) for females.
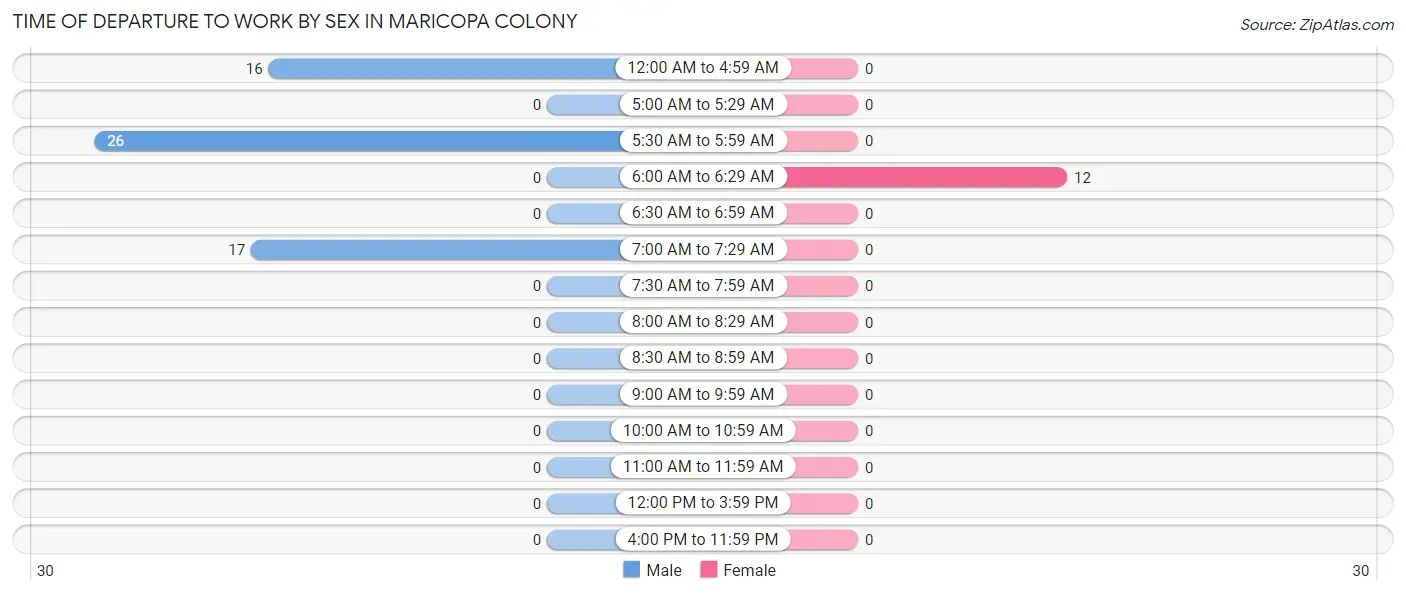
| Time of Departure | Male | Female |
| 12:00 AM to 4:59 AM | 16 (27.1%) | 0 (0.0%) |
| 5:00 AM to 5:29 AM | 0 (0.0%) | 0 (0.0%) |
| 5:30 AM to 5:59 AM | 26 (44.1%) | 0 (0.0%) |
| 6:00 AM to 6:29 AM | 0 (0.0%) | 12 (100.0%) |
| 6:30 AM to 6:59 AM | 0 (0.0%) | 0 (0.0%) |
| 7:00 AM to 7:29 AM | 17 (28.8%) | 0 (0.0%) |
| 7:30 AM to 7:59 AM | 0 (0.0%) | 0 (0.0%) |
| 8:00 AM to 8:29 AM | 0 (0.0%) | 0 (0.0%) |
| 8:30 AM to 8:59 AM | 0 (0.0%) | 0 (0.0%) |
| 9:00 AM to 9:59 AM | 0 (0.0%) | 0 (0.0%) |
| 10:00 AM to 10:59 AM | 0 (0.0%) | 0 (0.0%) |
| 11:00 AM to 11:59 AM | 0 (0.0%) | 0 (0.0%) |
| 12:00 PM to 3:59 PM | 0 (0.0%) | 0 (0.0%) |
| 4:00 PM to 11:59 PM | 0 (0.0%) | 0 (0.0%) |
| Total | 59 (100.0%) | 12 (100.0%) |
Housing Occupancy in Maricopa Colony
Occupancy by Ownership in Maricopa Colony
Of the total 129 dwellings in Maricopa Colony, owner-occupied units account for 80 (62.0%), while renter-occupied units make up 49 (38.0%).
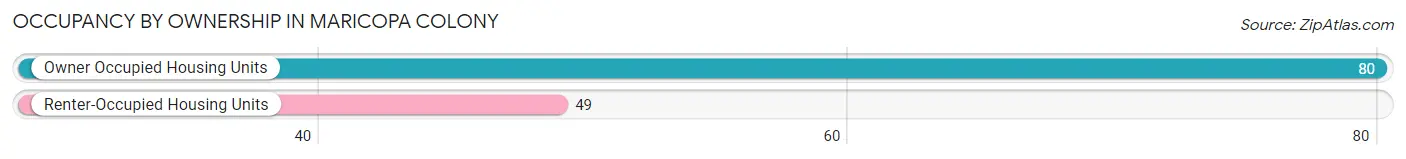
| Occupancy | # Housing Units | % Housing Units |
| Owner Occupied Housing Units | 80 | 62.0% |
| Renter-Occupied Housing Units | 49 | 38.0% |
| Total Occupied Housing Units | 129 | 100.0% |
Occupancy by Household Size in Maricopa Colony
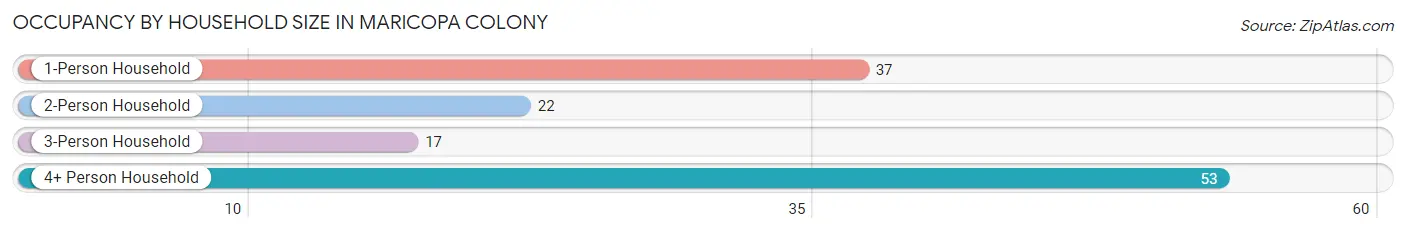
| Household Size | # Housing Units | % Housing Units |
| 1-Person Household | 37 | 28.7% |
| 2-Person Household | 22 | 17.1% |
| 3-Person Household | 17 | 13.2% |
| 4+ Person Household | 53 | 41.1% |
| Total Housing Units | 129 | 100.0% |
Occupancy by Ownership by Household Size in Maricopa Colony
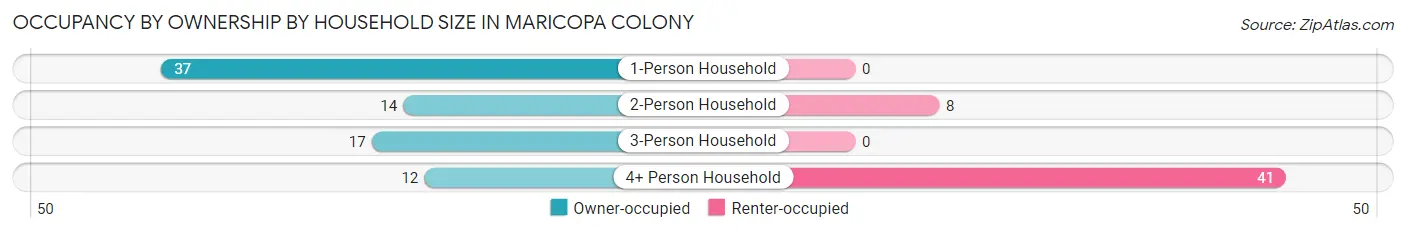
| Household Size | Owner-occupied | Renter-occupied |
| 1-Person Household | 37 (100.0%) | 0 (0.0%) |
| 2-Person Household | 14 (63.6%) | 8 (36.4%) |
| 3-Person Household | 17 (100.0%) | 0 (0.0%) |
| 4+ Person Household | 12 (22.6%) | 41 (77.4%) |
| Total Housing Units | 80 (62.0%) | 49 (38.0%) |
Occupancy by Educational Attainment in Maricopa Colony
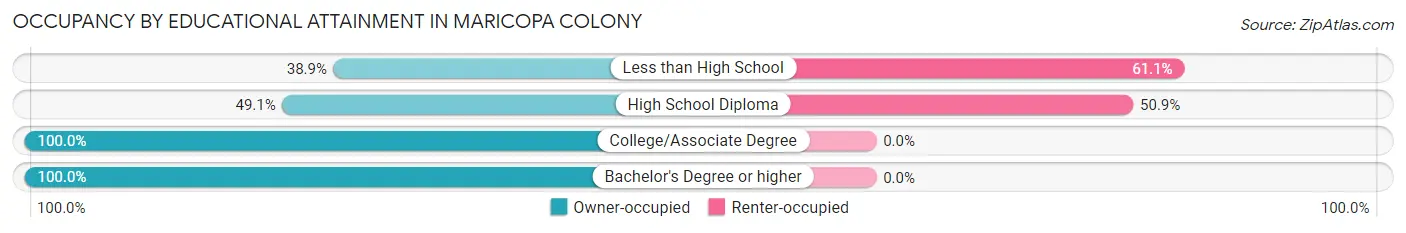
| Household Size | Owner-occupied | Renter-occupied |
| Less than High School | 14 (38.9%) | 22 (61.1%) |
| High School Diploma | 26 (49.1%) | 27 (50.9%) |
| College/Associate Degree | 23 (100.0%) | 0 (0.0%) |
| Bachelor's Degree or higher | 17 (100.0%) | 0 (0.0%) |
Occupancy by Age of Householder in Maricopa Colony
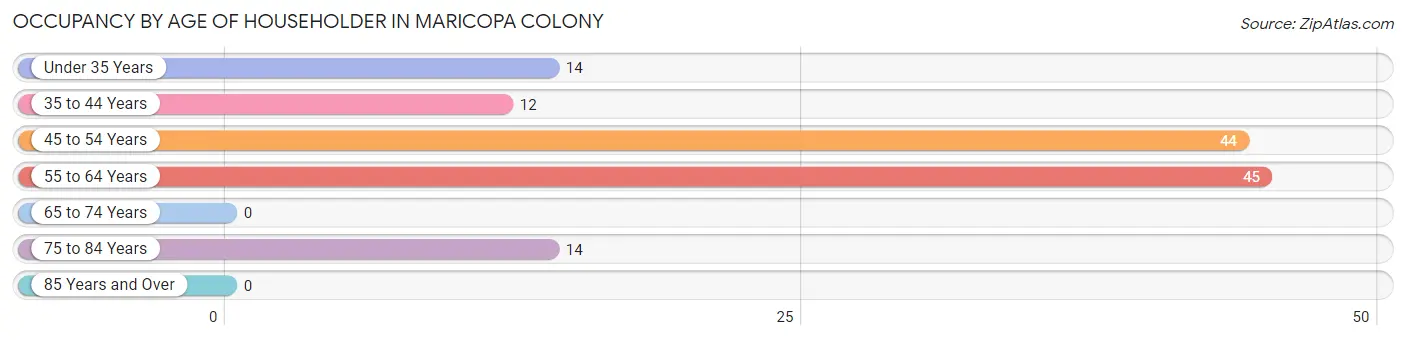
| Age Bracket | # Households | % Households |
| Under 35 Years | 14 | 10.8% |
| 35 to 44 Years | 12 | 9.3% |
| 45 to 54 Years | 44 | 34.1% |
| 55 to 64 Years | 45 | 34.9% |
| 65 to 74 Years | 0 | 0.0% |
| 75 to 84 Years | 14 | 10.8% |
| 85 Years and Over | 0 | 0.0% |
| Total | 129 | 100.0% |
Housing Finances in Maricopa Colony
Median Income by Occupancy in Maricopa Colony
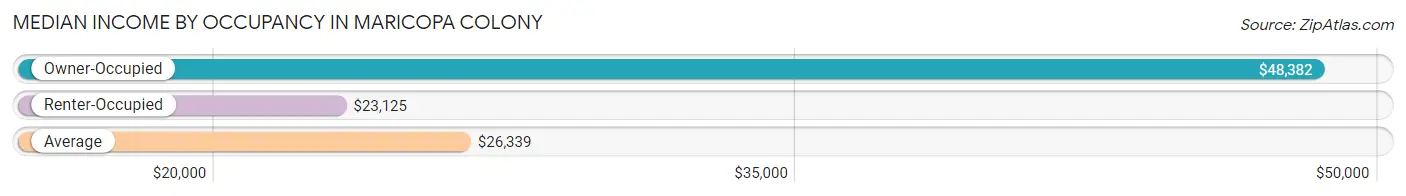
| Occupancy Type | # Households | Median Income |
| Owner-Occupied | 80 (62.0%) | $48,382 |
| Renter-Occupied | 49 (38.0%) | $23,125 |
| Average | 129 (100.0%) | $26,339 |
Occupancy by Householder Income Bracket in Maricopa Colony
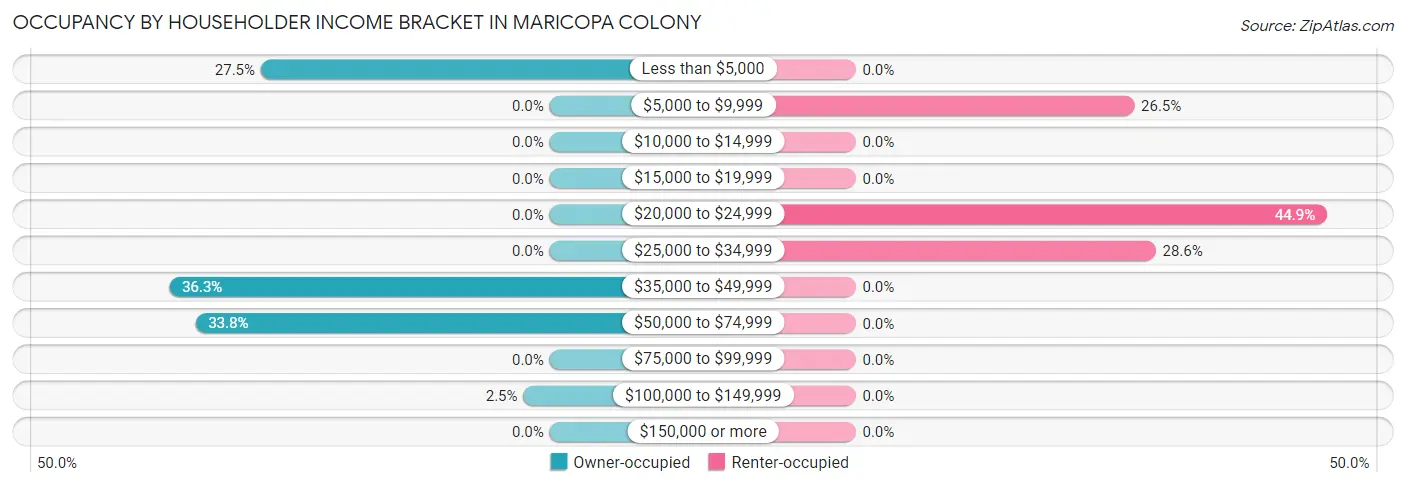
| Income Bracket | Owner-occupied | Renter-occupied |
| Less than $5,000 | 22 (27.5%) | 0 (0.0%) |
| $5,000 to $9,999 | 0 (0.0%) | 13 (26.5%) |
| $10,000 to $14,999 | 0 (0.0%) | 0 (0.0%) |
| $15,000 to $19,999 | 0 (0.0%) | 0 (0.0%) |
| $20,000 to $24,999 | 0 (0.0%) | 22 (44.9%) |
| $25,000 to $34,999 | 0 (0.0%) | 14 (28.6%) |
| $35,000 to $49,999 | 29 (36.2%) | 0 (0.0%) |
| $50,000 to $74,999 | 27 (33.8%) | 0 (0.0%) |
| $75,000 to $99,999 | 0 (0.0%) | 0 (0.0%) |
| $100,000 to $149,999 | 2 (2.5%) | 0 (0.0%) |
| $150,000 or more | 0 (0.0%) | 0 (0.0%) |
| Total | 80 (100.0%) | 49 (100.0%) |
Monthly Housing Cost Tiers in Maricopa Colony
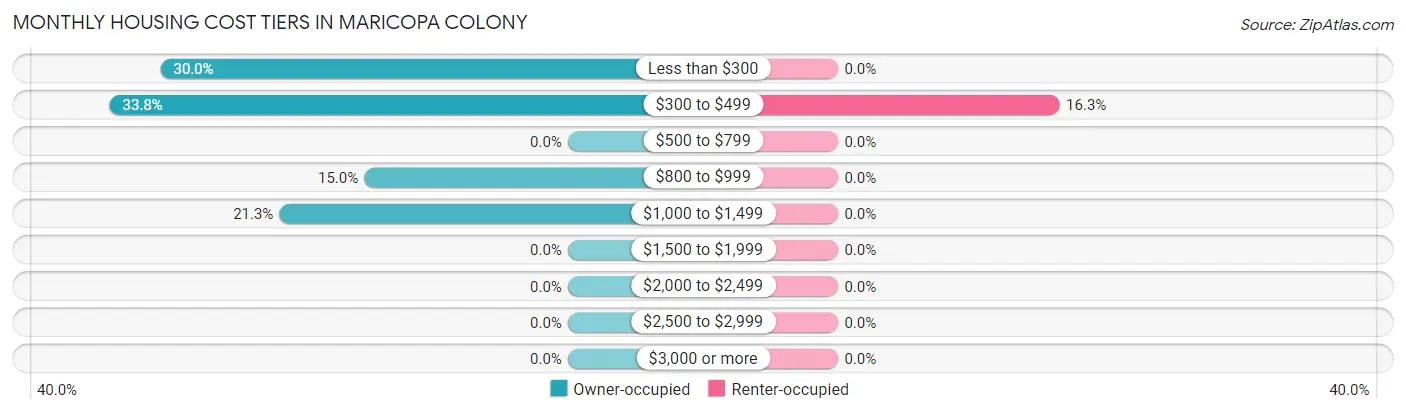
| Monthly Cost | Owner-occupied | Renter-occupied |
| Less than $300 | 24 (30.0%) | 0 (0.0%) |
| $300 to $499 | 27 (33.8%) | 8 (16.3%) |
| $500 to $799 | 0 (0.0%) | 0 (0.0%) |
| $800 to $999 | 12 (15.0%) | 0 (0.0%) |
| $1,000 to $1,499 | 17 (21.2%) | 0 (0.0%) |
| $1,500 to $1,999 | 0 (0.0%) | 0 (0.0%) |
| $2,000 to $2,499 | 0 (0.0%) | 0 (0.0%) |
| $2,500 to $2,999 | 0 (0.0%) | 0 (0.0%) |
| $3,000 or more | 0 (0.0%) | 0 (0.0%) |
| Total | 80 (100.0%) | 49 (100.0%) |
Physical Housing Characteristics in Maricopa Colony
Housing Structures in Maricopa Colony
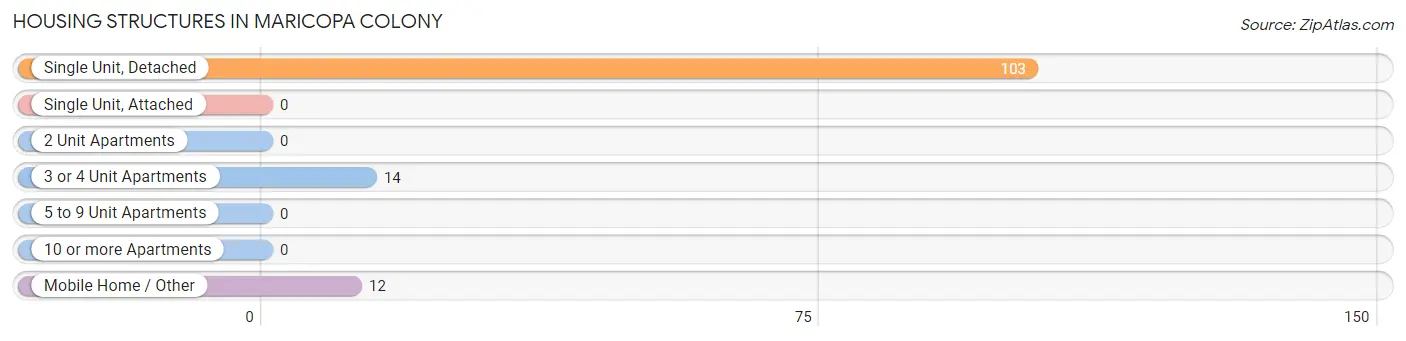
| Structure Type | # Housing Units | % Housing Units |
| Single Unit, Detached | 103 | 79.8% |
| Single Unit, Attached | 0 | 0.0% |
| 2 Unit Apartments | 0 | 0.0% |
| 3 or 4 Unit Apartments | 14 | 10.8% |
| 5 to 9 Unit Apartments | 0 | 0.0% |
| 10 or more Apartments | 0 | 0.0% |
| Mobile Home / Other | 12 | 9.3% |
| Total | 129 | 100.0% |
Housing Structures by Occupancy in Maricopa Colony
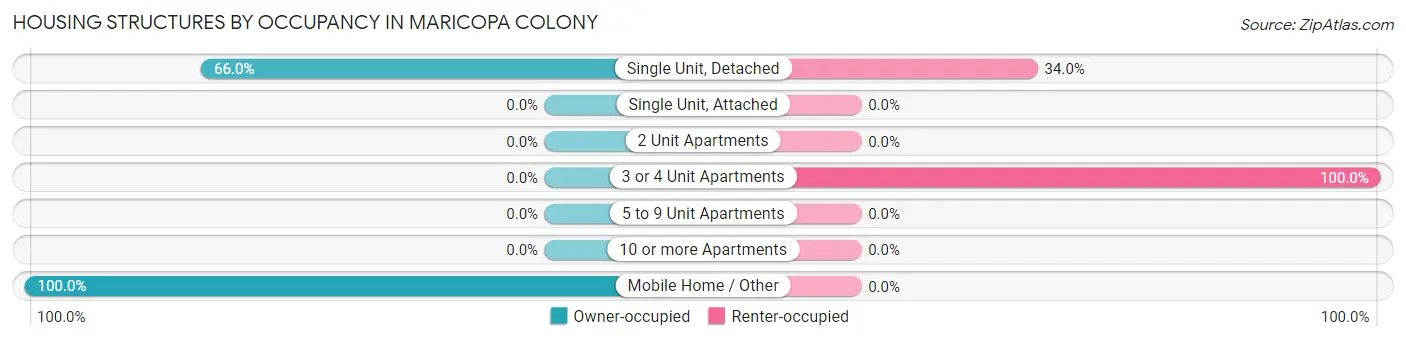
| Structure Type | Owner-occupied | Renter-occupied |
| Single Unit, Detached | 68 (66.0%) | 35 (34.0%) |
| Single Unit, Attached | 0 (0.0%) | 0 (0.0%) |
| 2 Unit Apartments | 0 (0.0%) | 0 (0.0%) |
| 3 or 4 Unit Apartments | 0 (0.0%) | 14 (100.0%) |
| 5 to 9 Unit Apartments | 0 (0.0%) | 0 (0.0%) |
| 10 or more Apartments | 0 (0.0%) | 0 (0.0%) |
| Mobile Home / Other | 12 (100.0%) | 0 (0.0%) |
| Total | 80 (62.0%) | 49 (38.0%) |
Housing Structures by Number of Rooms in Maricopa Colony
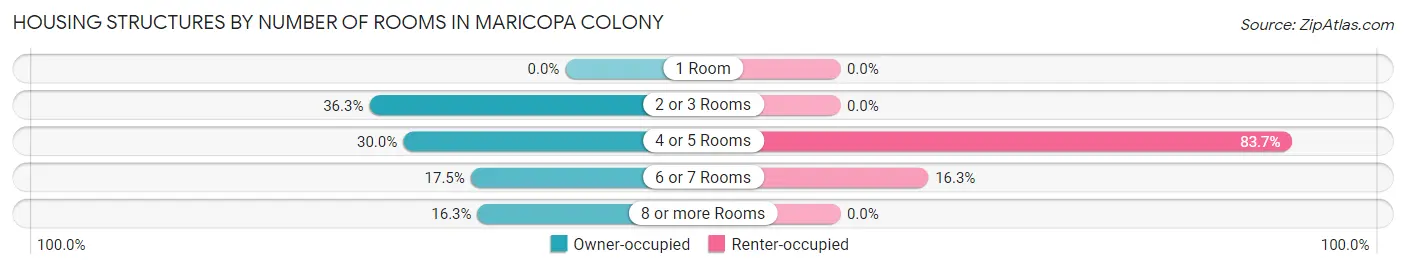
| Number of Rooms | Owner-occupied | Renter-occupied |
| 1 Room | 0 (0.0%) | 0 (0.0%) |
| 2 or 3 Rooms | 29 (36.2%) | 0 (0.0%) |
| 4 or 5 Rooms | 24 (30.0%) | 41 (83.7%) |
| 6 or 7 Rooms | 14 (17.5%) | 8 (16.3%) |
| 8 or more Rooms | 13 (16.3%) | 0 (0.0%) |
| Total | 80 (100.0%) | 49 (100.0%) |
Housing Structure by Heating Type in Maricopa Colony
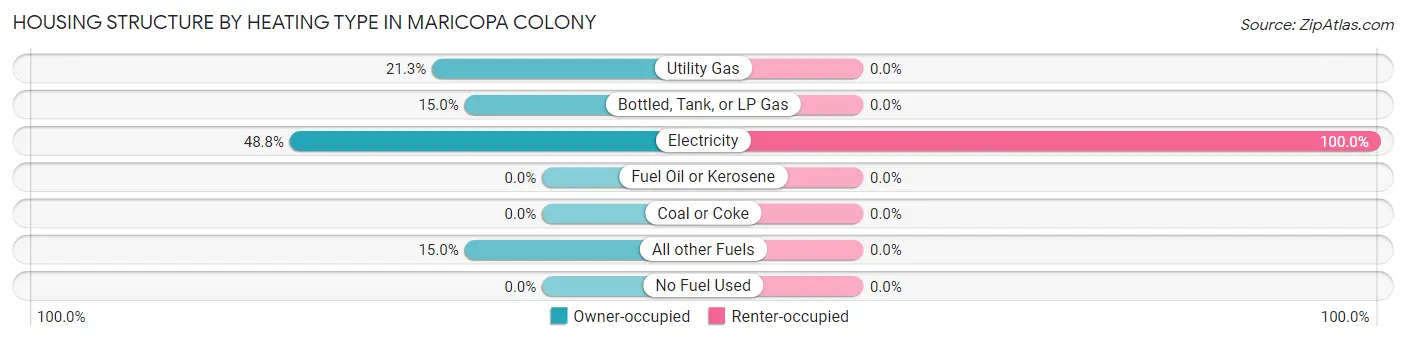
| Heating Type | Owner-occupied | Renter-occupied |
| Utility Gas | 17 (21.2%) | 0 (0.0%) |
| Bottled, Tank, or LP Gas | 12 (15.0%) | 0 (0.0%) |
| Electricity | 39 (48.7%) | 49 (100.0%) |
| Fuel Oil or Kerosene | 0 (0.0%) | 0 (0.0%) |
| Coal or Coke | 0 (0.0%) | 0 (0.0%) |
| All other Fuels | 12 (15.0%) | 0 (0.0%) |
| No Fuel Used | 0 (0.0%) | 0 (0.0%) |
| Total | 80 (100.0%) | 49 (100.0%) |
Household Vehicle Usage in Maricopa Colony
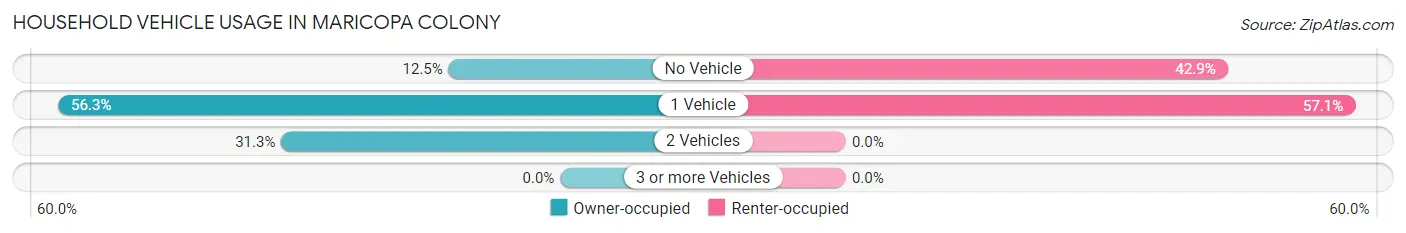
| Vehicles per Household | Owner-occupied | Renter-occupied |
| No Vehicle | 10 (12.5%) | 21 (42.9%) |
| 1 Vehicle | 45 (56.2%) | 28 (57.1%) |
| 2 Vehicles | 25 (31.2%) | 0 (0.0%) |
| 3 or more Vehicles | 0 (0.0%) | 0 (0.0%) |
| Total | 80 (100.0%) | 49 (100.0%) |
Real Estate & Mortgages in Maricopa Colony
Real Estate and Mortgage Overview in Maricopa Colony
| Characteristic | Without Mortgage | With Mortgage |
| Housing Units | 63 | 17 |
| Median Property Value | - | - |
| Median Household Income | - | - |
| Monthly Housing Costs | $333 | $0 |
| Real Estate Taxes | - | - |
Property Value by Mortgage Status in Maricopa Colony
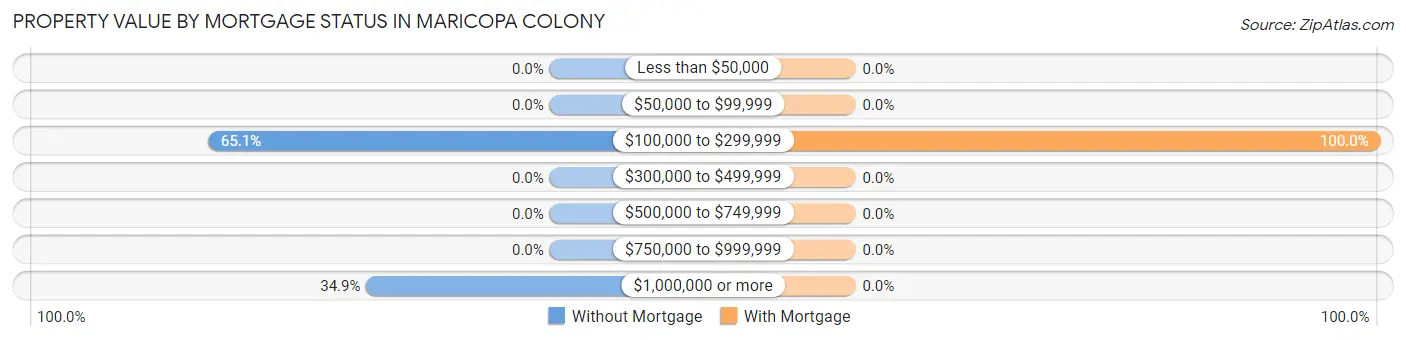
| Property Value | Without Mortgage | With Mortgage |
| Less than $50,000 | 0 (0.0%) | 0 (0.0%) |
| $50,000 to $99,999 | 0 (0.0%) | 0 (0.0%) |
| $100,000 to $299,999 | 41 (65.1%) | 17 (100.0%) |
| $300,000 to $499,999 | 0 (0.0%) | 0 (0.0%) |
| $500,000 to $749,999 | 0 (0.0%) | 0 (0.0%) |
| $750,000 to $999,999 | 0 (0.0%) | 0 (0.0%) |
| $1,000,000 or more | 22 (34.9%) | 0 (0.0%) |
| Total | 63 (100.0%) | 17 (100.0%) |
Household Income by Mortgage Status in Maricopa Colony
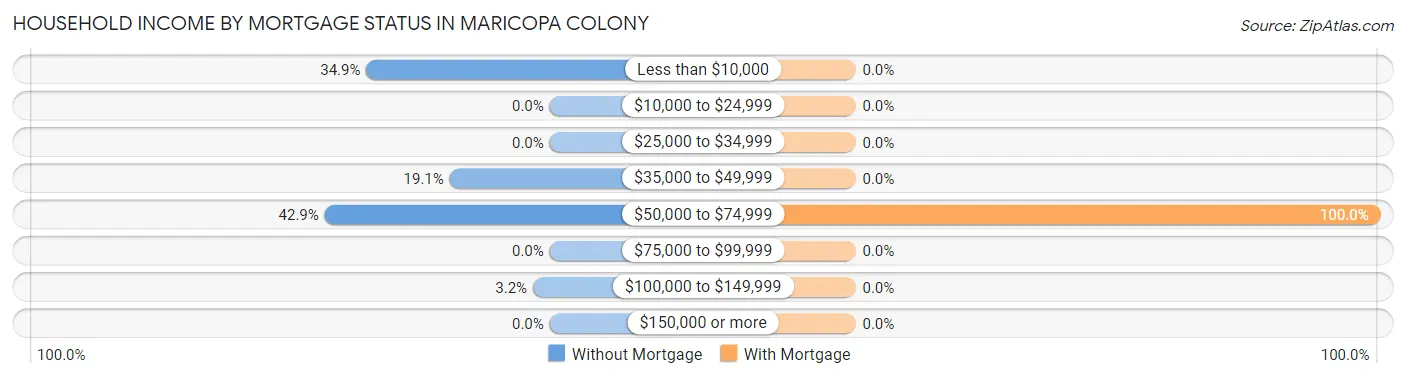
| Household Income | Without Mortgage | With Mortgage |
| Less than $10,000 | 22 (34.9%) | 0 (0.0%) |
| $10,000 to $24,999 | 0 (0.0%) | 0 (0.0%) |
| $25,000 to $34,999 | 0 (0.0%) | 0 (0.0%) |
| $35,000 to $49,999 | 12 (19.1%) | 0 (0.0%) |
| $50,000 to $74,999 | 27 (42.9%) | 17 (100.0%) |
| $75,000 to $99,999 | 0 (0.0%) | 0 (0.0%) |
| $100,000 to $149,999 | 2 (3.2%) | 0 (0.0%) |
| $150,000 or more | 0 (0.0%) | 0 (0.0%) |
| Total | 63 (100.0%) | 17 (100.0%) |
Property Value to Household Income Ratio in Maricopa Colony
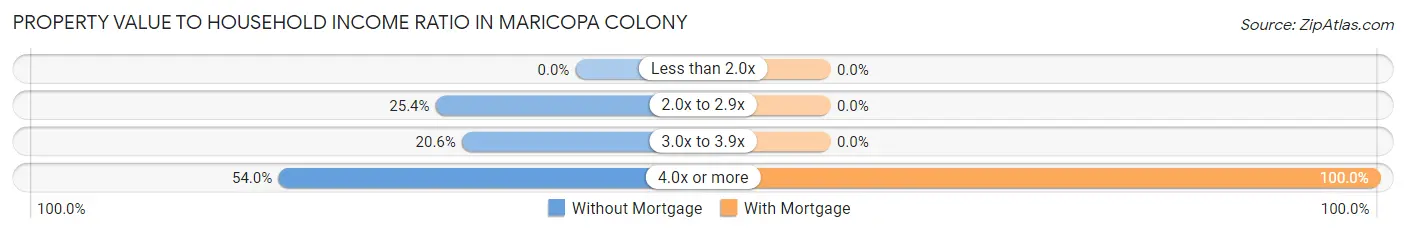
| Value-to-Income Ratio | Without Mortgage | With Mortgage |
| Less than 2.0x | 0 (0.0%) | 0 (0.0%) |
| 2.0x to 2.9x | 16 (25.4%) | 0 (0.0%) |
| 3.0x to 3.9x | 13 (20.6%) | 0 (0.0%) |
| 4.0x or more | 34 (54.0%) | 17 (100.0%) |
| Total | 63 (100.0%) | 17 (100.0%) |
Real Estate Taxes by Mortgage Status in Maricopa Colony
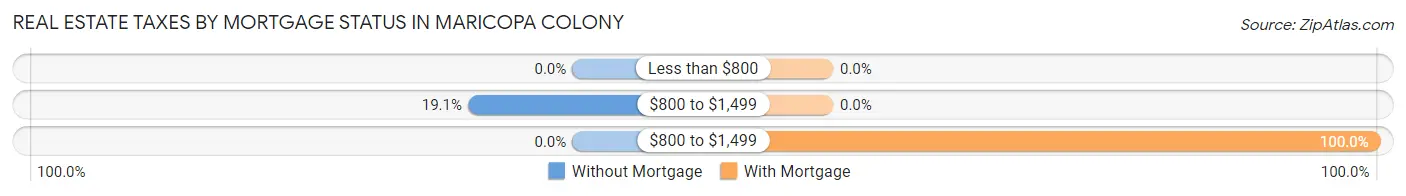
| Property Taxes | Without Mortgage | With Mortgage |
| Less than $800 | 0 (0.0%) | 0 (0.0%) |
| $800 to $1,499 | 12 (19.1%) | 0 (0.0%) |
| $800 to $1,499 | 0 (0.0%) | 17 (100.0%) |
| Total | 63 (100.0%) | 17 (100.0%) |
Health & Disability in Maricopa Colony
Health Insurance Coverage by Age in Maricopa Colony
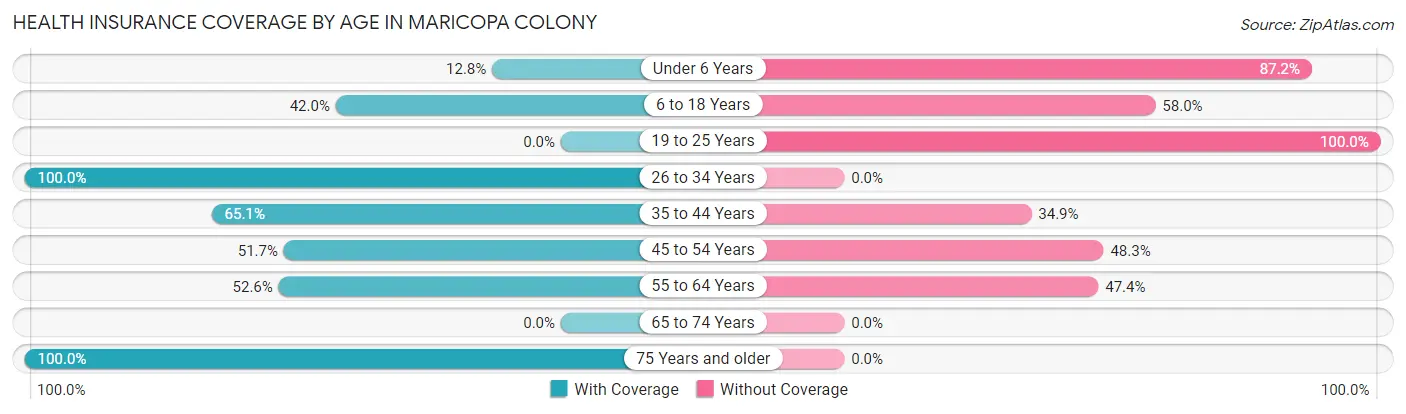
| Age Bracket | With Coverage | Without Coverage |
| Under 6 Years | 20 (12.8%) | 136 (87.2%) |
| 6 to 18 Years | 68 (42.0%) | 94 (58.0%) |
| 19 to 25 Years | 0 (0.0%) | 114 (100.0%) |
| 26 to 34 Years | 9 (100.0%) | 0 (0.0%) |
| 35 to 44 Years | 28 (65.1%) | 15 (34.9%) |
| 45 to 54 Years | 31 (51.7%) | 29 (48.3%) |
| 55 to 64 Years | 30 (52.6%) | 27 (47.4%) |
| 65 to 74 Years | 0 (0.0%) | 0 (0.0%) |
| 75 Years and older | 14 (100.0%) | 0 (0.0%) |
| Total | 200 (32.5%) | 415 (67.5%) |
Health Insurance Coverage by Citizenship Status in Maricopa Colony
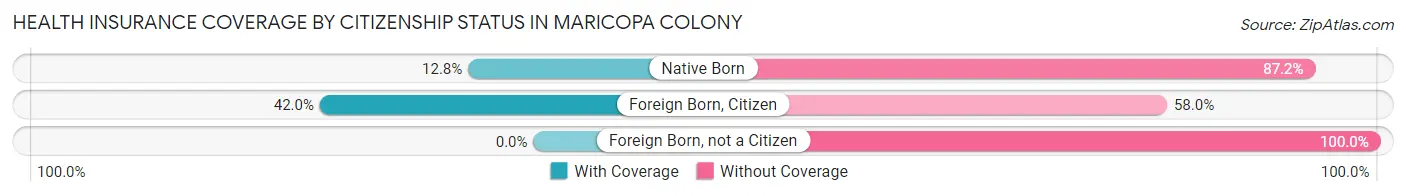
| Citizenship Status | With Coverage | Without Coverage |
| Native Born | 20 (12.8%) | 136 (87.2%) |
| Foreign Born, Citizen | 68 (42.0%) | 94 (58.0%) |
| Foreign Born, not a Citizen | 0 (0.0%) | 114 (100.0%) |
Health Insurance Coverage by Household Income in Maricopa Colony
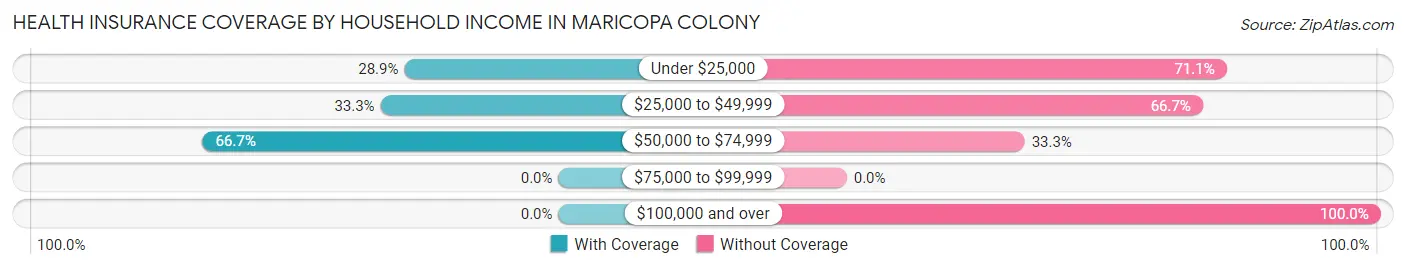
| Household Income | With Coverage | Without Coverage |
| Under $25,000 | 112 (28.9%) | 276 (71.1%) |
| $25,000 to $49,999 | 62 (33.3%) | 124 (66.7%) |
| $50,000 to $74,999 | 26 (66.7%) | 13 (33.3%) |
| $75,000 to $99,999 | 0 (0.0%) | 0 (0.0%) |
| $100,000 and over | 0 (0.0%) | 2 (100.0%) |
Public vs Private Health Insurance Coverage by Age in Maricopa Colony
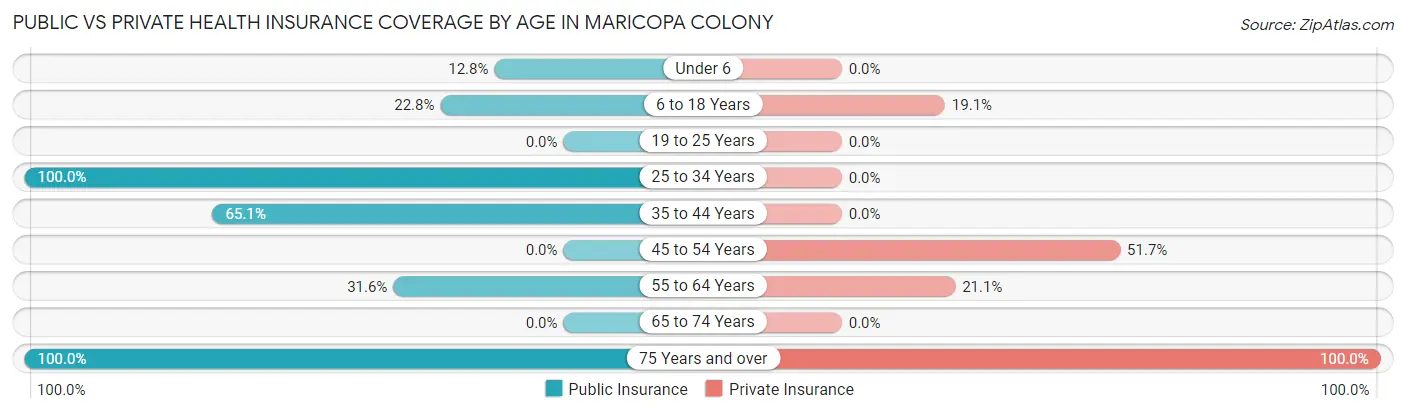
| Age Bracket | Public Insurance | Private Insurance |
| Under 6 | 20 (12.8%) | 0 (0.0%) |
| 6 to 18 Years | 37 (22.8%) | 31 (19.1%) |
| 19 to 25 Years | 0 (0.0%) | 0 (0.0%) |
| 25 to 34 Years | 9 (100.0%) | 0 (0.0%) |
| 35 to 44 Years | 28 (65.1%) | 0 (0.0%) |
| 45 to 54 Years | 0 (0.0%) | 31 (51.7%) |
| 55 to 64 Years | 18 (31.6%) | 12 (21.0%) |
| 65 to 74 Years | 0 (0.0%) | 0 (0.0%) |
| 75 Years and over | 14 (100.0%) | 14 (100.0%) |
| Total | 126 (20.5%) | 88 (14.3%) |
Disability Status by Sex by Age in Maricopa Colony
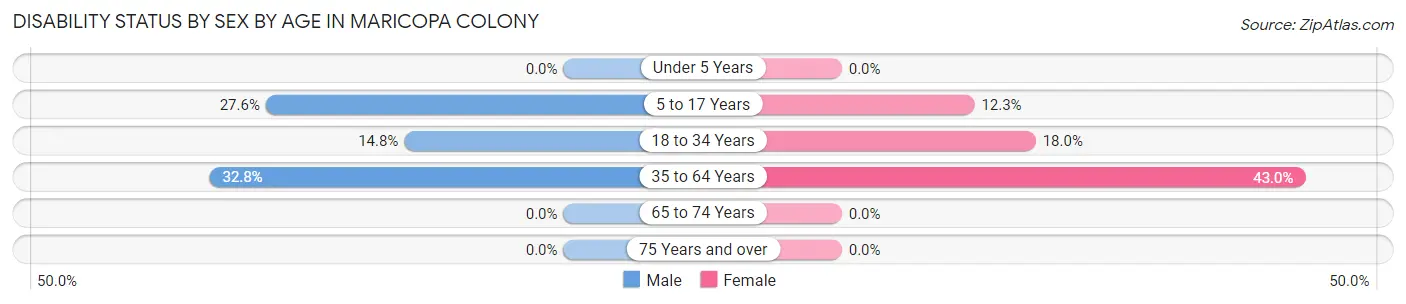
| Age Bracket | Male | Female |
| Under 5 Years | 0 (0.0%) | 0 (0.0%) |
| 5 to 17 Years | 29 (27.6%) | 8 (12.3%) |
| 18 to 34 Years | 13 (14.8%) | 9 (18.0%) |
| 35 to 64 Years | 22 (32.8%) | 40 (43.0%) |
| 65 to 74 Years | 0 (0.0%) | 0 (0.0%) |
| 75 Years and over | 0 (0.0%) | 0 (0.0%) |
Disability Class by Sex by Age in Maricopa Colony
Disability Class: Hearing Difficulty
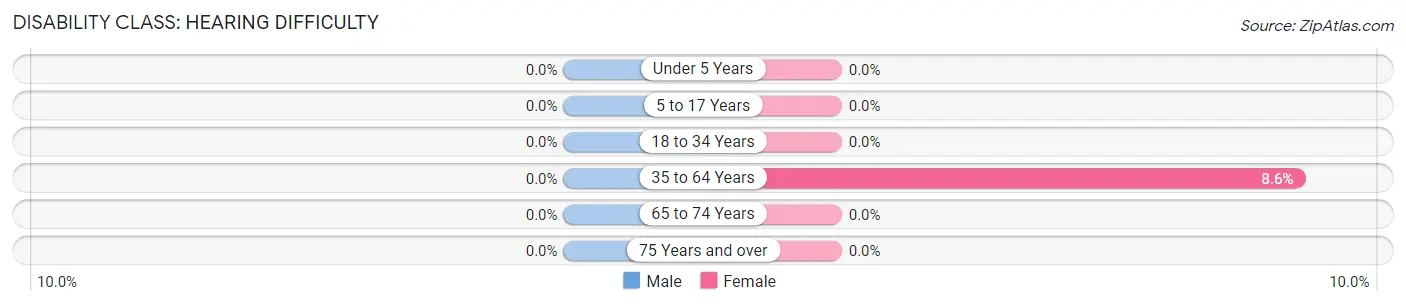
| Age Bracket | Male | Female |
| Under 5 Years | 0 (0.0%) | 0 (0.0%) |
| 5 to 17 Years | 0 (0.0%) | 0 (0.0%) |
| 18 to 34 Years | 0 (0.0%) | 0 (0.0%) |
| 35 to 64 Years | 0 (0.0%) | 8 (8.6%) |
| 65 to 74 Years | 0 (0.0%) | 0 (0.0%) |
| 75 Years and over | 0 (0.0%) | 0 (0.0%) |
Disability Class: Vision Difficulty
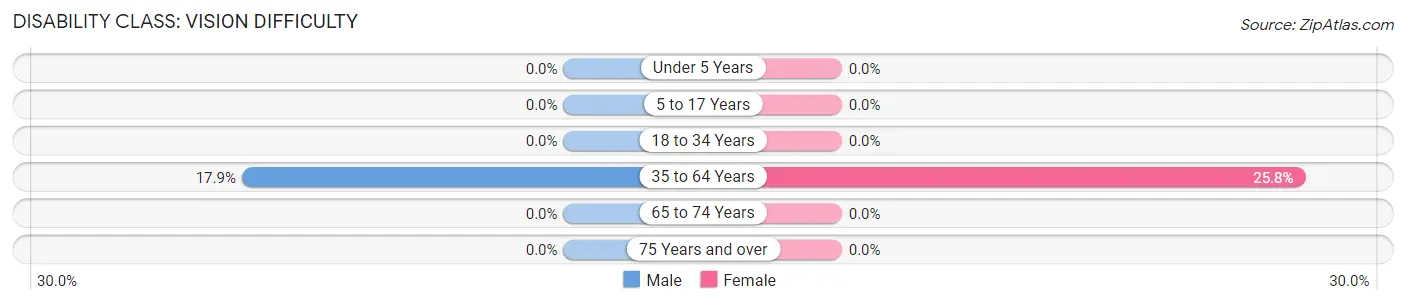
| Age Bracket | Male | Female |
| Under 5 Years | 0 (0.0%) | 0 (0.0%) |
| 5 to 17 Years | 0 (0.0%) | 0 (0.0%) |
| 18 to 34 Years | 0 (0.0%) | 0 (0.0%) |
| 35 to 64 Years | 12 (17.9%) | 24 (25.8%) |
| 65 to 74 Years | 0 (0.0%) | 0 (0.0%) |
| 75 Years and over | 0 (0.0%) | 0 (0.0%) |
Disability Class: Cognitive Difficulty
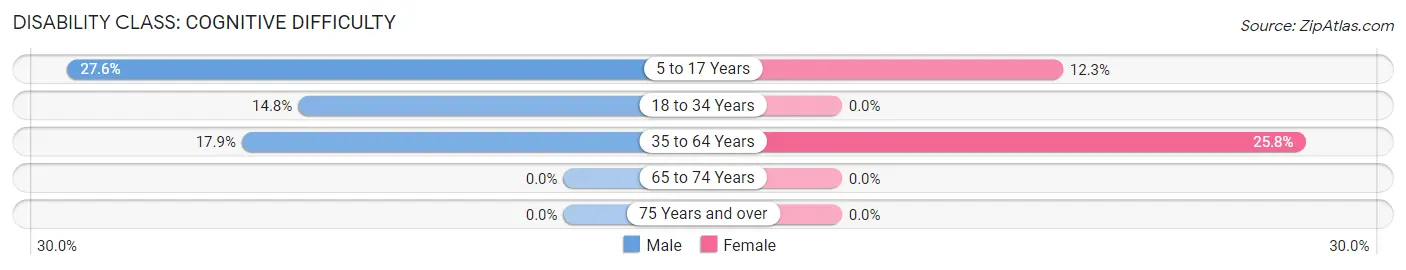
| Age Bracket | Male | Female |
| 5 to 17 Years | 29 (27.6%) | 8 (12.3%) |
| 18 to 34 Years | 13 (14.8%) | 0 (0.0%) |
| 35 to 64 Years | 12 (17.9%) | 24 (25.8%) |
| 65 to 74 Years | 0 (0.0%) | 0 (0.0%) |
| 75 Years and over | 0 (0.0%) | 0 (0.0%) |
Disability Class: Ambulatory Difficulty
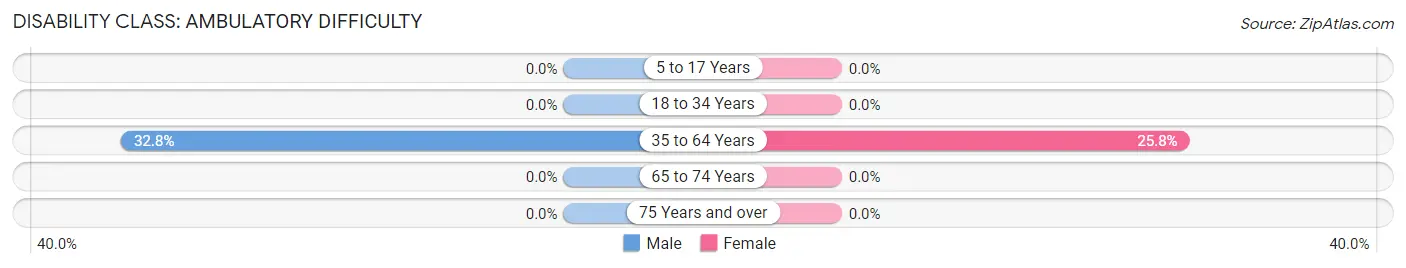
| Age Bracket | Male | Female |
| 5 to 17 Years | 0 (0.0%) | 0 (0.0%) |
| 18 to 34 Years | 0 (0.0%) | 0 (0.0%) |
| 35 to 64 Years | 22 (32.8%) | 24 (25.8%) |
| 65 to 74 Years | 0 (0.0%) | 0 (0.0%) |
| 75 Years and over | 0 (0.0%) | 0 (0.0%) |
Disability Class: Self-Care Difficulty
| Age Bracket | Male | Female |
| 5 to 17 Years | 0 (0.0%) | 0 (0.0%) |
| 18 to 34 Years | 0 (0.0%) | 0 (0.0%) |
| 35 to 64 Years | 0 (0.0%) | 0 (0.0%) |
| 65 to 74 Years | 0 (0.0%) | 0 (0.0%) |
| 75 Years and over | 0 (0.0%) | 0 (0.0%) |
Technology Access in Maricopa Colony
Computing Device Access in Maricopa Colony
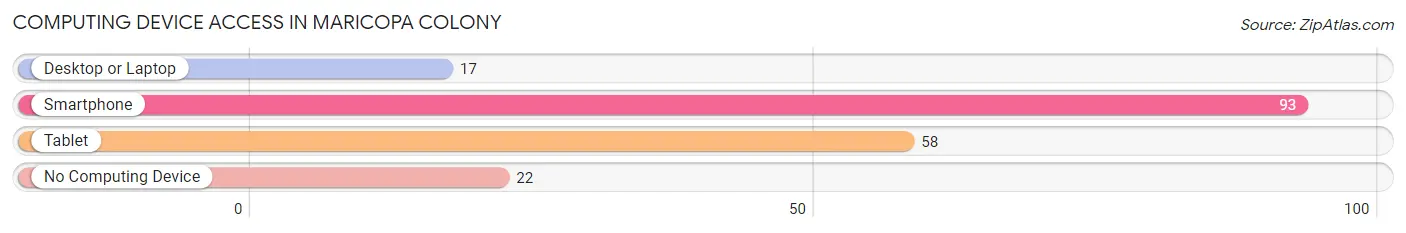
| Device Type | # Households | % Households |
| Desktop or Laptop | 17 | 13.2% |
| Smartphone | 93 | 72.1% |
| Tablet | 58 | 45.0% |
| No Computing Device | 22 | 17.1% |
| Total | 129 | 100.0% |
Internet Access in Maricopa Colony
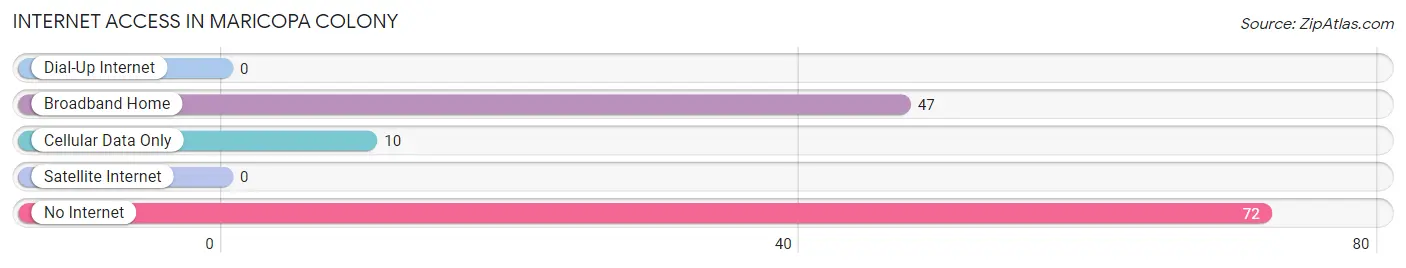
| Internet Type | # Households | % Households |
| Dial-Up Internet | 0 | 0.0% |
| Broadband Home | 47 | 36.4% |
| Cellular Data Only | 10 | 7.7% |
| Satellite Internet | 0 | 0.0% |
| No Internet | 72 | 55.8% |
| Total | 129 | 100.0% |
Maricopa Colony Summary
Maricopa Colony, AZ is a small unincorporated community located in the Gila River Indian Community in Arizona. It is located about 25 miles south of Phoenix and is home to approximately 1,000 people. The community is made up of members of the Gila River Indian Tribe, which is a federally recognized tribe of Native Americans.
History
The Maricopa Colony was established in 1871 by the Gila River Indian Community. The community was originally established as a farming community and was home to many of the tribe’s members. The community was also home to a number of other Native American tribes, including the Pima, Tohono O’odham, and Yavapai.
The Maricopa Colony was originally established as a farming community, but it soon became a trading post for the Gila River Indian Community. The community was also home to a number of other Native American tribes, including the Pima, Tohono O’odham, and Yavapai.
The Maricopa Colony was also home to a number of other businesses, including a general store, a blacksmith shop, and a post office. The community was also home to a number of churches, including the Maricopa Methodist Church, which was established in 1876.
In the late 1800s, the Maricopa Colony was home to a number of schools, including the Maricopa Indian School, which was established in 1891. The school was established to provide education to the children of the Gila River Indian Community.
Geography
Maricopa Colony is located in the Gila River Indian Community in Arizona. The community is located about 25 miles south of Phoenix and is home to approximately 1,000 people. The community is located in the Sonoran Desert and is surrounded by the Gila River and the Salt River.
The climate in Maricopa Colony is hot and dry, with temperatures ranging from the low 90s in the summer to the low 50s in the winter. The area receives an average of 8 inches of rain per year.
Economy
The economy of Maricopa Colony is largely based on agriculture. The community is home to a number of farms, which produce a variety of crops, including cotton, alfalfa, and wheat. The community is also home to a number of businesses, including a general store, a blacksmith shop, and a post office.
The Gila River Indian Community also operates a number of businesses in the community, including a casino, a hotel, and a golf course. The community is also home to a number of other businesses, including a number of restaurants, a grocery store, and a gas station.
Demographics
As of the 2010 census, the population of Maricopa Colony was 1,000. The population is made up of members of the Gila River Indian Community, as well as a number of other Native American tribes, including the Pima, Tohono O’odham, and Yavapai. The median age of the population is 33.
The majority of the population is of Native American descent, with the remainder being of Hispanic or Latino descent. The median household income in Maricopa Colony is $30,000, and the median home value is $90,000. The unemployment rate in the community is 8.5%.
Conclusion
Maricopa Colony, AZ is a small unincorporated community located in the Gila River Indian Community in Arizona. The community was originally established as a farming community and is now home to a number of businesses, including a casino, a hotel, and a golf course. The population of Maricopa Colony is made up of members of the Gila River Indian Community, as well as a number of other Native American tribes. The economy of the community is largely based on agriculture, and the median household income is $30,000.
Common Questions
What is Per Capita Income in Maricopa Colony?
Per Capita income in Maricopa Colony is $6,343.
What is the Median Family Income in Maricopa Colony?
Median Family Income in Maricopa Colony is $24,821.
What is the Median Household income in Maricopa Colony?
Median Household Income in Maricopa Colony is $26,339.
What is Inequality or Gini Index in Maricopa Colony?
Inequality or Gini Index in Maricopa Colony is 0.39.
What is the Total Population of Maricopa Colony?
Total Population of Maricopa Colony is 615.
What is the Total Male Population of Maricopa Colony?
Total Male Population of Maricopa Colony is 332.
What is the Total Female Population of Maricopa Colony?
Total Female Population of Maricopa Colony is 283.
What is the Ratio of Males per 100 Females in Maricopa Colony?
There are 117.31 Males per 100 Females in Maricopa Colony.
What is the Ratio of Females per 100 Males in Maricopa Colony?
There are 85.24 Females per 100 Males in Maricopa Colony.
What is the Median Population Age in Maricopa Colony?
Median Population Age in Maricopa Colony is 18.3 Years.
What is the Average Family Size in Maricopa Colony
Average Family Size in Maricopa Colony is 6.1 People.
What is the Average Household Size in Maricopa Colony
Average Household Size in Maricopa Colony is 4.8 People.
How Large is the Labor Force in Maricopa Colony?
There are 71 People in the Labor Forcein in Maricopa Colony.
What is the Percentage of People in the Labor Force in Maricopa Colony?
21.3% of People are in the Labor Force in Maricopa Colony.