Window Rock, AZ Map & Demographics
Window Rock Map
Window Rock Overview
$25,562
PER CAPITA INCOME
$43,409
AVG FAMILY INCOME
$40,242
AVG HOUSEHOLD INCOME
5.2%
WAGE / INCOME GAP [ % ]
94.8¢/ $1
WAGE / INCOME GAP [ $ ]
0.47
INEQUALITY / GINI INDEX
2,056
TOTAL POPULATION
878
MALE POPULATION
1,178
FEMALE POPULATION
74.53
MALES / 100 FEMALES
134.17
FEMALES / 100 MALES
34.3
MEDIAN AGE
3.6
AVG FAMILY SIZE
2.7
AVG HOUSEHOLD SIZE
812
LABOR FORCE [ PEOPLE ]
52.7%
PERCENT IN LABOR FORCE
10.8%
UNEMPLOYMENT RATE
Window Rock Zip Codes
Window Rock Area Codes
Income in Window Rock
Income Overview in Window Rock
Per Capita Income in Window Rock is $25,562, while median incomes of families and households are $43,409 and $40,242 respectively.
| Characteristic | Number | Measure |
| Per Capita Income | 2,056 | $25,562 |
| Median Family Income | 398 | $43,409 |
| Mean Family Income | 398 | $49,065 |
| Median Household Income | 720 | $40,242 |
| Mean Household Income | 720 | $49,354 |
| Income Deficit | 398 | $0 |
| Wage / Income Gap (%) | 2,056 | 5.21% |
| Wage / Income Gap ($) | 2,056 | 94.79¢ per $1 |
| Gini / Inequality Index | 2,056 | 0.47 |
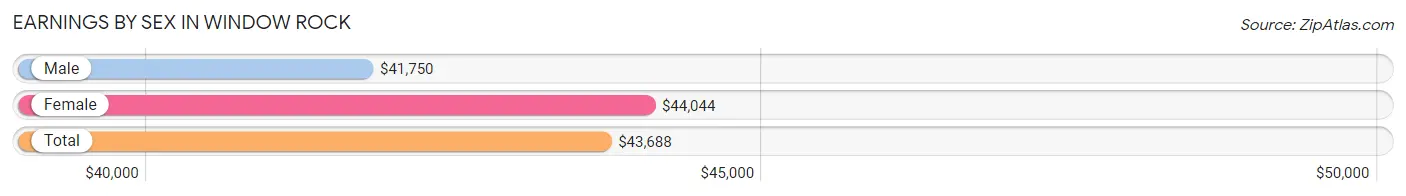
Earnings by Sex in Window Rock
Average Earnings in Window Rock are $43,688, $41,750 for men and $44,044 for women, a difference of 5.2%.
| Sex | Number | Average Earnings |
| Male | 414 (50.2%) | $41,750 |
| Female | 411 (49.8%) | $44,044 |
| Total | 825 (100.0%) | $43,688 |
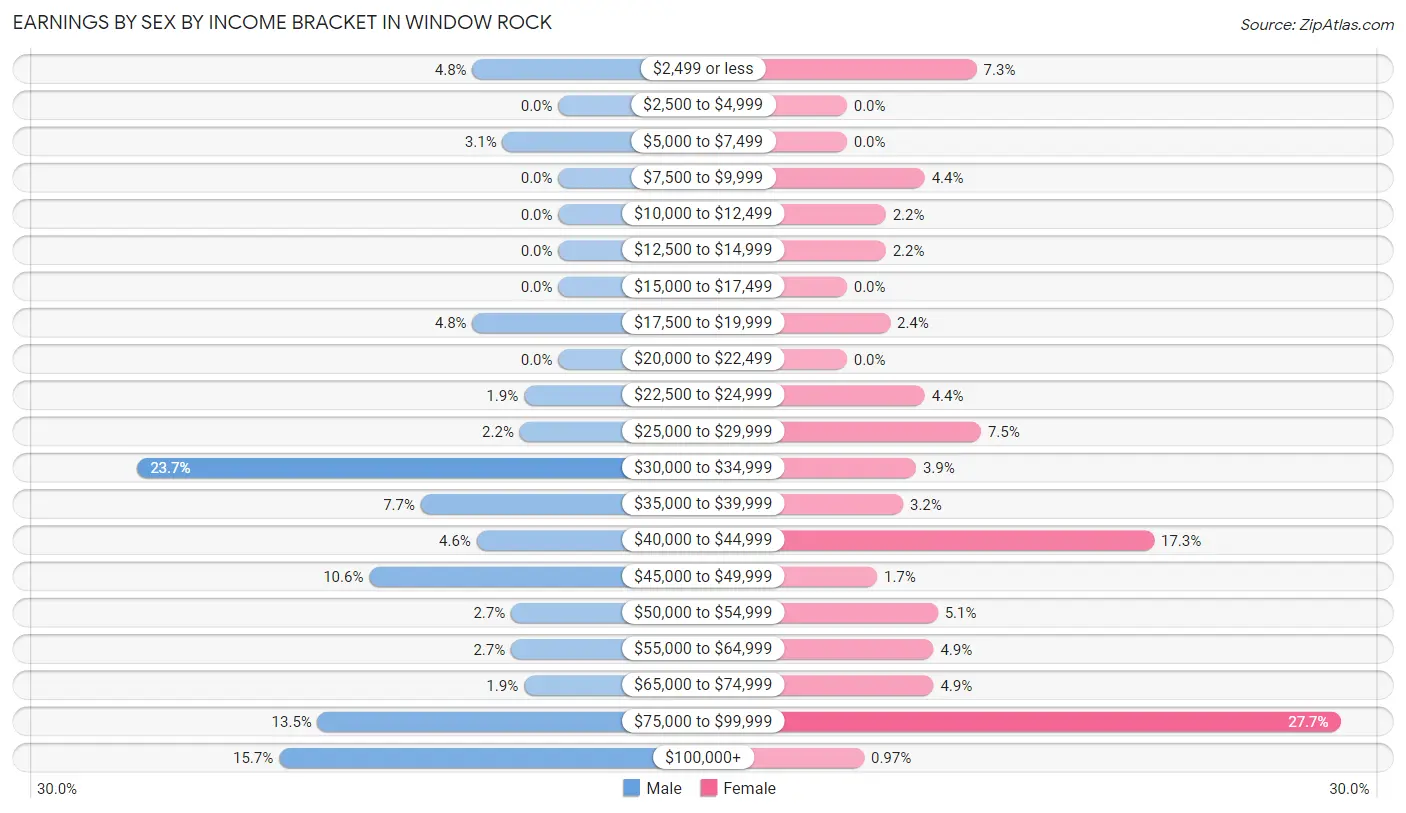
Earnings by Sex by Income Bracket in Window Rock
The most common earnings brackets in Window Rock are $30,000 to $34,999 for men (98 | 23.7%) and $75,000 to $99,999 for women (114 | 27.7%).
| Income | Male | Female |
| $2,499 or less | 20 (4.8%) | 30 (7.3%) |
| $2,500 to $4,999 | 0 (0.0%) | 0 (0.0%) |
| $5,000 to $7,499 | 13 (3.1%) | 0 (0.0%) |
| $7,500 to $9,999 | 0 (0.0%) | 18 (4.4%) |
| $10,000 to $12,499 | 0 (0.0%) | 9 (2.2%) |
| $12,500 to $14,999 | 0 (0.0%) | 9 (2.2%) |
| $15,000 to $17,499 | 0 (0.0%) | 0 (0.0%) |
| $17,500 to $19,999 | 20 (4.8%) | 10 (2.4%) |
| $20,000 to $22,499 | 0 (0.0%) | 0 (0.0%) |
| $22,500 to $24,999 | 8 (1.9%) | 18 (4.4%) |
| $25,000 to $29,999 | 9 (2.2%) | 31 (7.5%) |
| $30,000 to $34,999 | 98 (23.7%) | 16 (3.9%) |
| $35,000 to $39,999 | 32 (7.7%) | 13 (3.2%) |
| $40,000 to $44,999 | 19 (4.6%) | 71 (17.3%) |
| $45,000 to $49,999 | 44 (10.6%) | 7 (1.7%) |
| $50,000 to $54,999 | 11 (2.7%) | 21 (5.1%) |
| $55,000 to $64,999 | 11 (2.7%) | 20 (4.9%) |
| $65,000 to $74,999 | 8 (1.9%) | 20 (4.9%) |
| $75,000 to $99,999 | 56 (13.5%) | 114 (27.7%) |
| $100,000+ | 65 (15.7%) | 4 (1.0%) |
| Total | 414 (100.0%) | 411 (100.0%) |
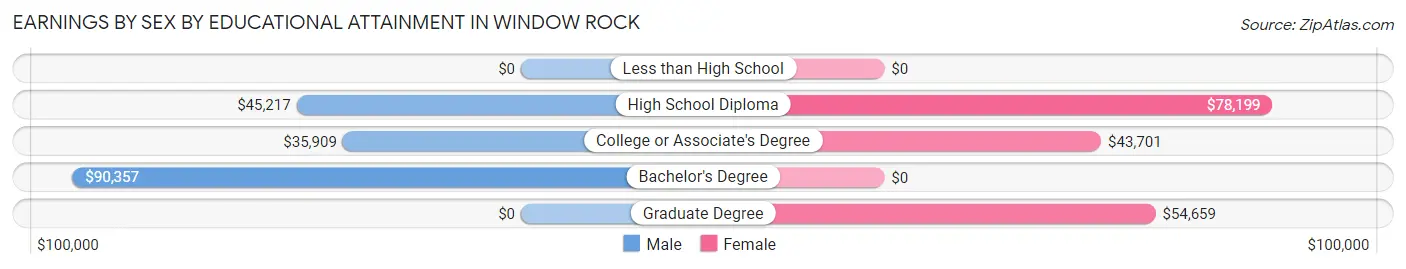
Earnings by Sex by Educational Attainment in Window Rock
Average earnings in Window Rock are $42,250 for men and $52,619 for women, a difference of 19.7%. Men with an educational attainment of bachelor's degree enjoy the highest average annual earnings of $90,357, while those with college or associate's degree education earn the least with $35,909. Women with an educational attainment of high school diploma earn the most with the average annual earnings of $78,199, while those with college or associate's degree education have the smallest earnings of $43,701.
| Educational Attainment | Male Income | Female Income |
| Less than High School | - | - |
| High School Diploma | $45,217 | $78,199 |
| College or Associate's Degree | $35,909 | $43,701 |
| Bachelor's Degree | $90,357 | $0 |
| Graduate Degree | - | - |
| Total | $42,250 | $52,619 |
Family Income in Window Rock
Family Income Brackets in Window Rock
According to the Window Rock family income data, there are 104 families falling into the $75,000 to $99,999 income range, which is the most common income bracket and makes up 26.1% of all families.
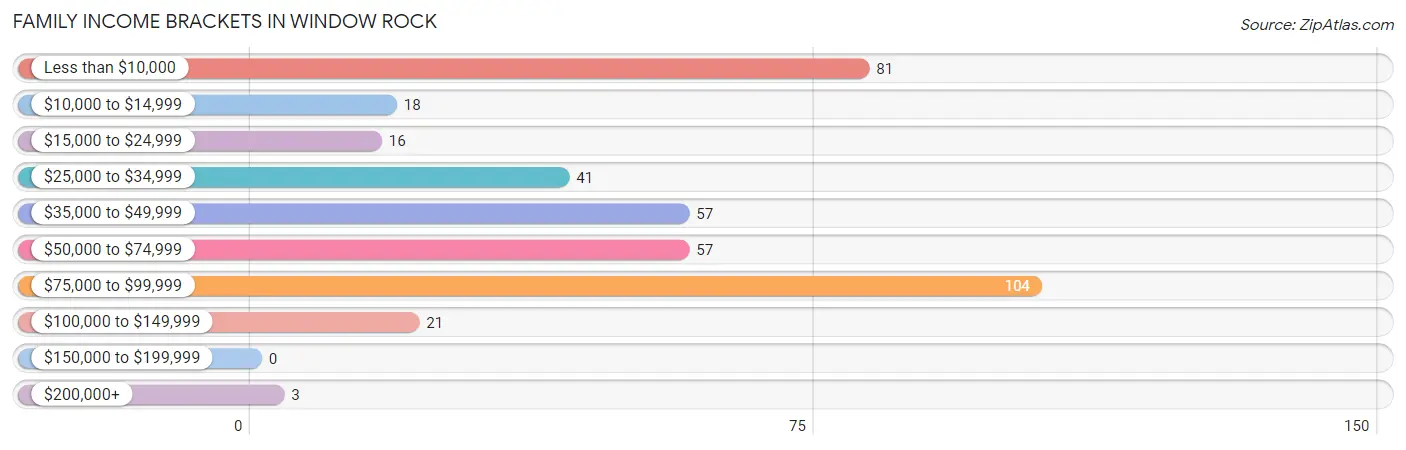
| Income Bracket | # Families | % Families |
| Less than $10,000 | 81 | 20.4% |
| $10,000 to $14,999 | 18 | 4.5% |
| $15,000 to $24,999 | 16 | 4.0% |
| $25,000 to $34,999 | 41 | 10.3% |
| $35,000 to $49,999 | 57 | 14.3% |
| $50,000 to $74,999 | 57 | 14.3% |
| $75,000 to $99,999 | 104 | 26.1% |
| $100,000 to $149,999 | 21 | 5.3% |
| $150,000 to $199,999 | 0 | 0.0% |
| $200,000+ | 3 | 0.8% |
Family Income by Famaliy Size in Window Rock
5-person families (33 | 8.3%) account for the highest median family income in Window Rock with $93,625 per family, while 2-person families (208 | 52.3%) have the highest median income of $25,139 per family member.
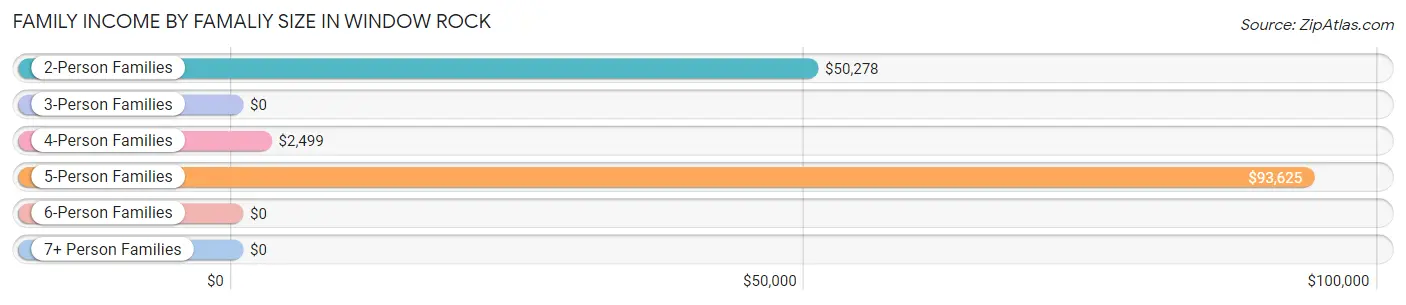
| Income Bracket | # Families | Median Income |
| 2-Person Families | 208 (52.3%) | $50,278 |
| 3-Person Families | 121 (30.4%) | $0 |
| 4-Person Families | 36 (9.0%) | $2,499 |
| 5-Person Families | 33 (8.3%) | $93,625 |
| 6-Person Families | 0 (0.0%) | $0 |
| 7+ Person Families | 0 (0.0%) | $0 |
| Total | 398 (100.0%) | $43,409 |
Family Income by Number of Earners in Window Rock
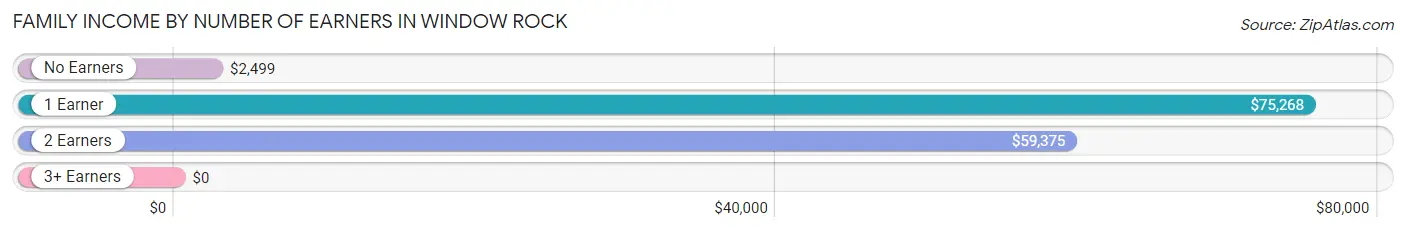
| Number of Earners | # Families | Median Income |
| No Earners | 137 (34.4%) | $2,499 |
| 1 Earner | 159 (40.0%) | $75,268 |
| 2 Earners | 91 (22.9%) | $59,375 |
| 3+ Earners | 11 (2.8%) | $0 |
| Total | 398 (100.0%) | $43,409 |
Household Income in Window Rock
Household Income Brackets in Window Rock
With 127 households falling in the category, the $75,000 to $99,999 income range is the most frequent in Window Rock, accounting for 17.6% of all households. In contrast, only 7 households (1.0%) fall into the $200,000+ income bracket, making it the least populous group.
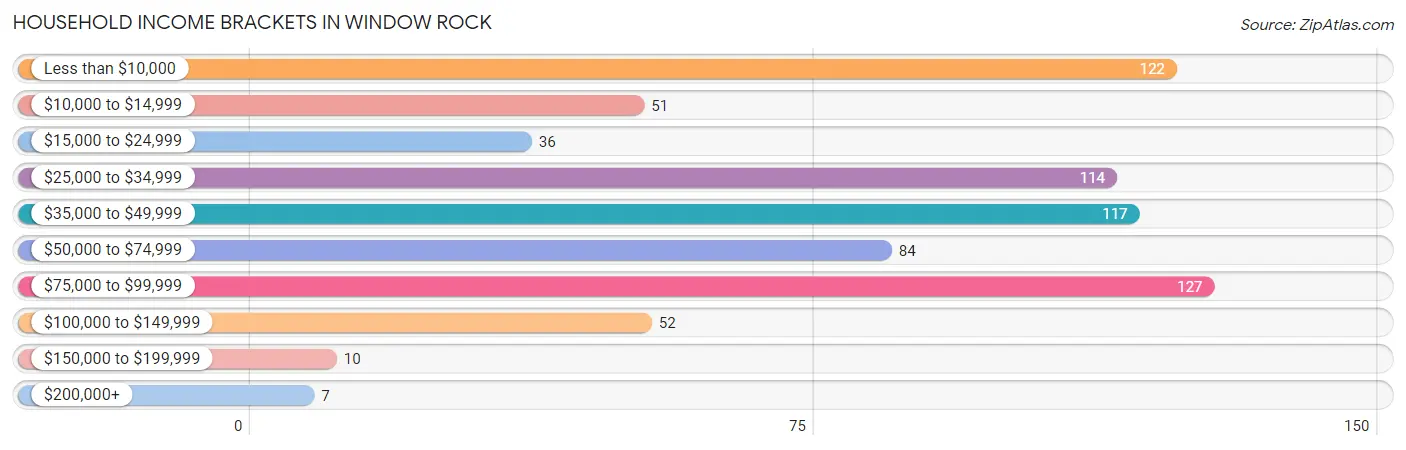
| Income Bracket | # Households | % Households |
| Less than $10,000 | 122 | 16.9% |
| $10,000 to $14,999 | 51 | 7.1% |
| $15,000 to $24,999 | 36 | 5.0% |
| $25,000 to $34,999 | 114 | 15.8% |
| $35,000 to $49,999 | 117 | 16.3% |
| $50,000 to $74,999 | 84 | 11.7% |
| $75,000 to $99,999 | 127 | 17.6% |
| $100,000 to $149,999 | 52 | 7.2% |
| $150,000 to $199,999 | 10 | 1.4% |
| $200,000+ | 7 | 1.0% |
Household Income by Householder Age in Window Rock
The median household income in Window Rock is $40,242, with the highest median household income of $43,893 found in the 25 to 44 years age bracket for the primary householder. A total of 257 households (35.7%) fall into this category. Meanwhile, the 15 to 24 years age bracket for the primary householder has the lowest median household income of $2,499, with 35 households (4.9%) in this group.
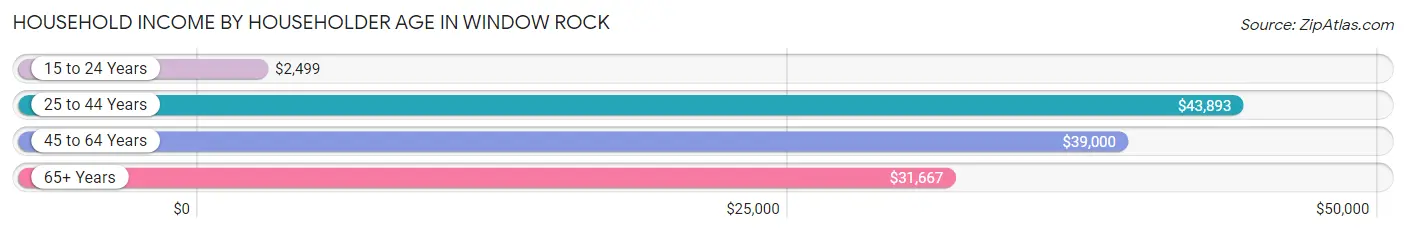
| Income Bracket | # Households | Median Income |
| 15 to 24 Years | 35 (4.9%) | $2,499 |
| 25 to 44 Years | 257 (35.7%) | $43,893 |
| 45 to 64 Years | 248 (34.4%) | $39,000 |
| 65+ Years | 180 (25.0%) | $31,667 |
| Total | 720 (100.0%) | $40,242 |
Poverty in Window Rock
Income Below Poverty by Sex and Age in Window Rock
With 22.9% poverty level for males and 40.3% for females among the residents of Window Rock, 12 to 14 year old males and 5 year old females are the most vulnerable to poverty, with 26 males (72.2%) and 14 females (100.0%) in their respective age groups living below the poverty level.
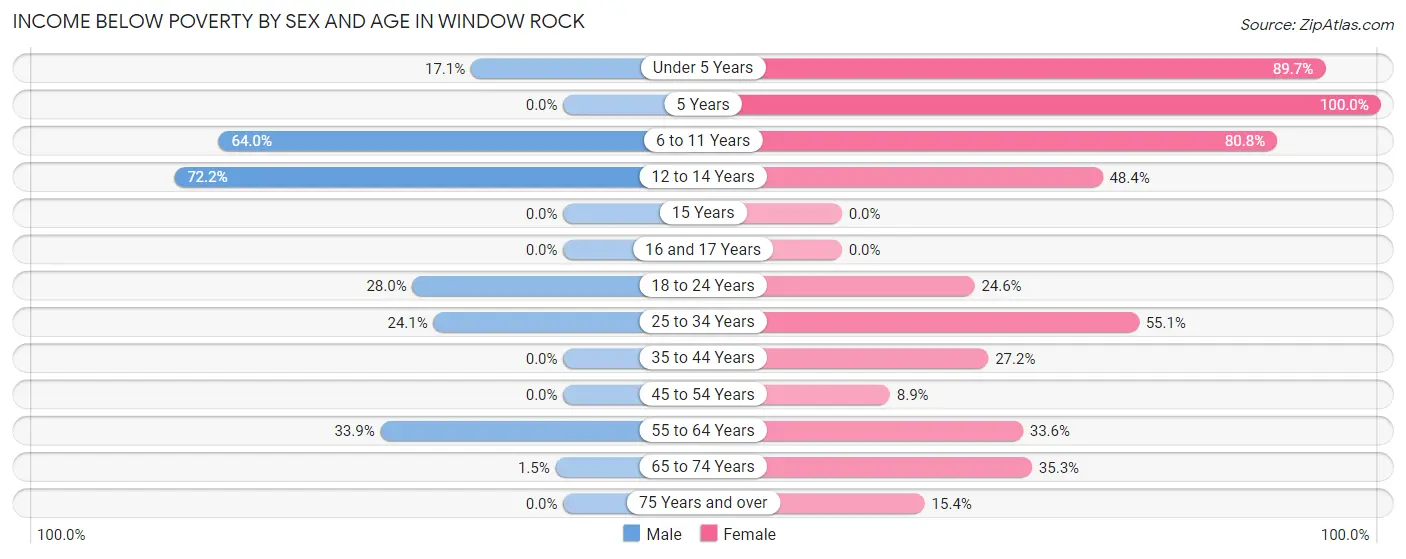
| Age Bracket | Male | Female |
| Under 5 Years | 6 (17.1%) | 113 (89.7%) |
| 5 Years | 0 (0.0%) | 14 (100.0%) |
| 6 to 11 Years | 48 (64.0%) | 63 (80.8%) |
| 12 to 14 Years | 26 (72.2%) | 15 (48.4%) |
| 15 Years | 0 (0.0%) | 0 (0.0%) |
| 16 and 17 Years | 0 (0.0%) | 0 (0.0%) |
| 18 to 24 Years | 14 (28.0%) | 32 (24.6%) |
| 25 to 34 Years | 33 (24.1%) | 97 (55.1%) |
| 35 to 44 Years | 0 (0.0%) | 28 (27.2%) |
| 45 to 54 Years | 0 (0.0%) | 14 (8.9%) |
| 55 to 64 Years | 56 (33.9%) | 42 (33.6%) |
| 65 to 74 Years | 1 (1.5%) | 30 (35.3%) |
| 75 Years and over | 0 (0.0%) | 8 (15.4%) |
| Total | 184 (22.9%) | 456 (40.3%) |
Income Above Poverty by Sex and Age in Window Rock
According to the poverty statistics in Window Rock, males aged 5 years and females aged 16 and 17 years are the age groups that are most secure financially, with 100.0% of males and 100.0% of females in these age groups living above the poverty line.
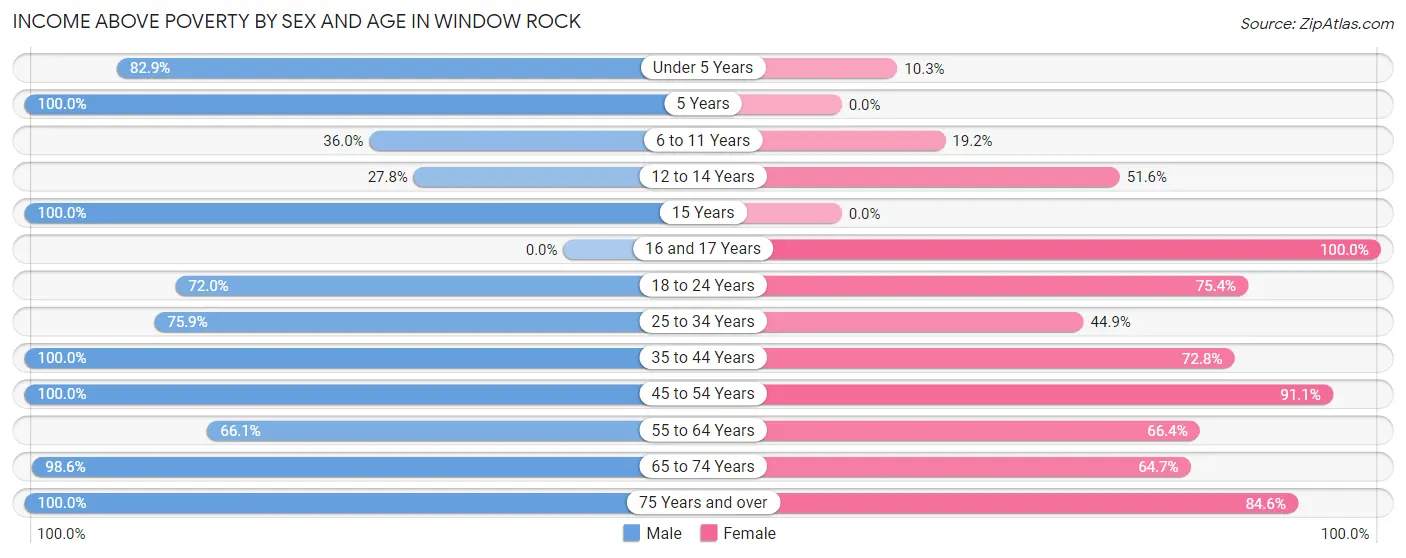
| Age Bracket | Male | Female |
| Under 5 Years | 29 (82.9%) | 13 (10.3%) |
| 5 Years | 14 (100.0%) | 0 (0.0%) |
| 6 to 11 Years | 27 (36.0%) | 15 (19.2%) |
| 12 to 14 Years | 10 (27.8%) | 16 (51.6%) |
| 15 Years | 15 (100.0%) | 0 (0.0%) |
| 16 and 17 Years | 0 (0.0%) | 54 (100.0%) |
| 18 to 24 Years | 36 (72.0%) | 98 (75.4%) |
| 25 to 34 Years | 104 (75.9%) | 79 (44.9%) |
| 35 to 44 Years | 90 (100.0%) | 75 (72.8%) |
| 45 to 54 Years | 74 (100.0%) | 143 (91.1%) |
| 55 to 64 Years | 109 (66.1%) | 83 (66.4%) |
| 65 to 74 Years | 68 (98.6%) | 55 (64.7%) |
| 75 Years and over | 42 (100.0%) | 44 (84.6%) |
| Total | 618 (77.1%) | 675 (59.7%) |
Income Below Poverty Among Married-Couple Families in Window Rock
The poverty statistics for married-couple families in Window Rock show that 6.8% or 12 of the total 176 families live below the poverty line. Families with 3 or 4 children have the highest poverty rate of 100.0%, comprising of 12 families. On the other hand, families with no children have the lowest poverty rate of 0.0%, which includes 0 families.
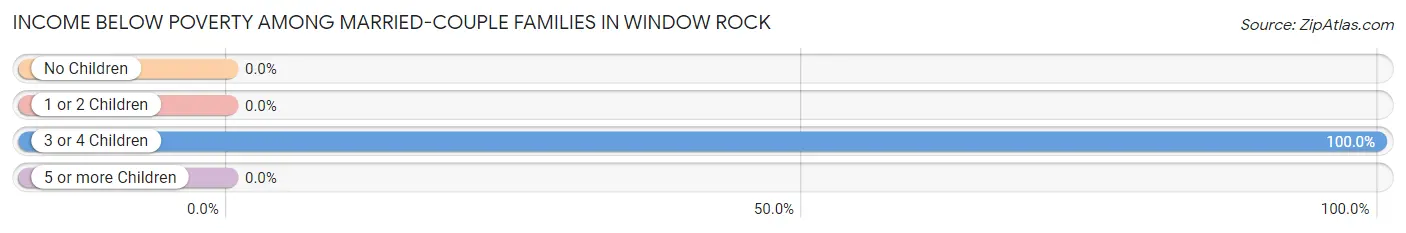
| Children | Above Poverty | Below Poverty |
| No Children | 128 (100.0%) | 0 (0.0%) |
| 1 or 2 Children | 36 (100.0%) | 0 (0.0%) |
| 3 or 4 Children | 0 (0.0%) | 12 (100.0%) |
| 5 or more Children | 0 (0.0%) | 0 (0.0%) |
| Total | 164 (93.2%) | 12 (6.8%) |
Income Below Poverty Among Single-Parent Households in Window Rock
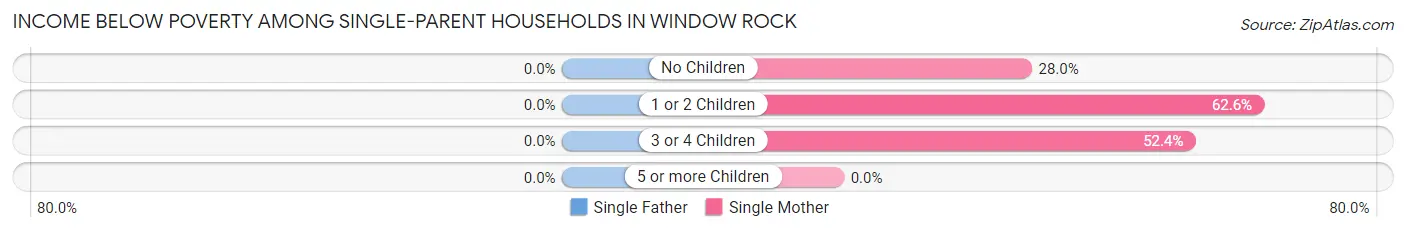
| Children | Single Father | Single Mother |
| No Children | 0 (0.0%) | 21 (28.0%) |
| 1 or 2 Children | 0 (0.0%) | 67 (62.6%) |
| 3 or 4 Children | 0 (0.0%) | 11 (52.4%) |
| 5 or more Children | 0 (0.0%) | 0 (0.0%) |
| Total | 0 (0.0%) | 99 (48.8%) |
Income Below Poverty Among Married-Couple vs Single-Parent Households in Window Rock
The poverty data for Window Rock shows that 12 of the married-couple family households (6.8%) and 99 of the single-parent households (44.6%) are living below the poverty level. Within the married-couple family households, those with 3 or 4 children have the highest poverty rate, with 12 households (100.0%) falling below the poverty line. Among the single-parent households, those with 1 or 2 children have the highest poverty rate, with 67 household (57.3%) living below poverty.
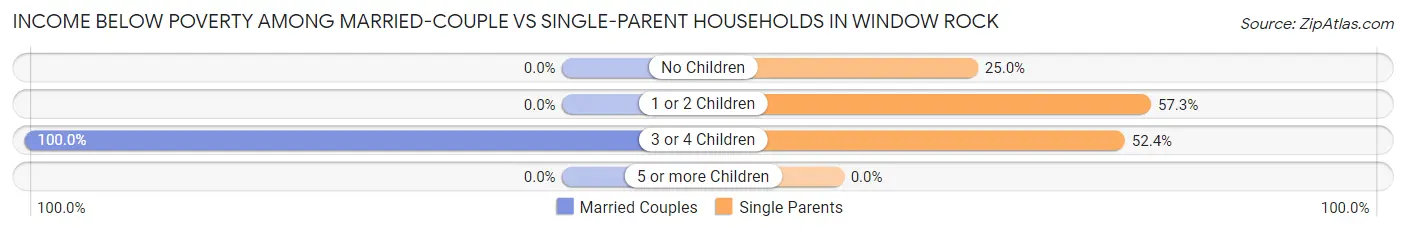
| Children | Married-Couple Families | Single-Parent Households |
| No Children | 0 (0.0%) | 21 (25.0%) |
| 1 or 2 Children | 0 (0.0%) | 67 (57.3%) |
| 3 or 4 Children | 12 (100.0%) | 11 (52.4%) |
| 5 or more Children | 0 (0.0%) | 0 (0.0%) |
| Total | 12 (6.8%) | 99 (44.6%) |
Race in Window Rock
The most populous races in Window Rock are Native / Alaskan (1,809 | 88.0%), Hispanic or Latino (145 | 7.0%), and White / Caucasian (110 | 5.3%).
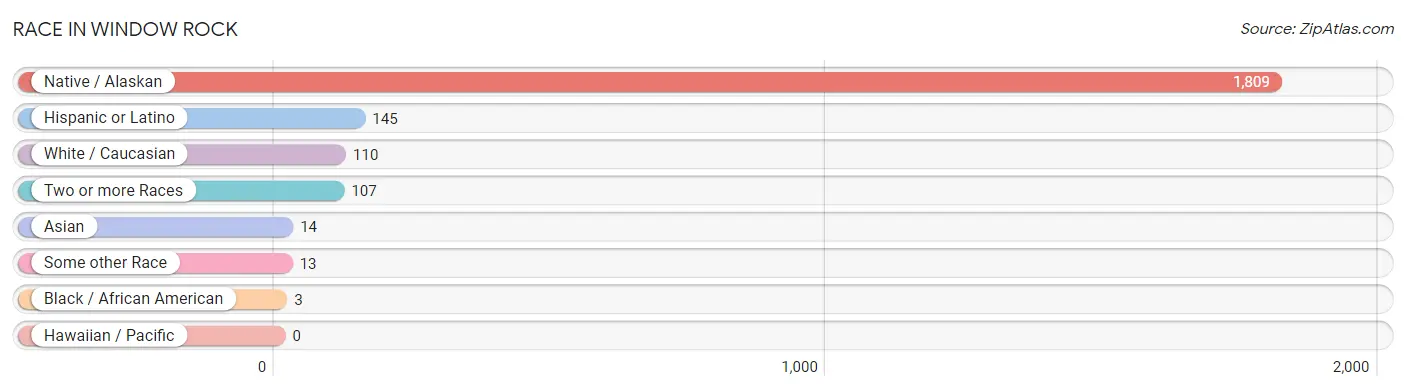
| Race | # Population | % Population |
| Asian | 14 | 0.7% |
| Black / African American | 3 | 0.2% |
| Hawaiian / Pacific | 0 | 0.0% |
| Hispanic or Latino | 145 | 7.0% |
| Native / Alaskan | 1,809 | 88.0% |
| White / Caucasian | 110 | 5.3% |
| Two or more Races | 107 | 5.2% |
| Some other Race | 13 | 0.6% |
| Total | 2,056 | 100.0% |
Ancestry in Window Rock
The most populous ancestries reported in Window Rock are Navajo (1,822 | 88.6%), Mexican (132 | 6.4%), Cheyenne (74 | 3.6%), Tohono O'Odham (51 | 2.5%), and Apache (33 | 1.6%), together accounting for 102.7% of all Window Rock residents.
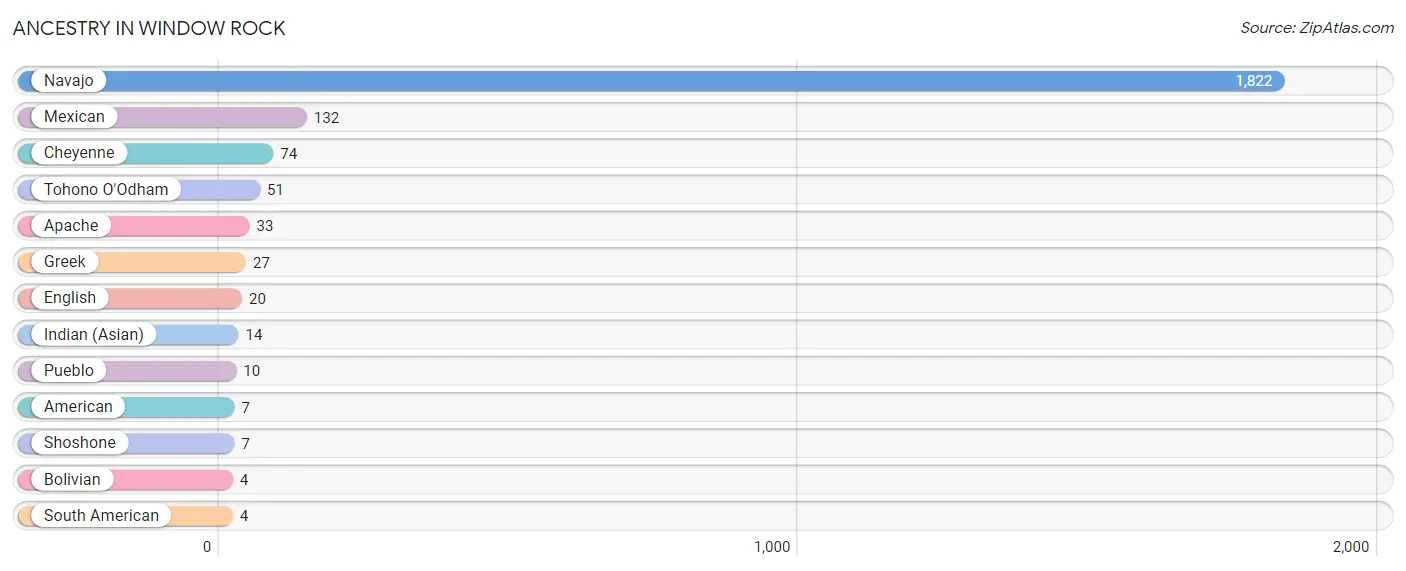
| Ancestry | # Population | % Population |
| American | 7 | 0.3% |
| Apache | 33 | 1.6% |
| Bolivian | 4 | 0.2% |
| Cheyenne | 74 | 3.6% |
| English | 20 | 1.0% |
| Greek | 27 | 1.3% |
| Indian (Asian) | 14 | 0.7% |
| Mexican | 132 | 6.4% |
| Navajo | 1,822 | 88.6% |
| Pueblo | 10 | 0.5% |
| Shoshone | 7 | 0.3% |
| South American | 4 | 0.2% |
| Tohono O'Odham | 51 | 2.5% | View All 13 Rows |
Immigrants in Window Rock
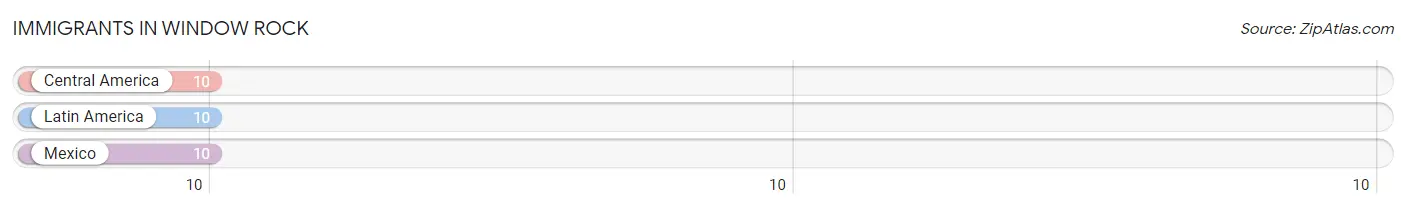
The most numerous immigrant groups reported in Window Rock came from Central America (10 | 0.5%), Latin America (10 | 0.5%), and Mexico (10 | 0.5%), together accounting for 1.5% of all Window Rock residents.
| Immigration Origin | # Population | % Population |
| Central America | 10 | 0.5% |
| Latin America | 10 | 0.5% |
| Mexico | 10 | 0.5% | View All 3 Rows |
Sex and Age in Window Rock
Sex and Age in Window Rock
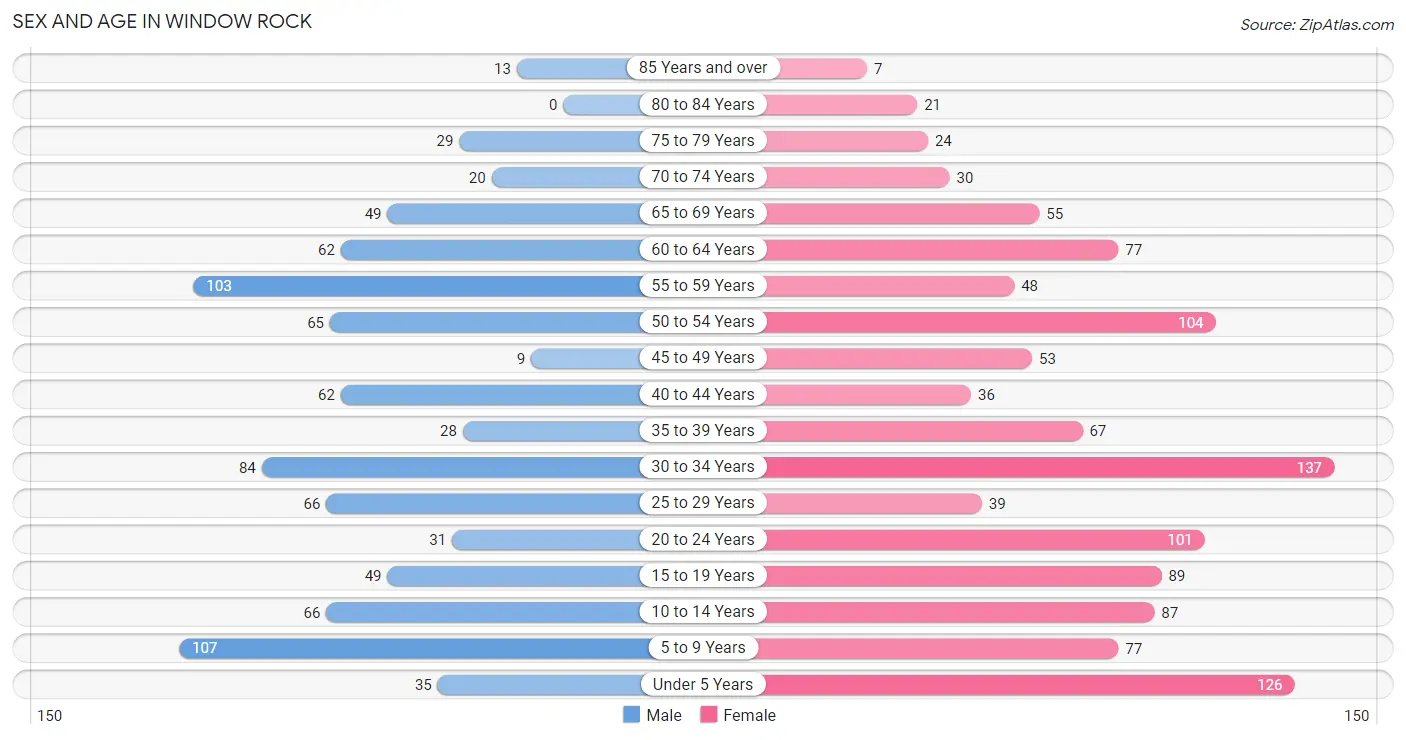
The most populous age groups in Window Rock are 5 to 9 Years (107 | 12.2%) for men and 30 to 34 Years (137 | 11.6%) for women.
| Age Bracket | Male | Female |
| Under 5 Years | 35 (4.0%) | 126 (10.7%) |
| 5 to 9 Years | 107 (12.2%) | 77 (6.5%) |
| 10 to 14 Years | 66 (7.5%) | 87 (7.4%) |
| 15 to 19 Years | 49 (5.6%) | 89 (7.6%) |
| 20 to 24 Years | 31 (3.5%) | 101 (8.6%) |
| 25 to 29 Years | 66 (7.5%) | 39 (3.3%) |
| 30 to 34 Years | 84 (9.6%) | 137 (11.6%) |
| 35 to 39 Years | 28 (3.2%) | 67 (5.7%) |
| 40 to 44 Years | 62 (7.1%) | 36 (3.1%) |
| 45 to 49 Years | 9 (1.0%) | 53 (4.5%) |
| 50 to 54 Years | 65 (7.4%) | 104 (8.8%) |
| 55 to 59 Years | 103 (11.7%) | 48 (4.1%) |
| 60 to 64 Years | 62 (7.1%) | 77 (6.5%) |
| 65 to 69 Years | 49 (5.6%) | 55 (4.7%) |
| 70 to 74 Years | 20 (2.3%) | 30 (2.5%) |
| 75 to 79 Years | 29 (3.3%) | 24 (2.0%) |
| 80 to 84 Years | 0 (0.0%) | 21 (1.8%) |
| 85 Years and over | 13 (1.5%) | 7 (0.6%) |
| Total | 878 (100.0%) | 1,178 (100.0%) |
Families and Households in Window Rock
Median Family Size in Window Rock
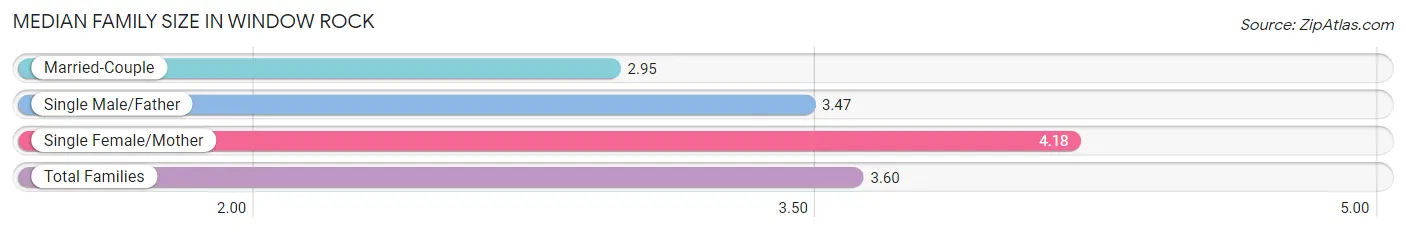
The median family size in Window Rock is 3.60 persons per family, with single female/mother families (203 | 51.0%) accounting for the largest median family size of 4.18 persons per family. On the other hand, married-couple families (176 | 44.2%) represent the smallest median family size with 2.95 persons per family.
| Family Type | # Families | Family Size |
| Married-Couple | 176 (44.2%) | 2.95 |
| Single Male/Father | 19 (4.8%) | 3.47 |
| Single Female/Mother | 203 (51.0%) | 4.18 |
| Total Families | 398 (100.0%) | 3.60 |
Median Household Size in Window Rock
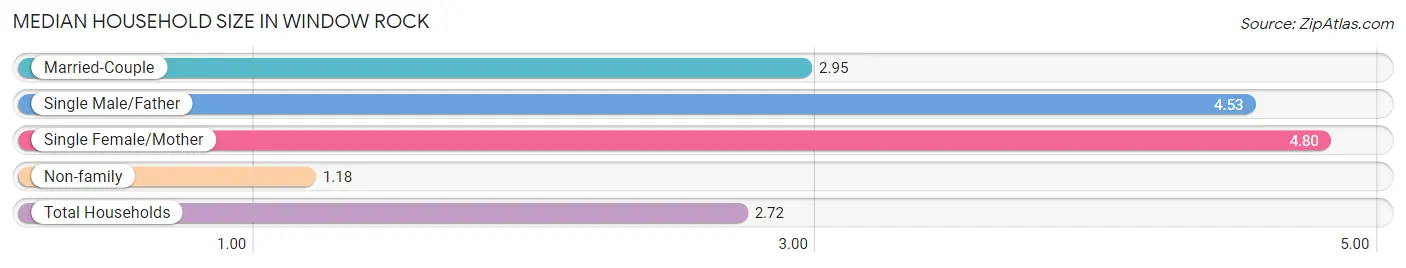
The median household size in Window Rock is 2.72 persons per household, with single female/mother households (203 | 28.2%) accounting for the largest median household size of 4.8 persons per household. non-family households (322 | 44.7%) represent the smallest median household size with 1.18 persons per household.
| Household Type | # Households | Household Size |
| Married-Couple | 176 (24.4%) | 2.95 |
| Single Male/Father | 19 (2.6%) | 4.53 |
| Single Female/Mother | 203 (28.2%) | 4.80 |
| Non-family | 322 (44.7%) | 1.18 |
| Total Households | 720 (100.0%) | 2.72 |
Household Size by Marriage Status in Window Rock
Out of a total of 720 households in Window Rock, 398 (55.3%) are family households, while 322 (44.7%) are nonfamily households. The most numerous type of family households are 2-person households, comprising 189, and the most common type of nonfamily households are 1-person households, comprising 289.
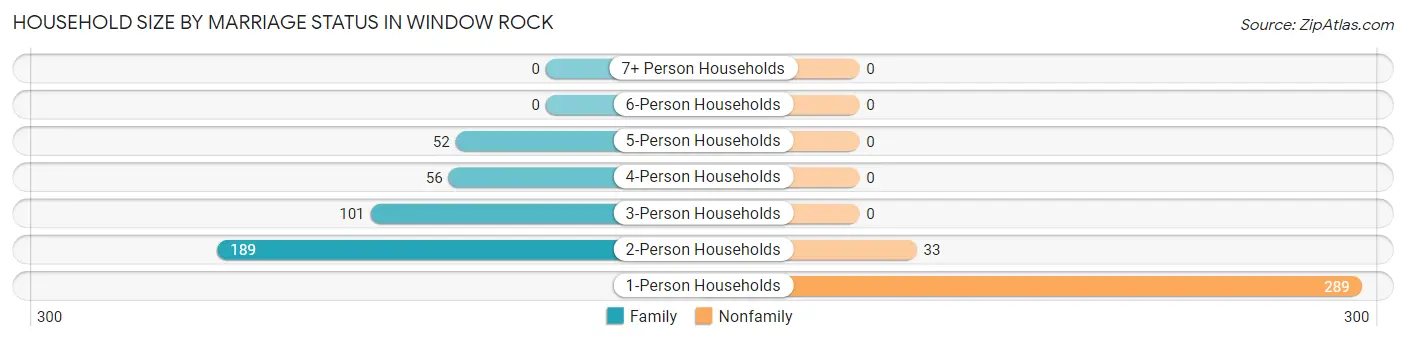
| Household Size | Family Households | Nonfamily Households |
| 1-Person Households | - | 289 (40.1%) |
| 2-Person Households | 189 (26.3%) | 33 (4.6%) |
| 3-Person Households | 101 (14.0%) | 0 (0.0%) |
| 4-Person Households | 56 (7.8%) | 0 (0.0%) |
| 5-Person Households | 52 (7.2%) | 0 (0.0%) |
| 6-Person Households | 0 (0.0%) | 0 (0.0%) |
| 7+ Person Households | 0 (0.0%) | 0 (0.0%) |
| Total | 398 (55.3%) | 322 (44.7%) |
Female Fertility in Window Rock
Fertility by Age in Window Rock
Average fertility rate in Window Rock is 52.0 births per 1,000 women. Women in the age bracket of 20 to 34 years have the highest fertility rate with 69.0 births per 1,000 women. Women in the age bracket of 20 to 34 years acount for 63.3% of all women with births.
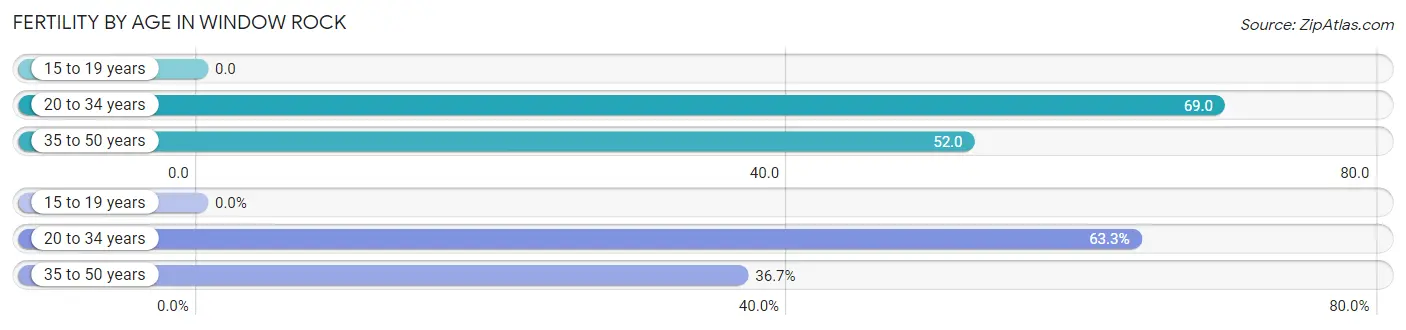
| Age Bracket | Women with Births | Births / 1,000 Women |
| 15 to 19 years | 0 (0.0%) | 0.0 |
| 20 to 34 years | 19 (63.3%) | 69.0 |
| 35 to 50 years | 11 (36.7%) | 52.0 |
| Total | 30 (100.0%) | 52.0 |
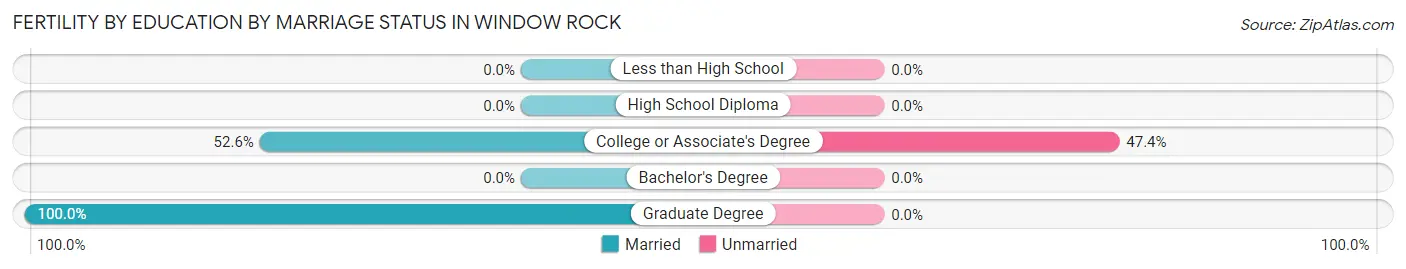
Fertility by Age by Marriage Status in Window Rock
70.0% of women with births (30) in Window Rock are married. The highest percentage of unmarried women with births falls into 20 to 34 years age bracket with 47.4% of them unmarried at the time of birth, while the lowest percentage of unmarried women with births belong to 35 to 50 years age bracket with 0.0% of them unmarried.
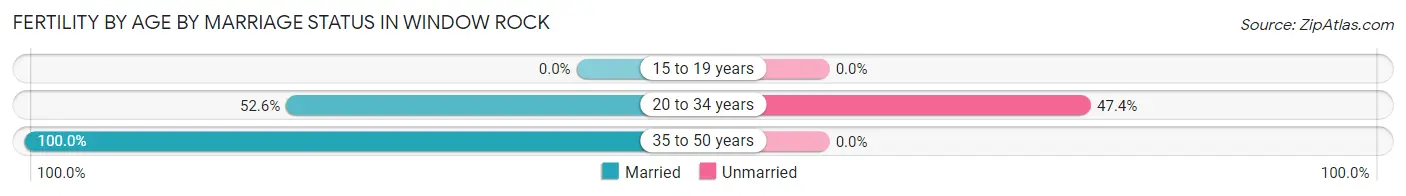
| Age Bracket | Married | Unmarried |
| 15 to 19 years | 0 (0.0%) | 0 (0.0%) |
| 20 to 34 years | 10 (52.6%) | 9 (47.4%) |
| 35 to 50 years | 11 (100.0%) | 0 (0.0%) |
| Total | 21 (70.0%) | 9 (30.0%) |
Fertility by Education in Window Rock
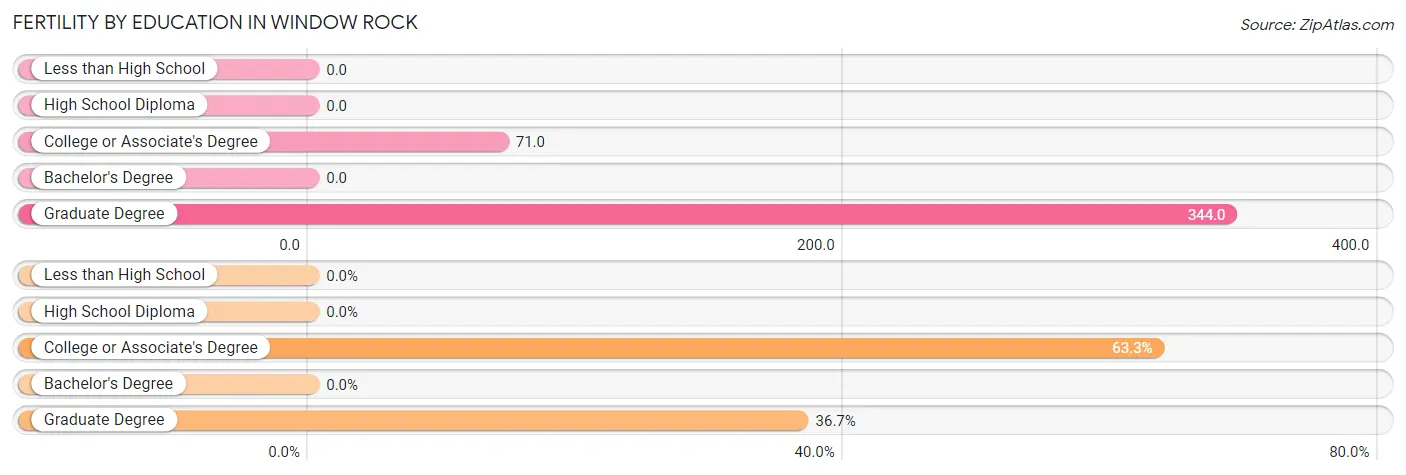
| Educational Attainment | Women with Births | Births / 1,000 Women |
| Less than High School | 0 (0.0%) | 0.0 |
| High School Diploma | 0 (0.0%) | 0.0 |
| College or Associate's Degree | 19 (63.3%) | 71.0 |
| Bachelor's Degree | 0 (0.0%) | 0.0 |
| Graduate Degree | 11 (36.7%) | 344.0 |
| Total | 30 (100.0%) | 52.0 |
Fertility by Education by Marriage Status in Window Rock
30.0% of women with births in Window Rock are unmarried. Women with the educational attainment of graduate degree are most likely to be married with 100.0% of them married at childbirth, while women with the educational attainment of college or associate's degree are least likely to be married with 47.4% of them unmarried at childbirth.
| Educational Attainment | Married | Unmarried |
| Less than High School | 0 (0.0%) | 0 (0.0%) |
| High School Diploma | 0 (0.0%) | 0 (0.0%) |
| College or Associate's Degree | 10 (52.6%) | 9 (47.4%) |
| Bachelor's Degree | 0 (0.0%) | 0 (0.0%) |
| Graduate Degree | 11 (100.0%) | 0 (0.0%) |
| Total | 21 (70.0%) | 9 (30.0%) |
Employment Characteristics in Window Rock
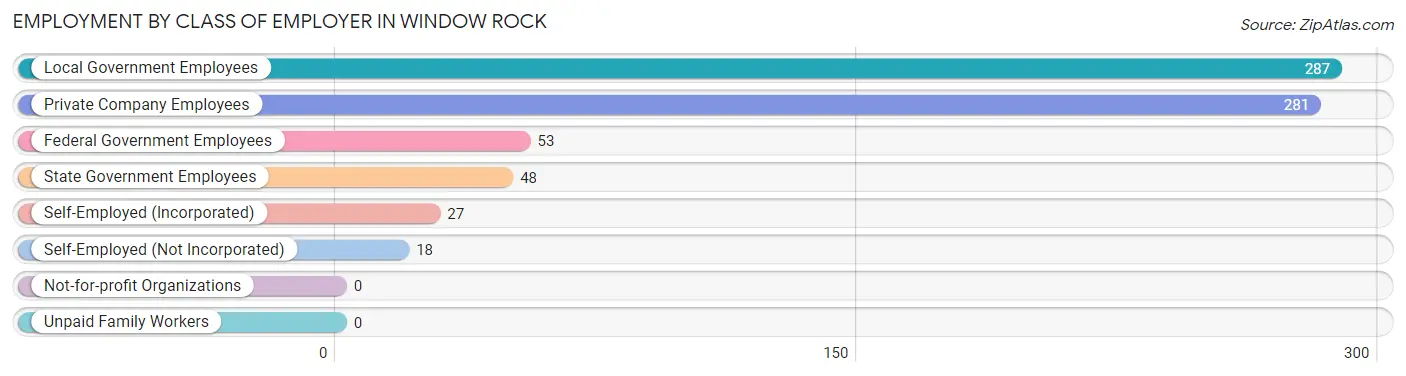
Employment by Class of Employer in Window Rock
Among the 714 employed individuals in Window Rock, local government employees (287 | 40.2%), private company employees (281 | 39.4%), and federal government employees (53 | 7.4%) make up the most common classes of employment.
| Employer Class | # Employees | % Employees |
| Private Company Employees | 281 | 39.4% |
| Self-Employed (Incorporated) | 27 | 3.8% |
| Self-Employed (Not Incorporated) | 18 | 2.5% |
| Not-for-profit Organizations | 0 | 0.0% |
| Local Government Employees | 287 | 40.2% |
| State Government Employees | 48 | 6.7% |
| Federal Government Employees | 53 | 7.4% |
| Unpaid Family Workers | 0 | 0.0% |
| Total | 714 | 100.0% |
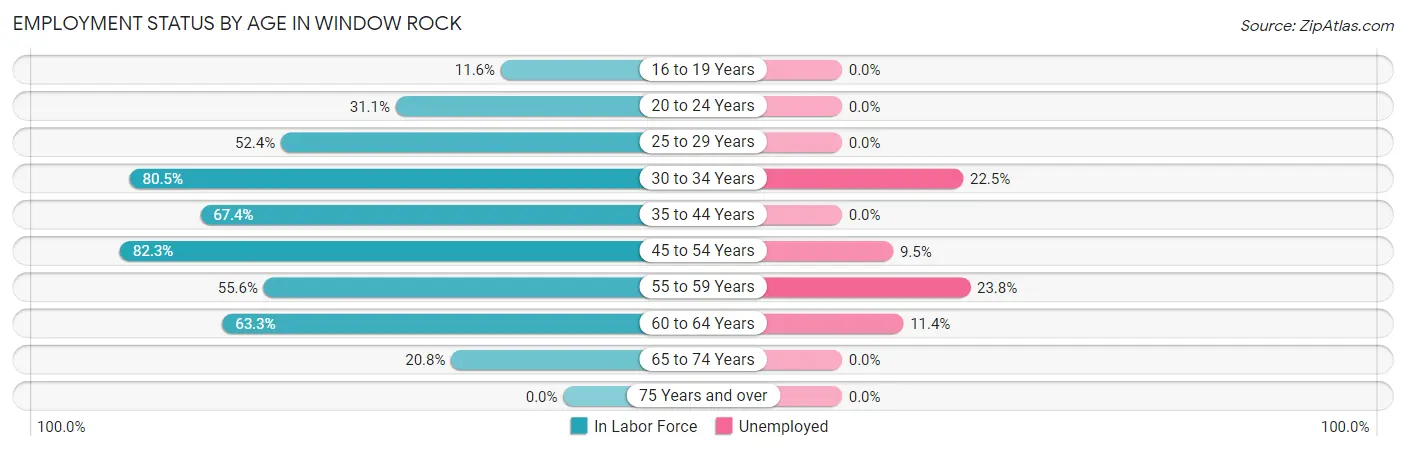
Employment Status by Age in Window Rock
According to the labor force statistics for Window Rock, out of the total population over 16 years of age (1,541), 52.7% or 812 individuals are in the labor force, with 10.8% or 88 of them unemployed. The age group with the highest labor force participation rate is 45 to 54 years, with 82.3% or 190 individuals in the labor force. Within the labor force, the 55 to 59 years age range has the highest percentage of unemployed individuals, with 23.8% or 20 of them being unemployed.
| Age Bracket | In Labor Force | Unemployed |
| 16 to 19 Years | 14 (11.6%) | 0 (0.0%) |
| 20 to 24 Years | 41 (31.1%) | 0 (0.0%) |
| 25 to 29 Years | 55 (52.4%) | 0 (0.0%) |
| 30 to 34 Years | 178 (80.5%) | 40 (22.5%) |
| 35 to 44 Years | 130 (67.4%) | 0 (0.0%) |
| 45 to 54 Years | 190 (82.3%) | 18 (9.5%) |
| 55 to 59 Years | 84 (55.6%) | 20 (23.8%) |
| 60 to 64 Years | 88 (63.3%) | 10 (11.4%) |
| 65 to 74 Years | 32 (20.8%) | 0 (0.0%) |
| 75 Years and over | 0 (0.0%) | 0 (0.0%) |
| Total | 812 (52.7%) | 88 (10.8%) |
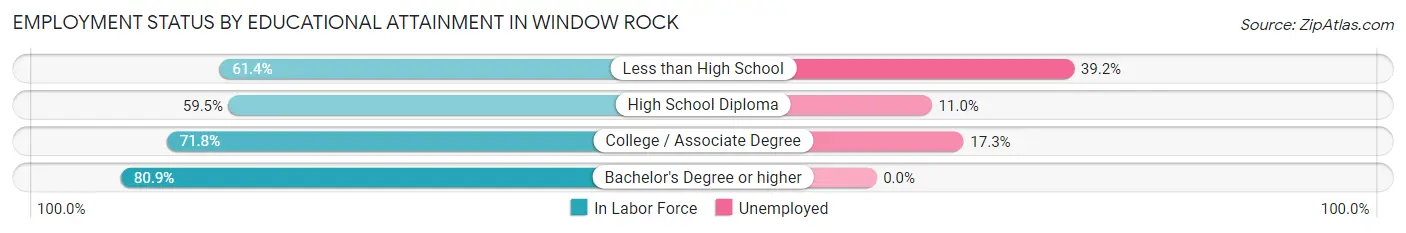
Employment Status by Educational Attainment in Window Rock
According to labor force statistics for Window Rock, 69.7% of individuals (725) out of the total population between 25 and 64 years of age (1,040) are in the labor force, with 12.1% or 88 of them being unemployed. The group with the highest labor force participation rate are those with the educational attainment of bachelor's degree or higher, with 80.9% or 216 individuals in the labor force. Within the labor force, individuals with less than high school education have the highest percentage of unemployment, with 39.2% or 20 of them being unemployed.
| Educational Attainment | In Labor Force | Unemployed |
| Less than High School | 51 (61.4%) | 33 (39.2%) |
| High School Diploma | 181 (59.5%) | 33 (11.0%) |
| College / Associate Degree | 277 (71.8%) | 67 (17.3%) |
| Bachelor's Degree or higher | 216 (80.9%) | 0 (0.0%) |
| Total | 725 (69.7%) | 126 (12.1%) |
Employment Occupations by Sex in Window Rock
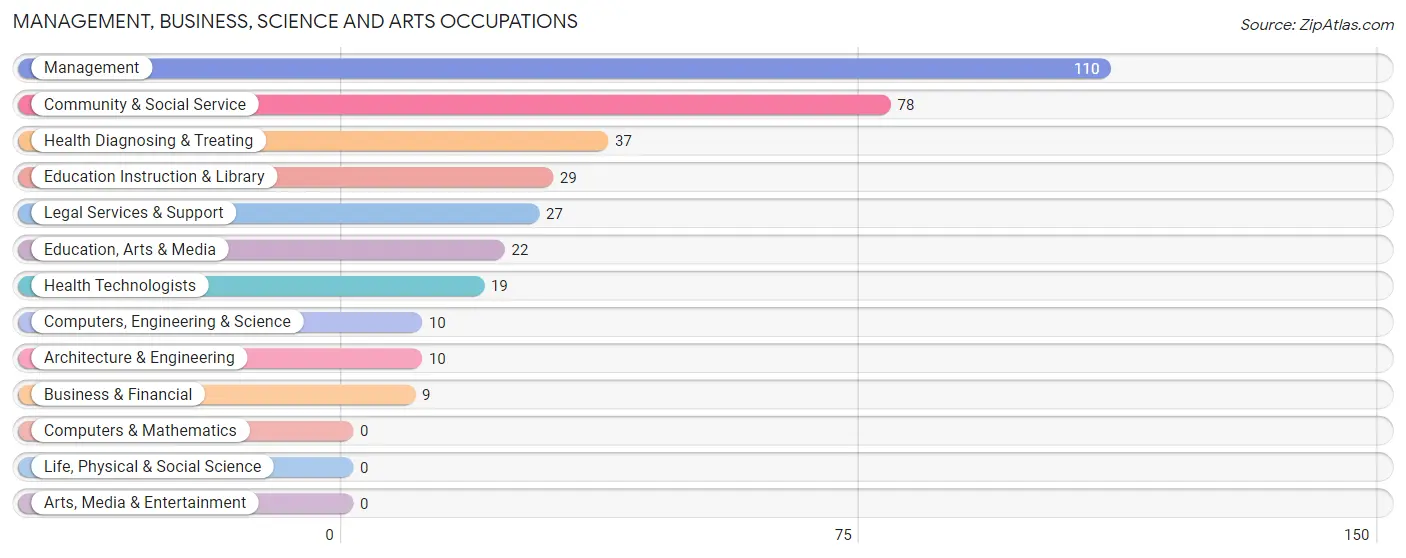
Management, Business, Science and Arts Occupations
The most common Management, Business, Science and Arts occupations in Window Rock are Management (110 | 15.2%), Community & Social Service (78 | 10.8%), Health Diagnosing & Treating (37 | 5.1%), Education Instruction & Library (29 | 4.0%), and Legal Services & Support (27 | 3.7%).
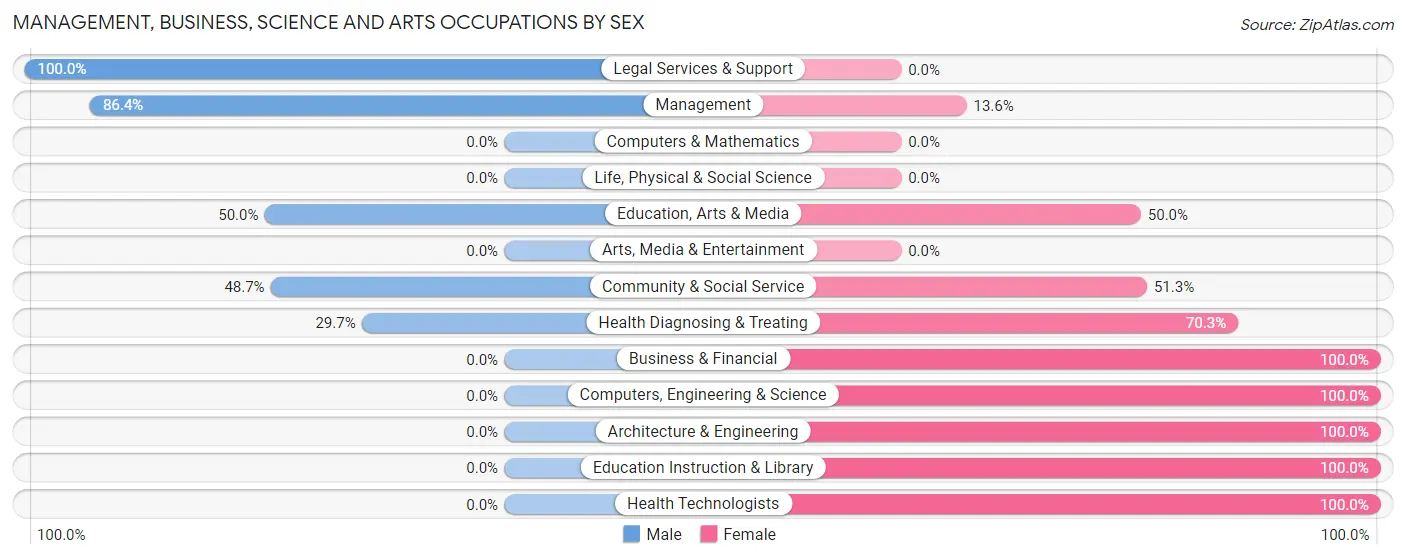
Management, Business, Science and Arts Occupations by Sex
Within the Management, Business, Science and Arts occupations in Window Rock, the most male-oriented occupations are Legal Services & Support (100.0%), Management (86.4%), and Education, Arts & Media (50.0%), while the most female-oriented occupations are Business & Financial (100.0%), Computers, Engineering & Science (100.0%), and Architecture & Engineering (100.0%).
| Occupation | Male | Female |
| Management | 95 (86.4%) | 15 (13.6%) |
| Business & Financial | 0 (0.0%) | 9 (100.0%) |
| Computers, Engineering & Science | 0 (0.0%) | 10 (100.0%) |
| Computers & Mathematics | 0 (0.0%) | 0 (0.0%) |
| Architecture & Engineering | 0 (0.0%) | 10 (100.0%) |
| Life, Physical & Social Science | 0 (0.0%) | 0 (0.0%) |
| Community & Social Service | 38 (48.7%) | 40 (51.3%) |
| Education, Arts & Media | 11 (50.0%) | 11 (50.0%) |
| Legal Services & Support | 27 (100.0%) | 0 (0.0%) |
| Education Instruction & Library | 0 (0.0%) | 29 (100.0%) |
| Arts, Media & Entertainment | 0 (0.0%) | 0 (0.0%) |
| Health Diagnosing & Treating | 11 (29.7%) | 26 (70.3%) |
| Health Technologists | 0 (0.0%) | 19 (100.0%) |
| Total (Category) | 144 (59.0%) | 100 (41.0%) |
| Total (Overall) | 355 (49.0%) | 369 (51.0%) |
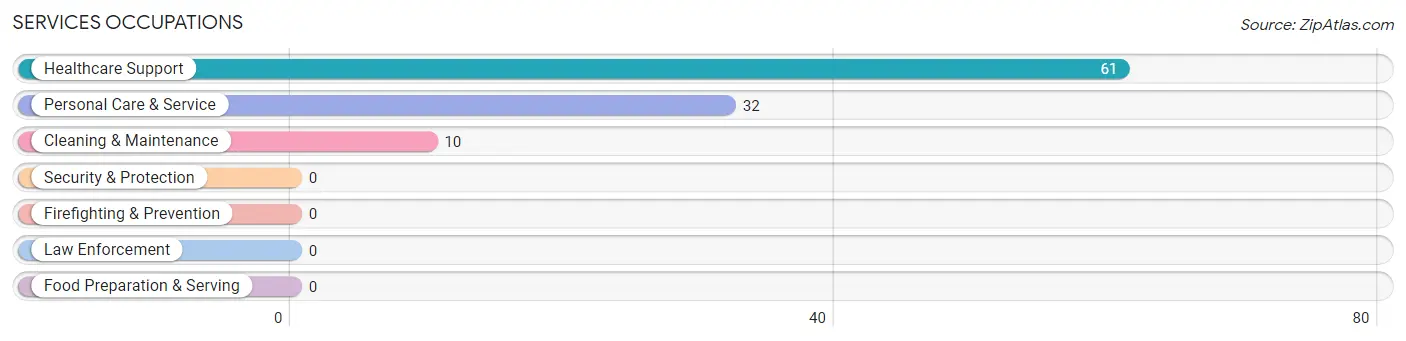
Services Occupations
The most common Services occupations in Window Rock are Healthcare Support (61 | 8.4%), Personal Care & Service (32 | 4.4%), and Cleaning & Maintenance (10 | 1.4%).
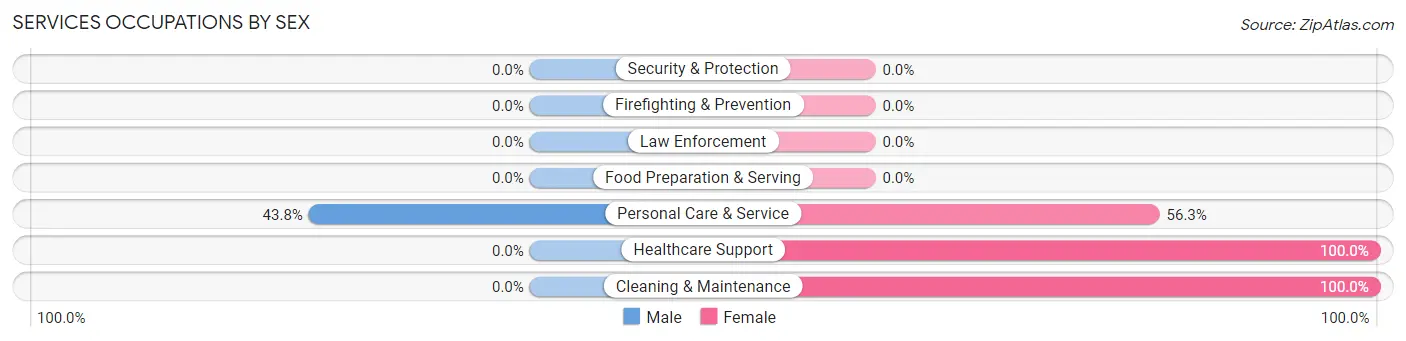
Services Occupations by Sex
| Occupation | Male | Female |
| Healthcare Support | 0 (0.0%) | 61 (100.0%) |
| Security & Protection | 0 (0.0%) | 0 (0.0%) |
| Firefighting & Prevention | 0 (0.0%) | 0 (0.0%) |
| Law Enforcement | 0 (0.0%) | 0 (0.0%) |
| Food Preparation & Serving | 0 (0.0%) | 0 (0.0%) |
| Cleaning & Maintenance | 0 (0.0%) | 10 (100.0%) |
| Personal Care & Service | 14 (43.8%) | 18 (56.2%) |
| Total (Category) | 14 (13.6%) | 89 (86.4%) |
| Total (Overall) | 355 (49.0%) | 369 (51.0%) |
Sales and Office Occupations
The most common Sales and Office occupations in Window Rock are Office & Administration (252 | 34.8%), and Sales & Related (9 | 1.2%).

Sales and Office Occupations by Sex

| Occupation | Male | Female |
| Sales & Related | 0 (0.0%) | 9 (100.0%) |
| Office & Administration | 92 (36.5%) | 160 (63.5%) |
| Total (Category) | 92 (35.2%) | 169 (64.7%) |
| Total (Overall) | 355 (49.0%) | 369 (51.0%) |
Natural Resources, Construction and Maintenance Occupations
The most common Natural Resources, Construction and Maintenance occupations in Window Rock are , and Construction & Extraction (55 | 7.6%).
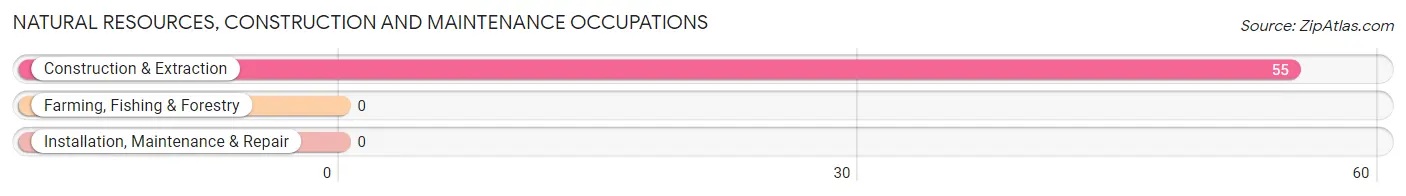
Natural Resources, Construction and Maintenance Occupations by Sex
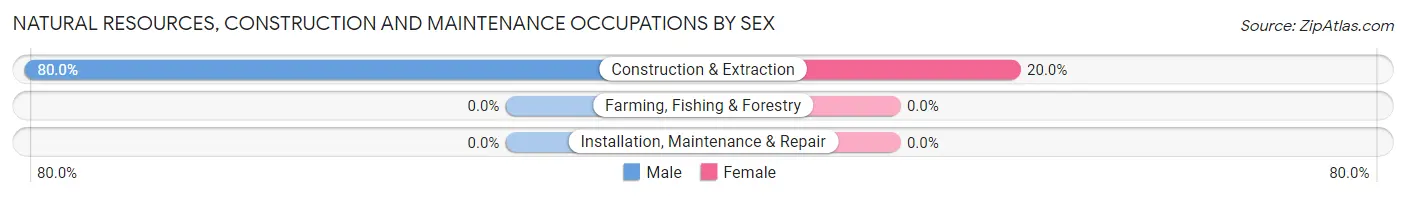
| Occupation | Male | Female |
| Farming, Fishing & Forestry | 0 (0.0%) | 0 (0.0%) |
| Construction & Extraction | 44 (80.0%) | 11 (20.0%) |
| Installation, Maintenance & Repair | 0 (0.0%) | 0 (0.0%) |
| Total (Category) | 44 (80.0%) | 11 (20.0%) |
| Total (Overall) | 355 (49.0%) | 369 (51.0%) |
Production, Transportation and Moving Occupations
The most common Production, Transportation and Moving occupations in Window Rock are Transportation (33 | 4.6%), Production (19 | 2.6%), and Material Moving (9 | 1.2%).
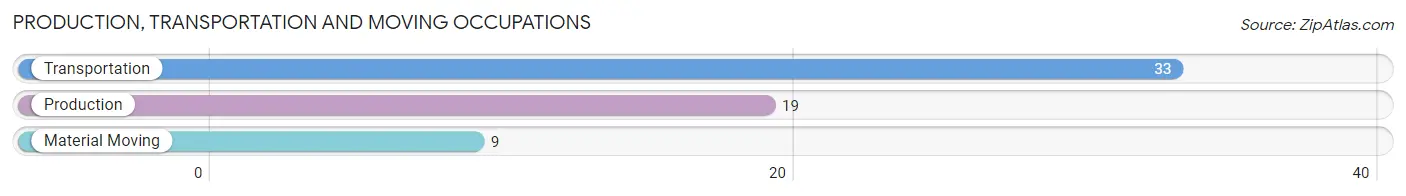
Production, Transportation and Moving Occupations by Sex
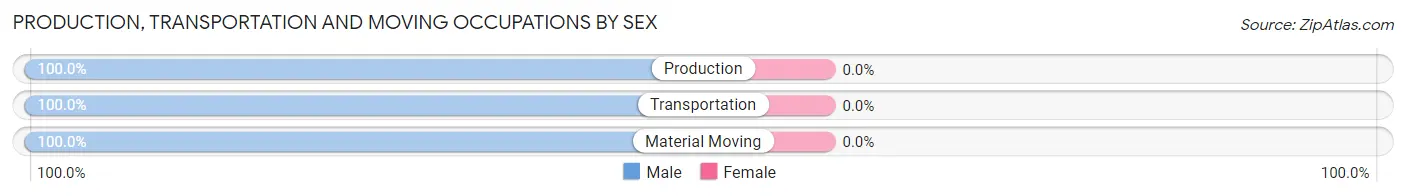
| Occupation | Male | Female |
| Production | 19 (100.0%) | 0 (0.0%) |
| Transportation | 33 (100.0%) | 0 (0.0%) |
| Material Moving | 9 (100.0%) | 0 (0.0%) |
| Total (Category) | 61 (100.0%) | 0 (0.0%) |
| Total (Overall) | 355 (49.0%) | 369 (51.0%) |
Employment Industries by Sex in Window Rock
Employment Industries in Window Rock
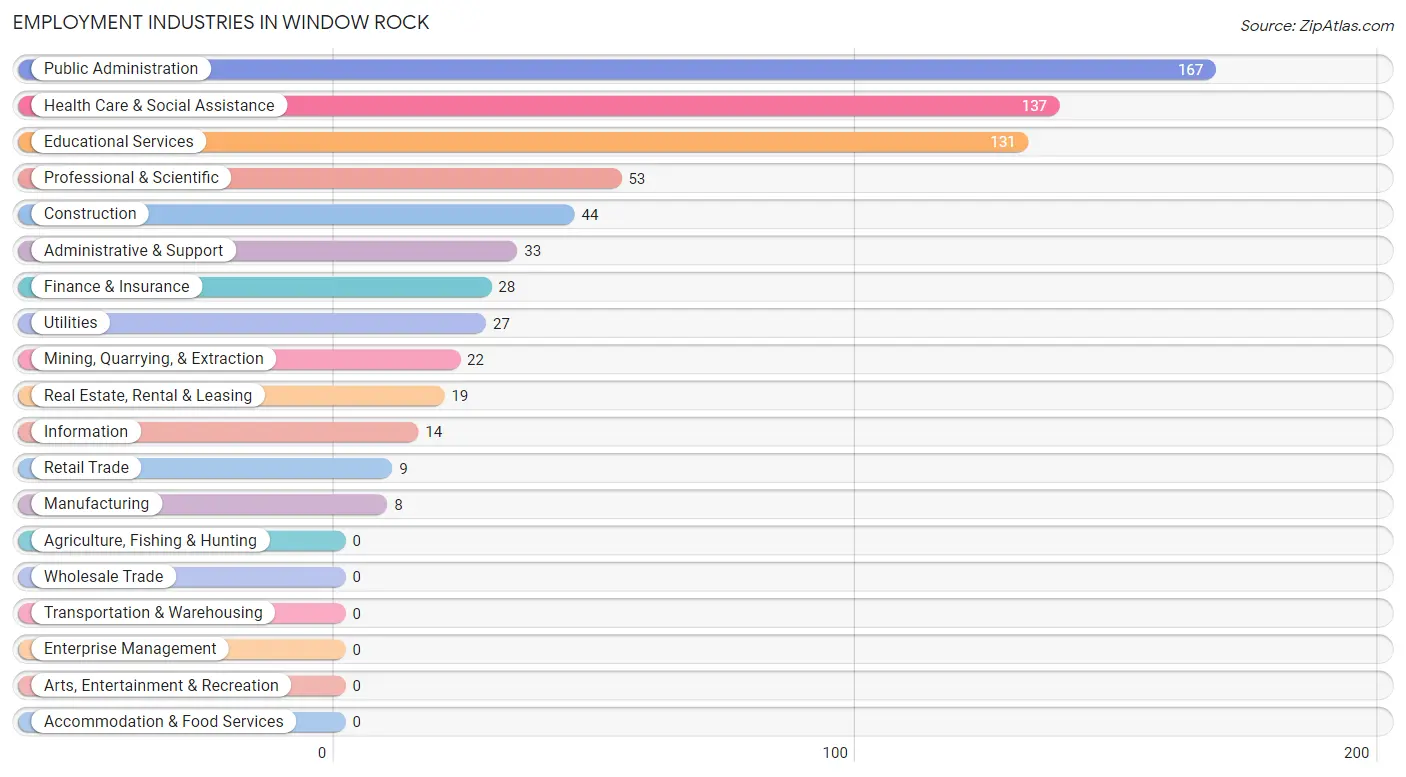
The major employment industries in Window Rock include Public Administration (167 | 23.1%), Health Care & Social Assistance (137 | 18.9%), Educational Services (131 | 18.1%), Professional & Scientific (53 | 7.3%), and Construction (44 | 6.1%).
Employment Industries by Sex in Window Rock
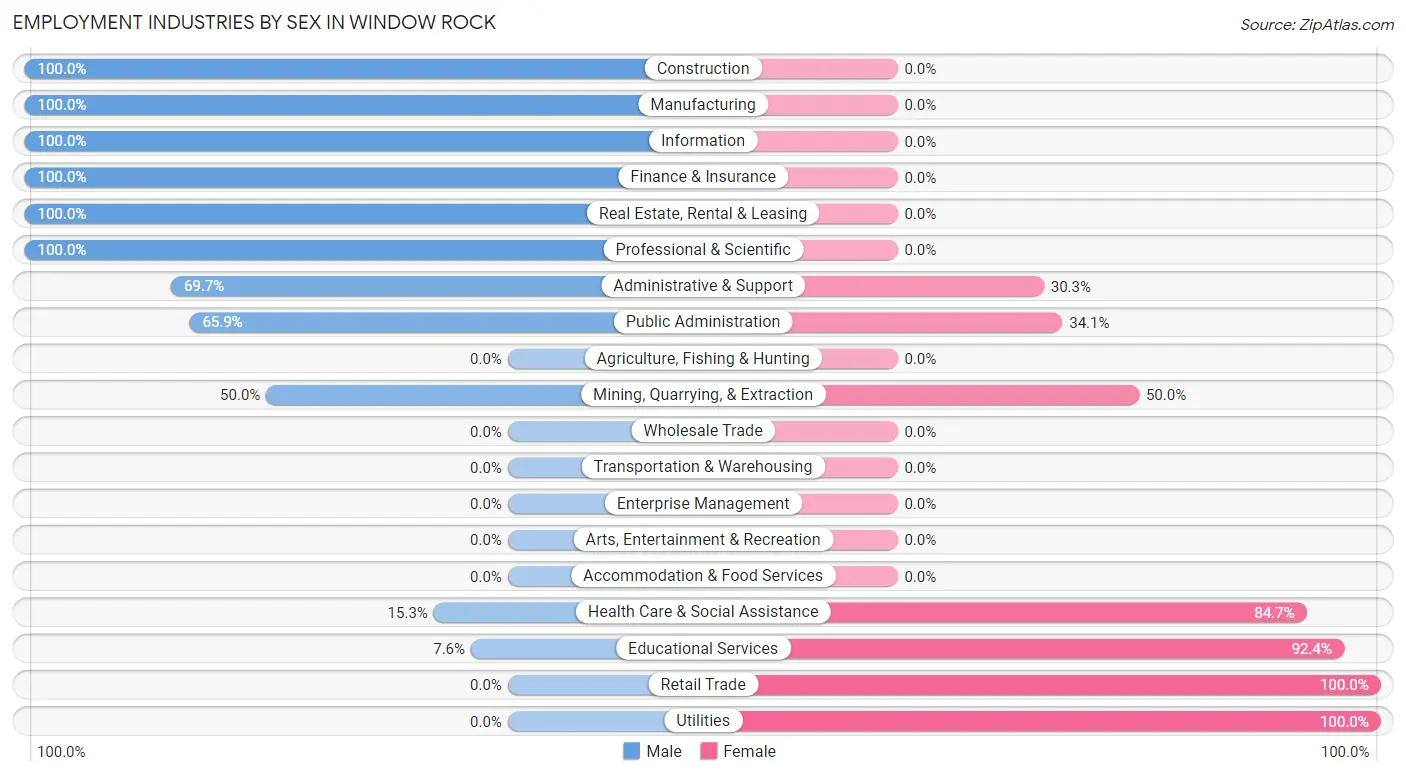
The Window Rock industries that see more men than women are Construction (100.0%), Manufacturing (100.0%), and Information (100.0%), whereas the industries that tend to have a higher number of women are Retail Trade (100.0%), Utilities (100.0%), and Educational Services (92.4%).
| Industry | Male | Female |
| Agriculture, Fishing & Hunting | 0 (0.0%) | 0 (0.0%) |
| Mining, Quarrying, & Extraction | 11 (50.0%) | 11 (50.0%) |
| Construction | 44 (100.0%) | 0 (0.0%) |
| Manufacturing | 8 (100.0%) | 0 (0.0%) |
| Wholesale Trade | 0 (0.0%) | 0 (0.0%) |
| Retail Trade | 0 (0.0%) | 9 (100.0%) |
| Transportation & Warehousing | 0 (0.0%) | 0 (0.0%) |
| Utilities | 0 (0.0%) | 27 (100.0%) |
| Information | 14 (100.0%) | 0 (0.0%) |
| Finance & Insurance | 28 (100.0%) | 0 (0.0%) |
| Real Estate, Rental & Leasing | 19 (100.0%) | 0 (0.0%) |
| Professional & Scientific | 53 (100.0%) | 0 (0.0%) |
| Enterprise Management | 0 (0.0%) | 0 (0.0%) |
| Administrative & Support | 23 (69.7%) | 10 (30.3%) |
| Educational Services | 10 (7.6%) | 121 (92.4%) |
| Health Care & Social Assistance | 21 (15.3%) | 116 (84.7%) |
| Arts, Entertainment & Recreation | 0 (0.0%) | 0 (0.0%) |
| Accommodation & Food Services | 0 (0.0%) | 0 (0.0%) |
| Public Administration | 110 (65.9%) | 57 (34.1%) |
| Total | 355 (49.0%) | 369 (51.0%) |
Education in Window Rock
School Enrollment in Window Rock
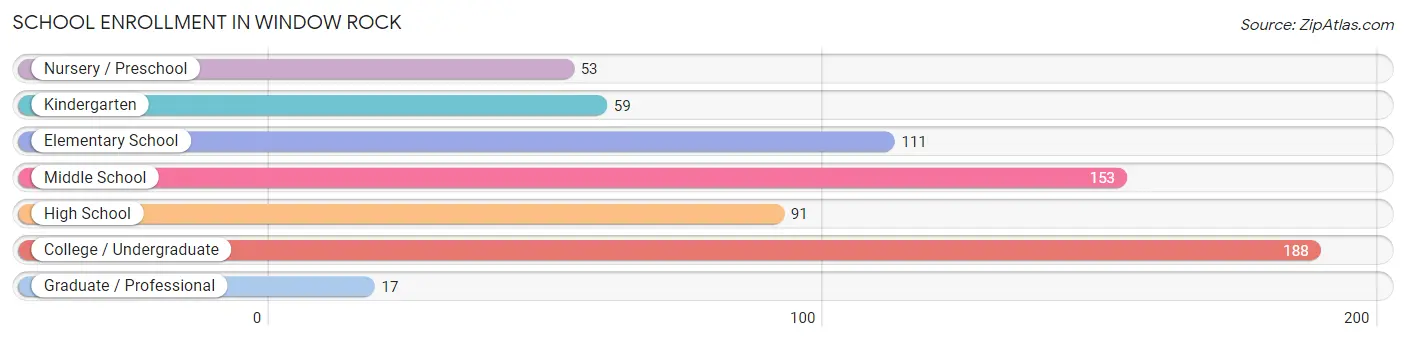
The most common levels of schooling among the 672 students in Window Rock are college / undergraduate (188 | 28.0%), middle school (153 | 22.8%), and elementary school (111 | 16.5%).
| School Level | # Students | % Students |
| Nursery / Preschool | 53 | 7.9% |
| Kindergarten | 59 | 8.8% |
| Elementary School | 111 | 16.5% |
| Middle School | 153 | 22.8% |
| High School | 91 | 13.5% |
| College / Undergraduate | 188 | 28.0% |
| Graduate / Professional | 17 | 2.5% |
| Total | 672 | 100.0% |
School Enrollment by Age by Funding Source in Window Rock
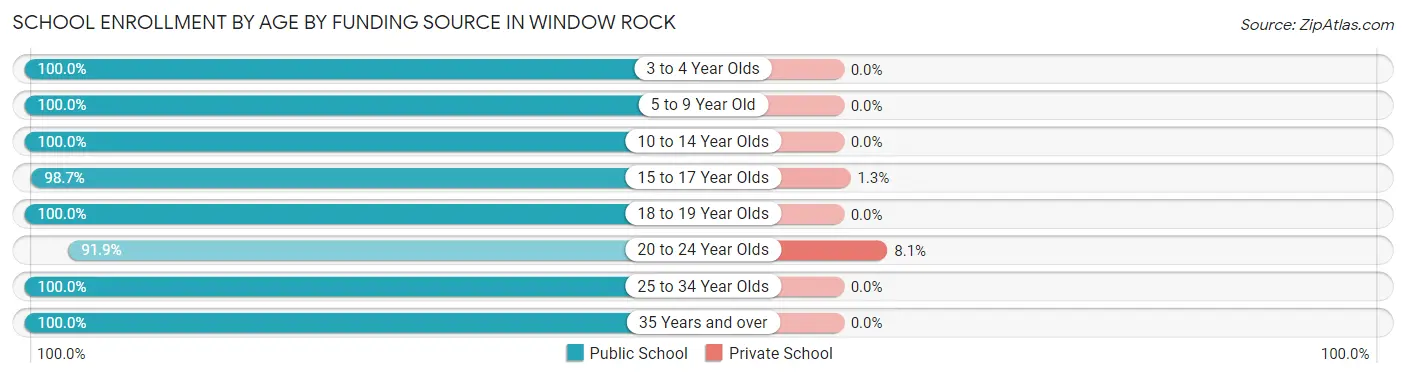
Out of a total of 672 students who are enrolled in schools in Window Rock, 8 (1.2%) attend a private institution, while the remaining 664 (98.8%) are enrolled in public schools. The age group of 20 to 24 year olds has the highest likelihood of being enrolled in private schools, with 7 (8.1% in the age bracket) enrolled. Conversely, the age group of 3 to 4 year olds has the lowest likelihood of being enrolled in a private school, with 39 (100.0% in the age bracket) attending a public institution.
| Age Bracket | Public School | Private School |
| 3 to 4 Year Olds | 39 (100.0%) | 0 (0.0%) |
| 5 to 9 Year Old | 184 (100.0%) | 0 (0.0%) |
| 10 to 14 Year Olds | 153 (100.0%) | 0 (0.0%) |
| 15 to 17 Year Olds | 78 (98.7%) | 1 (1.3%) |
| 18 to 19 Year Olds | 41 (100.0%) | 0 (0.0%) |
| 20 to 24 Year Olds | 79 (91.9%) | 7 (8.1%) |
| 25 to 34 Year Olds | 35 (100.0%) | 0 (0.0%) |
| 35 Years and over | 55 (100.0%) | 0 (0.0%) |
| Total | 664 (98.8%) | 8 (1.2%) |
Educational Attainment by Field of Study in Window Rock
Education (98 | 31.8%), social sciences (96 | 31.2%), bio, nature & agricultural (20 | 6.5%), arts & humanities (19 | 6.2%), and computers & mathematics (14 | 4.5%) are the most common fields of study among 308 individuals in Window Rock who have obtained a bachelor's degree or higher.
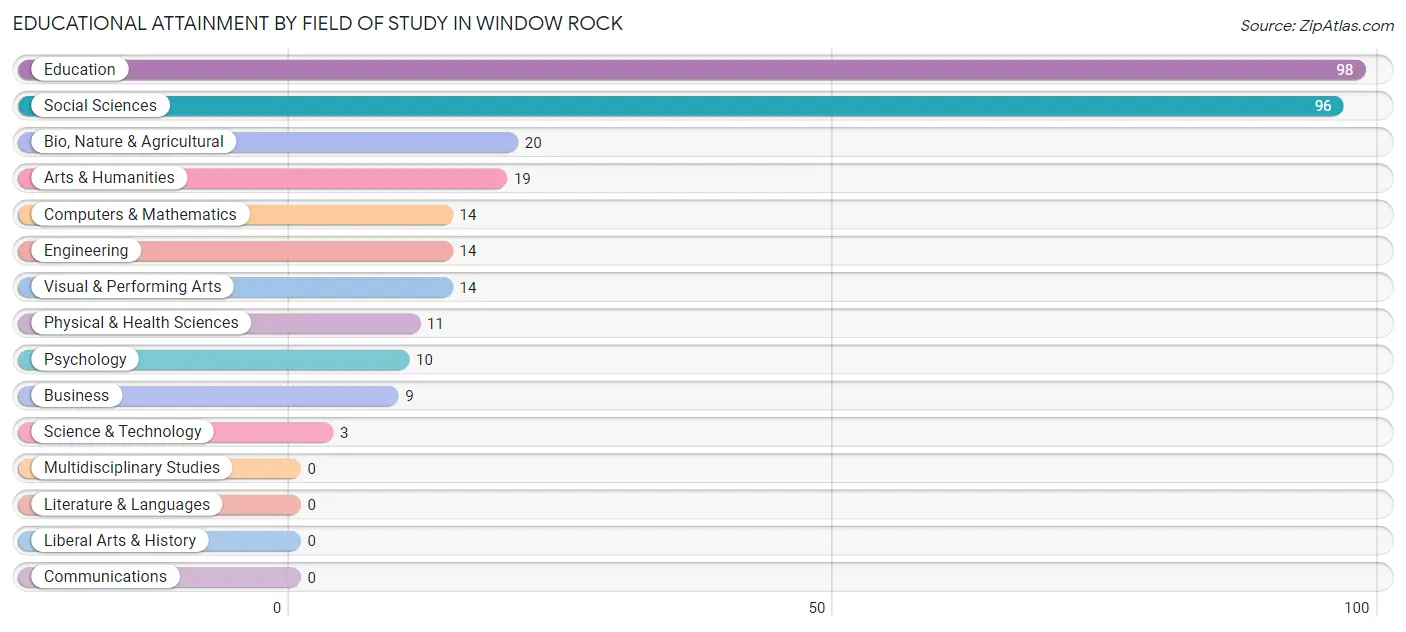
| Field of Study | # Graduates | % Graduates |
| Computers & Mathematics | 14 | 4.5% |
| Bio, Nature & Agricultural | 20 | 6.5% |
| Physical & Health Sciences | 11 | 3.6% |
| Psychology | 10 | 3.3% |
| Social Sciences | 96 | 31.2% |
| Engineering | 14 | 4.5% |
| Multidisciplinary Studies | 0 | 0.0% |
| Science & Technology | 3 | 1.0% |
| Business | 9 | 2.9% |
| Education | 98 | 31.8% |
| Literature & Languages | 0 | 0.0% |
| Liberal Arts & History | 0 | 0.0% |
| Visual & Performing Arts | 14 | 4.5% |
| Communications | 0 | 0.0% |
| Arts & Humanities | 19 | 6.2% |
| Total | 308 | 100.0% |
Transportation & Commute in Window Rock
Vehicle Availability by Sex in Window Rock
The most prevalent vehicle ownership categories in Window Rock are males with 2 vehicles (171, accounting for 49.6%) and females with 2 vehicles (69, making up 46.3%).
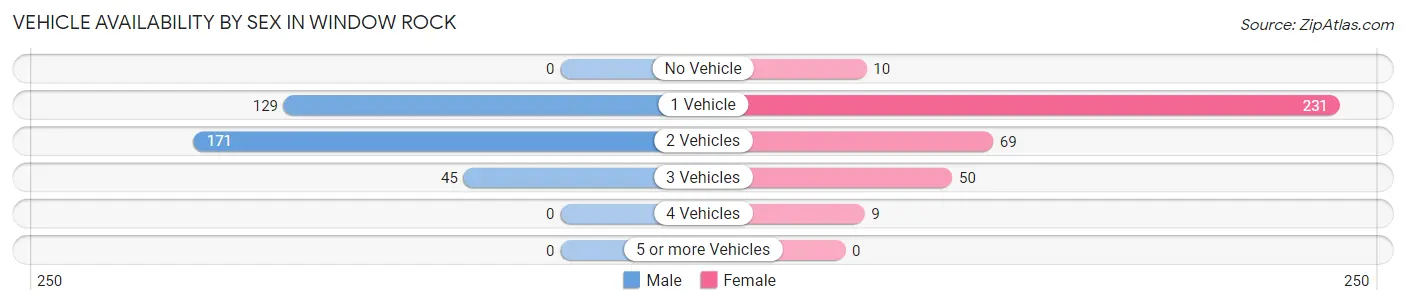
| Vehicles Available | Male | Female |
| No Vehicle | 0 (0.0%) | 10 (2.7%) |
| 1 Vehicle | 129 (37.4%) | 231 (62.6%) |
| 2 Vehicles | 171 (49.6%) | 69 (18.7%) |
| 3 Vehicles | 45 (13.0%) | 50 (13.6%) |
| 4 Vehicles | 0 (0.0%) | 9 (2.4%) |
| 5 or more Vehicles | 0 (0.0%) | 0 (0.0%) |
| Total | 345 (100.0%) | 369 (100.0%) |
Commute Time in Window Rock
The most frequently occuring commute durations in Window Rock are 15 to 19 minutes (270 commuters, 47.1%), 30 to 34 minutes (126 commuters, 22.0%), and 20 to 24 minutes (46 commuters, 8.0%).
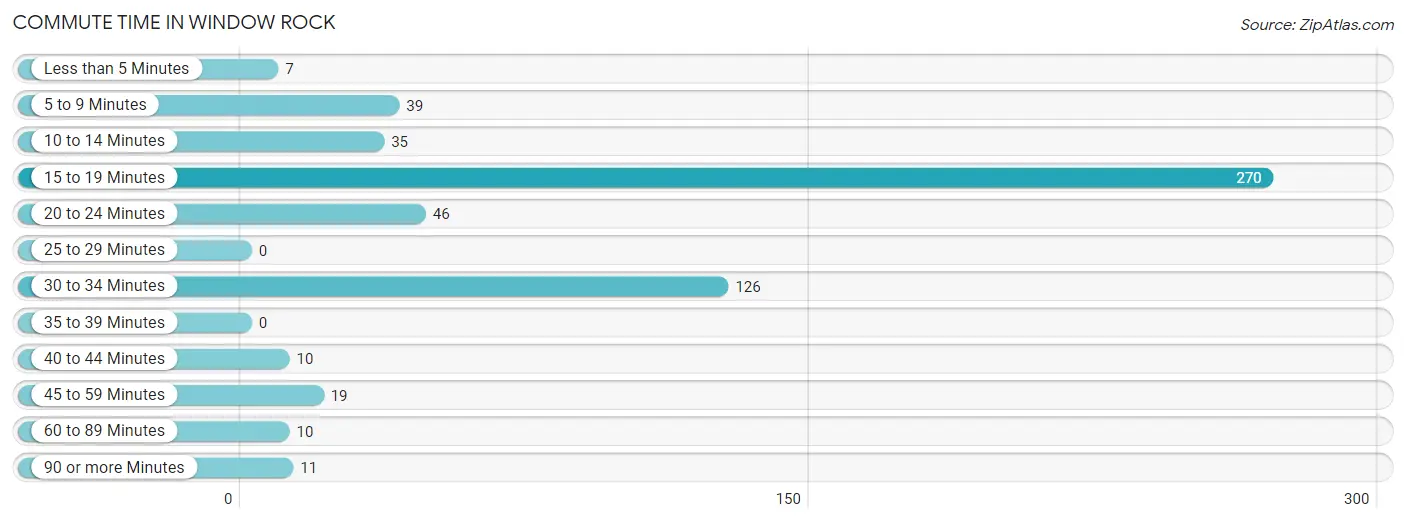
| Commute Time | # Commuters | % Commuters |
| Less than 5 Minutes | 7 | 1.2% |
| 5 to 9 Minutes | 39 | 6.8% |
| 10 to 14 Minutes | 35 | 6.1% |
| 15 to 19 Minutes | 270 | 47.1% |
| 20 to 24 Minutes | 46 | 8.0% |
| 25 to 29 Minutes | 0 | 0.0% |
| 30 to 34 Minutes | 126 | 22.0% |
| 35 to 39 Minutes | 0 | 0.0% |
| 40 to 44 Minutes | 10 | 1.8% |
| 45 to 59 Minutes | 19 | 3.3% |
| 60 to 89 Minutes | 10 | 1.8% |
| 90 or more Minutes | 11 | 1.9% |
Commute Time by Sex in Window Rock
The most common commute times in Window Rock are 15 to 19 minutes (155 commuters, 58.5%) for males and 15 to 19 minutes (115 commuters, 37.3%) for females.
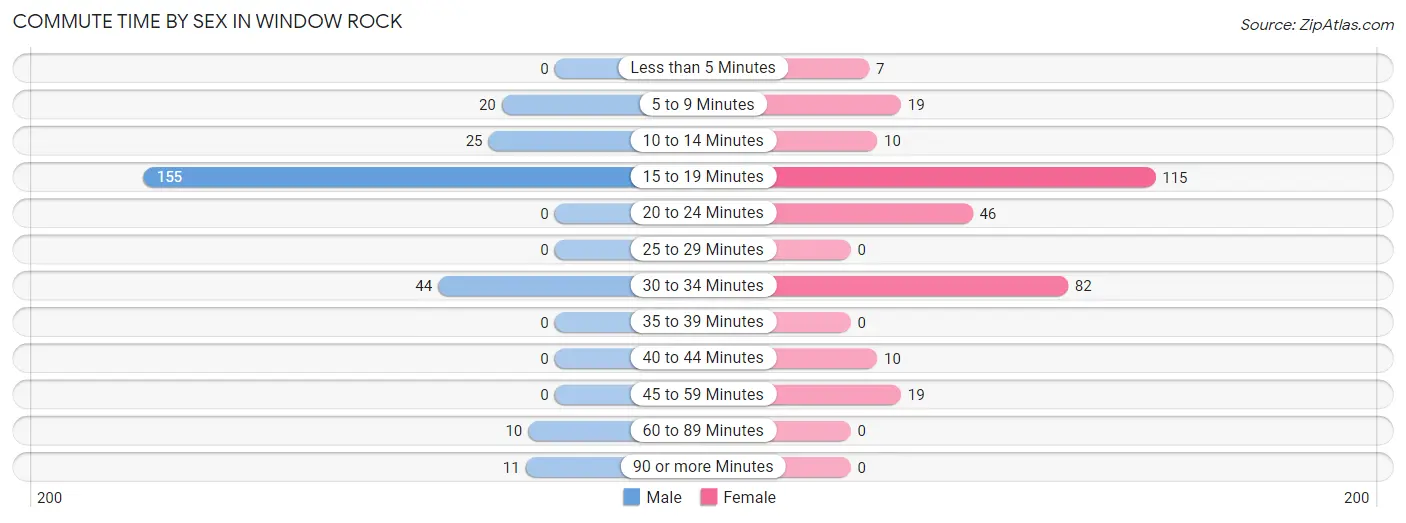
| Commute Time | Male | Female |
| Less than 5 Minutes | 0 (0.0%) | 7 (2.3%) |
| 5 to 9 Minutes | 20 (7.5%) | 19 (6.2%) |
| 10 to 14 Minutes | 25 (9.4%) | 10 (3.3%) |
| 15 to 19 Minutes | 155 (58.5%) | 115 (37.3%) |
| 20 to 24 Minutes | 0 (0.0%) | 46 (14.9%) |
| 25 to 29 Minutes | 0 (0.0%) | 0 (0.0%) |
| 30 to 34 Minutes | 44 (16.6%) | 82 (26.6%) |
| 35 to 39 Minutes | 0 (0.0%) | 0 (0.0%) |
| 40 to 44 Minutes | 0 (0.0%) | 10 (3.3%) |
| 45 to 59 Minutes | 0 (0.0%) | 19 (6.2%) |
| 60 to 89 Minutes | 10 (3.8%) | 0 (0.0%) |
| 90 or more Minutes | 11 (4.2%) | 0 (0.0%) |
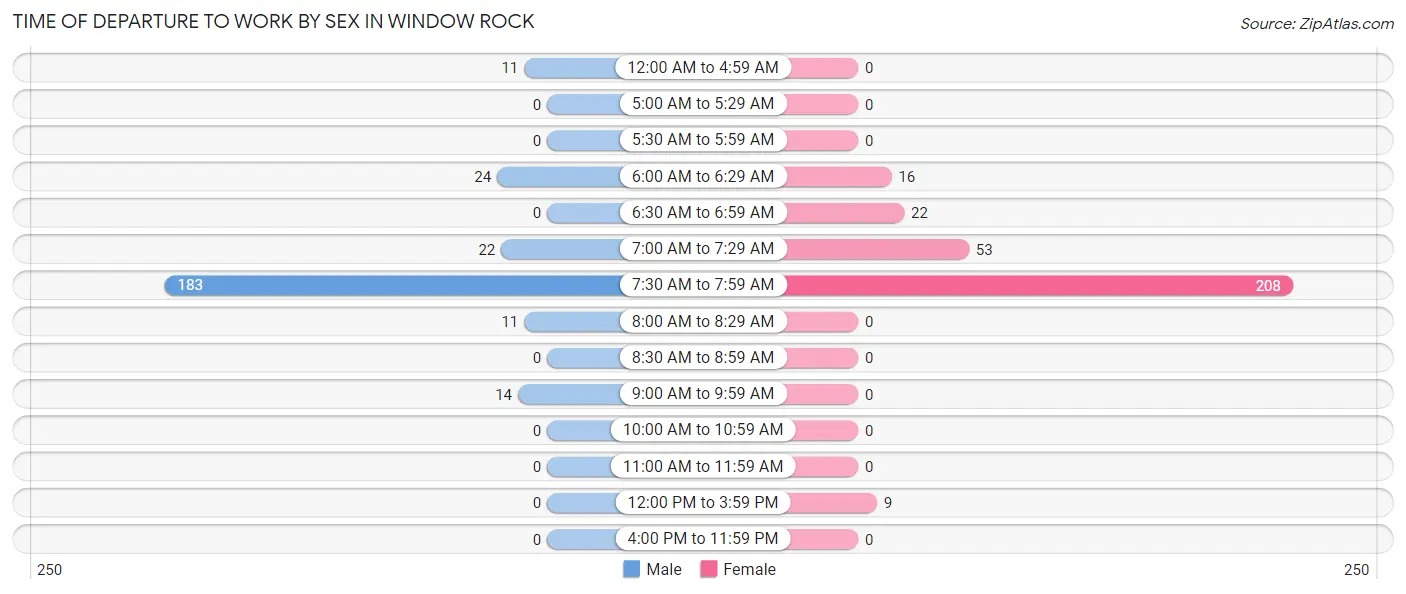
Time of Departure to Work by Sex in Window Rock
The most frequent times of departure to work in Window Rock are 7:30 AM to 7:59 AM (183, 69.1%) for males and 7:30 AM to 7:59 AM (208, 67.5%) for females.
| Time of Departure | Male | Female |
| 12:00 AM to 4:59 AM | 11 (4.2%) | 0 (0.0%) |
| 5:00 AM to 5:29 AM | 0 (0.0%) | 0 (0.0%) |
| 5:30 AM to 5:59 AM | 0 (0.0%) | 0 (0.0%) |
| 6:00 AM to 6:29 AM | 24 (9.1%) | 16 (5.2%) |
| 6:30 AM to 6:59 AM | 0 (0.0%) | 22 (7.1%) |
| 7:00 AM to 7:29 AM | 22 (8.3%) | 53 (17.2%) |
| 7:30 AM to 7:59 AM | 183 (69.1%) | 208 (67.5%) |
| 8:00 AM to 8:29 AM | 11 (4.2%) | 0 (0.0%) |
| 8:30 AM to 8:59 AM | 0 (0.0%) | 0 (0.0%) |
| 9:00 AM to 9:59 AM | 14 (5.3%) | 0 (0.0%) |
| 10:00 AM to 10:59 AM | 0 (0.0%) | 0 (0.0%) |
| 11:00 AM to 11:59 AM | 0 (0.0%) | 0 (0.0%) |
| 12:00 PM to 3:59 PM | 0 (0.0%) | 9 (2.9%) |
| 4:00 PM to 11:59 PM | 0 (0.0%) | 0 (0.0%) |
| Total | 265 (100.0%) | 308 (100.0%) |
Housing Occupancy in Window Rock
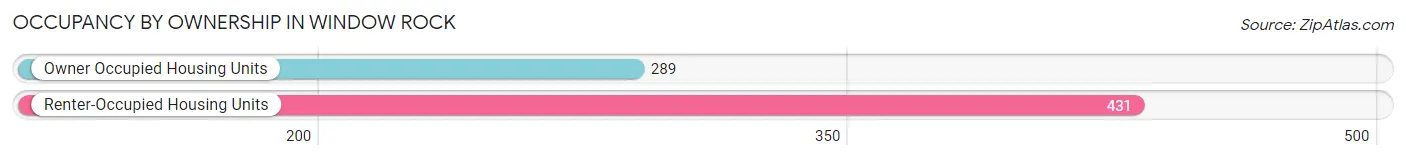
Occupancy by Ownership in Window Rock
Of the total 720 dwellings in Window Rock, owner-occupied units account for 289 (40.1%), while renter-occupied units make up 431 (59.9%).
| Occupancy | # Housing Units | % Housing Units |
| Owner Occupied Housing Units | 289 | 40.1% |
| Renter-Occupied Housing Units | 431 | 59.9% |
| Total Occupied Housing Units | 720 | 100.0% |
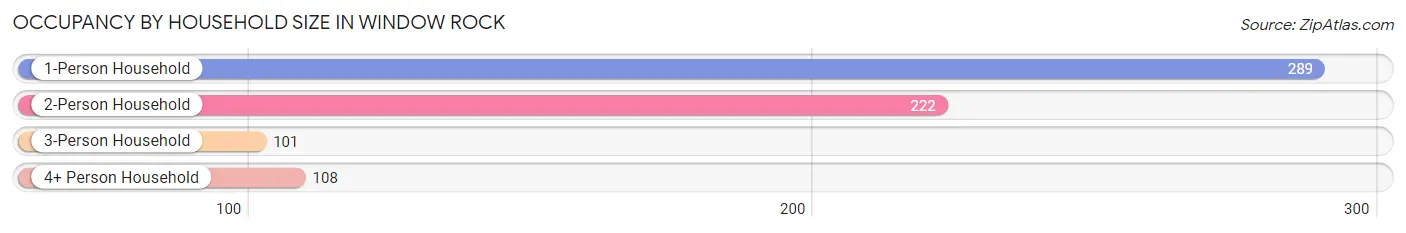
Occupancy by Household Size in Window Rock
| Household Size | # Housing Units | % Housing Units |
| 1-Person Household | 289 | 40.1% |
| 2-Person Household | 222 | 30.8% |
| 3-Person Household | 101 | 14.0% |
| 4+ Person Household | 108 | 15.0% |
| Total Housing Units | 720 | 100.0% |
Occupancy by Ownership by Household Size in Window Rock
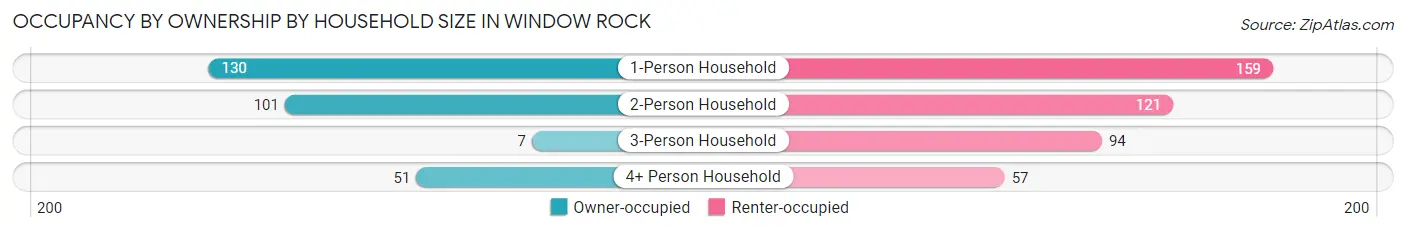
| Household Size | Owner-occupied | Renter-occupied |
| 1-Person Household | 130 (45.0%) | 159 (55.0%) |
| 2-Person Household | 101 (45.5%) | 121 (54.5%) |
| 3-Person Household | 7 (6.9%) | 94 (93.1%) |
| 4+ Person Household | 51 (47.2%) | 57 (52.8%) |
| Total Housing Units | 289 (40.1%) | 431 (59.9%) |
Occupancy by Educational Attainment in Window Rock
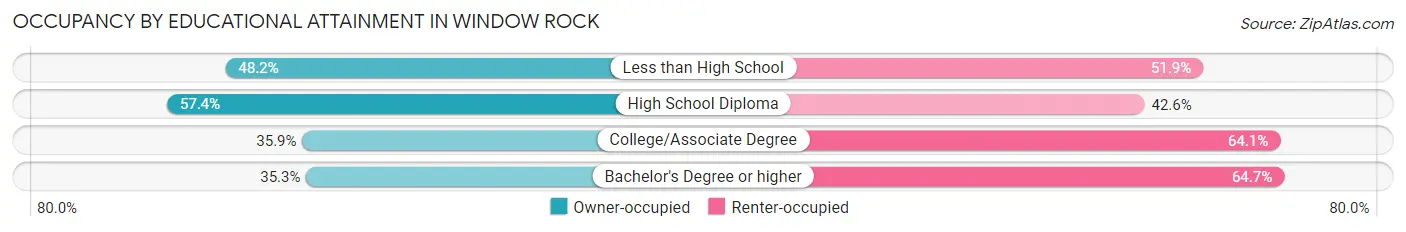
| Household Size | Owner-occupied | Renter-occupied |
| Less than High School | 39 (48.1%) | 42 (51.8%) |
| High School Diploma | 58 (57.4%) | 43 (42.6%) |
| College/Associate Degree | 115 (35.9%) | 205 (64.1%) |
| Bachelor's Degree or higher | 77 (35.3%) | 141 (64.7%) |
Occupancy by Age of Householder in Window Rock
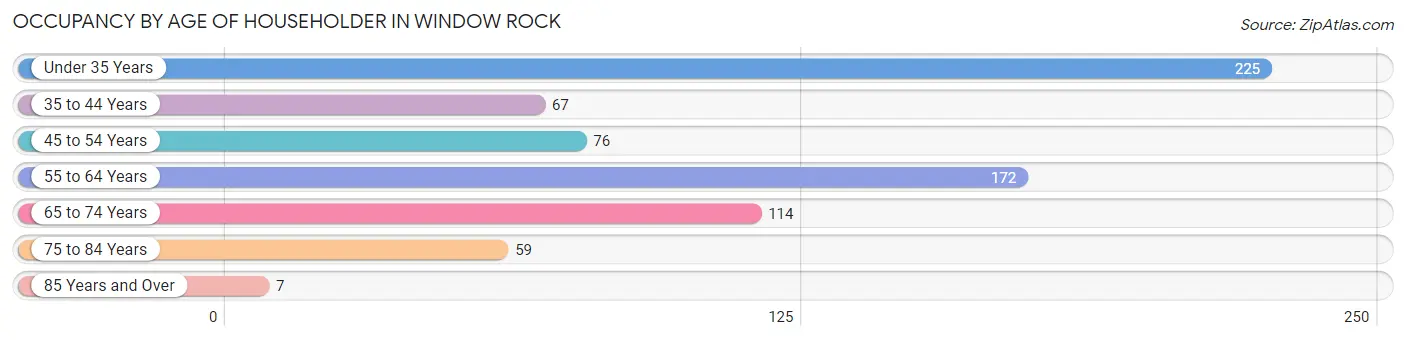
| Age Bracket | # Households | % Households |
| Under 35 Years | 225 | 31.2% |
| 35 to 44 Years | 67 | 9.3% |
| 45 to 54 Years | 76 | 10.6% |
| 55 to 64 Years | 172 | 23.9% |
| 65 to 74 Years | 114 | 15.8% |
| 75 to 84 Years | 59 | 8.2% |
| 85 Years and Over | 7 | 1.0% |
| Total | 720 | 100.0% |
Housing Finances in Window Rock
Median Income by Occupancy in Window Rock
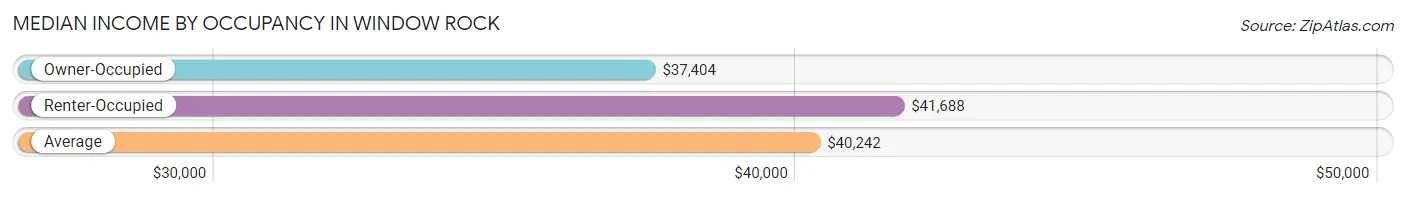
| Occupancy Type | # Households | Median Income |
| Owner-Occupied | 289 (40.1%) | $37,404 |
| Renter-Occupied | 431 (59.9%) | $41,688 |
| Average | 720 (100.0%) | $40,242 |
Occupancy by Householder Income Bracket in Window Rock
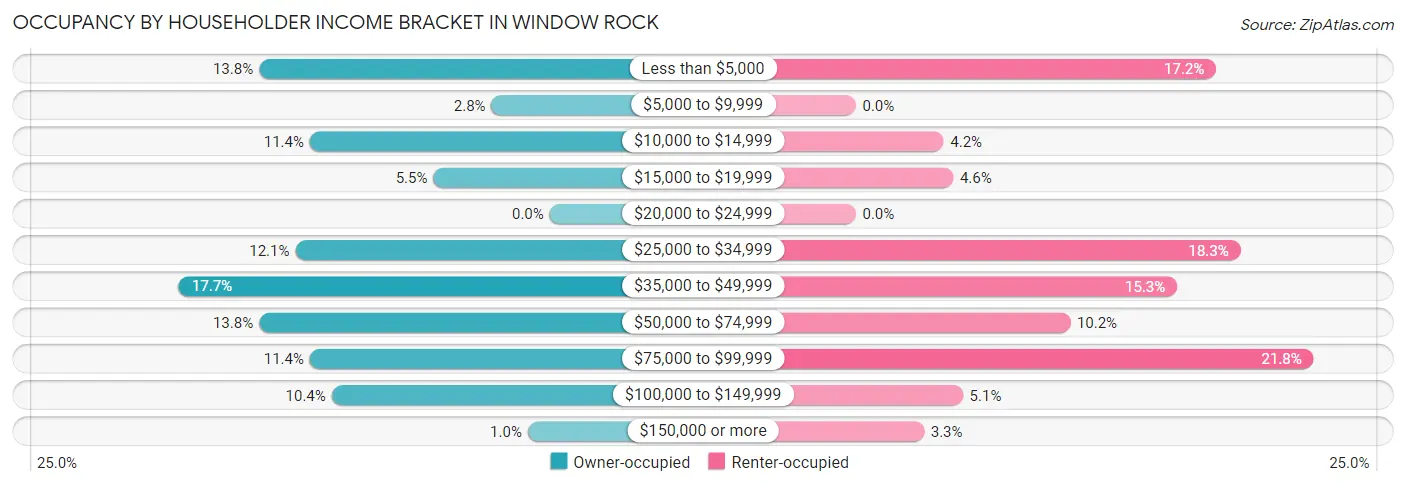
| Income Bracket | Owner-occupied | Renter-occupied |
| Less than $5,000 | 40 (13.8%) | 74 (17.2%) |
| $5,000 to $9,999 | 8 (2.8%) | 0 (0.0%) |
| $10,000 to $14,999 | 33 (11.4%) | 18 (4.2%) |
| $15,000 to $19,999 | 16 (5.5%) | 20 (4.6%) |
| $20,000 to $24,999 | 0 (0.0%) | 0 (0.0%) |
| $25,000 to $34,999 | 35 (12.1%) | 79 (18.3%) |
| $35,000 to $49,999 | 51 (17.6%) | 66 (15.3%) |
| $50,000 to $74,999 | 40 (13.8%) | 44 (10.2%) |
| $75,000 to $99,999 | 33 (11.4%) | 94 (21.8%) |
| $100,000 to $149,999 | 30 (10.4%) | 22 (5.1%) |
| $150,000 or more | 3 (1.0%) | 14 (3.3%) |
| Total | 289 (100.0%) | 431 (100.0%) |
Monthly Housing Cost Tiers in Window Rock
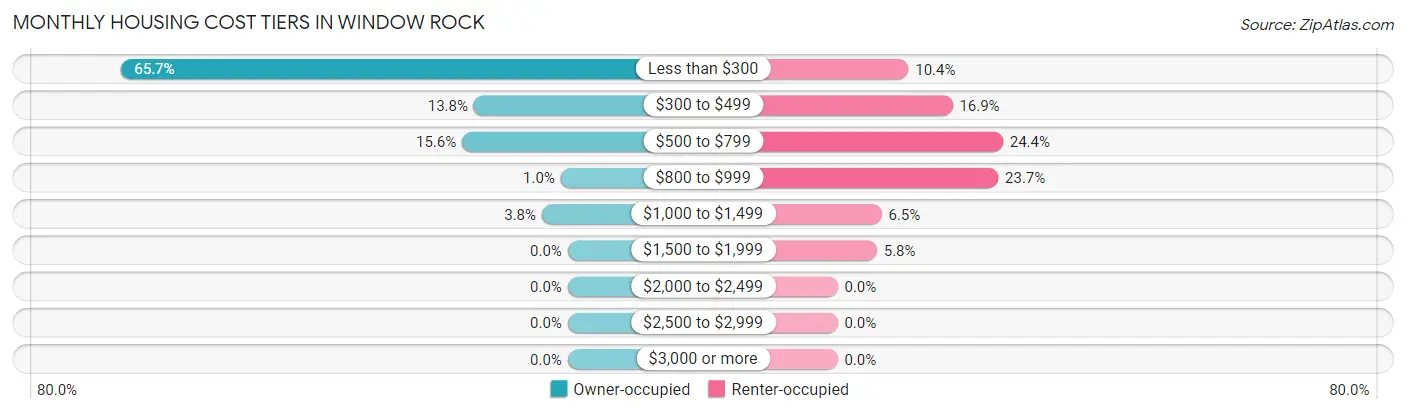
| Monthly Cost | Owner-occupied | Renter-occupied |
| Less than $300 | 190 (65.7%) | 45 (10.4%) |
| $300 to $499 | 40 (13.8%) | 73 (16.9%) |
| $500 to $799 | 45 (15.6%) | 105 (24.4%) |
| $800 to $999 | 3 (1.0%) | 102 (23.7%) |
| $1,000 to $1,499 | 11 (3.8%) | 28 (6.5%) |
| $1,500 to $1,999 | 0 (0.0%) | 25 (5.8%) |
| $2,000 to $2,499 | 0 (0.0%) | 0 (0.0%) |
| $2,500 to $2,999 | 0 (0.0%) | 0 (0.0%) |
| $3,000 or more | 0 (0.0%) | 0 (0.0%) |
| Total | 289 (100.0%) | 431 (100.0%) |
Physical Housing Characteristics in Window Rock
Housing Structures in Window Rock
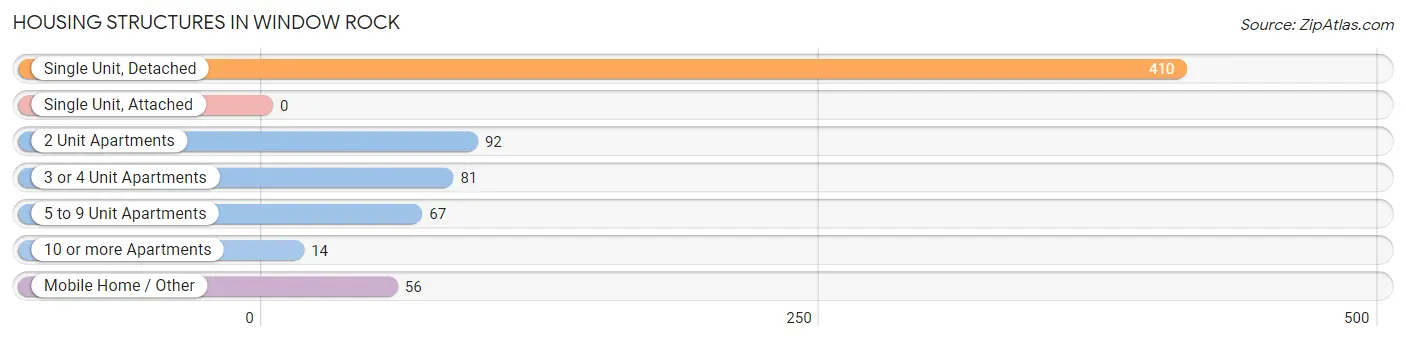
| Structure Type | # Housing Units | % Housing Units |
| Single Unit, Detached | 410 | 56.9% |
| Single Unit, Attached | 0 | 0.0% |
| 2 Unit Apartments | 92 | 12.8% |
| 3 or 4 Unit Apartments | 81 | 11.3% |
| 5 to 9 Unit Apartments | 67 | 9.3% |
| 10 or more Apartments | 14 | 1.9% |
| Mobile Home / Other | 56 | 7.8% |
| Total | 720 | 100.0% |
Housing Structures by Occupancy in Window Rock
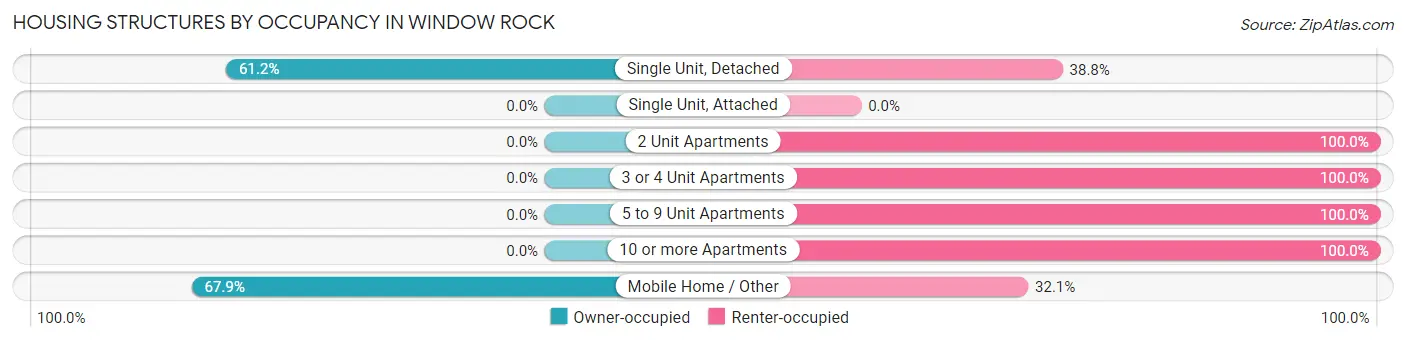
| Structure Type | Owner-occupied | Renter-occupied |
| Single Unit, Detached | 251 (61.2%) | 159 (38.8%) |
| Single Unit, Attached | 0 (0.0%) | 0 (0.0%) |
| 2 Unit Apartments | 0 (0.0%) | 92 (100.0%) |
| 3 or 4 Unit Apartments | 0 (0.0%) | 81 (100.0%) |
| 5 to 9 Unit Apartments | 0 (0.0%) | 67 (100.0%) |
| 10 or more Apartments | 0 (0.0%) | 14 (100.0%) |
| Mobile Home / Other | 38 (67.9%) | 18 (32.1%) |
| Total | 289 (40.1%) | 431 (59.9%) |
Housing Structures by Number of Rooms in Window Rock
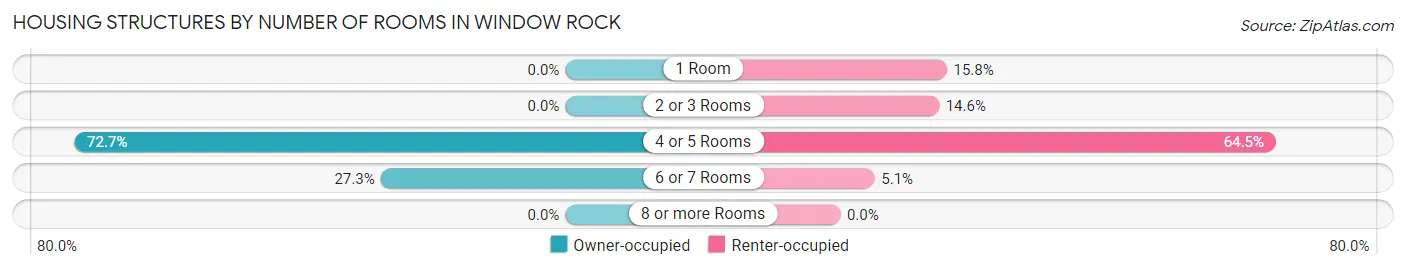
| Number of Rooms | Owner-occupied | Renter-occupied |
| 1 Room | 0 (0.0%) | 68 (15.8%) |
| 2 or 3 Rooms | 0 (0.0%) | 63 (14.6%) |
| 4 or 5 Rooms | 210 (72.7%) | 278 (64.5%) |
| 6 or 7 Rooms | 79 (27.3%) | 22 (5.1%) |
| 8 or more Rooms | 0 (0.0%) | 0 (0.0%) |
| Total | 289 (100.0%) | 431 (100.0%) |
Housing Structure by Heating Type in Window Rock
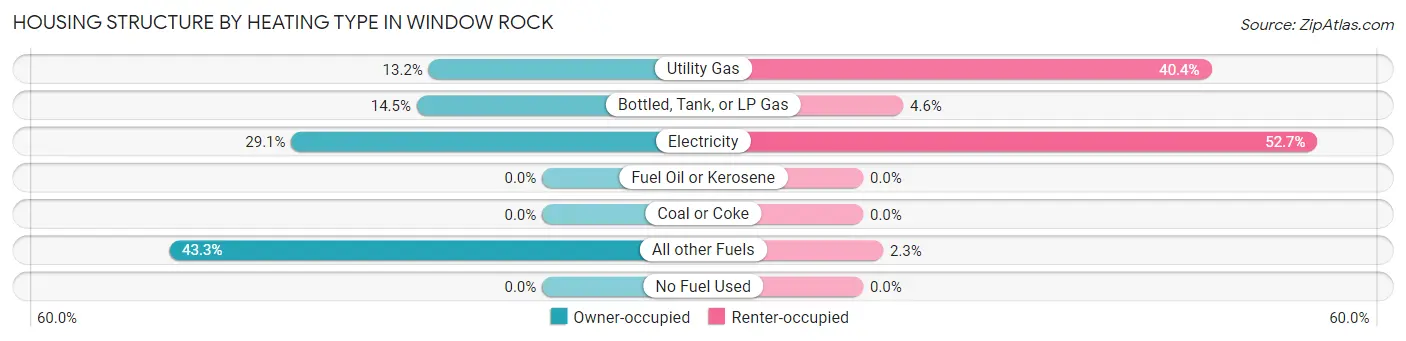
| Heating Type | Owner-occupied | Renter-occupied |
| Utility Gas | 38 (13.2%) | 174 (40.4%) |
| Bottled, Tank, or LP Gas | 42 (14.5%) | 20 (4.6%) |
| Electricity | 84 (29.1%) | 227 (52.7%) |
| Fuel Oil or Kerosene | 0 (0.0%) | 0 (0.0%) |
| Coal or Coke | 0 (0.0%) | 0 (0.0%) |
| All other Fuels | 125 (43.2%) | 10 (2.3%) |
| No Fuel Used | 0 (0.0%) | 0 (0.0%) |
| Total | 289 (100.0%) | 431 (100.0%) |
Household Vehicle Usage in Window Rock
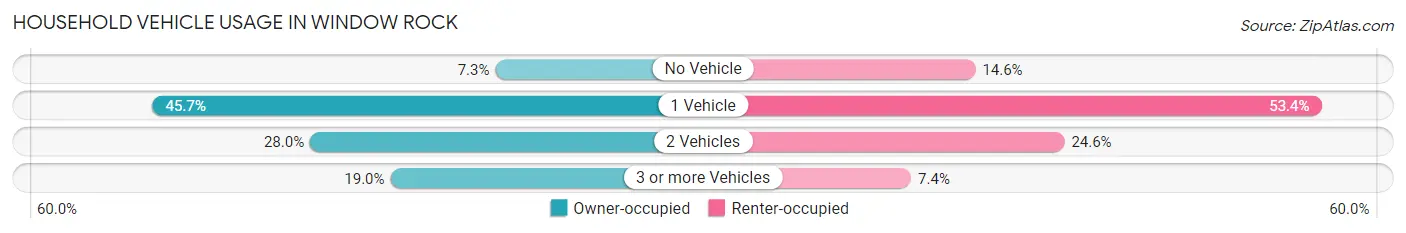
| Vehicles per Household | Owner-occupied | Renter-occupied |
| No Vehicle | 21 (7.3%) | 63 (14.6%) |
| 1 Vehicle | 132 (45.7%) | 230 (53.4%) |
| 2 Vehicles | 81 (28.0%) | 106 (24.6%) |
| 3 or more Vehicles | 55 (19.0%) | 32 (7.4%) |
| Total | 289 (100.0%) | 431 (100.0%) |
Real Estate & Mortgages in Window Rock
Real Estate and Mortgage Overview in Window Rock
| Characteristic | Without Mortgage | With Mortgage |
| Housing Units | 275 | 14 |
| Median Property Value | $79,700 | $0 |
| Median Household Income | $36,058 | $3 |
| Monthly Housing Costs | $244 | $0 |
| Real Estate Taxes | - | - |
Property Value by Mortgage Status in Window Rock
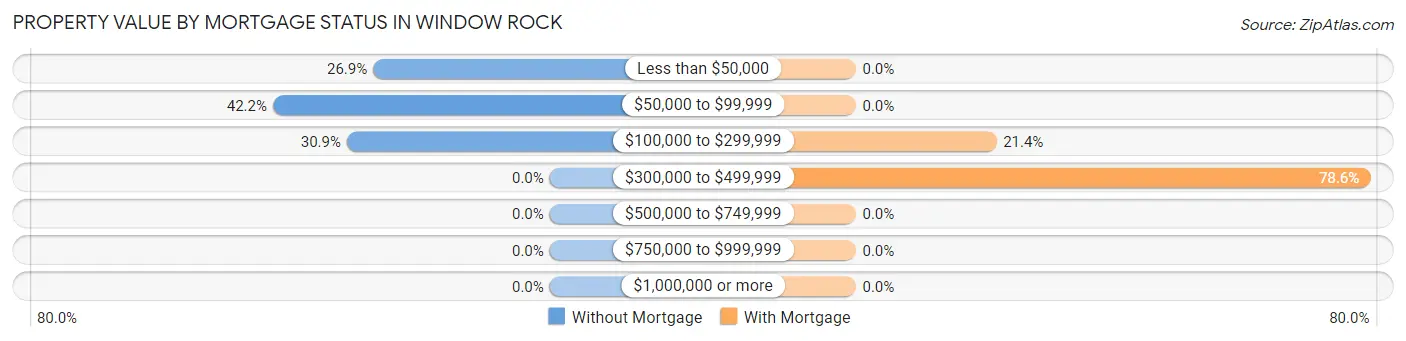
| Property Value | Without Mortgage | With Mortgage |
| Less than $50,000 | 74 (26.9%) | 0 (0.0%) |
| $50,000 to $99,999 | 116 (42.2%) | 0 (0.0%) |
| $100,000 to $299,999 | 85 (30.9%) | 3 (21.4%) |
| $300,000 to $499,999 | 0 (0.0%) | 11 (78.6%) |
| $500,000 to $749,999 | 0 (0.0%) | 0 (0.0%) |
| $750,000 to $999,999 | 0 (0.0%) | 0 (0.0%) |
| $1,000,000 or more | 0 (0.0%) | 0 (0.0%) |
| Total | 275 (100.0%) | 14 (100.0%) |
Household Income by Mortgage Status in Window Rock
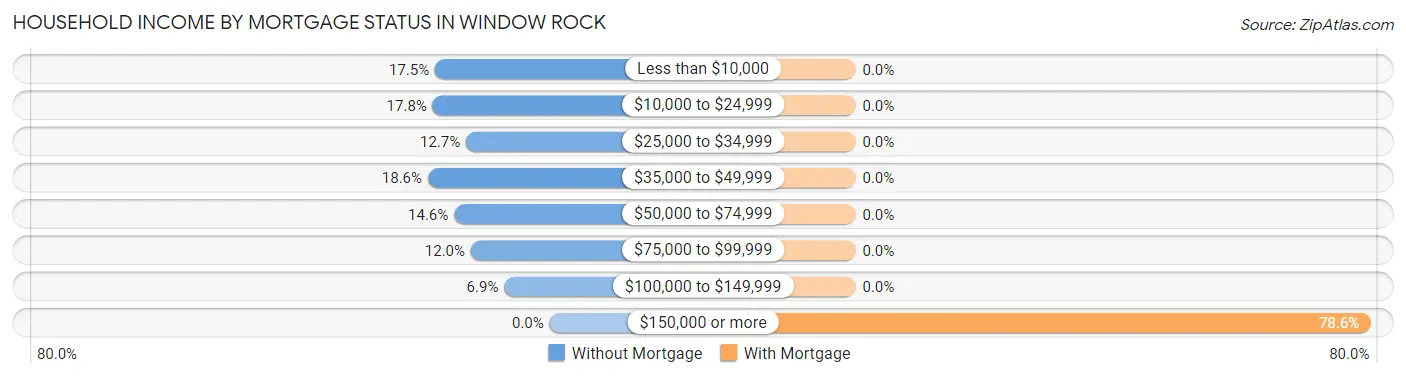
| Household Income | Without Mortgage | With Mortgage |
| Less than $10,000 | 48 (17.4%) | 0 (0.0%) |
| $10,000 to $24,999 | 49 (17.8%) | 0 (0.0%) |
| $25,000 to $34,999 | 35 (12.7%) | 0 (0.0%) |
| $35,000 to $49,999 | 51 (18.5%) | 0 (0.0%) |
| $50,000 to $74,999 | 40 (14.5%) | 0 (0.0%) |
| $75,000 to $99,999 | 33 (12.0%) | 0 (0.0%) |
| $100,000 to $149,999 | 19 (6.9%) | 0 (0.0%) |
| $150,000 or more | 0 (0.0%) | 11 (78.6%) |
| Total | 275 (100.0%) | 14 (100.0%) |
Property Value to Household Income Ratio in Window Rock
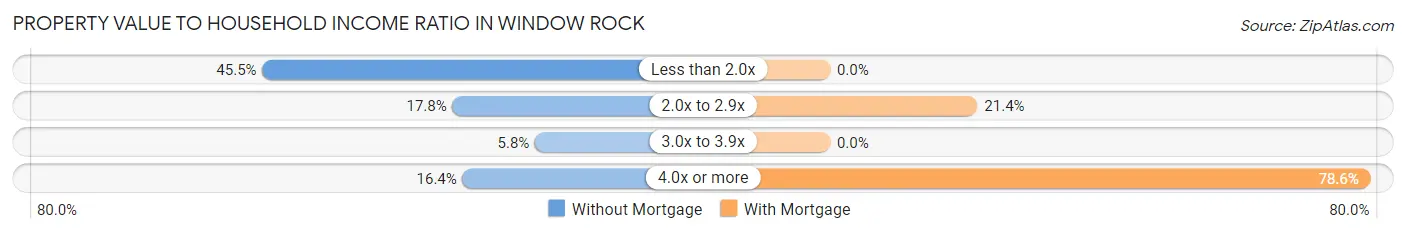
| Value-to-Income Ratio | Without Mortgage | With Mortgage |
| Less than 2.0x | 125 (45.5%) | 0 (0.0%) |
| 2.0x to 2.9x | 49 (17.8%) | 3 (21.4%) |
| 3.0x to 3.9x | 16 (5.8%) | 0 (0.0%) |
| 4.0x or more | 45 (16.4%) | 11 (78.6%) |
| Total | 275 (100.0%) | 14 (100.0%) |
Real Estate Taxes by Mortgage Status in Window Rock
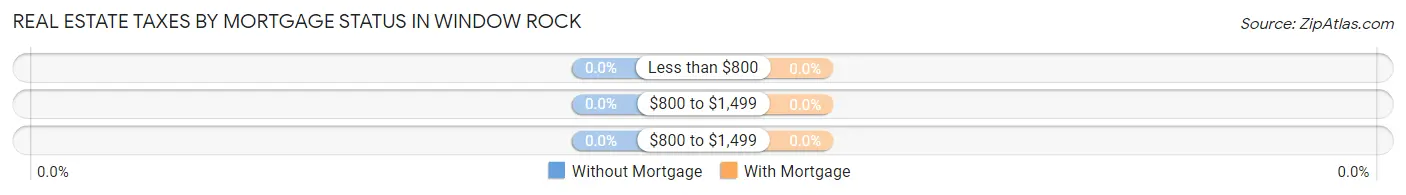
| Property Taxes | Without Mortgage | With Mortgage |
| Less than $800 | 0 (0.0%) | 0 (0.0%) |
| $800 to $1,499 | 0 (0.0%) | 0 (0.0%) |
| $800 to $1,499 | 0 (0.0%) | 0 (0.0%) |
| Total | 275 (100.0%) | 14 (100.0%) |
Health & Disability in Window Rock
Health Insurance Coverage by Age in Window Rock
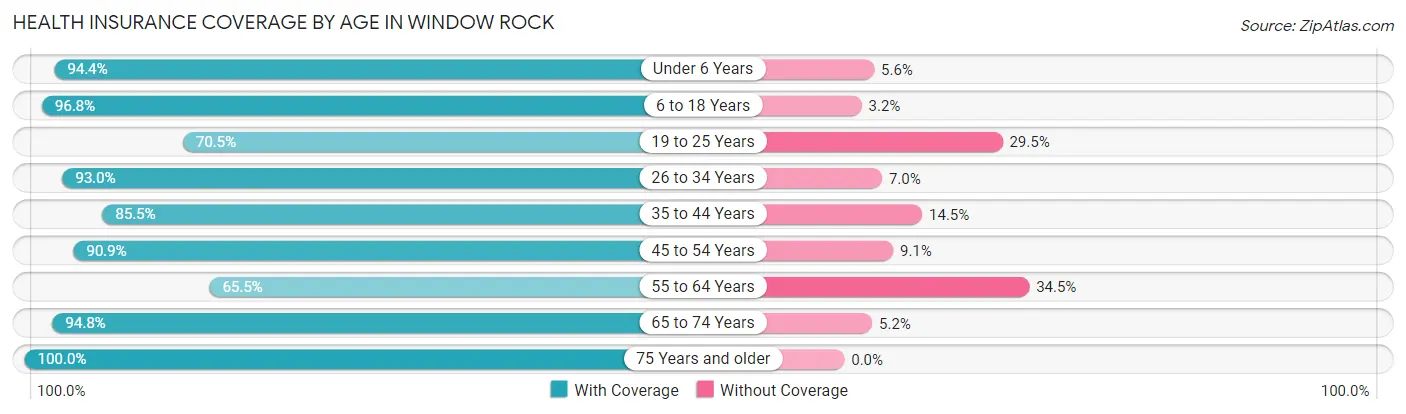
| Age Bracket | With Coverage | Without Coverage |
| Under 6 Years | 221 (94.4%) | 13 (5.6%) |
| 6 to 18 Years | 359 (96.8%) | 12 (3.2%) |
| 19 to 25 Years | 98 (70.5%) | 41 (29.5%) |
| 26 to 34 Years | 291 (93.0%) | 22 (7.0%) |
| 35 to 44 Years | 165 (85.5%) | 28 (14.5%) |
| 45 to 54 Years | 210 (90.9%) | 21 (9.1%) |
| 55 to 64 Years | 190 (65.5%) | 100 (34.5%) |
| 65 to 74 Years | 146 (94.8%) | 8 (5.2%) |
| 75 Years and older | 94 (100.0%) | 0 (0.0%) |
| Total | 1,774 (87.9%) | 245 (12.1%) |
Health Insurance Coverage by Citizenship Status in Window Rock
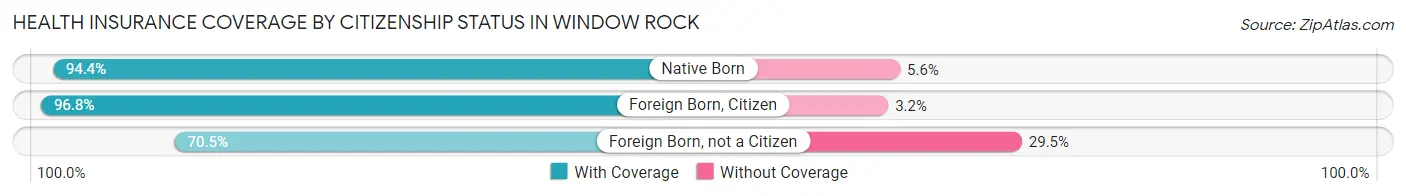
| Citizenship Status | With Coverage | Without Coverage |
| Native Born | 221 (94.4%) | 13 (5.6%) |
| Foreign Born, Citizen | 359 (96.8%) | 12 (3.2%) |
| Foreign Born, not a Citizen | 98 (70.5%) | 41 (29.5%) |
Health Insurance Coverage by Household Income in Window Rock
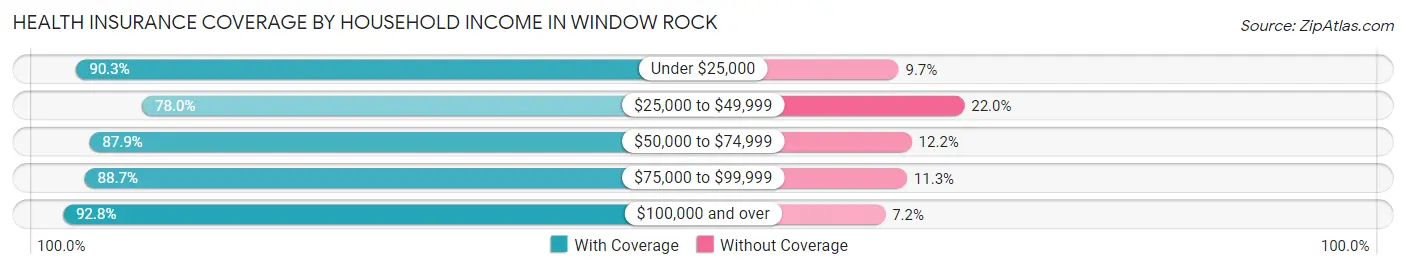
| Household Income | With Coverage | Without Coverage |
| Under $25,000 | 466 (90.3%) | 50 (9.7%) |
| $25,000 to $49,999 | 333 (78.0%) | 94 (22.0%) |
| $50,000 to $74,999 | 217 (87.8%) | 30 (12.1%) |
| $75,000 to $99,999 | 339 (88.7%) | 43 (11.3%) |
| $100,000 and over | 361 (92.8%) | 28 (7.2%) |
Public vs Private Health Insurance Coverage by Age in Window Rock
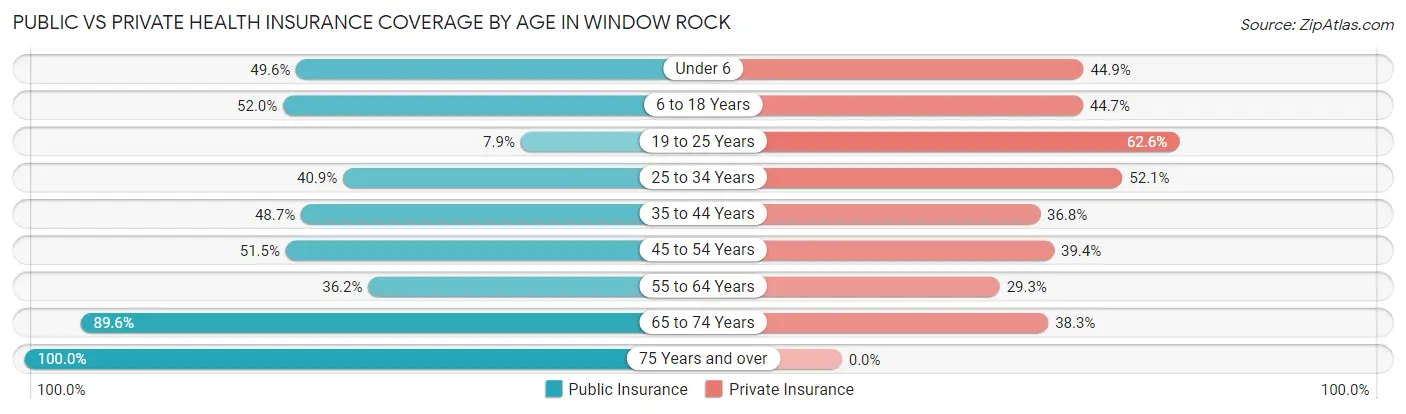
| Age Bracket | Public Insurance | Private Insurance |
| Under 6 | 116 (49.6%) | 105 (44.9%) |
| 6 to 18 Years | 193 (52.0%) | 166 (44.7%) |
| 19 to 25 Years | 11 (7.9%) | 87 (62.6%) |
| 25 to 34 Years | 128 (40.9%) | 163 (52.1%) |
| 35 to 44 Years | 94 (48.7%) | 71 (36.8%) |
| 45 to 54 Years | 119 (51.5%) | 91 (39.4%) |
| 55 to 64 Years | 105 (36.2%) | 85 (29.3%) |
| 65 to 74 Years | 138 (89.6%) | 59 (38.3%) |
| 75 Years and over | 94 (100.0%) | 0 (0.0%) |
| Total | 998 (49.4%) | 827 (41.0%) |
Disability Status by Sex by Age in Window Rock
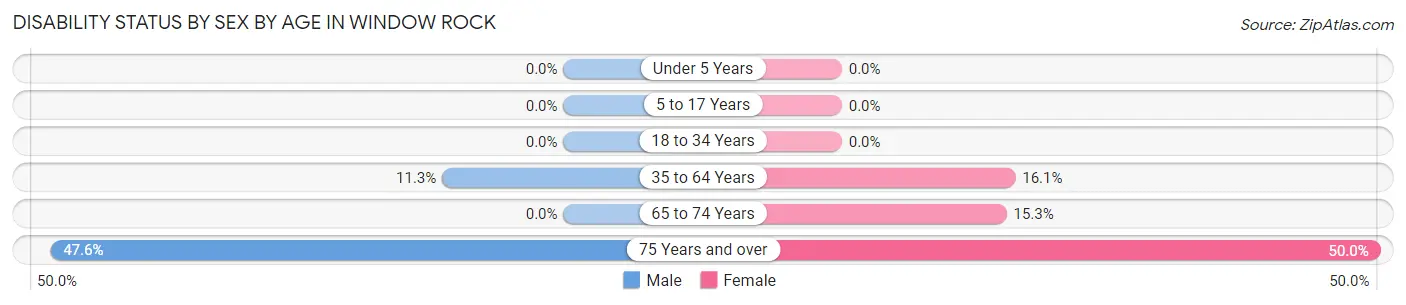
| Age Bracket | Male | Female |
| Under 5 Years | 0 (0.0%) | 0 (0.0%) |
| 5 to 17 Years | 0 (0.0%) | 0 (0.0%) |
| 18 to 34 Years | 0 (0.0%) | 0 (0.0%) |
| 35 to 64 Years | 37 (11.3%) | 62 (16.1%) |
| 65 to 74 Years | 0 (0.0%) | 13 (15.3%) |
| 75 Years and over | 20 (47.6%) | 26 (50.0%) |
Disability Class by Sex by Age in Window Rock
Disability Class: Hearing Difficulty
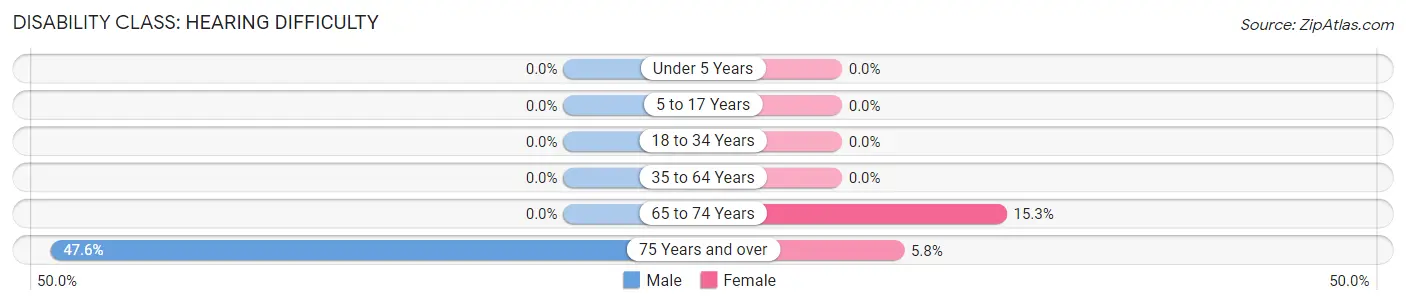
| Age Bracket | Male | Female |
| Under 5 Years | 0 (0.0%) | 0 (0.0%) |
| 5 to 17 Years | 0 (0.0%) | 0 (0.0%) |
| 18 to 34 Years | 0 (0.0%) | 0 (0.0%) |
| 35 to 64 Years | 0 (0.0%) | 0 (0.0%) |
| 65 to 74 Years | 0 (0.0%) | 13 (15.3%) |
| 75 Years and over | 20 (47.6%) | 3 (5.8%) |
Disability Class: Vision Difficulty
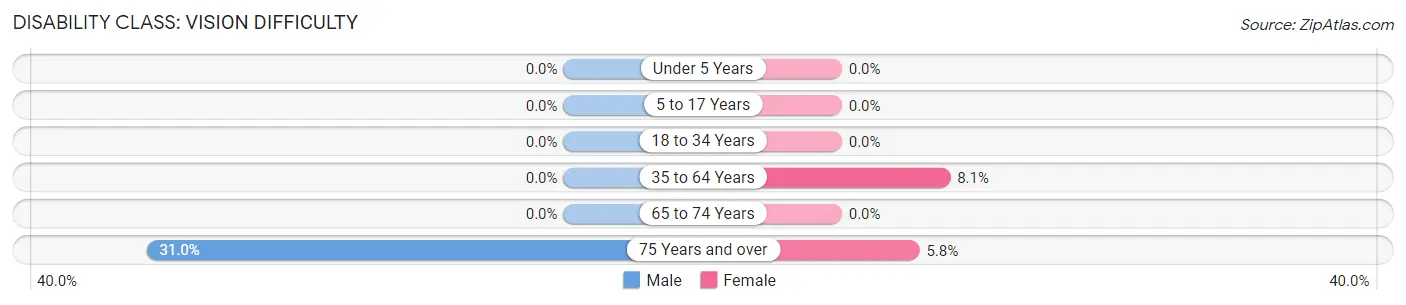
| Age Bracket | Male | Female |
| Under 5 Years | 0 (0.0%) | 0 (0.0%) |
| 5 to 17 Years | 0 (0.0%) | 0 (0.0%) |
| 18 to 34 Years | 0 (0.0%) | 0 (0.0%) |
| 35 to 64 Years | 0 (0.0%) | 31 (8.1%) |
| 65 to 74 Years | 0 (0.0%) | 0 (0.0%) |
| 75 Years and over | 13 (30.9%) | 3 (5.8%) |
Disability Class: Cognitive Difficulty
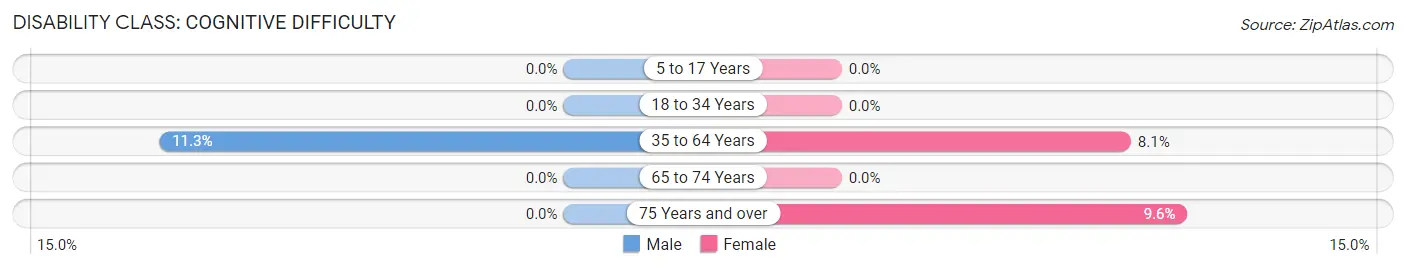
| Age Bracket | Male | Female |
| 5 to 17 Years | 0 (0.0%) | 0 (0.0%) |
| 18 to 34 Years | 0 (0.0%) | 0 (0.0%) |
| 35 to 64 Years | 37 (11.3%) | 31 (8.1%) |
| 65 to 74 Years | 0 (0.0%) | 0 (0.0%) |
| 75 Years and over | 0 (0.0%) | 5 (9.6%) |
Disability Class: Ambulatory Difficulty
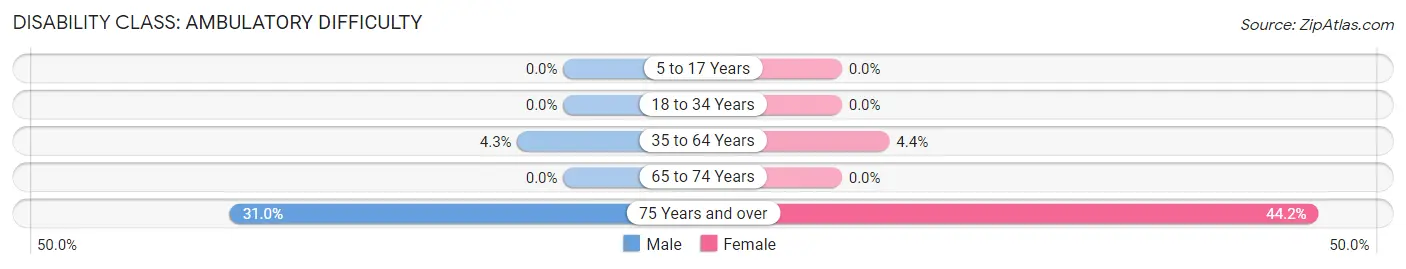
| Age Bracket | Male | Female |
| 5 to 17 Years | 0 (0.0%) | 0 (0.0%) |
| 18 to 34 Years | 0 (0.0%) | 0 (0.0%) |
| 35 to 64 Years | 14 (4.3%) | 17 (4.4%) |
| 65 to 74 Years | 0 (0.0%) | 0 (0.0%) |
| 75 Years and over | 13 (30.9%) | 23 (44.2%) |
Disability Class: Self-Care Difficulty
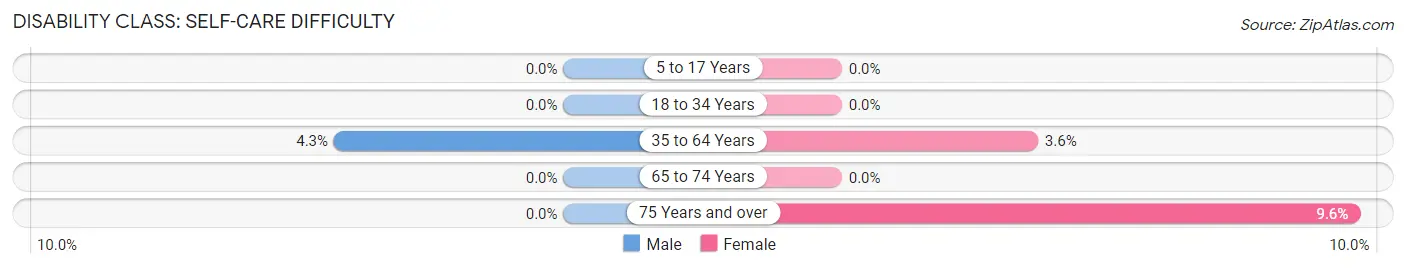
| Age Bracket | Male | Female |
| 5 to 17 Years | 0 (0.0%) | 0 (0.0%) |
| 18 to 34 Years | 0 (0.0%) | 0 (0.0%) |
| 35 to 64 Years | 14 (4.3%) | 14 (3.6%) |
| 65 to 74 Years | 0 (0.0%) | 0 (0.0%) |
| 75 Years and over | 0 (0.0%) | 5 (9.6%) |
Technology Access in Window Rock
Computing Device Access in Window Rock
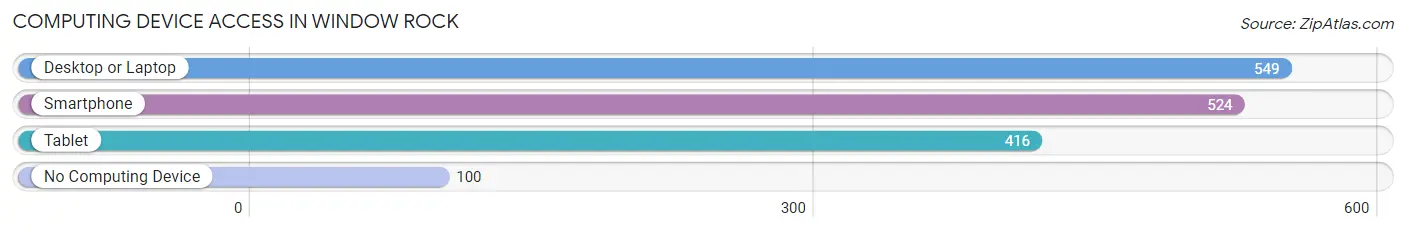
| Device Type | # Households | % Households |
| Desktop or Laptop | 549 | 76.2% |
| Smartphone | 524 | 72.8% |
| Tablet | 416 | 57.8% |
| No Computing Device | 100 | 13.9% |
| Total | 720 | 100.0% |
Internet Access in Window Rock
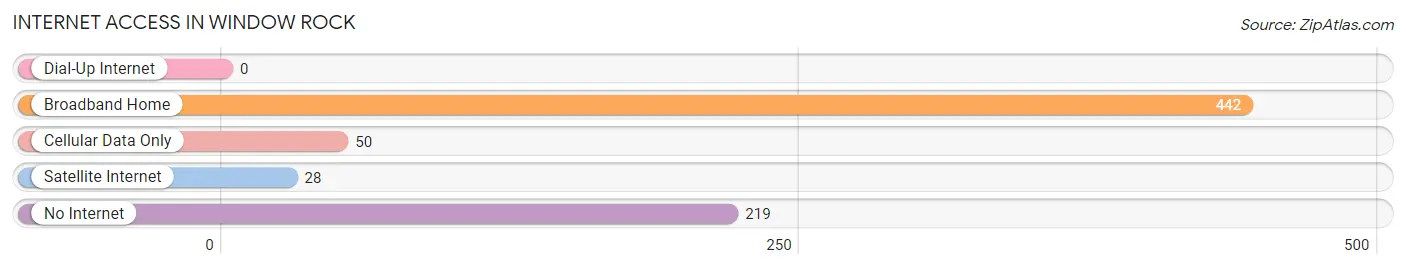
| Internet Type | # Households | % Households |
| Dial-Up Internet | 0 | 0.0% |
| Broadband Home | 442 | 61.4% |
| Cellular Data Only | 50 | 6.9% |
| Satellite Internet | 28 | 3.9% |
| No Internet | 219 | 30.4% |
| Total | 720 | 100.0% |
Window Rock Summary
Rock, Arizona is a small town located in the Navajo Nation in the northeastern corner of the state. It is the capital of the Navajo Nation and the seat of government for the Navajo Nation Council. The town is located in Apache County and is the largest town in the county. The population of Window Rock was 3,541 in the 2010 census.
Geography
Window Rock is located in the northeastern corner of Arizona, near the New Mexico border. It is situated in the Navajo Nation, which is the largest Native American reservation in the United States. The town is located in the Chuska Mountains, which are part of the Colorado Plateau. The town is located at an elevation of 6,400 feet and is surrounded by the Navajo Nation Reservation. The town is located in Apache County and is the largest town in the county.
The town is located in a semi-arid climate, with hot summers and cold winters. The average annual temperature is 57 degrees Fahrenheit, with an average high of 79 degrees in the summer and an average low of 35 degrees in the winter. The average annual precipitation is 11.5 inches, with most of the precipitation occurring in the summer months.
History
Window Rock has a long and rich history. The town was originally inhabited by the Navajo people, who have lived in the area for centuries. The town was named after a large sandstone formation in the area, which is known as the Window Rock. The formation is a natural arch that is believed to have been created by the Navajo people.
The town was officially established in 1936, when the Navajo Nation Council moved its headquarters to the area. The town was incorporated in 1937 and has since grown to become the capital of the Navajo Nation.
Economy
The economy of Window Rock is largely based on tourism and government services. The town is home to the Navajo Nation Council, which is the governing body of the Navajo Nation. The town is also home to the Navajo Nation Museum, which is a popular tourist attraction.
The town is also home to several businesses, including restaurants, hotels, and retail stores. The town is also home to several government offices, including the Navajo Nation Department of Health and Human Services, the Navajo Nation Department of Education, and the Navajo Nation Department of Transportation.
Demographics
As of the 2010 census, the population of Window Rock was 3,541. The population is predominantly Native American, with 97.3% of the population identifying as Native American. The median age of the population is 28.7 years, and the median household income is $30,938.
Conclusion
Window Rock, Arizona is a small town located in the Navajo Nation in the northeastern corner of the state. It is the capital of the Navajo Nation and the seat of government for the Navajo Nation Council. The town is located in Apache County and is the largest town in the county. The population of Window Rock was 3,541 in the 2010 census. The town has a long and rich history, and the economy is largely based on tourism and government services. The population is predominantly Native American, with 97.3% of the population identifying as Native American.
Common Questions
What is Per Capita Income in Window Rock?
Per Capita income in Window Rock is $25,562.
What is the Median Family Income in Window Rock?
Median Family Income in Window Rock is $43,409.
What is the Median Household income in Window Rock?
Median Household Income in Window Rock is $40,242.
What is Income or Wage Gap in Window Rock?
Income or Wage Gap in Window Rock is 5.2%.
Women in Window Rock earn 94.8 cents for every dollar earned by a man.
What is Inequality or Gini Index in Window Rock?
Inequality or Gini Index in Window Rock is 0.47.
What is the Total Population of Window Rock?
Total Population of Window Rock is 2,056.
What is the Total Male Population of Window Rock?
Total Male Population of Window Rock is 878.
What is the Total Female Population of Window Rock?
Total Female Population of Window Rock is 1,178.
What is the Ratio of Males per 100 Females in Window Rock?
There are 74.53 Males per 100 Females in Window Rock.
What is the Ratio of Females per 100 Males in Window Rock?
There are 134.17 Females per 100 Males in Window Rock.
What is the Median Population Age in Window Rock?
Median Population Age in Window Rock is 34.3 Years.
What is the Average Family Size in Window Rock
Average Family Size in Window Rock is 3.6 People.
What is the Average Household Size in Window Rock
Average Household Size in Window Rock is 2.7 People.
How Large is the Labor Force in Window Rock?
There are 812 People in the Labor Forcein in Window Rock.
What is the Percentage of People in the Labor Force in Window Rock?
52.7% of People are in the Labor Force in Window Rock.
What is the Unemployment Rate in Window Rock?
Unemployment Rate in Window Rock is 10.8%.