Zip Codes with the Highest Poverty Level Among Children Under the Age of 5 in Arizona
RELATED REPORTS & OPTIONS
Highest Poverty | Child 0-5
Arizona
Compare Zip Codes
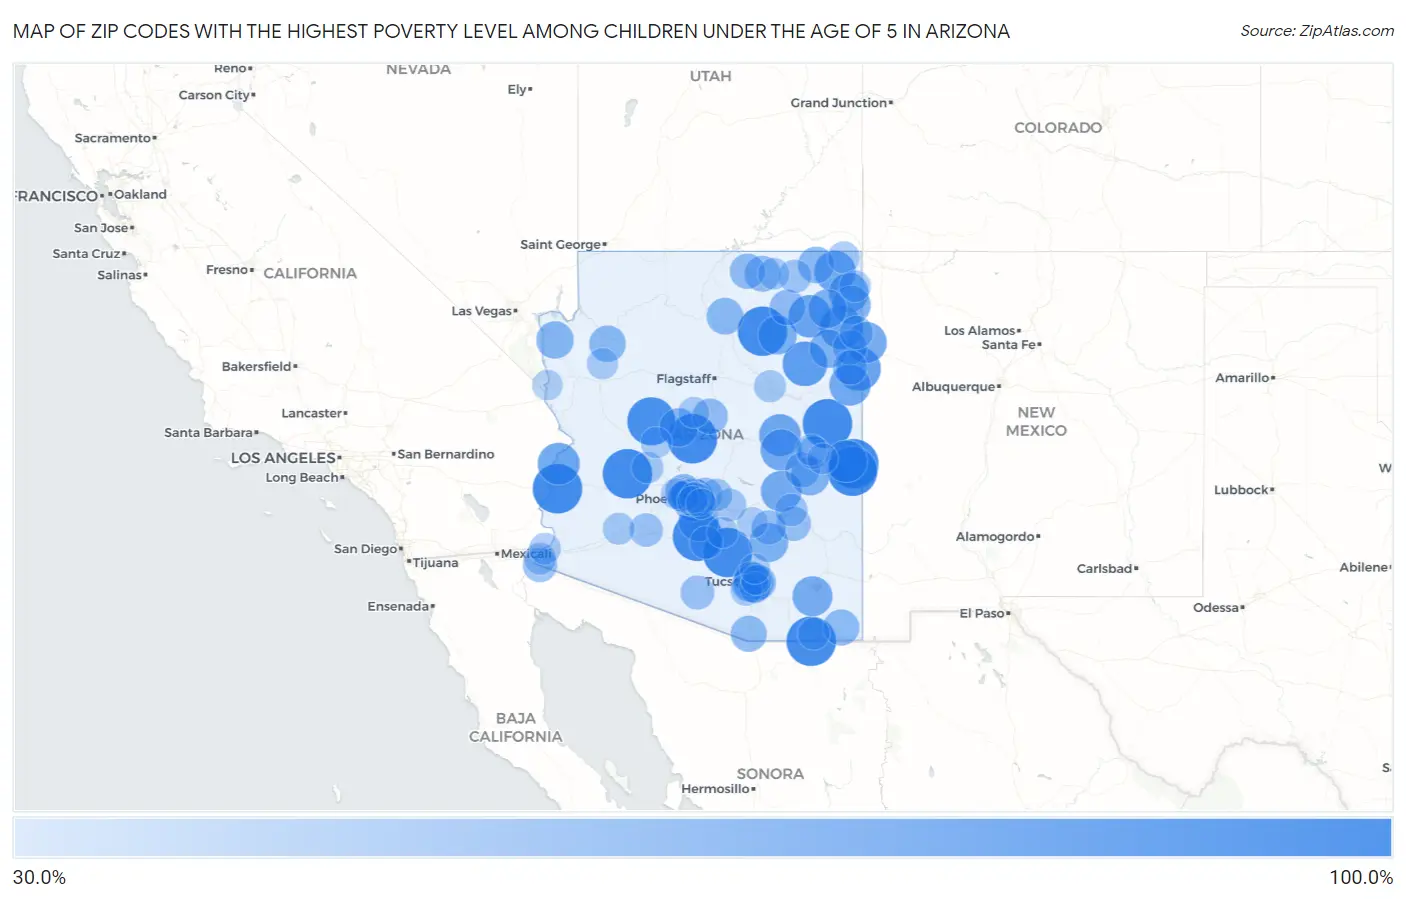
Map of Zip Codes with the Highest Poverty Level Among Children Under the Age of 5 in Arizona
30.0%
100.0%
Zip Codes with the Highest Poverty Level Among Children Under the Age of 5 in Arizona
| Zip Code | Child Poverty | vs State | vs National | |
| 1. | 86333 | 100.0% | 19.3%(+80.7)#1 | 18.1%(+81.9)#3 |
| 2. | 85924 | 100.0% | 19.3%(+80.7)#2 | 18.1%(+81.9)#33 |
| 3. | 85172 | 100.0% | 19.3%(+80.7)#3 | 18.1%(+81.9)#40 |
| 4. | 85620 | 100.0% | 19.3%(+80.7)#4 | 18.1%(+81.9)#77 |
| 5. | 85334 | 100.0% | 19.3%(+80.7)#5 | 18.1%(+81.9)#88 |
| 6. | 85932 | 100.0% | 19.3%(+80.7)#6 | 18.1%(+81.9)#155 |
| 7. | 86030 | 100.0% | 19.3%(+80.7)#7 | 18.1%(+81.9)#157 |
| 8. | 85920 | 100.0% | 19.3%(+80.7)#8 | 18.1%(+81.9)#213 |
| 9. | 85320 | 100.0% | 19.3%(+80.7)#9 | 18.1%(+81.9)#225 |
| 10. | 85141 | 100.0% | 19.3%(+80.7)#10 | 18.1%(+81.9)#328 |
| 11. | 86338 | 94.2% | 19.3%(+74.9)#11 | 18.1%(+76.2)#591 |
| 12. | 86031 | 82.1% | 19.3%(+62.8)#12 | 18.1%(+64.0)#768 |
| 13. | 86508 | 80.0% | 19.3%(+60.7)#13 | 18.1%(+61.9)#814 |
| 14. | 86540 | 75.6% | 19.3%(+56.3)#14 | 18.1%(+57.5)#943 |
| 15. | 85034 | 74.5% | 19.3%(+55.2)#15 | 18.1%(+56.5)#985 |
| 16. | 86520 | 74.4% | 19.3%(+55.1)#16 | 18.1%(+56.4)#991 |
| 17. | 85925 | 72.5% | 19.3%(+53.2)#17 | 18.1%(+54.4)#1,067 |
| 18. | 85371 | 72.2% | 19.3%(+52.9)#18 | 18.1%(+54.2)#1,077 |
| 19. | 85933 | 71.2% | 19.3%(+51.9)#19 | 18.1%(+53.1)#1,110 |
| 20. | 86512 | 69.7% | 19.3%(+50.4)#20 | 18.1%(+51.7)#1,159 |
| 21. | 85911 | 69.7% | 19.3%(+50.4)#21 | 18.1%(+51.6)#1,162 |
| 22. | 86545 | 69.6% | 19.3%(+50.3)#22 | 18.1%(+51.5)#1,170 |
| 23. | 86515 | 68.8% | 19.3%(+49.5)#23 | 18.1%(+50.7)#1,200 |
| 24. | 85550 | 67.6% | 19.3%(+48.3)#24 | 18.1%(+49.5)#1,250 |
| 25. | 85121 | 65.7% | 19.3%(+46.4)#25 | 18.1%(+47.7)#1,354 |
| 26. | 85606 | 65.2% | 19.3%(+45.9)#26 | 18.1%(+47.2)#1,371 |
| 27. | 86507 | 64.1% | 19.3%(+44.8)#27 | 18.1%(+46.0)#1,439 |
| 28. | 85701 | 62.3% | 19.3%(+43.0)#28 | 18.1%(+44.3)#1,544 |
| 29. | 85618 | 61.2% | 19.3%(+41.9)#29 | 18.1%(+43.2)#1,613 |
| 30. | 86556 | 60.8% | 19.3%(+41.5)#30 | 18.1%(+42.8)#1,634 |
| 31. | 86043 | 60.3% | 19.3%(+41.0)#31 | 18.1%(+42.2)#1,657 |
| 32. | 86503 | 60.1% | 19.3%(+40.8)#32 | 18.1%(+42.0)#1,667 |
| 33. | 85926 | 59.5% | 19.3%(+40.2)#33 | 18.1%(+41.5)#1,727 |
| 34. | 86329 | 59.3% | 19.3%(+40.0)#34 | 18.1%(+41.2)#1,746 |
| 35. | 86505 | 59.0% | 19.3%(+39.7)#35 | 18.1%(+40.9)#1,769 |
| 36. | 86445 | 55.6% | 19.3%(+36.3)#36 | 18.1%(+37.5)#2,042 |
| 37. | 85301 | 53.4% | 19.3%(+34.1)#37 | 18.1%(+35.3)#2,206 |
| 38. | 86020 | 53.0% | 19.3%(+33.7)#38 | 18.1%(+35.0)#2,245 |
| 39. | 86535 | 52.5% | 19.3%(+33.2)#39 | 18.1%(+34.4)#2,300 |
| 40. | 86434 | 52.2% | 19.3%(+32.9)#40 | 18.1%(+34.1)#2,325 |
| 41. | 85713 | 51.4% | 19.3%(+32.1)#41 | 18.1%(+33.3)#2,398 |
| 42. | 85607 | 50.8% | 19.3%(+31.4)#42 | 18.1%(+32.7)#2,447 |
| 43. | 85621 | 50.7% | 19.3%(+31.4)#43 | 18.1%(+32.6)#2,459 |
| 44. | 86044 | 49.3% | 19.3%(+30.0)#44 | 18.1%(+31.2)#2,659 |
| 45. | 86510 | 49.2% | 19.3%(+29.9)#45 | 18.1%(+31.1)#2,675 |
| 46. | 86335 | 48.8% | 19.3%(+29.5)#46 | 18.1%(+30.8)#2,711 |
| 47. | 85017 | 48.7% | 19.3%(+29.4)#47 | 18.1%(+30.7)#2,727 |
| 48. | 86053 | 48.2% | 19.3%(+28.9)#48 | 18.1%(+30.1)#2,789 |
| 49. | 85941 | 47.5% | 19.3%(+28.2)#49 | 18.1%(+29.4)#2,869 |
| 50. | 85256 | 45.4% | 19.3%(+26.1)#50 | 18.1%(+27.3)#3,128 |
| 51. | 85711 | 45.2% | 19.3%(+25.9)#51 | 18.1%(+27.2)#3,149 |
| 52. | 86511 | 45.1% | 19.3%(+25.8)#52 | 18.1%(+27.1)#3,163 |
| 53. | 85530 | 44.5% | 19.3%(+25.2)#53 | 18.1%(+26.4)#3,247 |
| 54. | 85192 | 44.4% | 19.3%(+25.1)#54 | 18.1%(+26.4)#3,258 |
| 55. | 86506 | 44.4% | 19.3%(+25.1)#55 | 18.1%(+26.4)#3,260 |
| 56. | 85705 | 44.4% | 19.3%(+25.1)#56 | 18.1%(+26.3)#3,285 |
| 57. | 85349 | 44.1% | 19.3%(+24.8)#57 | 18.1%(+26.0)#3,331 |
| 58. | 85634 | 43.1% | 19.3%(+23.8)#58 | 18.1%(+25.0)#3,462 |
| 59. | 86504 | 41.5% | 19.3%(+22.2)#59 | 18.1%(+23.4)#3,752 |
| 60. | 85337 | 41.1% | 19.3%(+21.8)#60 | 18.1%(+23.1)#3,810 |
| 61. | 86033 | 40.4% | 19.3%(+21.1)#61 | 18.1%(+22.4)#3,939 |
| 62. | 85935 | 38.8% | 19.3%(+19.4)#62 | 18.1%(+20.7)#4,255 |
| 63. | 85003 | 38.7% | 19.3%(+19.4)#63 | 18.1%(+20.7)#4,260 |
| 64. | 85193 | 38.6% | 19.3%(+19.3)#64 | 18.1%(+20.5)#4,293 |
| 65. | 85118 | 38.3% | 19.3%(+19.0)#65 | 18.1%(+20.2)#4,348 |
| 66. | 85009 | 38.2% | 19.3%(+18.9)#66 | 18.1%(+20.2)#4,362 |
| 67. | 85215 | 38.2% | 19.3%(+18.9)#67 | 18.1%(+20.2)#4,363 |
| 68. | 85542 | 38.0% | 19.3%(+18.7)#68 | 18.1%(+19.9)#4,407 |
| 69. | 85015 | 37.7% | 19.3%(+18.4)#69 | 18.1%(+19.7)#4,455 |
| 70. | 85031 | 37.3% | 19.3%(+18.0)#70 | 18.1%(+19.2)#4,537 |
| 71. | 85281 | 37.2% | 19.3%(+17.9)#71 | 18.1%(+19.1)#4,562 |
| 72. | 86047 | 36.1% | 19.3%(+16.8)#72 | 18.1%(+18.0)#4,805 |
| 73. | 86514 | 35.9% | 19.3%(+16.6)#73 | 18.1%(+17.9)#4,843 |
| 74. | 85603 | 35.8% | 19.3%(+16.5)#74 | 18.1%(+17.7)#4,874 |
| 75. | 85350 | 35.4% | 19.3%(+16.1)#75 | 18.1%(+17.4)#4,971 |
| 76. | 85333 | 35.4% | 19.3%(+16.1)#76 | 18.1%(+17.4)#4,976 |
| 77. | 85390 | 35.2% | 19.3%(+15.9)#77 | 18.1%(+17.1)#5,028 |
| 78. | 85364 | 34.9% | 19.3%(+15.6)#78 | 18.1%(+16.8)#5,102 |
| 79. | 85746 | 34.7% | 19.3%(+15.4)#79 | 18.1%(+16.7)#5,129 |
| 80. | 86544 | 34.7% | 19.3%(+15.4)#80 | 18.1%(+16.6)#5,147 |
| 81. | 86054 | 34.0% | 19.3%(+14.7)#81 | 18.1%(+16.0)#5,291 |
| 82. | 85929 | 33.6% | 19.3%(+14.3)#82 | 18.1%(+15.5)#5,394 |
| 83. | 85706 | 33.4% | 19.3%(+14.1)#83 | 18.1%(+15.3)#5,425 |
| 84. | 86437 | 33.3% | 19.3%(+14.0)#84 | 18.1%(+15.3)#5,530 |
| 85. | 85128 | 33.1% | 19.3%(+13.8)#85 | 18.1%(+15.1)#5,559 |
| 86. | 85035 | 33.0% | 19.3%(+13.7)#86 | 18.1%(+15.0)#5,580 |
| 87. | 86332 | 32.9% | 19.3%(+13.6)#87 | 18.1%(+14.8)#5,618 |
| 88. | 85006 | 32.5% | 19.3%(+13.2)#88 | 18.1%(+14.5)#5,716 |
| 89. | 85019 | 32.4% | 19.3%(+13.1)#89 | 18.1%(+14.3)#5,745 |
| 90. | 86326 | 32.2% | 19.3%(+12.9)#90 | 18.1%(+14.2)#5,783 |
| 91. | 85930 | 31.8% | 19.3%(+12.5)#91 | 18.1%(+13.8)#5,880 |
| 92. | 85033 | 31.5% | 19.3%(+12.2)#92 | 18.1%(+13.4)#5,961 |
| 93. | 85137 | 31.2% | 19.3%(+11.9)#93 | 18.1%(+13.1)#6,035 |
| 94. | 85307 | 31.1% | 19.3%(+11.8)#94 | 18.1%(+13.0)#6,056 |
| 95. | 85008 | 31.1% | 19.3%(+11.8)#95 | 18.1%(+13.0)#6,060 |
| 96. | 85040 | 30.6% | 19.3%(+11.3)#96 | 18.1%(+12.5)#6,199 |
| 97. | 86442 | 30.5% | 19.3%(+11.2)#97 | 18.1%(+12.5)#6,210 |
| 98. | 85202 | 30.2% | 19.3%(+10.9)#98 | 18.1%(+12.2)#6,285 |
| 99. | 85716 | 30.1% | 19.3%(+10.8)#99 | 18.1%(+12.0)#6,322 |
| 100. | 85737 | 30.1% | 19.3%(+10.8)#100 | 18.1%(+12.0)#6,323 |
Common Questions
What are the Top 10 Zip Codes with the Highest Poverty Level Among Children Under the Age of 5 in Arizona?
Top 10 Zip Codes with the Highest Poverty Level Among Children Under the Age of 5 in Arizona are:
What zip code has the Highest Poverty Level Among Children Under the Age of 5 in Arizona?
86333 has the Highest Poverty Level Among Children Under the Age of 5 in Arizona with 100.0%.
What is the Poverty Level Among Children Under the Age of 5 in the State of Arizona?
Poverty Level Among Children Under the Age of 5 in Arizona is 19.3%.
What is the Poverty Level Among Children Under the Age of 5 in the United States?
Poverty Level Among Children Under the Age of 5 in the United States is 18.1%.