Tonalea, AZ Map & Demographics
Tonalea Map
Tonalea Overview
$8,741
PER CAPITA INCOME
$31,528
AVG FAMILY INCOME
$30,972
AVG HOUSEHOLD INCOME
0.35
INEQUALITY / GINI INDEX
167
TOTAL POPULATION
90
MALE POPULATION
77
FEMALE POPULATION
116.88
MALES / 100 FEMALES
85.56
FEMALES / 100 MALES
27.1
MEDIAN AGE
2.7
AVG FAMILY SIZE
2.5
AVG HOUSEHOLD SIZE
32
LABOR FORCE [ PEOPLE ]
26.9%
PERCENT IN LABOR FORCE
12.5%
UNEMPLOYMENT RATE
Tonalea Zip Codes
Tonalea Area Codes
Income in Tonalea
Income Overview in Tonalea
Per Capita Income in Tonalea is $8,741, while median incomes of families and households are $31,528 and $30,972 respectively.
| Characteristic | Number | Measure |
| Per Capita Income | 167 | $8,741 |
| Median Family Income | 56 | $31,528 |
| Mean Family Income | 56 | $31,045 |
| Median Household Income | 66 | $30,972 |
| Mean Household Income | 66 | $28,783 |
| Income Deficit | 56 | $0 |
| Wage / Income Gap (%) | 167 | 0.00% |
| Wage / Income Gap ($) | 167 | 100.00¢ per $1 |
| Gini / Inequality Index | 167 | 0.35 |
Earnings by Sex in Tonalea
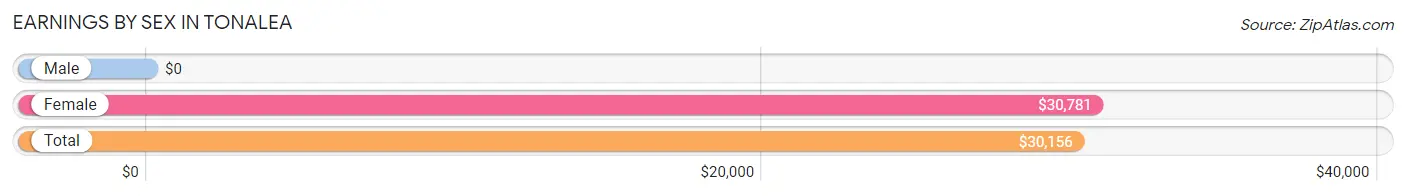
| Sex | Number | Average Earnings |
| Male | 8 (20.0%) | $0 |
| Female | 32 (80.0%) | $30,781 |
| Total | 40 (100.0%) | $30,156 |
Earnings by Sex by Income Bracket in Tonalea
The most common earnings brackets in Tonalea are $2,500 to $4,999 for men (4 | 50.0%) and $30,000 to $34,999 for women (16 | 50.0%).
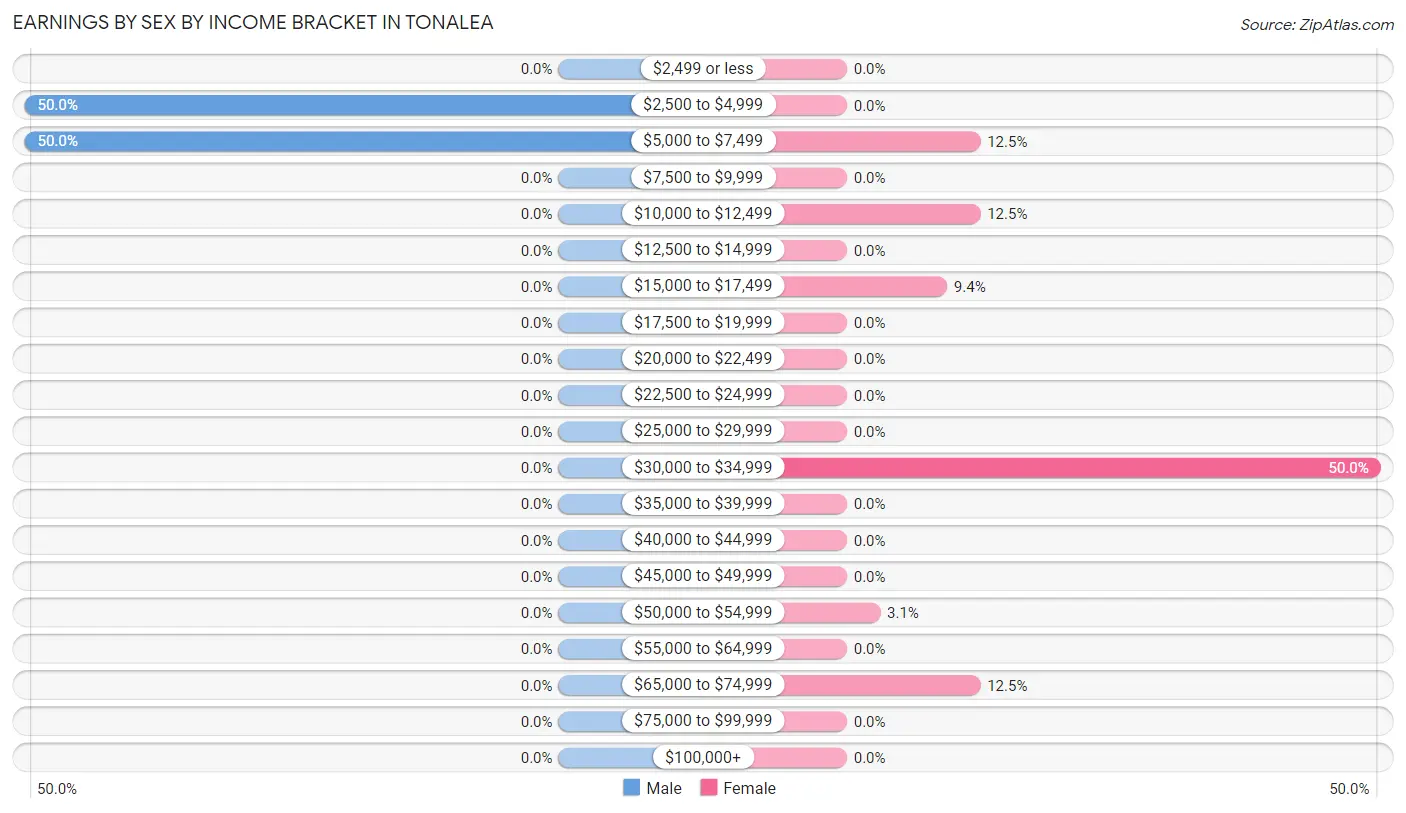
| Income | Male | Female |
| $2,499 or less | 0 (0.0%) | 0 (0.0%) |
| $2,500 to $4,999 | 4 (50.0%) | 0 (0.0%) |
| $5,000 to $7,499 | 4 (50.0%) | 4 (12.5%) |
| $7,500 to $9,999 | 0 (0.0%) | 0 (0.0%) |
| $10,000 to $12,499 | 0 (0.0%) | 4 (12.5%) |
| $12,500 to $14,999 | 0 (0.0%) | 0 (0.0%) |
| $15,000 to $17,499 | 0 (0.0%) | 3 (9.4%) |
| $17,500 to $19,999 | 0 (0.0%) | 0 (0.0%) |
| $20,000 to $22,499 | 0 (0.0%) | 0 (0.0%) |
| $22,500 to $24,999 | 0 (0.0%) | 0 (0.0%) |
| $25,000 to $29,999 | 0 (0.0%) | 0 (0.0%) |
| $30,000 to $34,999 | 0 (0.0%) | 16 (50.0%) |
| $35,000 to $39,999 | 0 (0.0%) | 0 (0.0%) |
| $40,000 to $44,999 | 0 (0.0%) | 0 (0.0%) |
| $45,000 to $49,999 | 0 (0.0%) | 0 (0.0%) |
| $50,000 to $54,999 | 0 (0.0%) | 1 (3.1%) |
| $55,000 to $64,999 | 0 (0.0%) | 0 (0.0%) |
| $65,000 to $74,999 | 0 (0.0%) | 4 (12.5%) |
| $75,000 to $99,999 | 0 (0.0%) | 0 (0.0%) |
| $100,000+ | 0 (0.0%) | 0 (0.0%) |
| Total | 8 (100.0%) | 32 (100.0%) |
Earnings by Sex by Educational Attainment in Tonalea
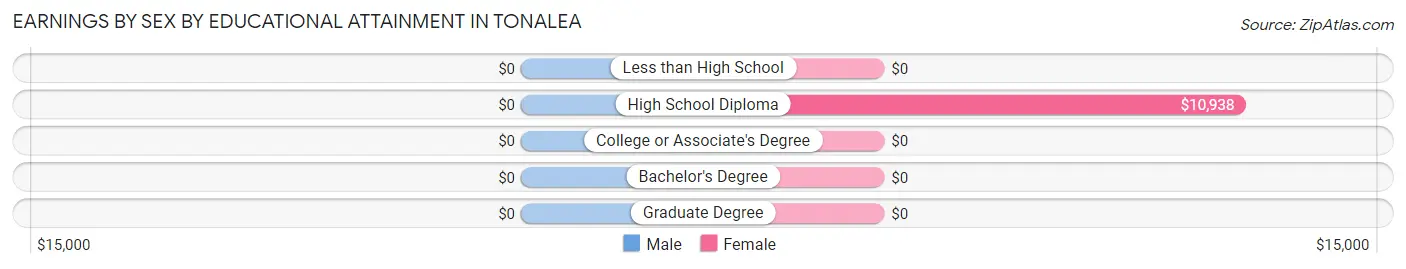
| Educational Attainment | Male Income | Female Income |
| Less than High School | - | - |
| High School Diploma | - | - |
| College or Associate's Degree | - | - |
| Bachelor's Degree | - | - |
| Graduate Degree | - | - |
| Total | - | - |
Family Income in Tonalea
Family Income Brackets in Tonalea
According to the Tonalea family income data, there are 22 families falling into the $25,000 to $34,999 income range, which is the most common income bracket and makes up 39.3% of all families.
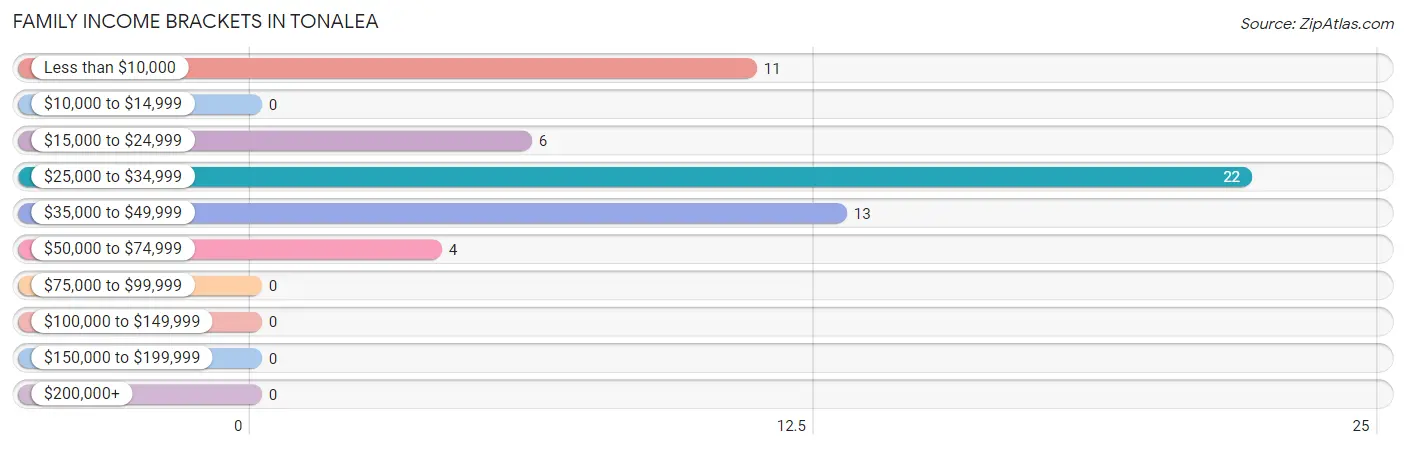
| Income Bracket | # Families | % Families |
| Less than $10,000 | 11 | 19.6% |
| $10,000 to $14,999 | 0 | 0.0% |
| $15,000 to $24,999 | 6 | 10.7% |
| $25,000 to $34,999 | 22 | 39.3% |
| $35,000 to $49,999 | 13 | 23.2% |
| $50,000 to $74,999 | 4 | 7.1% |
| $75,000 to $99,999 | 0 | 0.0% |
| $100,000 to $149,999 | 0 | 0.0% |
| $150,000 to $199,999 | 0 | 0.0% |
| $200,000+ | 0 | 0.0% |
Family Income by Famaliy Size in Tonalea
2-person families (34 | 60.7%) account for the highest median family income in Tonalea with $30,694 per family, while 2-person families (34 | 60.7%) have the highest median income of $15,347 per family member.
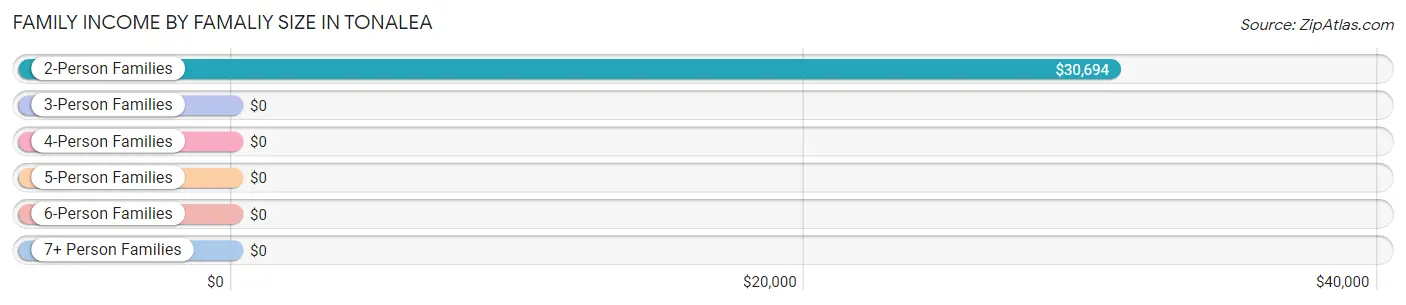
| Income Bracket | # Families | Median Income |
| 2-Person Families | 34 (60.7%) | $30,694 |
| 3-Person Families | 4 (7.1%) | $0 |
| 4-Person Families | 9 (16.1%) | $0 |
| 5-Person Families | 9 (16.1%) | $0 |
| 6-Person Families | 0 (0.0%) | $0 |
| 7+ Person Families | 0 (0.0%) | $0 |
| Total | 56 (100.0%) | $31,528 |
Family Income by Number of Earners in Tonalea
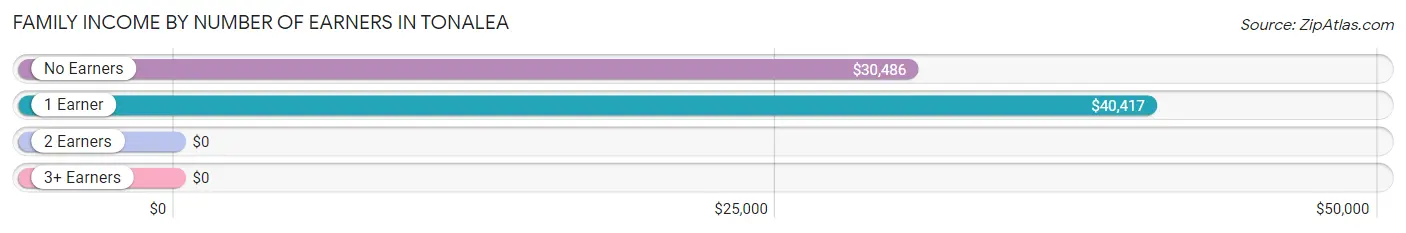
| Number of Earners | # Families | Median Income |
| No Earners | 29 (51.8%) | $30,486 |
| 1 Earner | 23 (41.1%) | $40,417 |
| 2 Earners | 4 (7.1%) | $0 |
| 3+ Earners | 0 (0.0%) | $0 |
| Total | 56 (100.0%) | $31,528 |
Household Income in Tonalea
Household Income Brackets in Tonalea
With 22 households falling in the category, the $25,000 to $34,999 income range is the most frequent in Tonalea, accounting for 33.3% of all households.
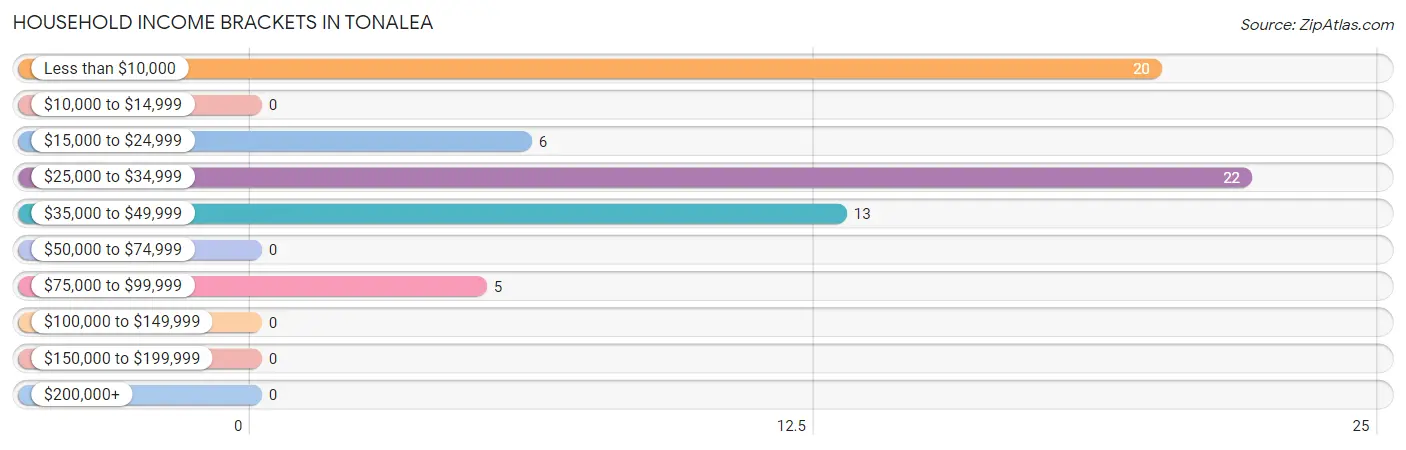
| Income Bracket | # Households | % Households |
| Less than $10,000 | 20 | 30.3% |
| $10,000 to $14,999 | 0 | 0.0% |
| $15,000 to $24,999 | 6 | 9.1% |
| $25,000 to $34,999 | 22 | 33.3% |
| $35,000 to $49,999 | 13 | 19.7% |
| $50,000 to $74,999 | 0 | 0.0% |
| $75,000 to $99,999 | 5 | 7.6% |
| $100,000 to $149,999 | 0 | 0.0% |
| $150,000 to $199,999 | 0 | 0.0% |
| $200,000+ | 0 | 0.0% |
Household Income by Householder Age in Tonalea
The median household income in Tonalea is $30,972, with the highest median household income of $31,042 found in the 45 to 64 years age bracket for the primary householder. A total of 37 households (56.1%) fall into this category.
| Income Bracket | # Households | Median Income |
| 15 to 24 Years | 0 (0.0%) | $0 |
| 25 to 44 Years | 13 (19.7%) | $0 |
| 45 to 64 Years | 37 (56.1%) | $31,042 |
| 65+ Years | 16 (24.2%) | $16,250 |
| Total | 66 (100.0%) | $30,972 |
Poverty in Tonalea
Income Below Poverty by Sex and Age in Tonalea
With 41.1% poverty level for males and 35.1% for females among the residents of Tonalea, 18 to 24 year old males and 75 year old and over females are the most vulnerable to poverty, with 7 males (100.0%) and 11 females (100.0%) in their respective age groups living below the poverty level.
| Age Bracket | Male | Female |
| Under 5 Years | 9 (56.2%) | 0 (0.0%) |
| 5 Years | 0 (0.0%) | 0 (0.0%) |
| 6 to 11 Years | 0 (0.0%) | 0 (0.0%) |
| 12 to 14 Years | 0 (0.0%) | 0 (0.0%) |
| 15 Years | 0 (0.0%) | 0 (0.0%) |
| 16 and 17 Years | 0 (0.0%) | 0 (0.0%) |
| 18 to 24 Years | 7 (100.0%) | 8 (36.4%) |
| 25 to 34 Years | 4 (100.0%) | 0 (0.0%) |
| 35 to 44 Years | 0 (0.0%) | 0 (0.0%) |
| 45 to 54 Years | 9 (100.0%) | 4 (26.7%) |
| 55 to 64 Years | 6 (25.0%) | 0 (0.0%) |
| 65 to 74 Years | 0 (0.0%) | 4 (80.0%) |
| 75 Years and over | 2 (33.3%) | 11 (100.0%) |
| Total | 37 (41.1%) | 27 (35.1%) |
Income Above Poverty by Sex and Age in Tonalea
According to the poverty statistics in Tonalea, males aged 6 to 11 years and females aged 6 to 11 years are the age groups that are most secure financially, with 100.0% of males and 100.0% of females in these age groups living above the poverty line.
| Age Bracket | Male | Female |
| Under 5 Years | 7 (43.8%) | 0 (0.0%) |
| 5 Years | 0 (0.0%) | 0 (0.0%) |
| 6 to 11 Years | 6 (100.0%) | 7 (100.0%) |
| 12 to 14 Years | 11 (100.0%) | 8 (100.0%) |
| 15 Years | 0 (0.0%) | 0 (0.0%) |
| 16 and 17 Years | 6 (100.0%) | 0 (0.0%) |
| 18 to 24 Years | 0 (0.0%) | 14 (63.6%) |
| 25 to 34 Years | 0 (0.0%) | 0 (0.0%) |
| 35 to 44 Years | 0 (0.0%) | 9 (100.0%) |
| 45 to 54 Years | 0 (0.0%) | 11 (73.3%) |
| 55 to 64 Years | 18 (75.0%) | 0 (0.0%) |
| 65 to 74 Years | 1 (100.0%) | 1 (20.0%) |
| 75 Years and over | 4 (66.7%) | 0 (0.0%) |
| Total | 53 (58.9%) | 50 (64.9%) |
Income Below Poverty Among Married-Couple Families in Tonalea
The poverty statistics for married-couple families in Tonalea show that 100.0% or 8 of the total 8 families live below the poverty line. Families with no children have the highest poverty rate of 100.0%, comprising of 8 families. On the other hand, families with no children have the lowest poverty rate of 100.0%, which includes 8 families.
| Children | Above Poverty | Below Poverty |
| No Children | 0 (0.0%) | 8 (100.0%) |
| 1 or 2 Children | 0 (0.0%) | 0 (0.0%) |
| 3 or 4 Children | 0 (0.0%) | 0 (0.0%) |
| 5 or more Children | 0 (0.0%) | 0 (0.0%) |
| Total | 0 (0.0%) | 8 (100.0%) |
Income Below Poverty Among Single-Parent Households in Tonalea
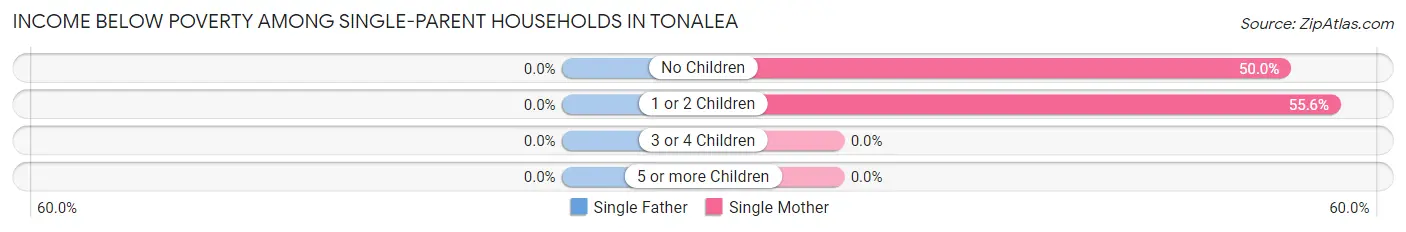
| Children | Single Father | Single Mother |
| No Children | 0 (0.0%) | 4 (50.0%) |
| 1 or 2 Children | 0 (0.0%) | 5 (55.6%) |
| 3 or 4 Children | 0 (0.0%) | 0 (0.0%) |
| 5 or more Children | 0 (0.0%) | 0 (0.0%) |
| Total | 0 (0.0%) | 9 (34.6%) |
Income Below Poverty Among Married-Couple vs Single-Parent Households in Tonalea
The poverty data for Tonalea shows that 8 of the married-couple family households (100.0%) and 9 of the single-parent households (18.8%) are living below the poverty level. Within the married-couple family households, those with no children have the highest poverty rate, with 8 households (100.0%) falling below the poverty line. Among the single-parent households, those with 1 or 2 children have the highest poverty rate, with 5 household (38.5%) living below poverty.
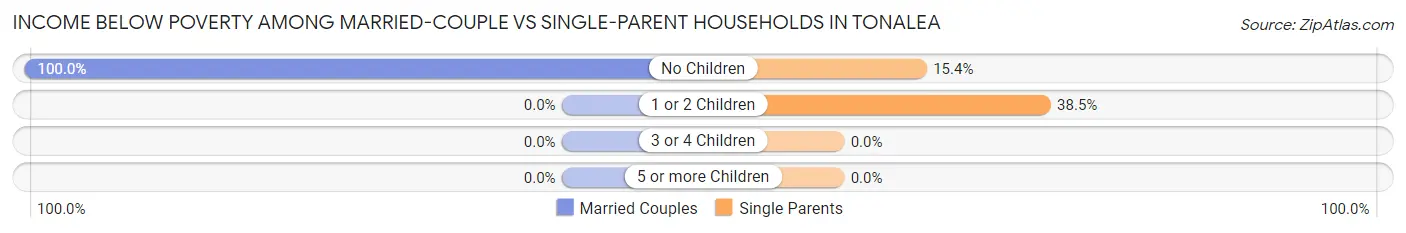
| Children | Married-Couple Families | Single-Parent Households |
| No Children | 8 (100.0%) | 4 (15.4%) |
| 1 or 2 Children | 0 (0.0%) | 5 (38.5%) |
| 3 or 4 Children | 0 (0.0%) | 0 (0.0%) |
| 5 or more Children | 0 (0.0%) | 0 (0.0%) |
| Total | 8 (100.0%) | 9 (18.8%) |
Race in Tonalea
The most populous races in Tonalea are , and Native / Alaskan (167 | 100.0%).
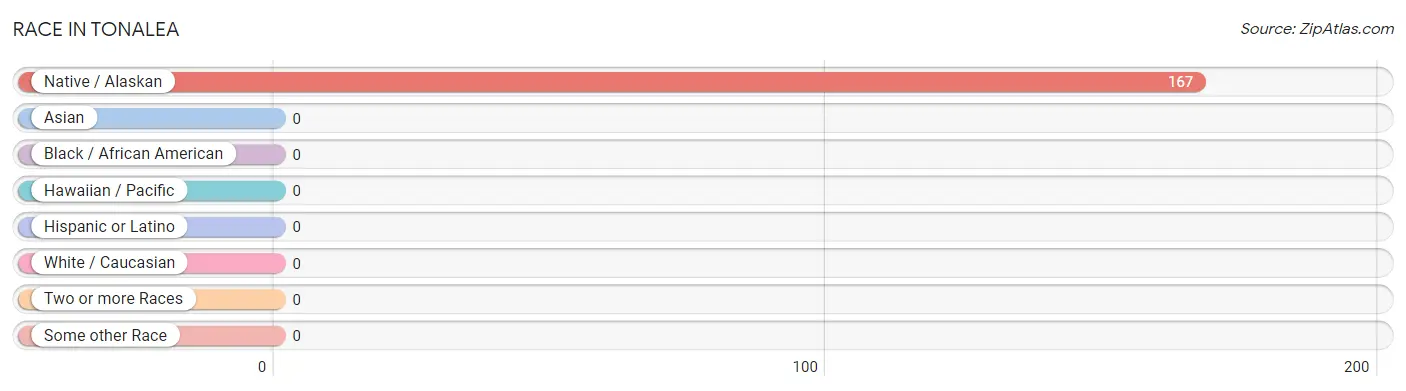
| Race | # Population | % Population |
| Asian | 0 | 0.0% |
| Black / African American | 0 | 0.0% |
| Hawaiian / Pacific | 0 | 0.0% |
| Hispanic or Latino | 0 | 0.0% |
| Native / Alaskan | 167 | 100.0% |
| White / Caucasian | 0 | 0.0% |
| Two or more Races | 0 | 0.0% |
| Some other Race | 0 | 0.0% |
| Total | 167 | 100.0% |
Ancestry in Tonalea
The most populous ancestries reported in Tonalea are Navajo (167 | 100.0%), and Danish (18 | 10.8%), together accounting for 110.8% of all Tonalea residents.
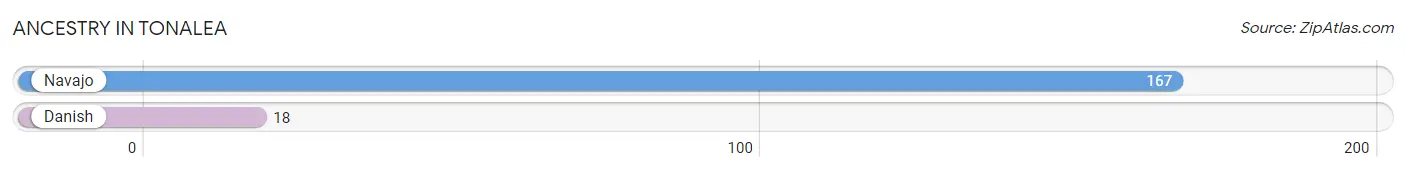
| Ancestry | # Population | % Population |
| Danish | 18 | 10.8% |
| Navajo | 167 | 100.0% | View All 2 Rows |
Immigrants in Tonalea

| Immigration Origin | # Population | % Population | View All 0 Rows |
Sex and Age in Tonalea
Sex and Age in Tonalea
The most populous age groups in Tonalea are 55 to 59 Years (18 | 20.0%) for men and 20 to 24 Years (15 | 19.5%) for women.
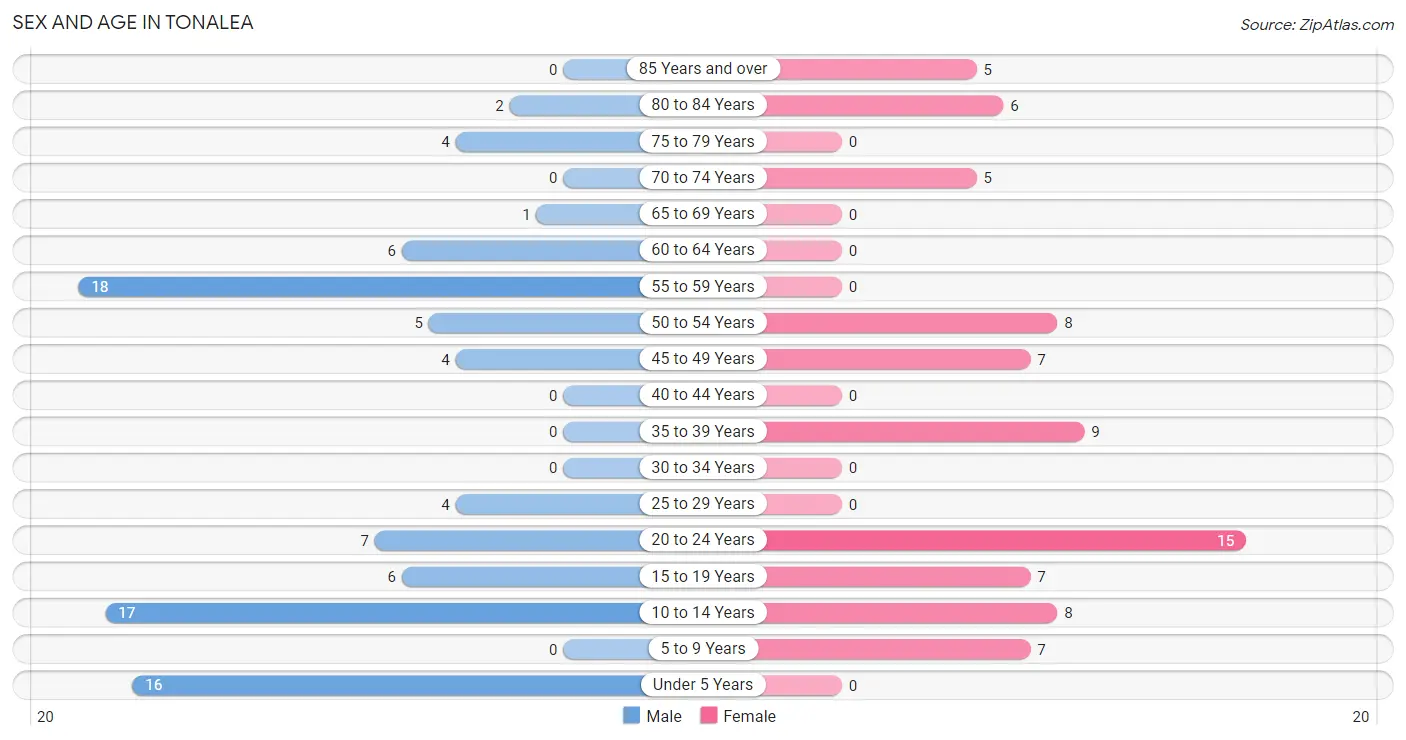
| Age Bracket | Male | Female |
| Under 5 Years | 16 (17.8%) | 0 (0.0%) |
| 5 to 9 Years | 0 (0.0%) | 7 (9.1%) |
| 10 to 14 Years | 17 (18.9%) | 8 (10.4%) |
| 15 to 19 Years | 6 (6.7%) | 7 (9.1%) |
| 20 to 24 Years | 7 (7.8%) | 15 (19.5%) |
| 25 to 29 Years | 4 (4.4%) | 0 (0.0%) |
| 30 to 34 Years | 0 (0.0%) | 0 (0.0%) |
| 35 to 39 Years | 0 (0.0%) | 9 (11.7%) |
| 40 to 44 Years | 0 (0.0%) | 0 (0.0%) |
| 45 to 49 Years | 4 (4.4%) | 7 (9.1%) |
| 50 to 54 Years | 5 (5.6%) | 8 (10.4%) |
| 55 to 59 Years | 18 (20.0%) | 0 (0.0%) |
| 60 to 64 Years | 6 (6.7%) | 0 (0.0%) |
| 65 to 69 Years | 1 (1.1%) | 0 (0.0%) |
| 70 to 74 Years | 0 (0.0%) | 5 (6.5%) |
| 75 to 79 Years | 4 (4.4%) | 0 (0.0%) |
| 80 to 84 Years | 2 (2.2%) | 6 (7.8%) |
| 85 Years and over | 0 (0.0%) | 5 (6.5%) |
| Total | 90 (100.0%) | 77 (100.0%) |
Families and Households in Tonalea
Median Family Size in Tonalea
The median family size in Tonalea is 2.68 persons per family, with single female/mother families (26 | 46.4%) accounting for the largest median family size of 3.96 persons per family. On the other hand, single male/father families (22 | 39.3%) represent the smallest median family size with 1.45 persons per family.
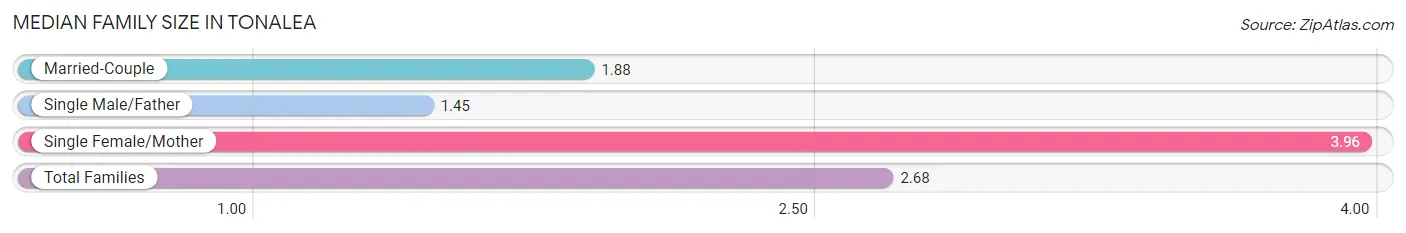
| Family Type | # Families | Family Size |
| Married-Couple | 8 (14.3%) | 1.88 |
| Single Male/Father | 22 (39.3%) | 1.45 |
| Single Female/Mother | 26 (46.4%) | 3.96 |
| Total Families | 56 (100.0%) | 2.68 |
Median Household Size in Tonalea
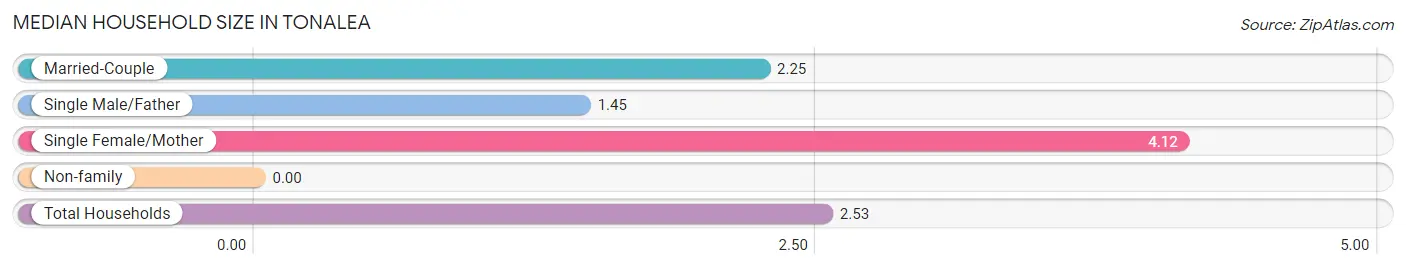
| Household Type | # Households | Household Size |
| Married-Couple | 8 (12.1%) | 2.25 |
| Single Male/Father | 22 (33.3%) | 1.45 |
| Single Female/Mother | 26 (39.4%) | 4.12 |
| Non-family | 10 (15.1%) | - |
| Total Households | 66 (100.0%) | 2.53 |
Household Size by Marriage Status in Tonalea
Out of a total of 66 households in Tonalea, 56 (84.9%) are family households, while 10 (15.1%) are nonfamily households. The most numerous type of family households are 2-person households, comprising 32, and the most common type of nonfamily households are 1-person households, comprising 10.
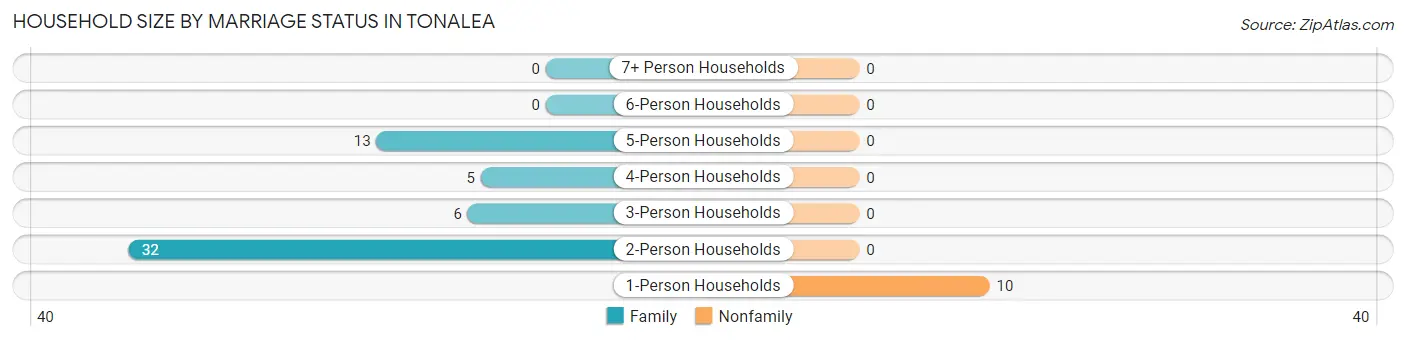
| Household Size | Family Households | Nonfamily Households |
| 1-Person Households | - | 10 (15.1%) |
| 2-Person Households | 32 (48.5%) | 0 (0.0%) |
| 3-Person Households | 6 (9.1%) | 0 (0.0%) |
| 4-Person Households | 5 (7.6%) | 0 (0.0%) |
| 5-Person Households | 13 (19.7%) | 0 (0.0%) |
| 6-Person Households | 0 (0.0%) | 0 (0.0%) |
| 7+ Person Households | 0 (0.0%) | 0 (0.0%) |
| Total | 56 (84.9%) | 10 (15.1%) |
Female Fertility in Tonalea
Fertility by Age in Tonalea
Average fertility rate in Tonalea is 214.0 births per 1,000 women. Women in the age bracket of 35 to 50 years have the highest fertility rate with 450.0 births per 1,000 women. Women in the age bracket of 35 to 50 years acount for 100.0% of all women with births.
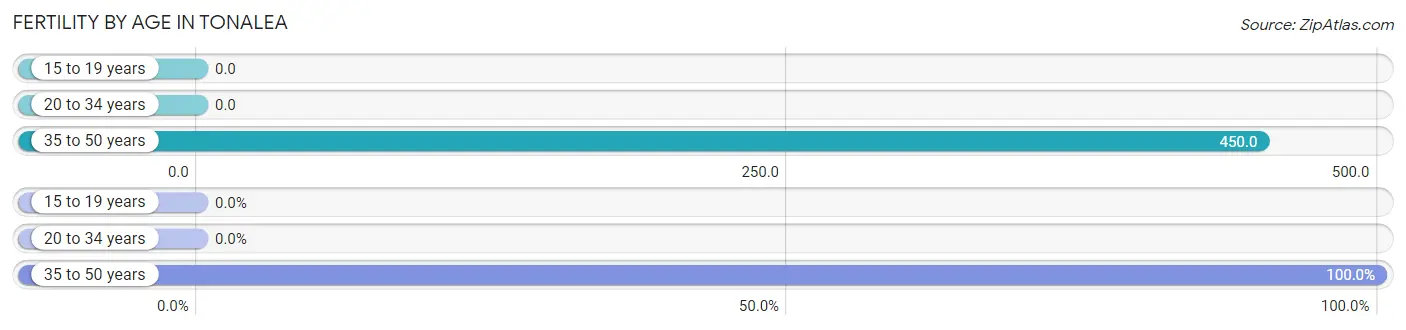
| Age Bracket | Women with Births | Births / 1,000 Women |
| 15 to 19 years | 0 (0.0%) | 0.0 |
| 20 to 34 years | 0 (0.0%) | 0.0 |
| 35 to 50 years | 9 (100.0%) | 450.0 |
| Total | 9 (100.0%) | 214.0 |
Fertility by Age by Marriage Status in Tonalea
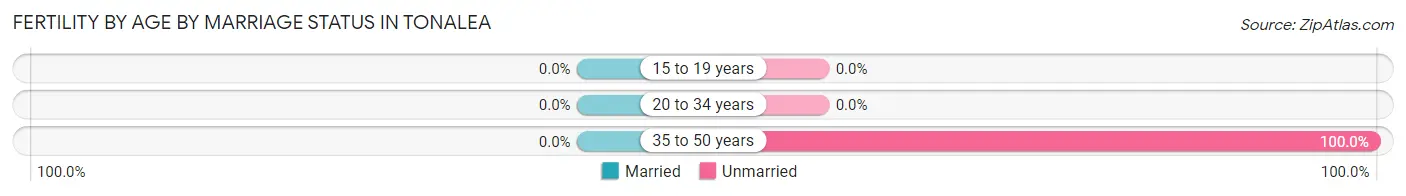
| Age Bracket | Married | Unmarried |
| 15 to 19 years | 0 (0.0%) | 0 (0.0%) |
| 20 to 34 years | 0 (0.0%) | 0 (0.0%) |
| 35 to 50 years | 0 (0.0%) | 9 (100.0%) |
| Total | 0 (0.0%) | 9 (100.0%) |
Fertility by Education in Tonalea
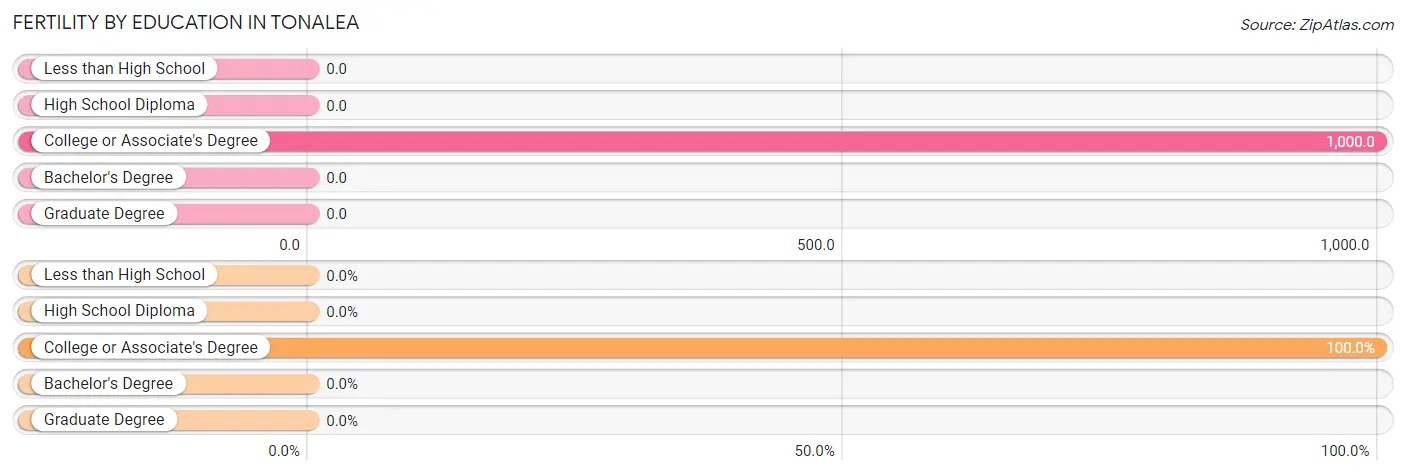
| Educational Attainment | Women with Births | Births / 1,000 Women |
| Less than High School | 0 (0.0%) | 0.0 |
| High School Diploma | 0 (0.0%) | 0.0 |
| College or Associate's Degree | 9 (100.0%) | 1,000.0 |
| Bachelor's Degree | 0 (0.0%) | 0.0 |
| Graduate Degree | 0 (0.0%) | 0.0 |
| Total | 9 (100.0%) | 214.0 |
Fertility by Education by Marriage Status in Tonalea
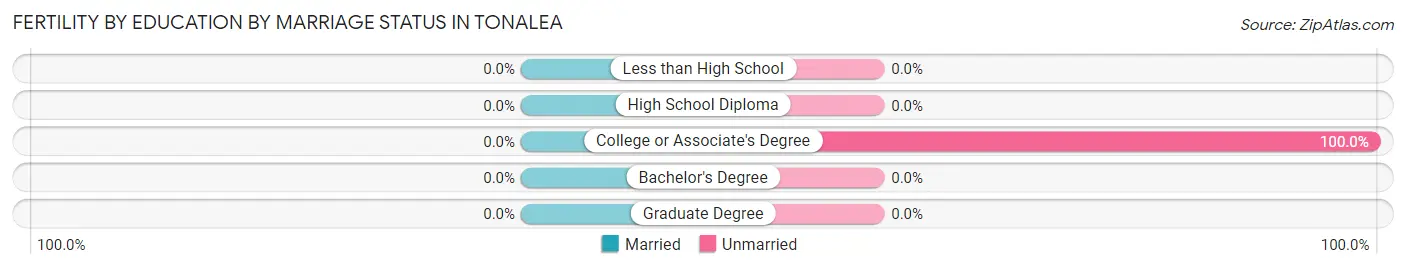
| Educational Attainment | Married | Unmarried |
| Less than High School | 0 (0.0%) | 0 (0.0%) |
| High School Diploma | 0 (0.0%) | 0 (0.0%) |
| College or Associate's Degree | 0 (0.0%) | 9 (100.0%) |
| Bachelor's Degree | 0 (0.0%) | 0 (0.0%) |
| Graduate Degree | 0 (0.0%) | 0 (0.0%) |
| Total | 0 (0.0%) | 9 (100.0%) |
Employment Characteristics in Tonalea
Employment by Class of Employer in Tonalea
Among the 28 employed individuals in Tonalea, private company employees (23 | 82.1%), and local government employees (5 | 17.9%) make up the most common classes of employment.
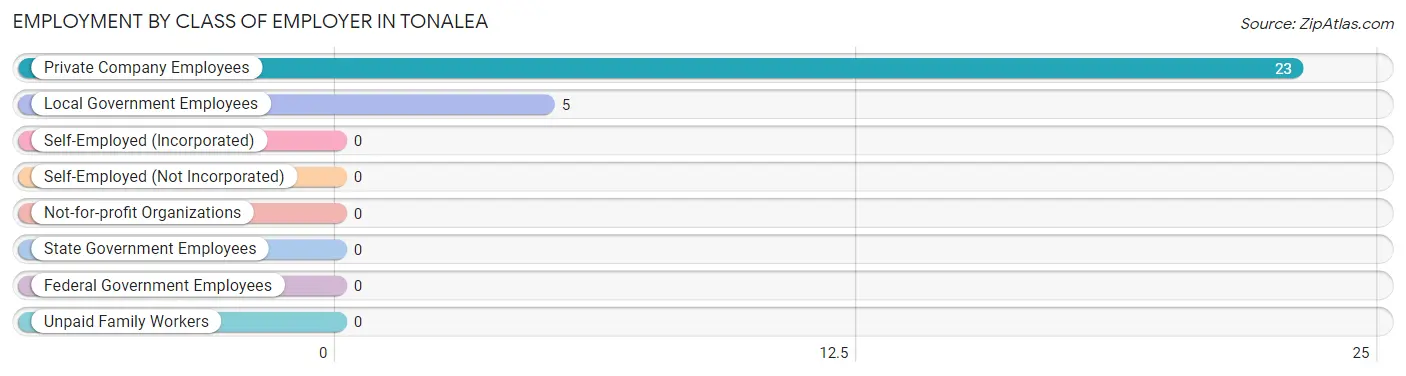
| Employer Class | # Employees | % Employees |
| Private Company Employees | 23 | 82.1% |
| Self-Employed (Incorporated) | 0 | 0.0% |
| Self-Employed (Not Incorporated) | 0 | 0.0% |
| Not-for-profit Organizations | 0 | 0.0% |
| Local Government Employees | 5 | 17.9% |
| State Government Employees | 0 | 0.0% |
| Federal Government Employees | 0 | 0.0% |
| Unpaid Family Workers | 0 | 0.0% |
| Total | 28 | 100.0% |
Employment Status by Age in Tonalea
According to the labor force statistics for Tonalea, out of the total population over 16 years of age (119), 26.9% or 32 individuals are in the labor force, with 12.5% or 4 of them unemployed. The age group with the highest labor force participation rate is 35 to 44 years, with 100.0% or 9 individuals in the labor force. Within the labor force, the 45 to 54 years age range has the highest percentage of unemployed individuals, with 26.7% or 4 of them being unemployed.
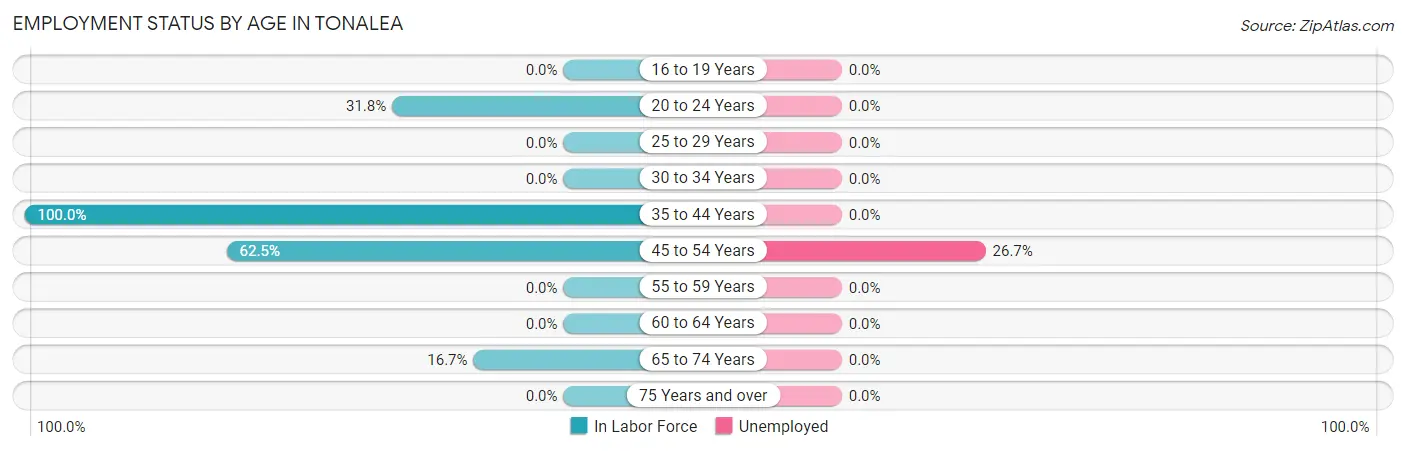
| Age Bracket | In Labor Force | Unemployed |
| 16 to 19 Years | 0 (0.0%) | 0 (0.0%) |
| 20 to 24 Years | 7 (31.8%) | 0 (0.0%) |
| 25 to 29 Years | 0 (0.0%) | 0 (0.0%) |
| 30 to 34 Years | 0 (0.0%) | 0 (0.0%) |
| 35 to 44 Years | 9 (100.0%) | 0 (0.0%) |
| 45 to 54 Years | 15 (62.5%) | 4 (26.7%) |
| 55 to 59 Years | 0 (0.0%) | 0 (0.0%) |
| 60 to 64 Years | 0 (0.0%) | 0 (0.0%) |
| 65 to 74 Years | 1 (16.7%) | 0 (0.0%) |
| 75 Years and over | 0 (0.0%) | 0 (0.0%) |
| Total | 32 (26.9%) | 4 (12.5%) |
Employment Status by Educational Attainment in Tonalea
According to labor force statistics for Tonalea, 39.3% of individuals (24) out of the total population between 25 and 64 years of age (61) are in the labor force, with 16.7% or 4 of them being unemployed. The group with the highest labor force participation rate are those with the educational attainment of bachelor's degree or higher, with 100.0% or 4 individuals in the labor force. Within the labor force, individuals with high school diploma education have the highest percentage of unemployment, with 36.4% or 4 of them being unemployed.
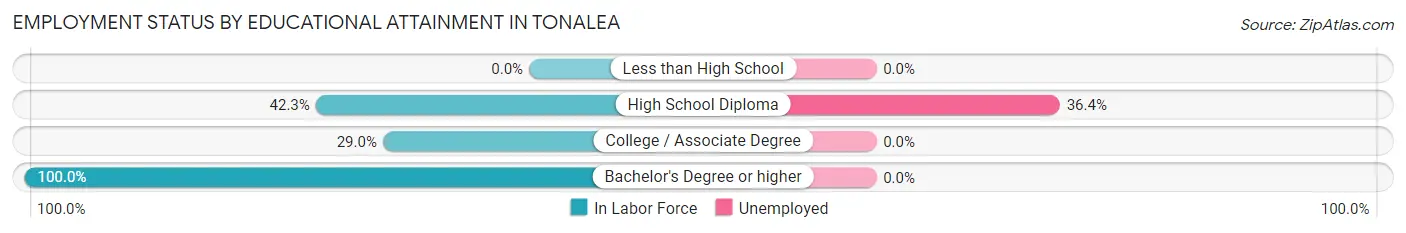
| Educational Attainment | In Labor Force | Unemployed |
| Less than High School | 0 (0.0%) | 0 (0.0%) |
| High School Diploma | 11 (42.3%) | 9 (36.4%) |
| College / Associate Degree | 9 (29.0%) | 0 (0.0%) |
| Bachelor's Degree or higher | 4 (100.0%) | 0 (0.0%) |
| Total | 24 (39.3%) | 10 (16.7%) |
Employment Occupations by Sex in Tonalea
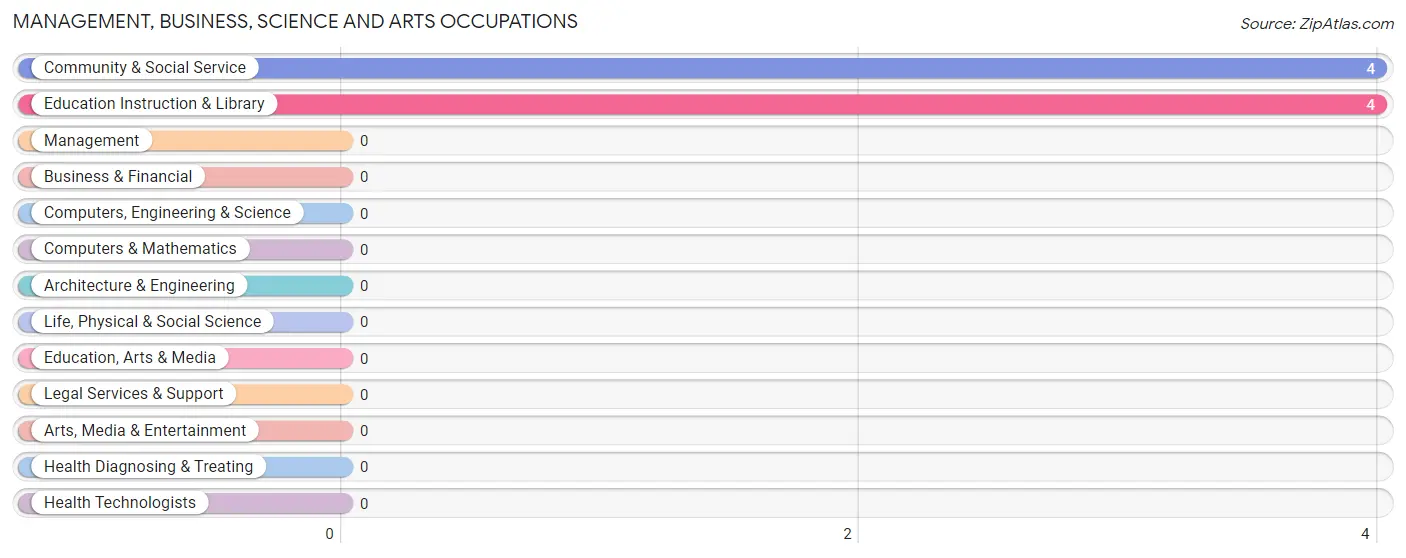
Management, Business, Science and Arts Occupations
The most common Management, Business, Science and Arts occupations in Tonalea are Community & Social Service (4 | 14.3%), and Education Instruction & Library (4 | 14.3%).
Management, Business, Science and Arts Occupations by Sex
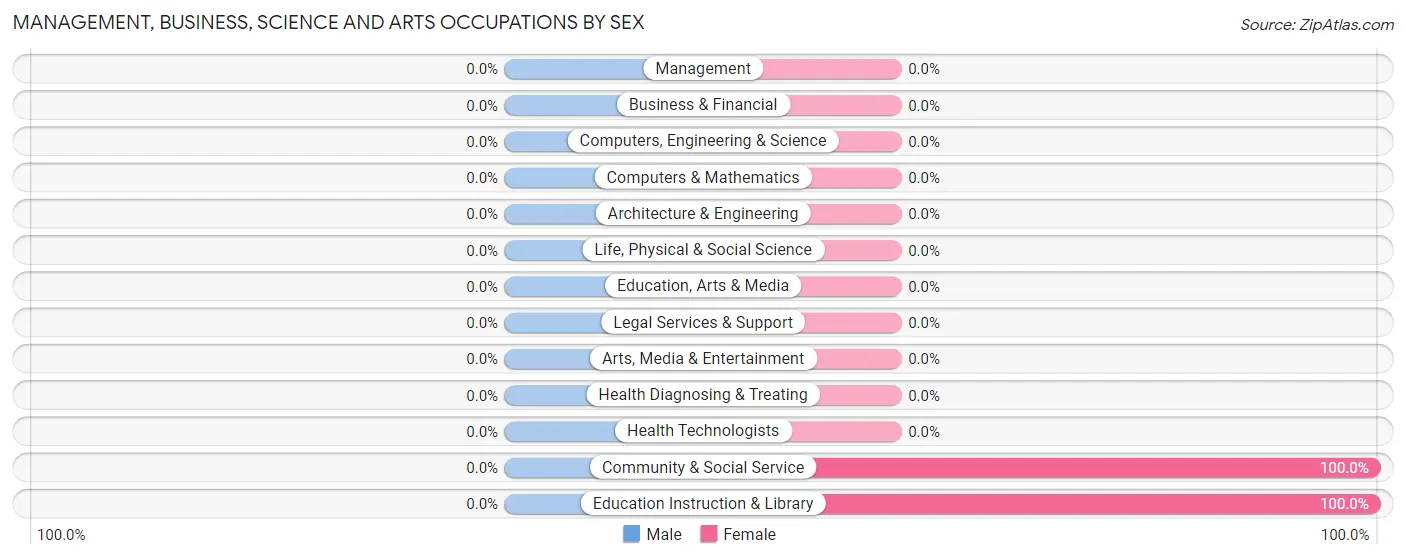
| Occupation | Male | Female |
| Management | 0 (0.0%) | 0 (0.0%) |
| Business & Financial | 0 (0.0%) | 0 (0.0%) |
| Computers, Engineering & Science | 0 (0.0%) | 0 (0.0%) |
| Computers & Mathematics | 0 (0.0%) | 0 (0.0%) |
| Architecture & Engineering | 0 (0.0%) | 0 (0.0%) |
| Life, Physical & Social Science | 0 (0.0%) | 0 (0.0%) |
| Community & Social Service | 0 (0.0%) | 4 (100.0%) |
| Education, Arts & Media | 0 (0.0%) | 0 (0.0%) |
| Legal Services & Support | 0 (0.0%) | 0 (0.0%) |
| Education Instruction & Library | 0 (0.0%) | 4 (100.0%) |
| Arts, Media & Entertainment | 0 (0.0%) | 0 (0.0%) |
| Health Diagnosing & Treating | 0 (0.0%) | 0 (0.0%) |
| Health Technologists | 0 (0.0%) | 0 (0.0%) |
| Total (Category) | 0 (0.0%) | 4 (100.0%) |
| Total (Overall) | 0 (0.0%) | 28 (100.0%) |
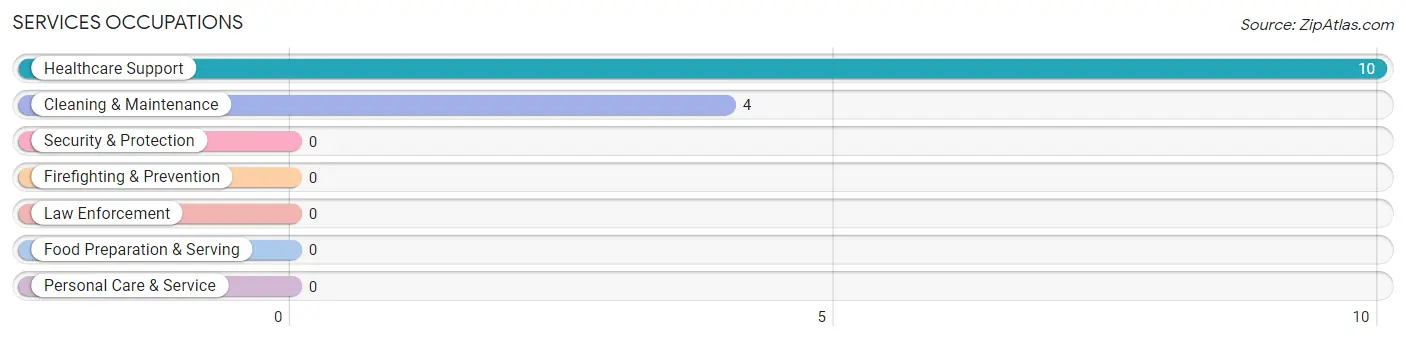
Services Occupations
The most common Services occupations in Tonalea are Healthcare Support (10 | 35.7%), and Cleaning & Maintenance (4 | 14.3%).
Services Occupations by Sex
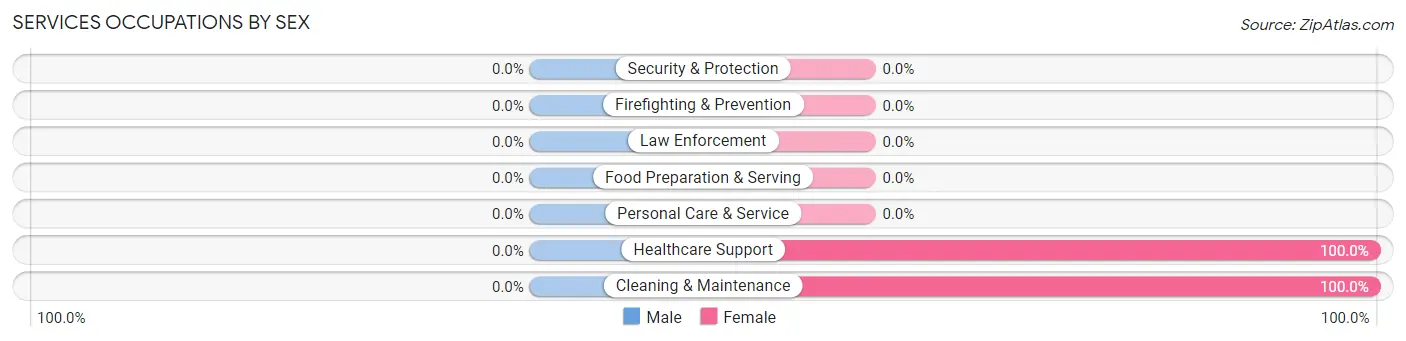
| Occupation | Male | Female |
| Healthcare Support | 0 (0.0%) | 10 (100.0%) |
| Security & Protection | 0 (0.0%) | 0 (0.0%) |
| Firefighting & Prevention | 0 (0.0%) | 0 (0.0%) |
| Law Enforcement | 0 (0.0%) | 0 (0.0%) |
| Food Preparation & Serving | 0 (0.0%) | 0 (0.0%) |
| Cleaning & Maintenance | 0 (0.0%) | 4 (100.0%) |
| Personal Care & Service | 0 (0.0%) | 0 (0.0%) |
| Total (Category) | 0 (0.0%) | 14 (100.0%) |
| Total (Overall) | 0 (0.0%) | 28 (100.0%) |
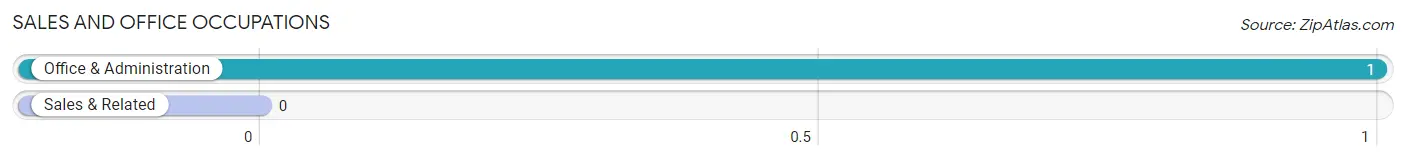
Sales and Office Occupations
The most common Sales and Office occupations in Tonalea are , and Office & Administration (1 | 3.6%).
Sales and Office Occupations by Sex
| Occupation | Male | Female |
| Sales & Related | 0 (0.0%) | 0 (0.0%) |
| Office & Administration | 0 (0.0%) | 1 (100.0%) |
| Total (Category) | 0 (0.0%) | 1 (100.0%) |
| Total (Overall) | 0 (0.0%) | 28 (100.0%) |
Natural Resources, Construction and Maintenance Occupations
The most common Natural Resources, Construction and Maintenance occupations in Tonalea are , and Construction & Extraction (9 | 32.1%).
Natural Resources, Construction and Maintenance Occupations by Sex
| Occupation | Male | Female |
| Farming, Fishing & Forestry | 0 (0.0%) | 0 (0.0%) |
| Construction & Extraction | 0 (0.0%) | 9 (100.0%) |
| Installation, Maintenance & Repair | 0 (0.0%) | 0 (0.0%) |
| Total (Category) | 0 (0.0%) | 9 (100.0%) |
| Total (Overall) | 0 (0.0%) | 28 (100.0%) |
Production, Transportation and Moving Occupations
Production, Transportation and Moving Occupations by Sex
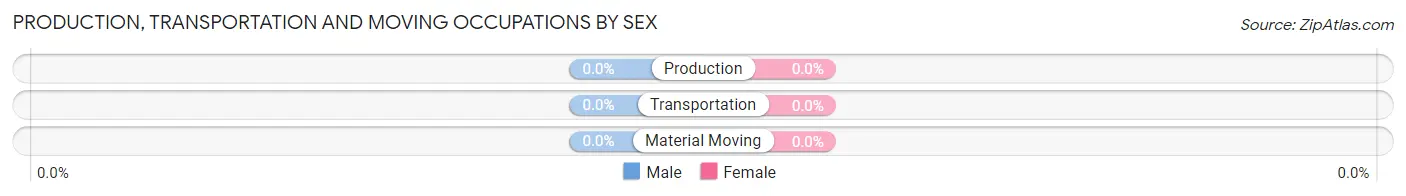
| Occupation | Male | Female |
| Production | 0 (0.0%) | 0 (0.0%) |
| Transportation | 0 (0.0%) | 0 (0.0%) |
| Material Moving | 0 (0.0%) | 0 (0.0%) |
| Total (Category) | 0 (0.0%) | 0 (0.0%) |
| Total (Overall) | 0 (0.0%) | 28 (100.0%) |
Employment Industries by Sex in Tonalea
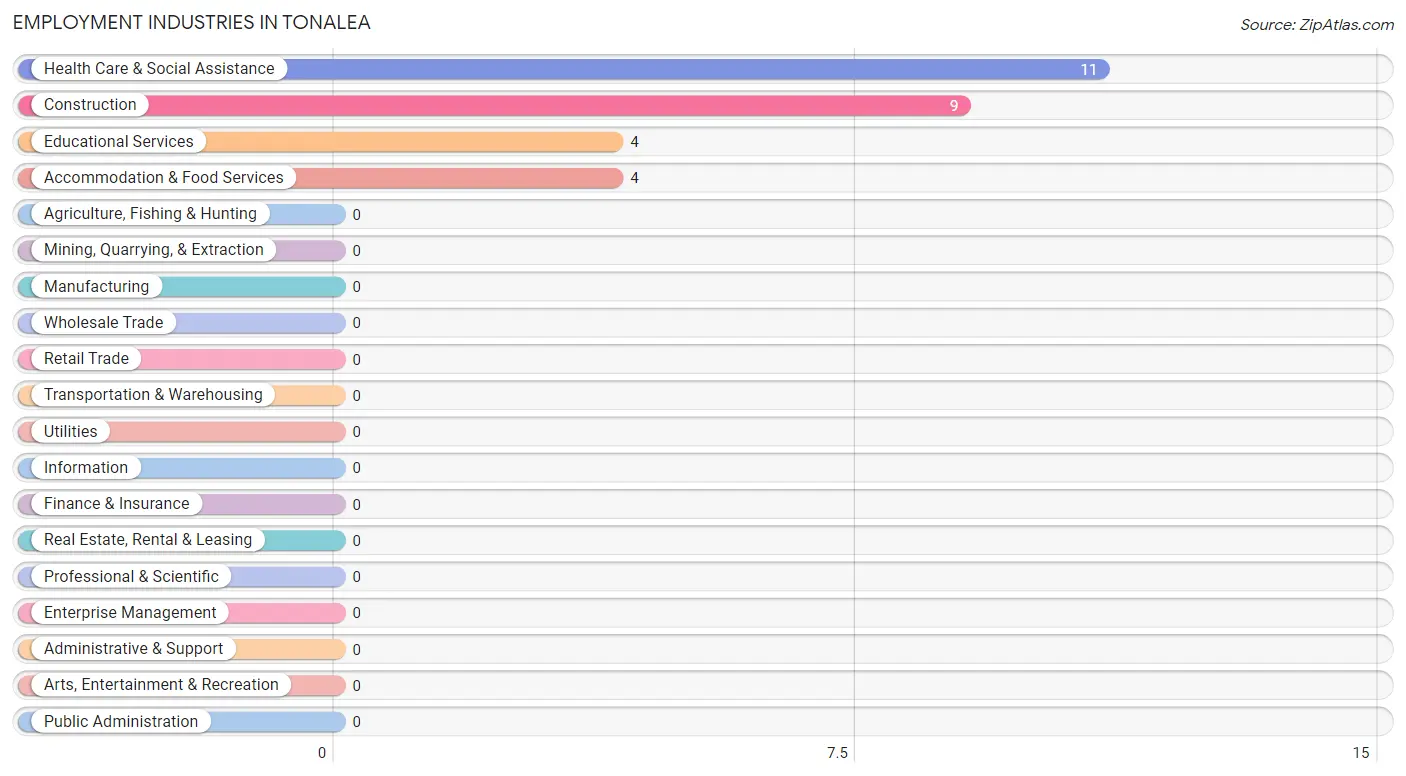
Employment Industries in Tonalea
The major employment industries in Tonalea include Health Care & Social Assistance (11 | 39.3%), Construction (9 | 32.1%), Educational Services (4 | 14.3%), and Accommodation & Food Services (4 | 14.3%).
Employment Industries by Sex in Tonalea
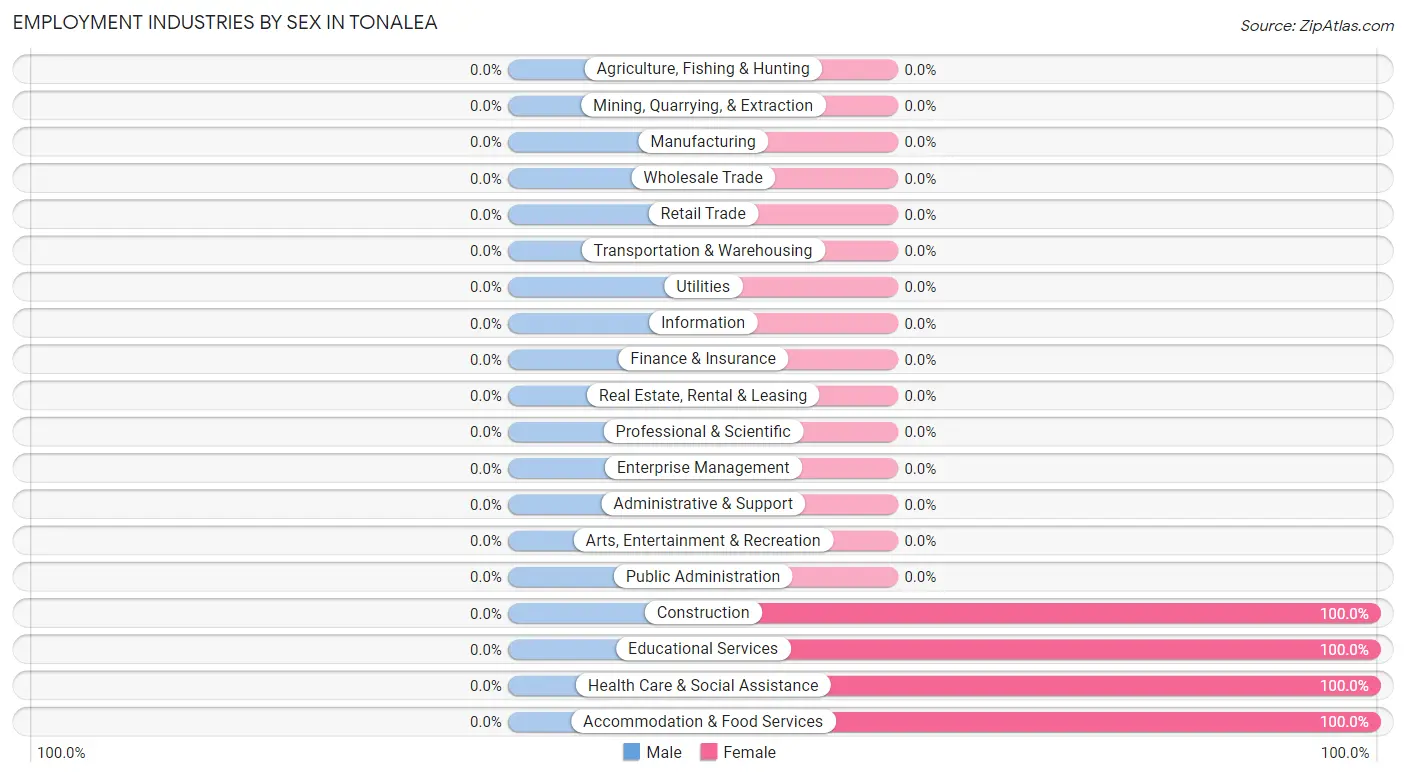
| Industry | Male | Female |
| Agriculture, Fishing & Hunting | 0 (0.0%) | 0 (0.0%) |
| Mining, Quarrying, & Extraction | 0 (0.0%) | 0 (0.0%) |
| Construction | 0 (0.0%) | 9 (100.0%) |
| Manufacturing | 0 (0.0%) | 0 (0.0%) |
| Wholesale Trade | 0 (0.0%) | 0 (0.0%) |
| Retail Trade | 0 (0.0%) | 0 (0.0%) |
| Transportation & Warehousing | 0 (0.0%) | 0 (0.0%) |
| Utilities | 0 (0.0%) | 0 (0.0%) |
| Information | 0 (0.0%) | 0 (0.0%) |
| Finance & Insurance | 0 (0.0%) | 0 (0.0%) |
| Real Estate, Rental & Leasing | 0 (0.0%) | 0 (0.0%) |
| Professional & Scientific | 0 (0.0%) | 0 (0.0%) |
| Enterprise Management | 0 (0.0%) | 0 (0.0%) |
| Administrative & Support | 0 (0.0%) | 0 (0.0%) |
| Educational Services | 0 (0.0%) | 4 (100.0%) |
| Health Care & Social Assistance | 0 (0.0%) | 11 (100.0%) |
| Arts, Entertainment & Recreation | 0 (0.0%) | 0 (0.0%) |
| Accommodation & Food Services | 0 (0.0%) | 4 (100.0%) |
| Public Administration | 0 (0.0%) | 0 (0.0%) |
| Total | 0 (0.0%) | 28 (100.0%) |
Education in Tonalea
School Enrollment in Tonalea
The most common levels of schooling among the 45 students in Tonalea are middle school (19 | 42.2%), elementary school (13 | 28.9%), and high school (13 | 28.9%).
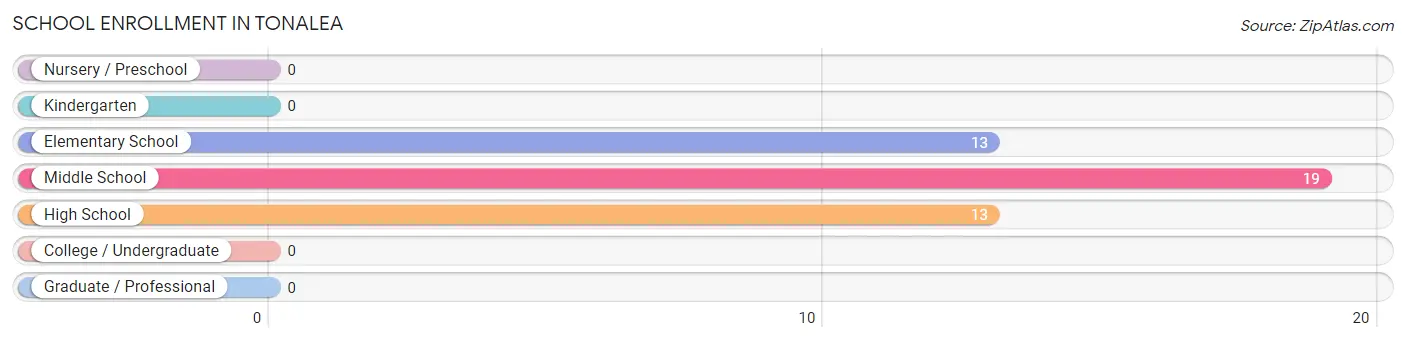
| School Level | # Students | % Students |
| Nursery / Preschool | 0 | 0.0% |
| Kindergarten | 0 | 0.0% |
| Elementary School | 13 | 28.9% |
| Middle School | 19 | 42.2% |
| High School | 13 | 28.9% |
| College / Undergraduate | 0 | 0.0% |
| Graduate / Professional | 0 | 0.0% |
| Total | 45 | 100.0% |
School Enrollment by Age by Funding Source in Tonalea
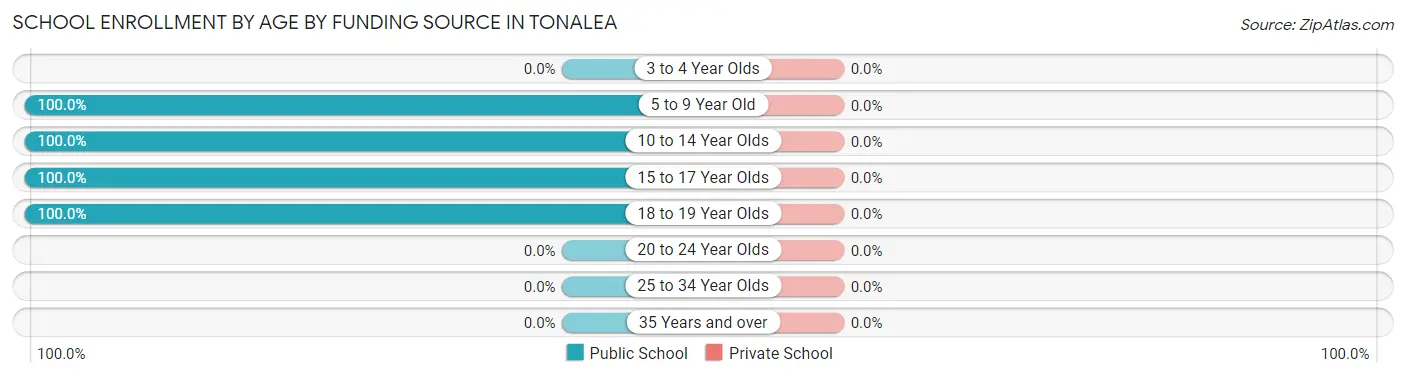
| Age Bracket | Public School | Private School |
| 3 to 4 Year Olds | 0 (0.0%) | 0 (0.0%) |
| 5 to 9 Year Old | 7 (100.0%) | 0 (0.0%) |
| 10 to 14 Year Olds | 25 (100.0%) | 0 (0.0%) |
| 15 to 17 Year Olds | 6 (100.0%) | 0 (0.0%) |
| 18 to 19 Year Olds | 7 (100.0%) | 0 (0.0%) |
| 20 to 24 Year Olds | 0 (0.0%) | 0 (0.0%) |
| 25 to 34 Year Olds | 0 (0.0%) | 0 (0.0%) |
| 35 Years and over | 0 (0.0%) | 0 (0.0%) |
| Total | 45 (100.0%) | 0 (0.0%) |
Educational Attainment by Field of Study in Tonalea
, and education (4 | 100.0%) are the most common fields of study among 4 individuals in Tonalea who have obtained a bachelor's degree or higher.
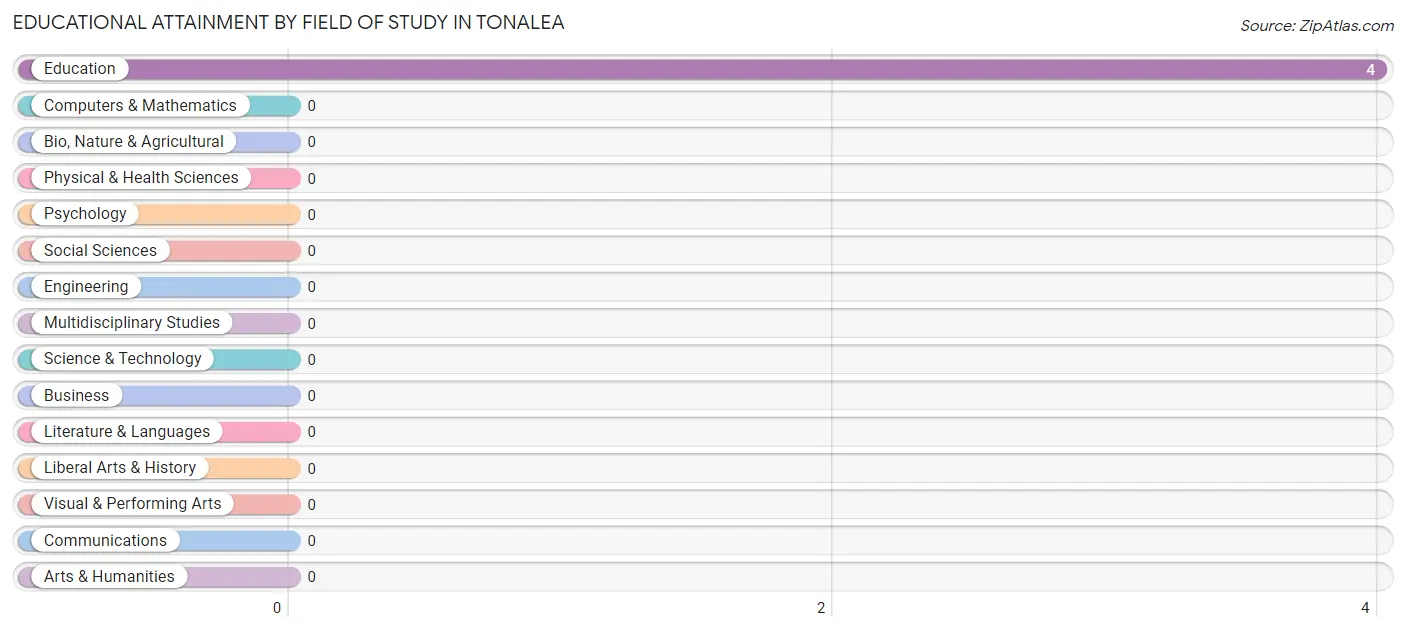
| Field of Study | # Graduates | % Graduates |
| Computers & Mathematics | 0 | 0.0% |
| Bio, Nature & Agricultural | 0 | 0.0% |
| Physical & Health Sciences | 0 | 0.0% |
| Psychology | 0 | 0.0% |
| Social Sciences | 0 | 0.0% |
| Engineering | 0 | 0.0% |
| Multidisciplinary Studies | 0 | 0.0% |
| Science & Technology | 0 | 0.0% |
| Business | 0 | 0.0% |
| Education | 4 | 100.0% |
| Literature & Languages | 0 | 0.0% |
| Liberal Arts & History | 0 | 0.0% |
| Visual & Performing Arts | 0 | 0.0% |
| Communications | 0 | 0.0% |
| Arts & Humanities | 0 | 0.0% |
| Total | 4 | 100.0% |
Transportation & Commute in Tonalea
Vehicle Availability by Sex in Tonalea
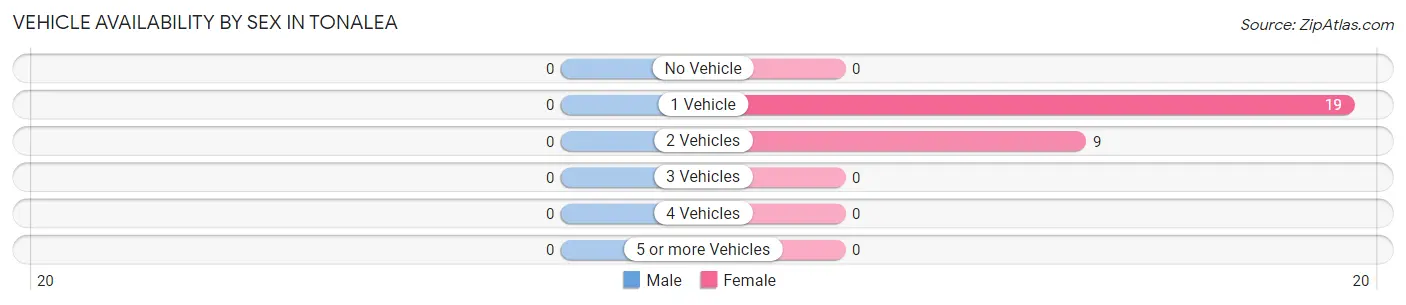
| Vehicles Available | Male | Female |
| No Vehicle | 0 (0.0%) | 0 (0.0%) |
| 1 Vehicle | 0 (0.0%) | 19 (67.9%) |
| 2 Vehicles | 0 (0.0%) | 9 (32.1%) |
| 3 Vehicles | 0 (0.0%) | 0 (0.0%) |
| 4 Vehicles | 0 (0.0%) | 0 (0.0%) |
| 5 or more Vehicles | 0 (0.0%) | 0 (0.0%) |
| Total | 0 (0.0%) | 28 (100.0%) |
Commute Time in Tonalea
The most frequently occuring commute durations in Tonalea are 35 to 39 minutes (12 commuters, 48.0%), 10 to 14 minutes (9 commuters, 36.0%), and less than 5 minutes (4 commuters, 16.0%).
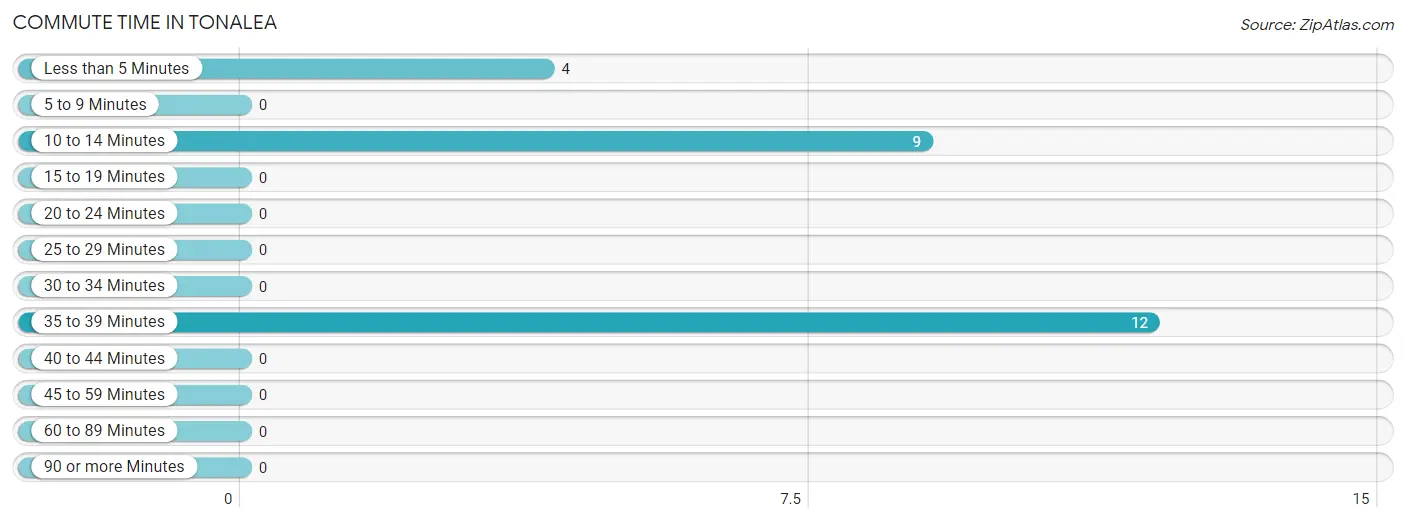
| Commute Time | # Commuters | % Commuters |
| Less than 5 Minutes | 4 | 16.0% |
| 5 to 9 Minutes | 0 | 0.0% |
| 10 to 14 Minutes | 9 | 36.0% |
| 15 to 19 Minutes | 0 | 0.0% |
| 20 to 24 Minutes | 0 | 0.0% |
| 25 to 29 Minutes | 0 | 0.0% |
| 30 to 34 Minutes | 0 | 0.0% |
| 35 to 39 Minutes | 12 | 48.0% |
| 40 to 44 Minutes | 0 | 0.0% |
| 45 to 59 Minutes | 0 | 0.0% |
| 60 to 89 Minutes | 0 | 0.0% |
| 90 or more Minutes | 0 | 0.0% |
Commute Time by Sex in Tonalea
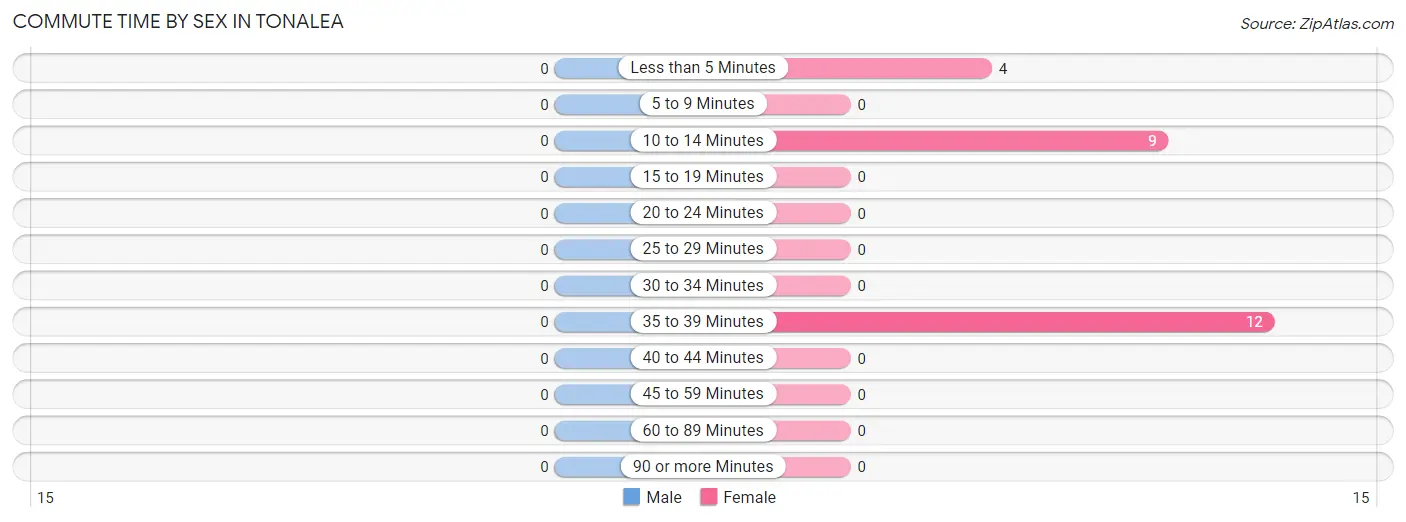
| Commute Time | Male | Female |
| Less than 5 Minutes | 0 (0.0%) | 4 (16.0%) |
| 5 to 9 Minutes | 0 (0.0%) | 0 (0.0%) |
| 10 to 14 Minutes | 0 (0.0%) | 9 (36.0%) |
| 15 to 19 Minutes | 0 (0.0%) | 0 (0.0%) |
| 20 to 24 Minutes | 0 (0.0%) | 0 (0.0%) |
| 25 to 29 Minutes | 0 (0.0%) | 0 (0.0%) |
| 30 to 34 Minutes | 0 (0.0%) | 0 (0.0%) |
| 35 to 39 Minutes | 0 (0.0%) | 12 (48.0%) |
| 40 to 44 Minutes | 0 (0.0%) | 0 (0.0%) |
| 45 to 59 Minutes | 0 (0.0%) | 0 (0.0%) |
| 60 to 89 Minutes | 0 (0.0%) | 0 (0.0%) |
| 90 or more Minutes | 0 (0.0%) | 0 (0.0%) |
Time of Departure to Work by Sex in Tonalea
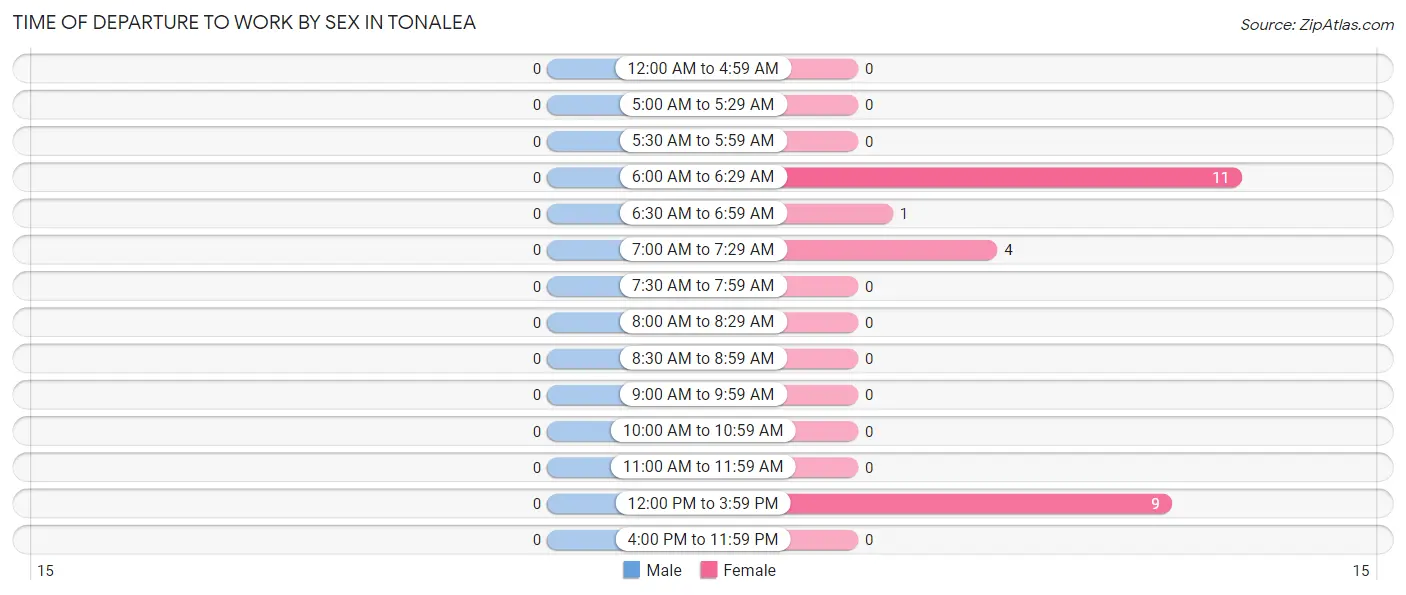
| Time of Departure | Male | Female |
| 12:00 AM to 4:59 AM | 0 (0.0%) | 0 (0.0%) |
| 5:00 AM to 5:29 AM | 0 (0.0%) | 0 (0.0%) |
| 5:30 AM to 5:59 AM | 0 (0.0%) | 0 (0.0%) |
| 6:00 AM to 6:29 AM | 0 (0.0%) | 11 (44.0%) |
| 6:30 AM to 6:59 AM | 0 (0.0%) | 1 (4.0%) |
| 7:00 AM to 7:29 AM | 0 (0.0%) | 4 (16.0%) |
| 7:30 AM to 7:59 AM | 0 (0.0%) | 0 (0.0%) |
| 8:00 AM to 8:29 AM | 0 (0.0%) | 0 (0.0%) |
| 8:30 AM to 8:59 AM | 0 (0.0%) | 0 (0.0%) |
| 9:00 AM to 9:59 AM | 0 (0.0%) | 0 (0.0%) |
| 10:00 AM to 10:59 AM | 0 (0.0%) | 0 (0.0%) |
| 11:00 AM to 11:59 AM | 0 (0.0%) | 0 (0.0%) |
| 12:00 PM to 3:59 PM | 0 (0.0%) | 9 (36.0%) |
| 4:00 PM to 11:59 PM | 0 (0.0%) | 0 (0.0%) |
| Total | 0 (0.0%) | 25 (100.0%) |
Housing Occupancy in Tonalea
Occupancy by Ownership in Tonalea
Of the total 66 dwellings in Tonalea, owner-occupied units account for 35 (53.0%), while renter-occupied units make up 31 (47.0%).
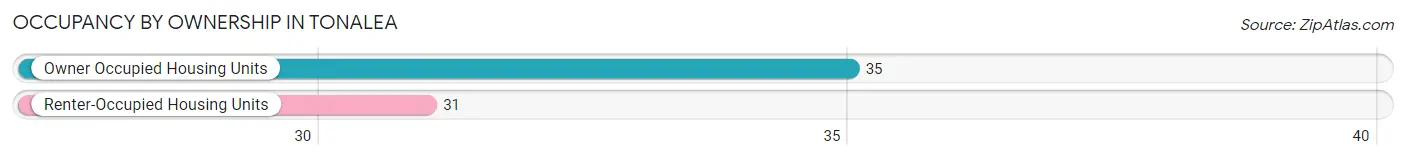
| Occupancy | # Housing Units | % Housing Units |
| Owner Occupied Housing Units | 35 | 53.0% |
| Renter-Occupied Housing Units | 31 | 47.0% |
| Total Occupied Housing Units | 66 | 100.0% |
Occupancy by Household Size in Tonalea
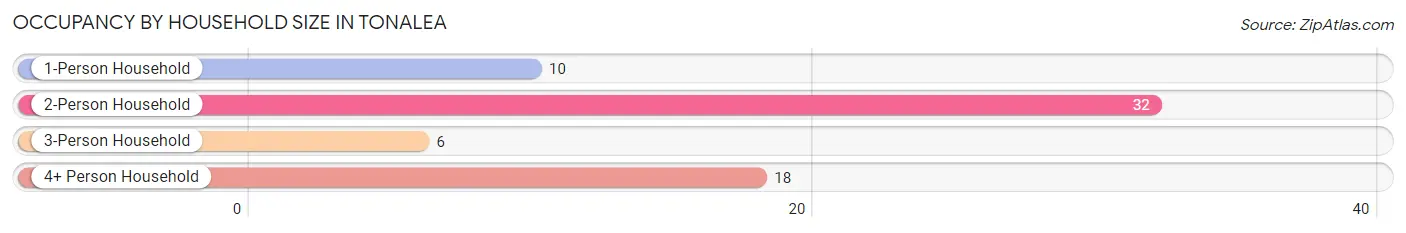
| Household Size | # Housing Units | % Housing Units |
| 1-Person Household | 10 | 15.1% |
| 2-Person Household | 32 | 48.5% |
| 3-Person Household | 6 | 9.1% |
| 4+ Person Household | 18 | 27.3% |
| Total Housing Units | 66 | 100.0% |
Occupancy by Ownership by Household Size in Tonalea
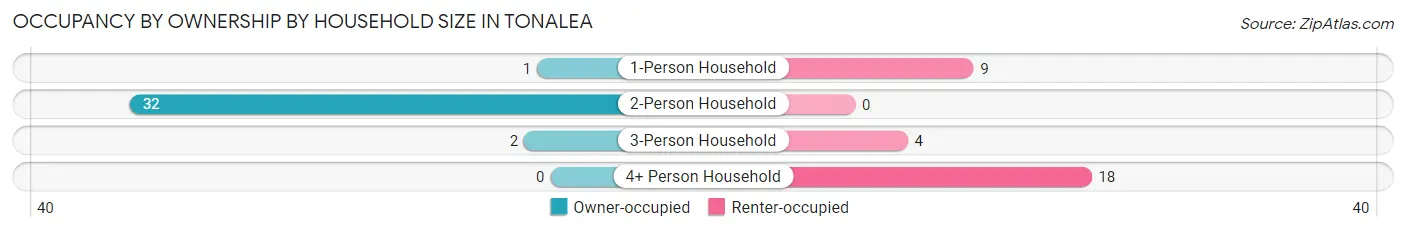
| Household Size | Owner-occupied | Renter-occupied |
| 1-Person Household | 1 (10.0%) | 9 (90.0%) |
| 2-Person Household | 32 (100.0%) | 0 (0.0%) |
| 3-Person Household | 2 (33.3%) | 4 (66.7%) |
| 4+ Person Household | 0 (0.0%) | 18 (100.0%) |
| Total Housing Units | 35 (53.0%) | 31 (47.0%) |
Occupancy by Educational Attainment in Tonalea
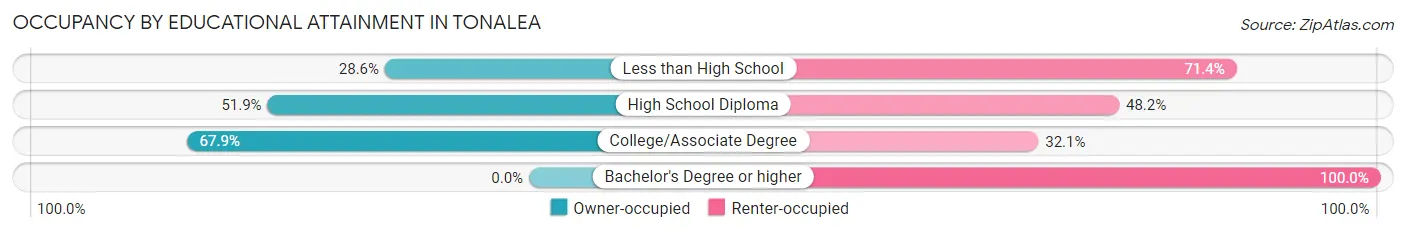
| Household Size | Owner-occupied | Renter-occupied |
| Less than High School | 2 (28.6%) | 5 (71.4%) |
| High School Diploma | 14 (51.8%) | 13 (48.1%) |
| College/Associate Degree | 19 (67.9%) | 9 (32.1%) |
| Bachelor's Degree or higher | 0 (0.0%) | 4 (100.0%) |
Occupancy by Age of Householder in Tonalea
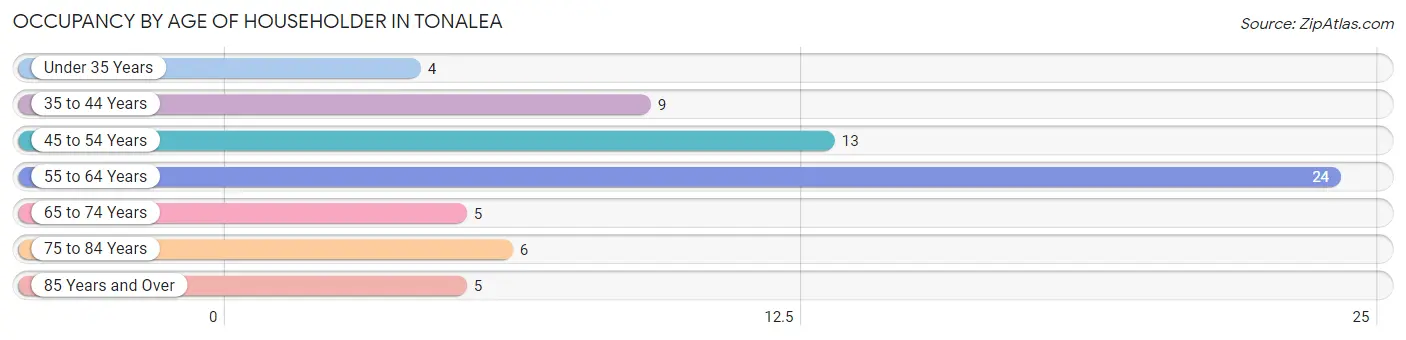
| Age Bracket | # Households | % Households |
| Under 35 Years | 4 | 6.1% |
| 35 to 44 Years | 9 | 13.6% |
| 45 to 54 Years | 13 | 19.7% |
| 55 to 64 Years | 24 | 36.4% |
| 65 to 74 Years | 5 | 7.6% |
| 75 to 84 Years | 6 | 9.1% |
| 85 Years and Over | 5 | 7.6% |
| Total | 66 | 100.0% |
Housing Finances in Tonalea
Median Income by Occupancy in Tonalea
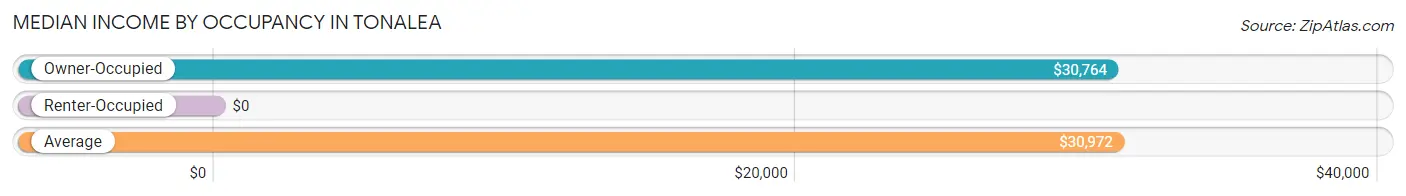
| Occupancy Type | # Households | Median Income |
| Owner-Occupied | 35 (53.0%) | $30,764 |
| Renter-Occupied | 31 (47.0%) | $0 |
| Average | 66 (100.0%) | $30,972 |
Occupancy by Householder Income Bracket in Tonalea
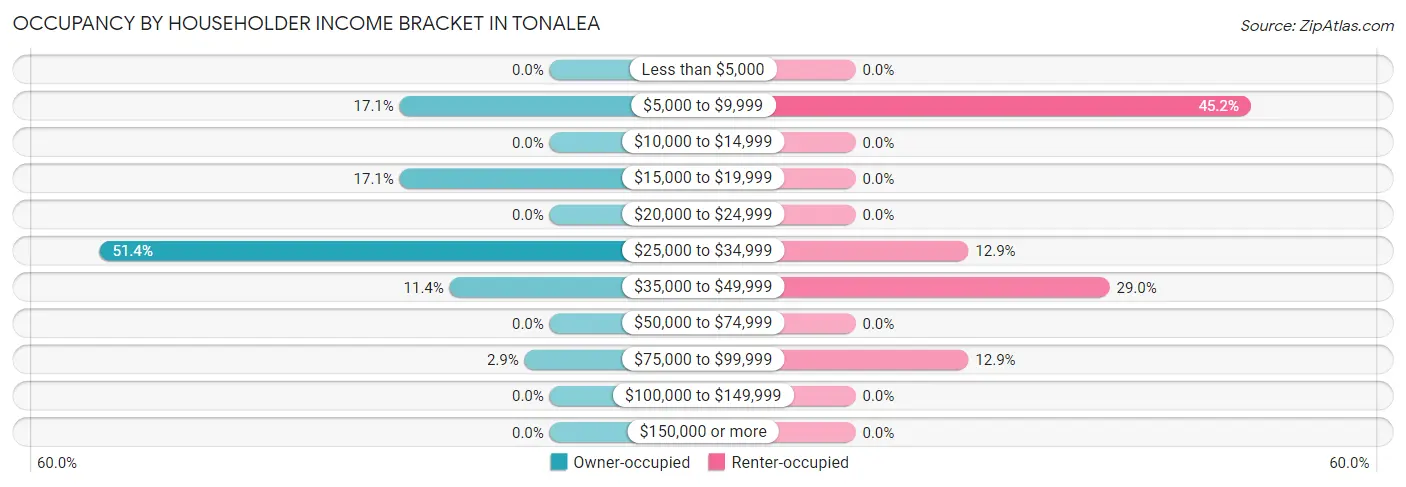
| Income Bracket | Owner-occupied | Renter-occupied |
| Less than $5,000 | 0 (0.0%) | 0 (0.0%) |
| $5,000 to $9,999 | 6 (17.1%) | 14 (45.2%) |
| $10,000 to $14,999 | 0 (0.0%) | 0 (0.0%) |
| $15,000 to $19,999 | 6 (17.1%) | 0 (0.0%) |
| $20,000 to $24,999 | 0 (0.0%) | 0 (0.0%) |
| $25,000 to $34,999 | 18 (51.4%) | 4 (12.9%) |
| $35,000 to $49,999 | 4 (11.4%) | 9 (29.0%) |
| $50,000 to $74,999 | 0 (0.0%) | 0 (0.0%) |
| $75,000 to $99,999 | 1 (2.9%) | 4 (12.9%) |
| $100,000 to $149,999 | 0 (0.0%) | 0 (0.0%) |
| $150,000 or more | 0 (0.0%) | 0 (0.0%) |
| Total | 35 (100.0%) | 31 (100.0%) |
Monthly Housing Cost Tiers in Tonalea
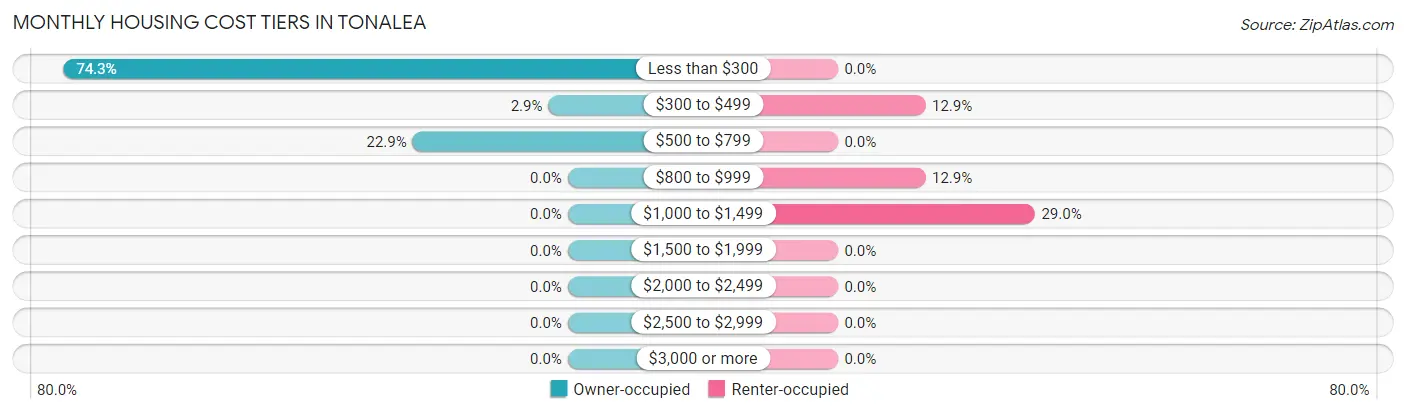
| Monthly Cost | Owner-occupied | Renter-occupied |
| Less than $300 | 26 (74.3%) | 0 (0.0%) |
| $300 to $499 | 1 (2.9%) | 4 (12.9%) |
| $500 to $799 | 8 (22.9%) | 0 (0.0%) |
| $800 to $999 | 0 (0.0%) | 4 (12.9%) |
| $1,000 to $1,499 | 0 (0.0%) | 9 (29.0%) |
| $1,500 to $1,999 | 0 (0.0%) | 0 (0.0%) |
| $2,000 to $2,499 | 0 (0.0%) | 0 (0.0%) |
| $2,500 to $2,999 | 0 (0.0%) | 0 (0.0%) |
| $3,000 or more | 0 (0.0%) | 0 (0.0%) |
| Total | 35 (100.0%) | 31 (100.0%) |
Physical Housing Characteristics in Tonalea
Housing Structures in Tonalea
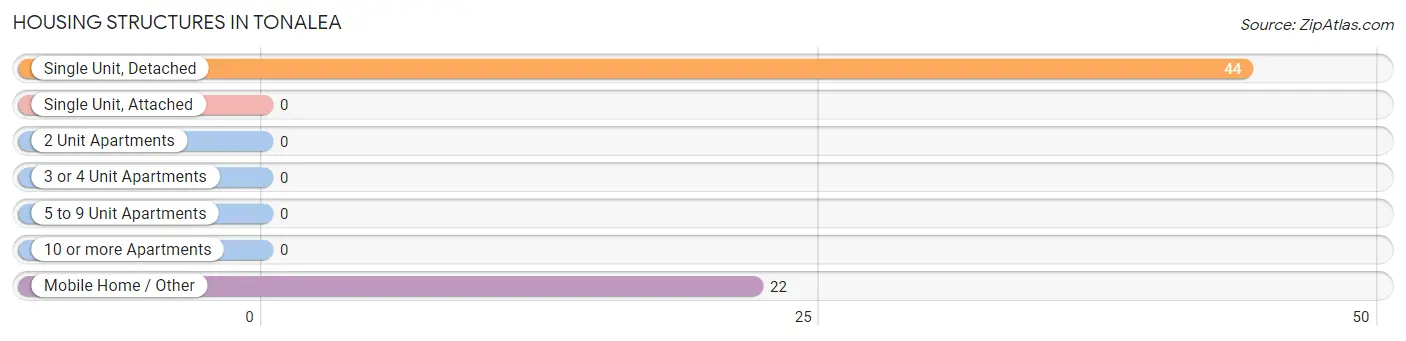
| Structure Type | # Housing Units | % Housing Units |
| Single Unit, Detached | 44 | 66.7% |
| Single Unit, Attached | 0 | 0.0% |
| 2 Unit Apartments | 0 | 0.0% |
| 3 or 4 Unit Apartments | 0 | 0.0% |
| 5 to 9 Unit Apartments | 0 | 0.0% |
| 10 or more Apartments | 0 | 0.0% |
| Mobile Home / Other | 22 | 33.3% |
| Total | 66 | 100.0% |
Housing Structures by Occupancy in Tonalea
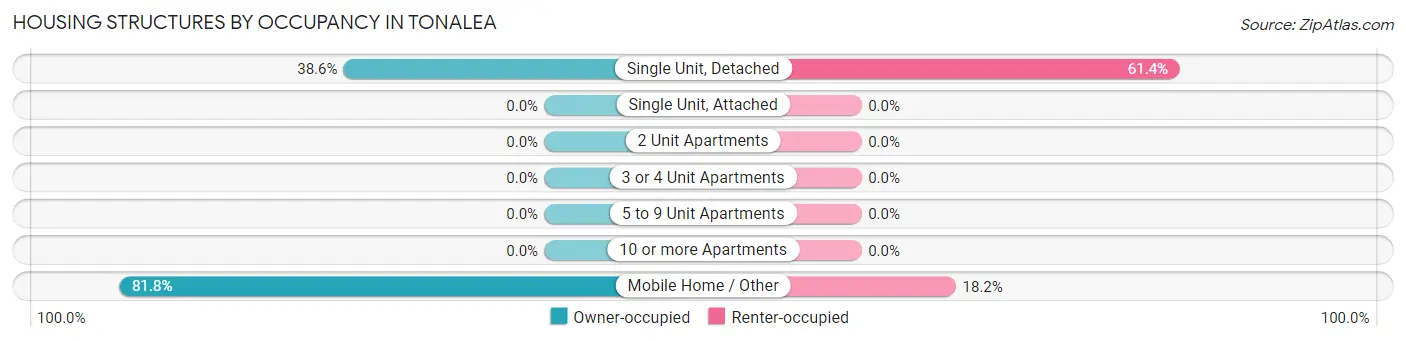
| Structure Type | Owner-occupied | Renter-occupied |
| Single Unit, Detached | 17 (38.6%) | 27 (61.4%) |
| Single Unit, Attached | 0 (0.0%) | 0 (0.0%) |
| 2 Unit Apartments | 0 (0.0%) | 0 (0.0%) |
| 3 or 4 Unit Apartments | 0 (0.0%) | 0 (0.0%) |
| 5 to 9 Unit Apartments | 0 (0.0%) | 0 (0.0%) |
| 10 or more Apartments | 0 (0.0%) | 0 (0.0%) |
| Mobile Home / Other | 18 (81.8%) | 4 (18.2%) |
| Total | 35 (53.0%) | 31 (47.0%) |
Housing Structures by Number of Rooms in Tonalea
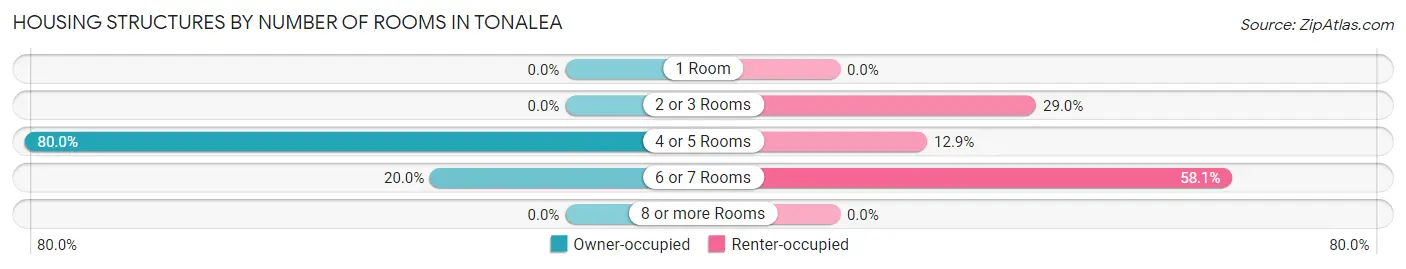
| Number of Rooms | Owner-occupied | Renter-occupied |
| 1 Room | 0 (0.0%) | 0 (0.0%) |
| 2 or 3 Rooms | 0 (0.0%) | 9 (29.0%) |
| 4 or 5 Rooms | 28 (80.0%) | 4 (12.9%) |
| 6 or 7 Rooms | 7 (20.0%) | 18 (58.1%) |
| 8 or more Rooms | 0 (0.0%) | 0 (0.0%) |
| Total | 35 (100.0%) | 31 (100.0%) |
Housing Structure by Heating Type in Tonalea
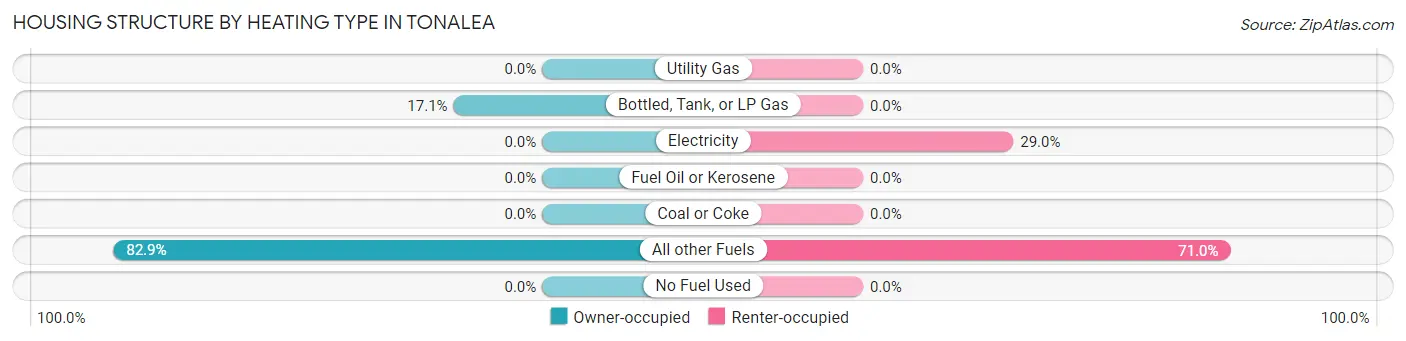
| Heating Type | Owner-occupied | Renter-occupied |
| Utility Gas | 0 (0.0%) | 0 (0.0%) |
| Bottled, Tank, or LP Gas | 6 (17.1%) | 0 (0.0%) |
| Electricity | 0 (0.0%) | 9 (29.0%) |
| Fuel Oil or Kerosene | 0 (0.0%) | 0 (0.0%) |
| Coal or Coke | 0 (0.0%) | 0 (0.0%) |
| All other Fuels | 29 (82.9%) | 22 (71.0%) |
| No Fuel Used | 0 (0.0%) | 0 (0.0%) |
| Total | 35 (100.0%) | 31 (100.0%) |
Household Vehicle Usage in Tonalea
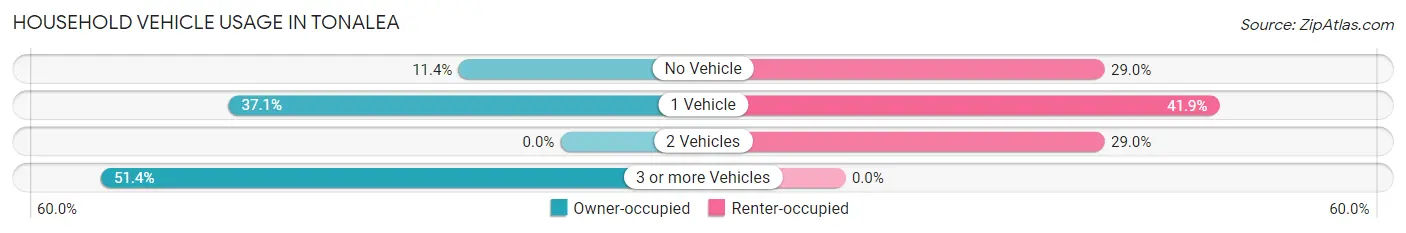
| Vehicles per Household | Owner-occupied | Renter-occupied |
| No Vehicle | 4 (11.4%) | 9 (29.0%) |
| 1 Vehicle | 13 (37.1%) | 13 (41.9%) |
| 2 Vehicles | 0 (0.0%) | 9 (29.0%) |
| 3 or more Vehicles | 18 (51.4%) | 0 (0.0%) |
| Total | 35 (100.0%) | 31 (100.0%) |
Real Estate & Mortgages in Tonalea
Real Estate and Mortgage Overview in Tonalea
| Characteristic | Without Mortgage | With Mortgage |
| Housing Units | 35 | 0 |
| Median Property Value | $9,999 | $0 |
| Median Household Income | $30,764 | $0 |
| Monthly Housing Costs | $281 | $0 |
| Real Estate Taxes | - | - |
Property Value by Mortgage Status in Tonalea
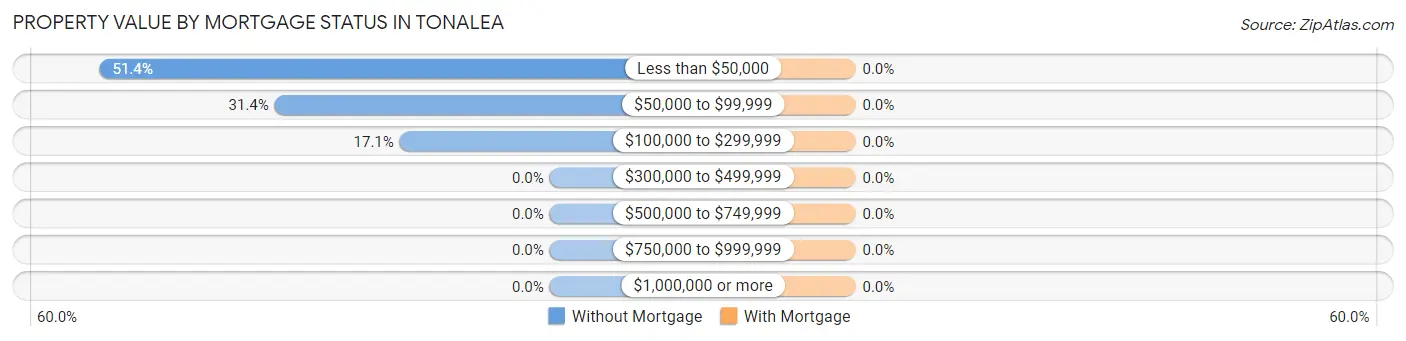
| Property Value | Without Mortgage | With Mortgage |
| Less than $50,000 | 18 (51.4%) | 0 (0.0%) |
| $50,000 to $99,999 | 11 (31.4%) | 0 (0.0%) |
| $100,000 to $299,999 | 6 (17.1%) | 0 (0.0%) |
| $300,000 to $499,999 | 0 (0.0%) | 0 (0.0%) |
| $500,000 to $749,999 | 0 (0.0%) | 0 (0.0%) |
| $750,000 to $999,999 | 0 (0.0%) | 0 (0.0%) |
| $1,000,000 or more | 0 (0.0%) | 0 (0.0%) |
| Total | 35 (100.0%) | 0 (0.0%) |
Household Income by Mortgage Status in Tonalea
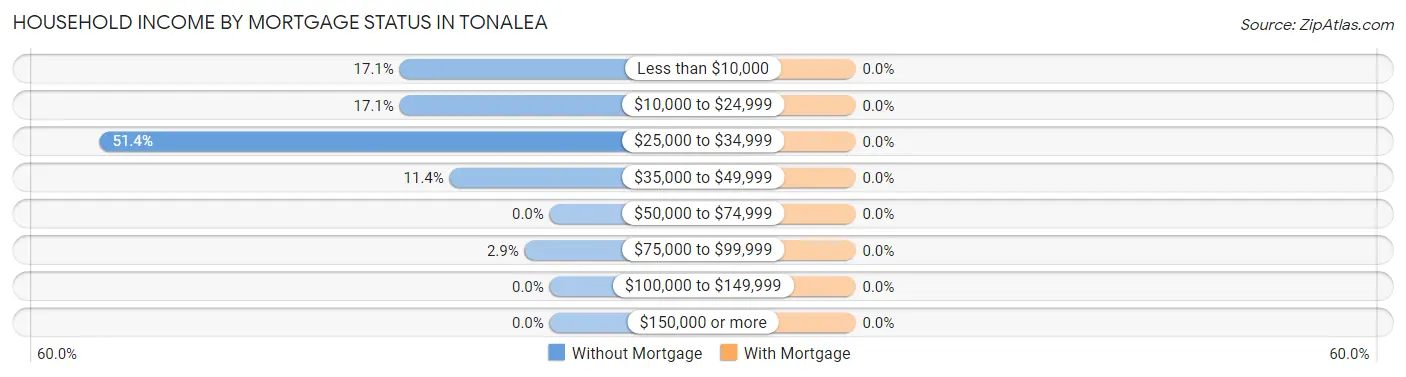
| Household Income | Without Mortgage | With Mortgage |
| Less than $10,000 | 6 (17.1%) | 0 (0.0%) |
| $10,000 to $24,999 | 6 (17.1%) | 0 (0.0%) |
| $25,000 to $34,999 | 18 (51.4%) | 0 (0.0%) |
| $35,000 to $49,999 | 4 (11.4%) | 0 (0.0%) |
| $50,000 to $74,999 | 0 (0.0%) | 0 (0.0%) |
| $75,000 to $99,999 | 1 (2.9%) | 0 (0.0%) |
| $100,000 to $149,999 | 0 (0.0%) | 0 (0.0%) |
| $150,000 or more | 0 (0.0%) | 0 (0.0%) |
| Total | 35 (100.0%) | 0 (0.0%) |
Property Value to Household Income Ratio in Tonalea
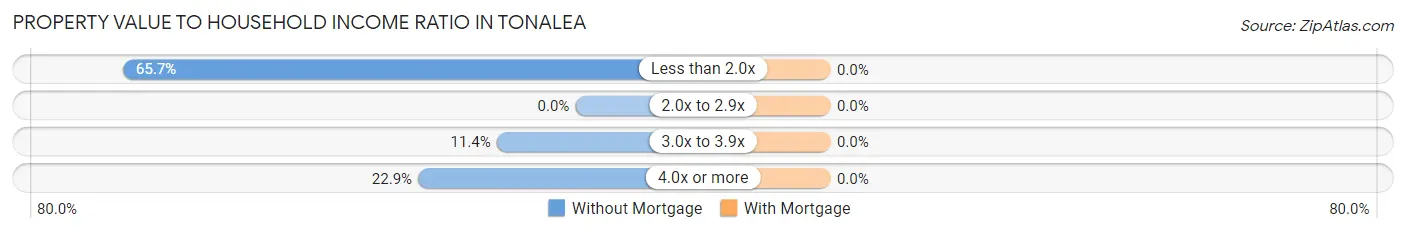
| Value-to-Income Ratio | Without Mortgage | With Mortgage |
| Less than 2.0x | 23 (65.7%) | 0 (0.0%) |
| 2.0x to 2.9x | 0 (0.0%) | 0 (0.0%) |
| 3.0x to 3.9x | 4 (11.4%) | 0 (0.0%) |
| 4.0x or more | 8 (22.9%) | 0 (0.0%) |
| Total | 35 (100.0%) | 0 (0.0%) |
Real Estate Taxes by Mortgage Status in Tonalea
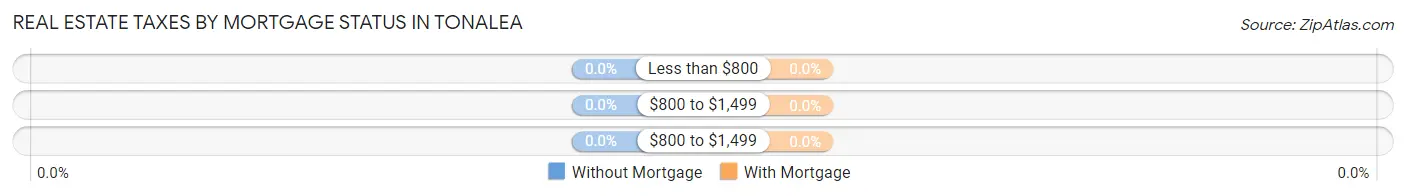
| Property Taxes | Without Mortgage | With Mortgage |
| Less than $800 | 0 (0.0%) | 0 (0.0%) |
| $800 to $1,499 | 0 (0.0%) | 0 (0.0%) |
| $800 to $1,499 | 0 (0.0%) | 0 (0.0%) |
| Total | 35 (100.0%) | 0 (0.0%) |
Health & Disability in Tonalea
Health Insurance Coverage by Age in Tonalea
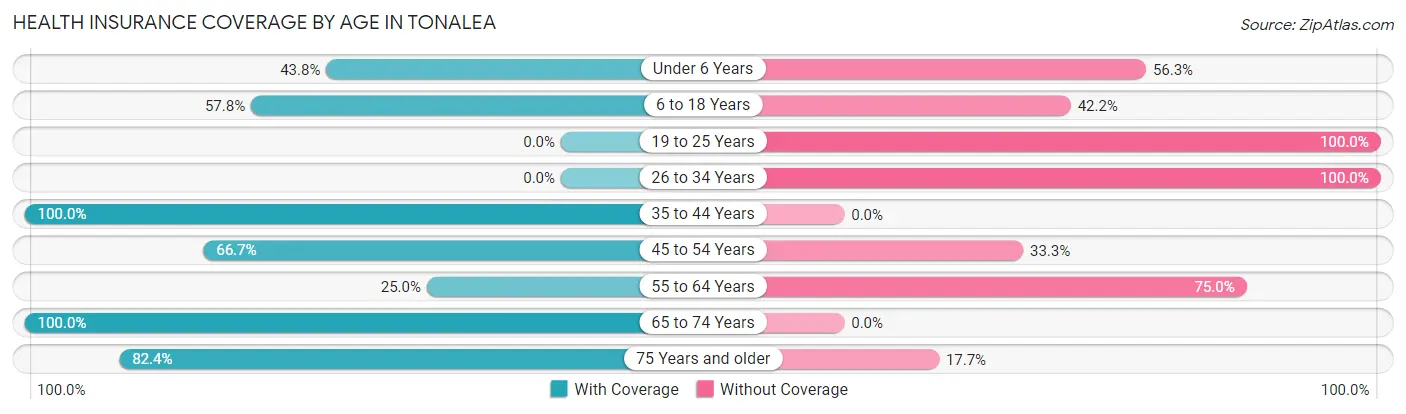
| Age Bracket | With Coverage | Without Coverage |
| Under 6 Years | 7 (43.8%) | 9 (56.2%) |
| 6 to 18 Years | 26 (57.8%) | 19 (42.2%) |
| 19 to 25 Years | 0 (0.0%) | 22 (100.0%) |
| 26 to 34 Years | 0 (0.0%) | 4 (100.0%) |
| 35 to 44 Years | 9 (100.0%) | 0 (0.0%) |
| 45 to 54 Years | 16 (66.7%) | 8 (33.3%) |
| 55 to 64 Years | 6 (25.0%) | 18 (75.0%) |
| 65 to 74 Years | 6 (100.0%) | 0 (0.0%) |
| 75 Years and older | 14 (82.4%) | 3 (17.6%) |
| Total | 84 (50.3%) | 83 (49.7%) |
Health Insurance Coverage by Citizenship Status in Tonalea
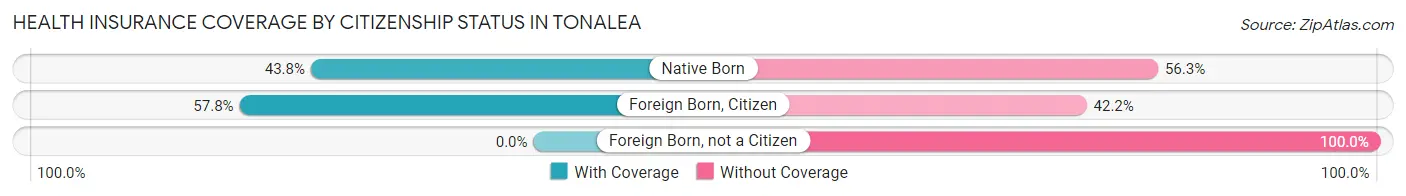
| Citizenship Status | With Coverage | Without Coverage |
| Native Born | 7 (43.8%) | 9 (56.2%) |
| Foreign Born, Citizen | 26 (57.8%) | 19 (42.2%) |
| Foreign Born, not a Citizen | 0 (0.0%) | 22 (100.0%) |
Health Insurance Coverage by Household Income in Tonalea
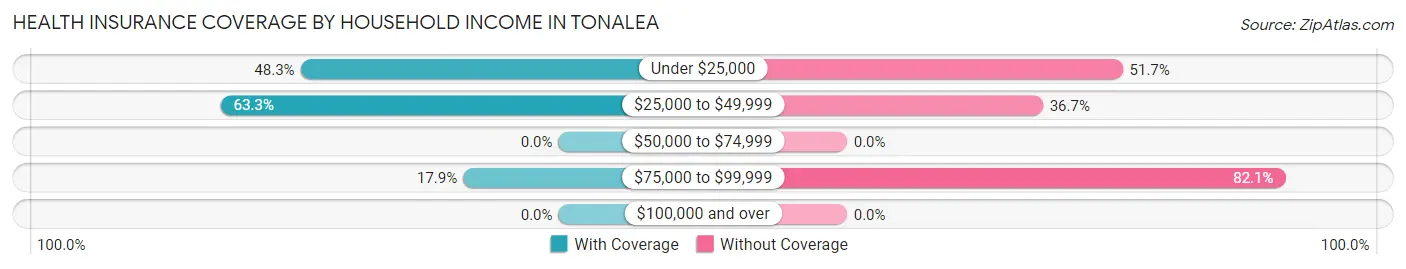
| Household Income | With Coverage | Without Coverage |
| Under $25,000 | 29 (48.3%) | 31 (51.7%) |
| $25,000 to $49,999 | 50 (63.3%) | 29 (36.7%) |
| $50,000 to $74,999 | 0 (0.0%) | 0 (0.0%) |
| $75,000 to $99,999 | 5 (17.9%) | 23 (82.1%) |
| $100,000 and over | 0 (0.0%) | 0 (0.0%) |
Public vs Private Health Insurance Coverage by Age in Tonalea
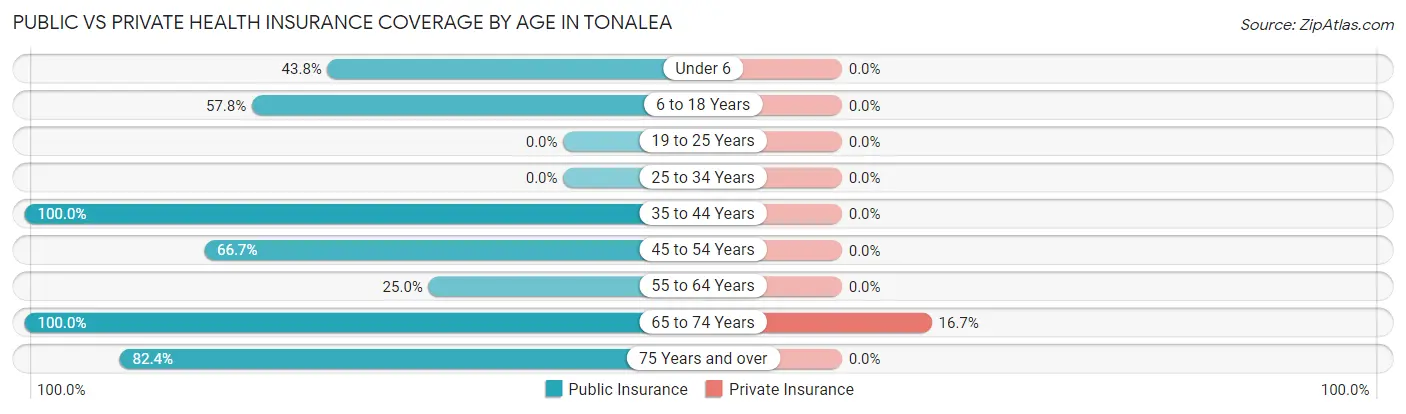
| Age Bracket | Public Insurance | Private Insurance |
| Under 6 | 7 (43.8%) | 0 (0.0%) |
| 6 to 18 Years | 26 (57.8%) | 0 (0.0%) |
| 19 to 25 Years | 0 (0.0%) | 0 (0.0%) |
| 25 to 34 Years | 0 (0.0%) | 0 (0.0%) |
| 35 to 44 Years | 9 (100.0%) | 0 (0.0%) |
| 45 to 54 Years | 16 (66.7%) | 0 (0.0%) |
| 55 to 64 Years | 6 (25.0%) | 0 (0.0%) |
| 65 to 74 Years | 6 (100.0%) | 1 (16.7%) |
| 75 Years and over | 14 (82.4%) | 0 (0.0%) |
| Total | 84 (50.3%) | 1 (0.6%) |
Disability Status by Sex by Age in Tonalea
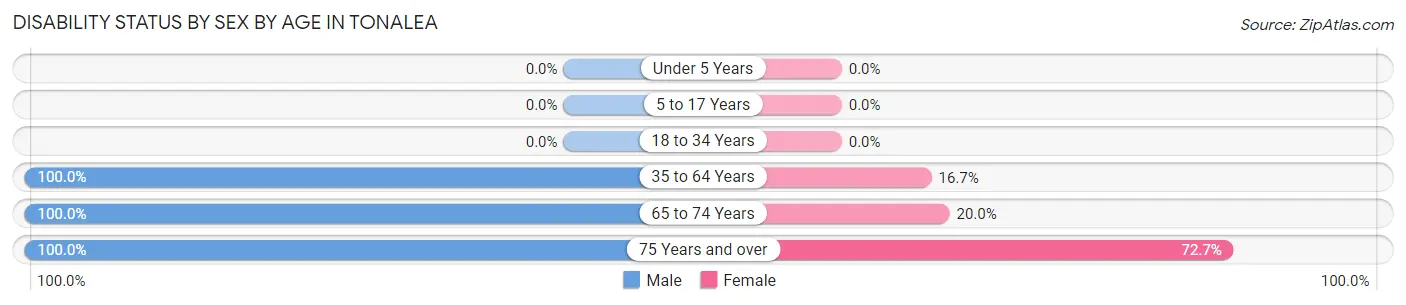
| Age Bracket | Male | Female |
| Under 5 Years | 0 (0.0%) | 0 (0.0%) |
| 5 to 17 Years | 0 (0.0%) | 0 (0.0%) |
| 18 to 34 Years | 0 (0.0%) | 0 (0.0%) |
| 35 to 64 Years | 33 (100.0%) | 4 (16.7%) |
| 65 to 74 Years | 1 (100.0%) | 1 (20.0%) |
| 75 Years and over | 6 (100.0%) | 8 (72.7%) |
Disability Class by Sex by Age in Tonalea
Disability Class: Hearing Difficulty
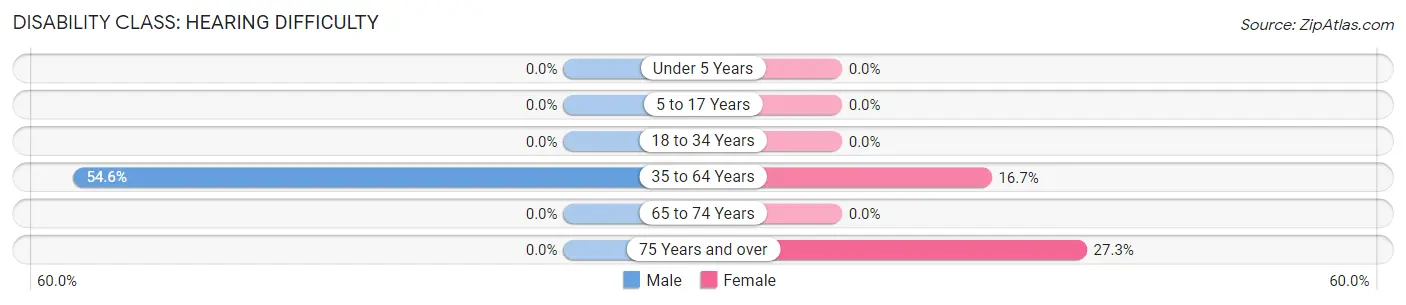
| Age Bracket | Male | Female |
| Under 5 Years | 0 (0.0%) | 0 (0.0%) |
| 5 to 17 Years | 0 (0.0%) | 0 (0.0%) |
| 18 to 34 Years | 0 (0.0%) | 0 (0.0%) |
| 35 to 64 Years | 18 (54.5%) | 4 (16.7%) |
| 65 to 74 Years | 0 (0.0%) | 0 (0.0%) |
| 75 Years and over | 0 (0.0%) | 3 (27.3%) |
Disability Class: Vision Difficulty
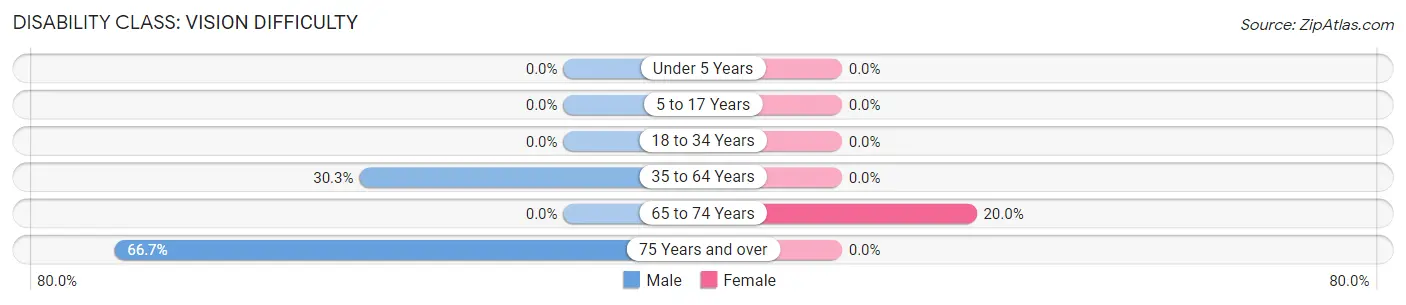
| Age Bracket | Male | Female |
| Under 5 Years | 0 (0.0%) | 0 (0.0%) |
| 5 to 17 Years | 0 (0.0%) | 0 (0.0%) |
| 18 to 34 Years | 0 (0.0%) | 0 (0.0%) |
| 35 to 64 Years | 10 (30.3%) | 0 (0.0%) |
| 65 to 74 Years | 0 (0.0%) | 1 (20.0%) |
| 75 Years and over | 4 (66.7%) | 0 (0.0%) |
Disability Class: Cognitive Difficulty
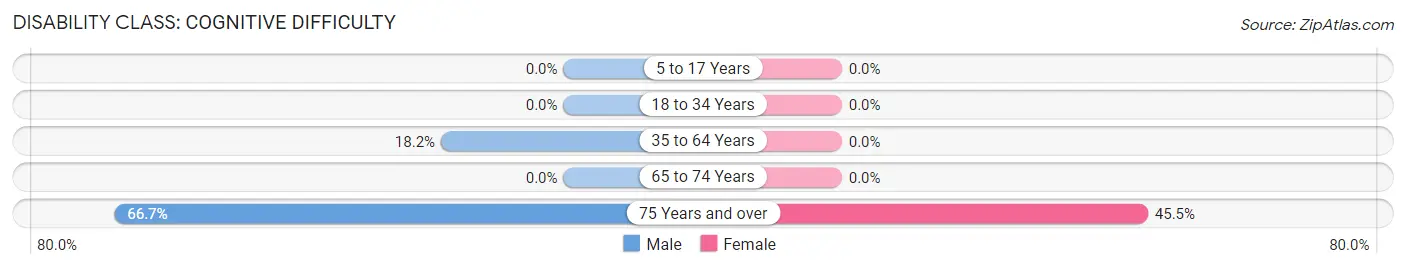
| Age Bracket | Male | Female |
| 5 to 17 Years | 0 (0.0%) | 0 (0.0%) |
| 18 to 34 Years | 0 (0.0%) | 0 (0.0%) |
| 35 to 64 Years | 6 (18.2%) | 0 (0.0%) |
| 65 to 74 Years | 0 (0.0%) | 0 (0.0%) |
| 75 Years and over | 4 (66.7%) | 5 (45.5%) |
Disability Class: Ambulatory Difficulty
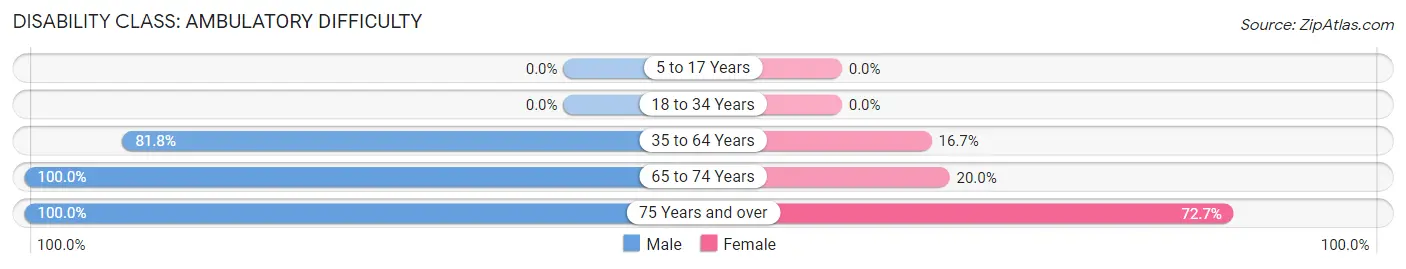
| Age Bracket | Male | Female |
| 5 to 17 Years | 0 (0.0%) | 0 (0.0%) |
| 18 to 34 Years | 0 (0.0%) | 0 (0.0%) |
| 35 to 64 Years | 27 (81.8%) | 4 (16.7%) |
| 65 to 74 Years | 1 (100.0%) | 1 (20.0%) |
| 75 Years and over | 6 (100.0%) | 8 (72.7%) |
Disability Class: Self-Care Difficulty
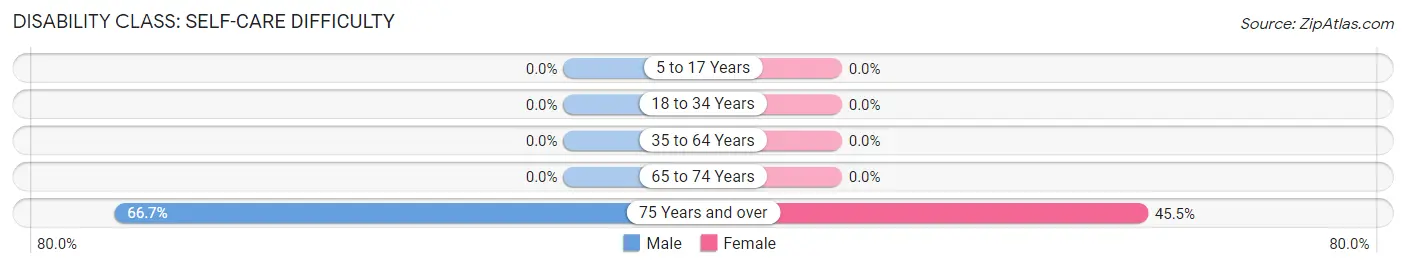
| Age Bracket | Male | Female |
| 5 to 17 Years | 0 (0.0%) | 0 (0.0%) |
| 18 to 34 Years | 0 (0.0%) | 0 (0.0%) |
| 35 to 64 Years | 0 (0.0%) | 0 (0.0%) |
| 65 to 74 Years | 0 (0.0%) | 0 (0.0%) |
| 75 Years and over | 4 (66.7%) | 5 (45.5%) |
Technology Access in Tonalea
Computing Device Access in Tonalea
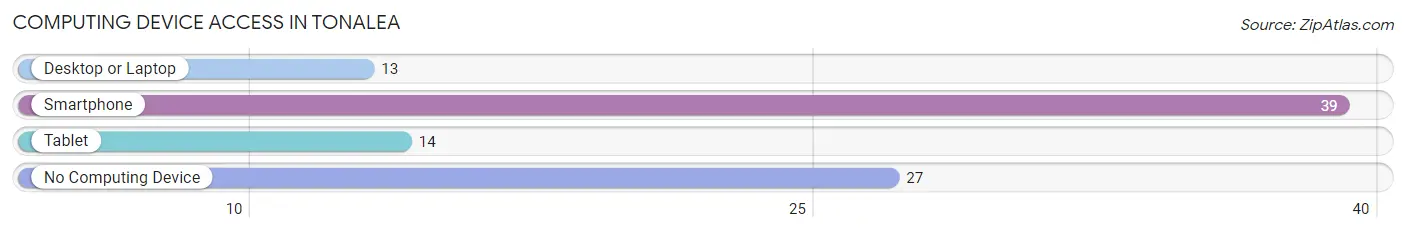
| Device Type | # Households | % Households |
| Desktop or Laptop | 13 | 19.7% |
| Smartphone | 39 | 59.1% |
| Tablet | 14 | 21.2% |
| No Computing Device | 27 | 40.9% |
| Total | 66 | 100.0% |
Internet Access in Tonalea
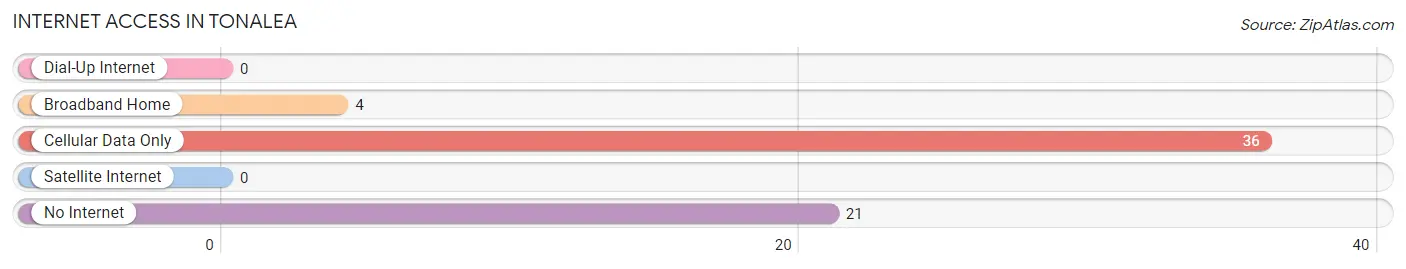
| Internet Type | # Households | % Households |
| Dial-Up Internet | 0 | 0.0% |
| Broadband Home | 4 | 6.1% |
| Cellular Data Only | 36 | 54.5% |
| Satellite Internet | 0 | 0.0% |
| No Internet | 21 | 31.8% |
| Total | 66 | 100.0% |
Tonalea Summary
Tonalea is a small unincorporated community located in the Navajo Nation in Coconino County, Arizona. It is located on the Navajo Reservation, approximately 20 miles east of Tuba City. The population of Tonalea was estimated to be around 500 in 2000.
History
The area that is now Tonalea was originally inhabited by the Anasazi people, who lived in the area from around 1000 to 1300 AD. The Navajo people began to move into the area in the late 1700s, and by the mid-1800s, the area was fully occupied by the Navajo.
The town of Tonalea was established in the early 1900s, when the Navajo Nation began to divide up the land into sections for farming and grazing. The town was named after a nearby spring, which was named after a Navajo chief named Tonalea.
Geography
Tonalea is located in the Navajo Nation, in Coconino County, Arizona. It is situated at an elevation of 5,400 feet, and is located approximately 20 miles east of Tuba City. The town is located in a desert climate, with hot summers and cold winters.
The town is surrounded by the Navajo Nation Reservation, which covers a total area of 27,425 square miles. The reservation is home to a variety of wildlife, including deer, elk, antelope, and bighorn sheep.
Economy
The economy of Tonalea is largely based on agriculture and tourism. The town is home to a number of small farms, which produce a variety of crops, including corn, beans, squash, and melons. The town is also home to a number of tourist attractions, including the Navajo National Monument, which is located nearby.
The town is also home to a number of small businesses, including a grocery store, a gas station, and a few restaurants. The town is also home to a number of art galleries, which feature traditional Navajo art and crafts.
Demographics
As of the 2000 census, the population of Tonalea was estimated to be around 500. The town is predominantly Native American, with the majority of the population being Navajo. The town also has a small Hispanic population, as well as a few non-Native American residents.
The median household income in Tonalea is around $20,000, which is significantly lower than the national average. The town also has a high poverty rate, with around 40% of the population living below the poverty line.
Conclusion
Tonalea is a small unincorporated community located in the Navajo Nation in Coconino County, Arizona. The town has a long history, and is home to a variety of wildlife. The economy of Tonalea is largely based on agriculture and tourism, and the town is predominantly Native American. The median household income in Tonalea is significantly lower than the national average, and the town has a high poverty rate.
Common Questions
What is Per Capita Income in Tonalea?
Per Capita income in Tonalea is $8,741.
What is the Median Family Income in Tonalea?
Median Family Income in Tonalea is $31,528.
What is the Median Household income in Tonalea?
Median Household Income in Tonalea is $30,972.
What is Inequality or Gini Index in Tonalea?
Inequality or Gini Index in Tonalea is 0.35.
What is the Total Population of Tonalea?
Total Population of Tonalea is 167.
What is the Total Male Population of Tonalea?
Total Male Population of Tonalea is 90.
What is the Total Female Population of Tonalea?
Total Female Population of Tonalea is 77.
What is the Ratio of Males per 100 Females in Tonalea?
There are 116.88 Males per 100 Females in Tonalea.
What is the Ratio of Females per 100 Males in Tonalea?
There are 85.56 Females per 100 Males in Tonalea.
What is the Median Population Age in Tonalea?
Median Population Age in Tonalea is 27.1 Years.
What is the Average Family Size in Tonalea
Average Family Size in Tonalea is 2.7 People.
What is the Average Household Size in Tonalea
Average Household Size in Tonalea is 2.5 People.
How Large is the Labor Force in Tonalea?
There are 32 People in the Labor Forcein in Tonalea.
What is the Percentage of People in the Labor Force in Tonalea?
26.9% of People are in the Labor Force in Tonalea.
What is the Unemployment Rate in Tonalea?
Unemployment Rate in Tonalea is 12.5%.