Zip Codes with the Highest Poverty Level Among Children Under the Age of 5 in Phoenix, AZ

RELATED REPORTS & OPTIONS

Highest Poverty | Child 0-5
Population
Families and Households
Female Fertility
Female Fertility (Unmarried)
Race (Community Size)
Race (Percentage)
Ancestry (Community Size)
AfghanAfricanAlaska NativeAlaskan AthabascanAlbanianAmericanApacheArabArgentineanArmenianAssyrian / Chaldean / SyriacAustralianAustrianBahamianBangladeshiBarbadianBasqueBelgianBelizeanBhutaneseBlackfeetBolivianBrazilianBritishBritish West IndianBulgarianBurmeseCajunCanadianCape VerdeanCarpatho RusynCelticCentral AmericanCentral American IndianCherokeeCheyenneChickasawChileanChippewaChoctawColombianColvilleComancheCosta RicanCreeCreekCroatianCubanCypriotCzechCzechoslovakianDanishDelawareDominicanDutchEastern EuropeanEcuadorianEgyptianEnglishEstonianEthiopianEuropeanFijianFilipinoFinnishFrenchFrench American IndianFrench CanadianGermanGerman RussianGhanaianGreekGuamanian / ChamorroGuatemalanGuyaneseHaitianHonduranHopiHungarianIcelanderIndian (Asian)IndonesianInupiatIranianIraqiIrishIroquoisIsraeliItalianJamaicanJapaneseJordanianKenyanKiowaKoreanLaotianLatvianLebaneseLiberianLithuanianLuxembourgerMacedonianMalaysianMalteseMexicanMexican American IndianMongolianMoroccanNative HawaiianNavajoNew ZealanderNicaraguanNigerianNorthern EuropeanNorwegianOsagePaiutePakistaniPalestinianPanamanianParaguayanPennsylvania GermanPeruvianPimaPolishPortuguesePotawatomiPuebloPuerto RicanPuget Sound SalishRomanianRussianSalvadoranSamoanScandinavianScotch-IrishScottishSeminoleSenegaleseSerbianShoshoneSierra LeoneanSiouxSlavicSlovakSloveneSomaliSouth AfricanSouth AmericanSouth American IndianSoviet UnionSpaniardSpanishSpanish AmericanSpanish American IndianSri LankanSubsaharan AfricanSudaneseSwedishSwissSyrianThaiTlingit-HaidaTohono O'OdhamTonganTrinidadian and TobagonianTurkishUgandanUkrainianUruguayanUteVenezuelanVietnameseWelshWest IndianYakamaYaquiYugoslavianYumanZimbabwean
Ancestry (Percentage)
AfghanAfricanAlaska NativeAlaskan AthabascanAlbanianAmericanApacheArabArgentineanArmenianAssyrian / Chaldean / SyriacAustralianAustrianBahamianBangladeshiBarbadianBasqueBelgianBelizeanBhutaneseBlackfeetBolivianBrazilianBritishBritish West IndianBulgarianBurmeseCajunCanadianCape VerdeanCarpatho RusynCelticCentral AmericanCentral American IndianCherokeeCheyenneChickasawChileanChippewaChoctawColombianColvilleComancheCosta RicanCreeCreekCroatianCubanCypriotCzechCzechoslovakianDanishDelawareDominicanDutchEastern EuropeanEcuadorianEgyptianEnglishEstonianEthiopianEuropeanFijianFilipinoFinnishFrenchFrench American IndianFrench CanadianGermanGerman RussianGhanaianGreekGuamanian / ChamorroGuatemalanGuyaneseHaitianHonduranHopiHungarianIcelanderIndian (Asian)IndonesianInupiatIranianIraqiIrishIroquoisIsraeliItalianJamaicanJapaneseJordanianKenyanKiowaKoreanLaotianLatvianLebaneseLiberianLithuanianLuxembourgerMacedonianMalaysianMalteseMexicanMexican American IndianMongolianMoroccanNative HawaiianNavajoNew ZealanderNicaraguanNigerianNorthern EuropeanNorwegianOsagePaiutePakistaniPalestinianPanamanianParaguayanPennsylvania GermanPeruvianPimaPolishPortuguesePotawatomiPuebloPuerto RicanPuget Sound SalishRomanianRussianSalvadoranSamoanScandinavianScotch-IrishScottishSeminoleSenegaleseSerbianShoshoneSierra LeoneanSiouxSlavicSlovakSloveneSomaliSouth AfricanSouth AmericanSouth American IndianSoviet UnionSpaniardSpanishSpanish AmericanSpanish American IndianSri LankanSubsaharan AfricanSudaneseSwedishSwissSyrianThaiTlingit-HaidaTohono O'OdhamTonganTrinidadian and TobagonianTurkishUgandanUkrainianUruguayanUteVenezuelanVietnameseWelshWest IndianYakamaYaquiYugoslavianYumanZimbabwean
Immigrant Origin (Total)
AfghanistanAfricaAlbaniaArgentinaArmeniaAsiaAustraliaAustriaBahamasBangladeshBarbadosBelarusBelgiumBelizeBoliviaBosnia and HerzegovinaBrazilBulgariaBurma / MyanmarCambodiaCameroonCanadaCaribbeanCentral AmericaChileChinaColombiaCongoCosta RicaCroatiaCubaCzechoslovakiaDenmarkDominicaDominican RepublicEastern AfricaEastern AsiaEastern EuropeEcuadorEgyptEl SalvadorEnglandEritreaEthiopiaEuropeFranceGermanyGhanaGreeceGuatemalaGuyanaHaitiHondurasHong KongHungaryIndiaIndonesiaIranIraqIrelandIsraelItalyJamaicaJapanJordanKazakhstanKenyaKoreaKuwaitLaosLatin AmericaLebanonLiberiaLithuaniaMalaysiaMexicoMicronesiaMiddle AfricaMoldovaMoroccoNepalNetherlandsNicaraguaNigeriaNorthern AfricaNorthern EuropeNorwayOceaniaPakistanPanamaPeruPhilippinesPolandPortugalRomaniaRussiaSaudi ArabiaScotlandSerbiaSierra LeoneSingaporeSomaliaSouth AfricaSouth AmericaSouth Central AsiaSouth Eastern AsiaSouthern EuropeSpainSri LankaSudanSwedenSwitzerlandSyriaTaiwanThailandTrinidad and TobagoTurkeyUgandaUkraineUruguayUzbekistanVenezuelaVietnamWestern AfricaWestern AsiaWestern EuropeZaireZimbabwe
Immigrant Origin (Percentage)
AfghanistanAfricaAlbaniaArgentinaArmeniaAsiaAustraliaAustriaBahamasBangladeshBarbadosBelarusBelgiumBelizeBoliviaBosnia and HerzegovinaBrazilBulgariaBurma / MyanmarCambodiaCameroonCanadaCaribbeanCentral AmericaChileChinaColombiaCongoCosta RicaCroatiaCubaCzechoslovakiaDenmarkDominicaDominican RepublicEastern AfricaEastern AsiaEastern EuropeEcuadorEgyptEl SalvadorEnglandEritreaEthiopiaEuropeFranceGermanyGhanaGreeceGuatemalaGuyanaHaitiHondurasHong KongHungaryIndiaIndonesiaIranIraqIrelandIsraelItalyJamaicaJapanJordanKazakhstanKenyaKoreaKuwaitLaosLatin AmericaLebanonLiberiaLithuaniaMalaysiaMexicoMicronesiaMiddle AfricaMoldovaMoroccoNepalNetherlandsNicaraguaNigeriaNorthern AfricaNorthern EuropeNorwayOceaniaPakistanPanamaPeruPhilippinesPolandPortugalRomaniaRussiaSaudi ArabiaScotlandSerbiaSierra LeoneSingaporeSomaliaSouth AfricaSouth AmericaSouth Central AsiaSouth Eastern AsiaSouthern EuropeSpainSri LankaSudanSwedenSwitzerlandSyriaTaiwanThailandTrinidad and TobagoTurkeyUgandaUkraineUruguayUzbekistanVenezuelaVietnamWestern AfricaWestern AsiaWestern EuropeZaireZimbabwe
Income
Income (Families)
Income (Households)
Poverty
Poverty (Families)
Unemployment
Employment Occupations
Employment Industries
Employer Class
Commute Time
Commute Means
School Enrollment
Education by Degree Field
Occupancy
Finances
Physical Characteristics
Phoenix
Compare Zip Codes
Comparison Subject

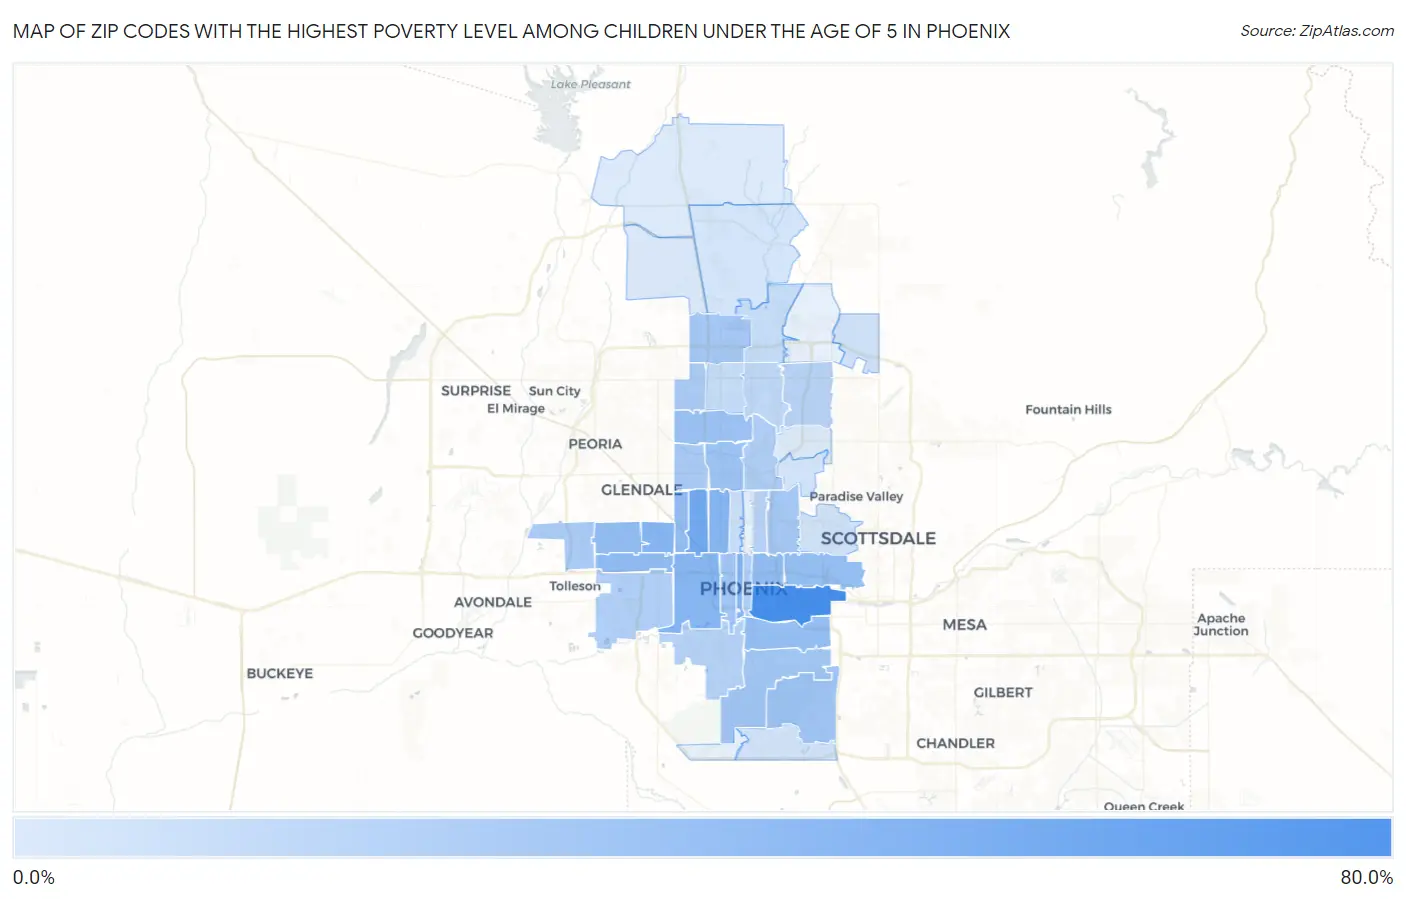
Map of Zip Codes with the Highest Poverty Level Among Children Under the Age of 5 in Phoenix

0.0%
80.0%
Zip Codes with the Highest Poverty Level Among Children Under the Age of 5 in Phoenix Map

Zip Codes with the Highest Poverty Level Among Children Under the Age of 5 in Phoenix, AZ

Zip Code Child Poverty vs State vs National
1.8503474.5%19.3%(+55.2)#1518.1%(+56.5)#985
2.8501748.7%19.3%(+29.4)#4718.1%(+30.7)#2,727
3.8500338.7%19.3%(+19.4)#6318.1%(+20.7)#4,260
4.8500938.2%19.3%(+18.9)#6618.1%(+20.2)#4,362
5.8501537.7%19.3%(+18.4)#6918.1%(+19.7)#4,455
6.8503137.3%19.3%(+18.0)#7018.1%(+19.2)#4,537
7.8503533.0%19.3%(+13.7)#8618.1%(+15.0)#5,580
8.8500632.5%19.3%(+13.2)#8818.1%(+14.5)#5,716
9.8501932.4%19.3%(+13.1)#8918.1%(+14.3)#5,745
10.8503331.5%19.3%(+12.2)#9218.1%(+13.4)#5,961
11.8500831.1%19.3%(+11.8)#9518.1%(+13.0)#6,060
12.8504030.6%19.3%(+11.3)#9618.1%(+12.5)#6,199
13.8502927.2%19.3%(+7.93)#11518.1%(+9.17)#7,238
14.8502126.5%19.3%(+7.23)#11818.1%(+8.47)#7,468
15.8504425.5%19.3%(+6.22)#12418.1%(+7.46)#7,813
16.8500725.5%19.3%(+6.18)#12518.1%(+7.42)#7,827
17.8504224.5%19.3%(+5.18)#13018.1%(+6.42)#8,182
18.8501623.3%19.3%(+3.99)#13918.1%(+5.22)#8,652
19.8502723.2%19.3%(+3.86)#14018.1%(+5.10)#8,703
20.8505321.5%19.3%(+2.21)#15018.1%(+3.44)#9,379
21.8503720.9%19.3%(+1.61)#15418.1%(+2.85)#9,634
22.8505120.8%19.3%(+1.47)#15518.1%(+2.71)#9,692
23.8502019.7%19.3%(+0.411)#15818.1%(+1.65)#10,176
24.8500419.6%19.3%(+0.337)#16018.1%(+1.57)#10,209
25.8504318.0%19.3%(-1.35)#16518.1%(-0.109)#10,979
26.8504116.4%19.3%(-2.90)#17418.1%(-1.66)#11,691
27.8503215.0%19.3%(-4.34)#18518.1%(-3.10)#12,488
28.8501414.8%19.3%(-4.48)#18718.1%(-3.24)#12,562
29.8502212.1%19.3%(-7.21)#21218.1%(-5.97)#14,151
30.850249.8%19.3%(-9.49)#23018.1%(-8.26)#15,531
31.850239.2%19.3%(-10.1)#23318.1%(-8.90)#15,946
32.850137.7%19.3%(-11.6)#24818.1%(-10.4)#16,963
33.850545.8%19.3%(-13.5)#26318.1%(-12.3)#18,234
34.850185.4%19.3%(-13.9)#26618.1%(-12.6)#18,483
35.850484.6%19.3%(-14.7)#27518.1%(-13.5)#19,047
36.850853.7%19.3%(-15.6)#28418.1%(-14.3)#19,688
37.850832.7%19.3%(-16.6)#29118.1%(-15.4)#20,402
38.850860.95%19.3%(-18.4)#30018.1%(-17.1)#21,418
39.850280.65%19.3%(-18.7)#30218.1%(-17.4)#21,561

Common Questions

What are the Top 10 Zip Codes with the Highest Poverty Level Among Children Under the Age of 5 in Phoenix, AZ?
Top 10 Zip Codes with the Highest Poverty Level Among Children Under the Age of 5 in Phoenix, AZ are:
#1
74.5%
#2
48.7%
#3
38.7%
#4
38.2%
#5
37.7%
#6
37.3%
#7
33.0%
#8
32.5%
#9
32.4%
#10
31.5%
What zip code has the Highest Poverty Level Among Children Under the Age of 5 in Phoenix, AZ?
85034 has the Highest Poverty Level Among Children Under the Age of 5 in Phoenix, AZ with 74.5%.
What is the Poverty Level Among Children Under the Age of 5 in Phoenix, AZ?
Poverty Level Among Children Under the Age of 5 in Phoenix is 21.0%.
What is the Poverty Level Among Children Under the Age of 5 in Arizona?
Poverty Level Among Children Under the Age of 5 in Arizona is 19.3%.
What is the Poverty Level Among Children Under the Age of 5 in the United States?
Poverty Level Among Children Under the Age of 5 in the United States is 18.1%.