Hard Rock, AZ Map & Demographics
Hard Rock Map
Hard Rock Overview
$7,080
PER CAPITA INCOME
0.53
INEQUALITY / GINI INDEX
118
TOTAL POPULATION
61
MALE POPULATION
57
FEMALE POPULATION
107.02
MALES / 100 FEMALES
93.44
FEMALES / 100 MALES
26.8
MEDIAN AGE
7.2
AVG FAMILY SIZE
4.7
AVG HOUSEHOLD SIZE
11
LABOR FORCE [ PEOPLE ]
12.1%
PERCENT IN LABOR FORCE
18.2%
UNEMPLOYMENT RATE
Income in Hard Rock
Income Overview in Hard Rock
| Characteristic | Number | Measure |
| Per Capita Income | 118 | $7,080 |
| Median Family Income | 15 | $0 |
| Mean Family Income | 15 | $30,193 |
| Median Household Income | 25 | $0 |
| Mean Household Income | 25 | $34,720 |
| Income Deficit | 15 | $0 |
| Wage / Income Gap (%) | 118 | 0.00% |
| Wage / Income Gap ($) | 118 | 100.00¢ per $1 |
| Gini / Inequality Index | 118 | 0.53 |
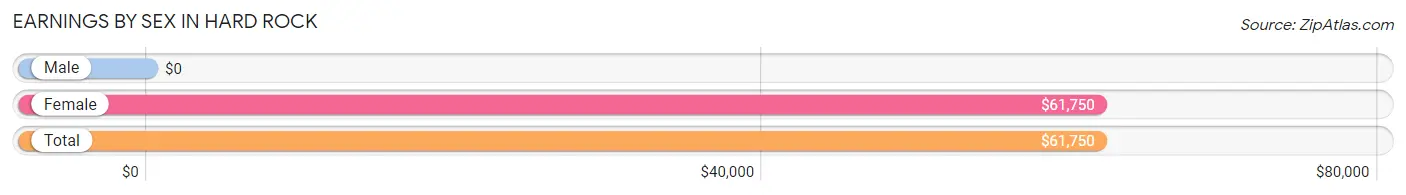
Earnings by Sex in Hard Rock
| Sex | Number | Average Earnings |
| Male | 0 (0.0%) | $0 |
| Female | 11 (100.0%) | $61,750 |
| Total | 11 (100.0%) | $61,750 |
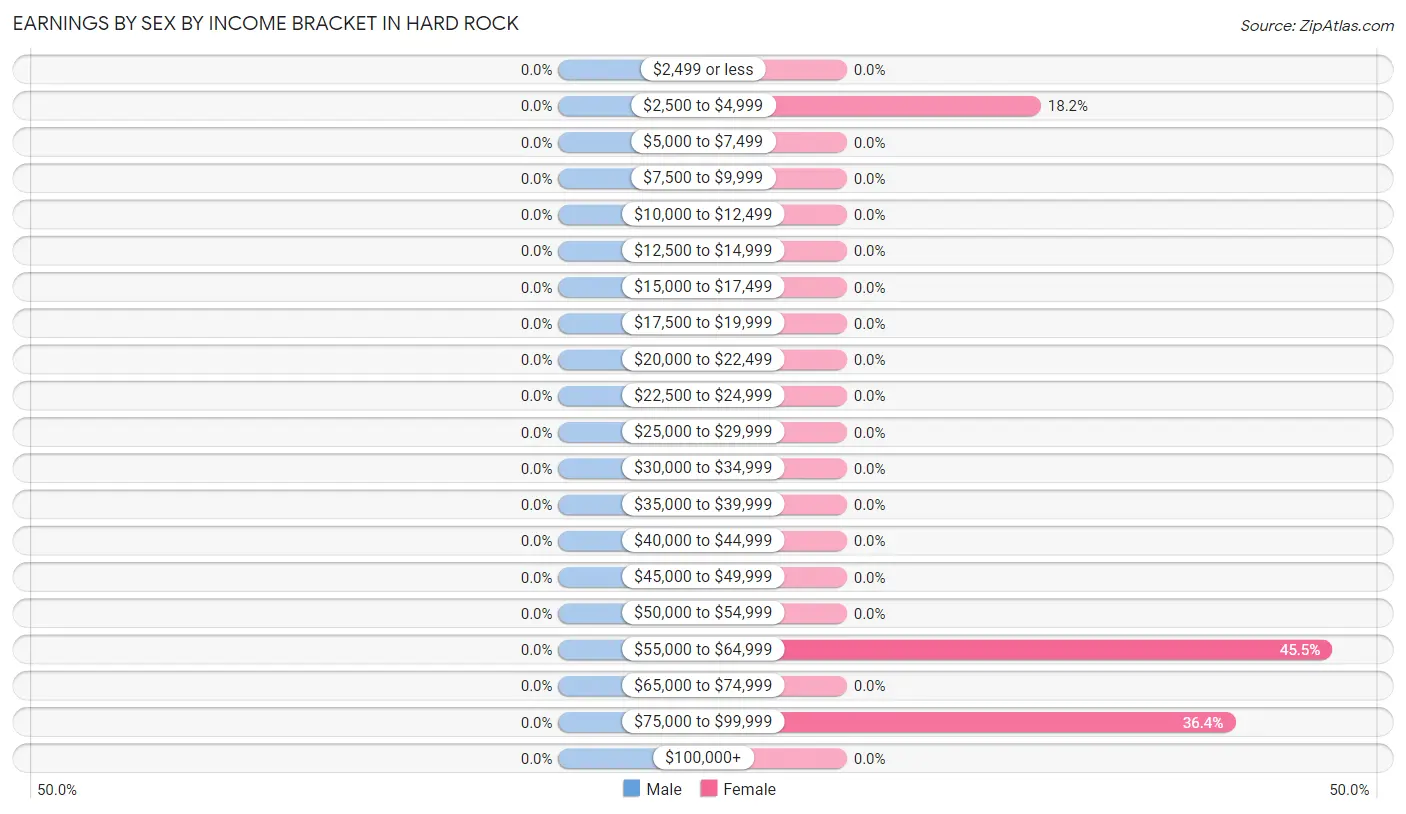
Earnings by Sex by Income Bracket in Hard Rock
| Income | Male | Female |
| $2,499 or less | 0 (0.0%) | 0 (0.0%) |
| $2,500 to $4,999 | 0 (0.0%) | 2 (18.2%) |
| $5,000 to $7,499 | 0 (0.0%) | 0 (0.0%) |
| $7,500 to $9,999 | 0 (0.0%) | 0 (0.0%) |
| $10,000 to $12,499 | 0 (0.0%) | 0 (0.0%) |
| $12,500 to $14,999 | 0 (0.0%) | 0 (0.0%) |
| $15,000 to $17,499 | 0 (0.0%) | 0 (0.0%) |
| $17,500 to $19,999 | 0 (0.0%) | 0 (0.0%) |
| $20,000 to $22,499 | 0 (0.0%) | 0 (0.0%) |
| $22,500 to $24,999 | 0 (0.0%) | 0 (0.0%) |
| $25,000 to $29,999 | 0 (0.0%) | 0 (0.0%) |
| $30,000 to $34,999 | 0 (0.0%) | 0 (0.0%) |
| $35,000 to $39,999 | 0 (0.0%) | 0 (0.0%) |
| $40,000 to $44,999 | 0 (0.0%) | 0 (0.0%) |
| $45,000 to $49,999 | 0 (0.0%) | 0 (0.0%) |
| $50,000 to $54,999 | 0 (0.0%) | 0 (0.0%) |
| $55,000 to $64,999 | 0 (0.0%) | 5 (45.5%) |
| $65,000 to $74,999 | 0 (0.0%) | 0 (0.0%) |
| $75,000 to $99,999 | 0 (0.0%) | 4 (36.4%) |
| $100,000+ | 0 (0.0%) | 0 (0.0%) |
| Total | 0 (0.0%) | 11 (100.0%) |
Earnings by Sex by Educational Attainment in Hard Rock
| Educational Attainment | Male Income | Female Income |
| Less than High School | - | - |
| High School Diploma | - | - |
| College or Associate's Degree | - | - |
| Bachelor's Degree | - | - |
| Graduate Degree | - | - |
| Total | - | - |
Family Income in Hard Rock
Family Income Brackets in Hard Rock
According to the Hard Rock family income data, there are 8 families falling into the less than $10,000 income range, which is the most common income bracket and makes up 53.3% of all families.
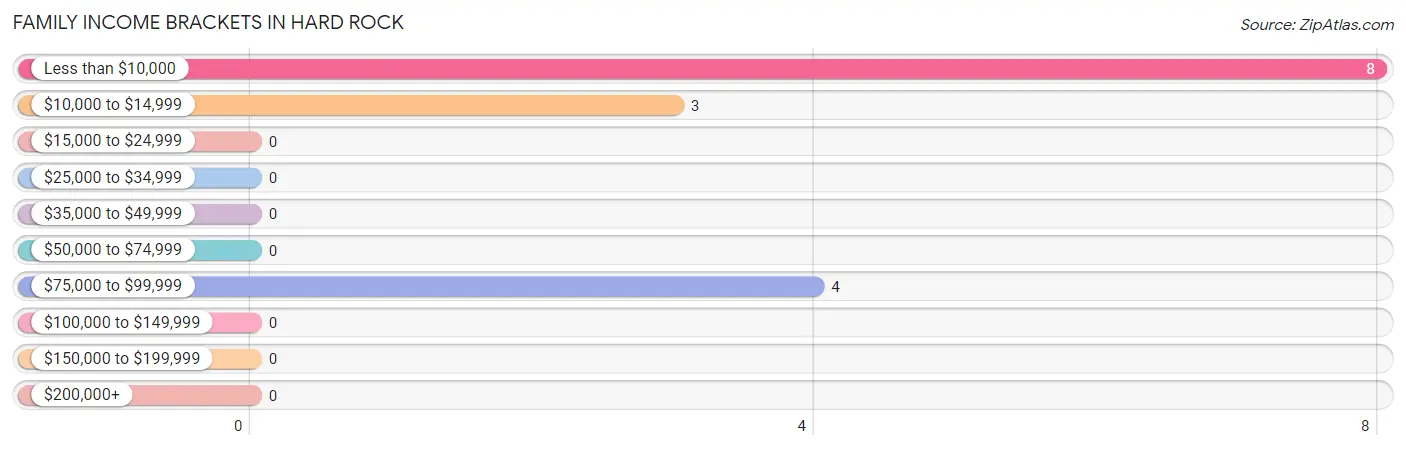
| Income Bracket | # Families | % Families |
| Less than $10,000 | 8 | 53.3% |
| $10,000 to $14,999 | 3 | 20.0% |
| $15,000 to $24,999 | 0 | 0.0% |
| $25,000 to $34,999 | 0 | 0.0% |
| $35,000 to $49,999 | 0 | 0.0% |
| $50,000 to $74,999 | 0 | 0.0% |
| $75,000 to $99,999 | 4 | 26.7% |
| $100,000 to $149,999 | 0 | 0.0% |
| $150,000 to $199,999 | 0 | 0.0% |
| $200,000+ | 0 | 0.0% |
Family Income by Famaliy Size in Hard Rock
| Income Bracket | # Families | Median Income |
| 2-Person Families | 0 (0.0%) | $0 |
| 3-Person Families | 3 (20.0%) | $0 |
| 4-Person Families | 4 (26.7%) | $0 |
| 5-Person Families | 0 (0.0%) | $0 |
| 6-Person Families | 0 (0.0%) | $0 |
| 7+ Person Families | 8 (53.3%) | $0 |
| Total | 15 (100.0%) | $0 |
Family Income by Number of Earners in Hard Rock
| Number of Earners | # Families | Median Income |
| No Earners | 8 (53.3%) | $0 |
| 1 Earner | 7 (46.7%) | $0 |
| 2 Earners | 0 (0.0%) | $0 |
| 3+ Earners | 0 (0.0%) | $0 |
| Total | 15 (100.0%) | $0 |
Household Income in Hard Rock
Household Income Brackets in Hard Rock
With 13 households falling in the category, the less than $10,000 income range is the most frequent in Hard Rock, accounting for 52.0% of all households.
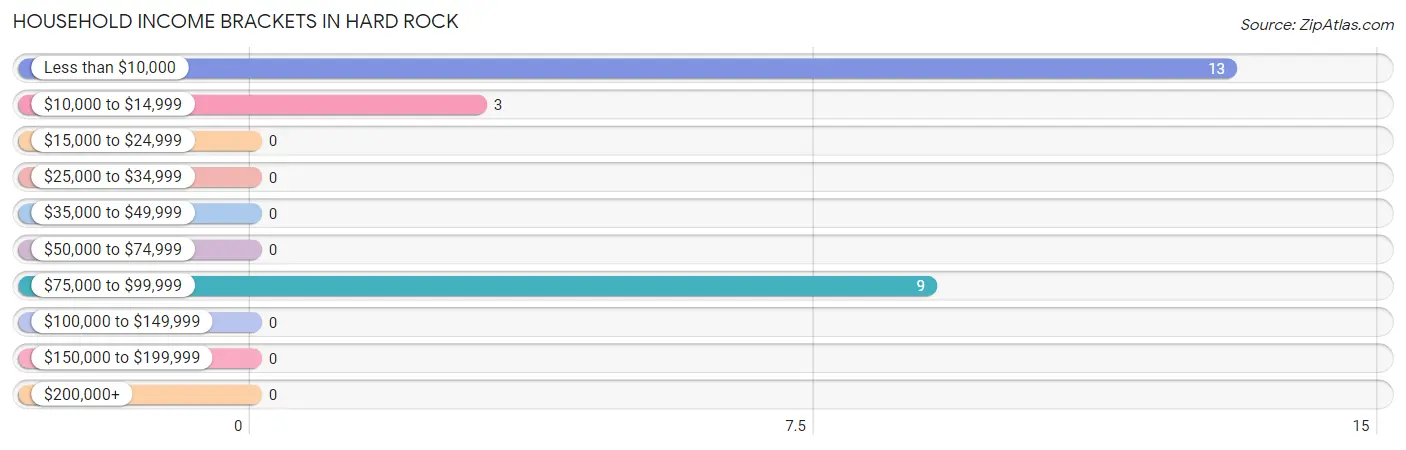
| Income Bracket | # Households | % Households |
| Less than $10,000 | 13 | 52.0% |
| $10,000 to $14,999 | 3 | 12.0% |
| $15,000 to $24,999 | 0 | 0.0% |
| $25,000 to $34,999 | 0 | 0.0% |
| $35,000 to $49,999 | 0 | 0.0% |
| $50,000 to $74,999 | 0 | 0.0% |
| $75,000 to $99,999 | 9 | 36.0% |
| $100,000 to $149,999 | 0 | 0.0% |
| $150,000 to $199,999 | 0 | 0.0% |
| $200,000+ | 0 | 0.0% |
Household Income by Householder Age in Hard Rock
| Income Bracket | # Households | Median Income |
| 15 to 24 Years | 0 (0.0%) | $0 |
| 25 to 44 Years | 5 (20.0%) | $0 |
| 45 to 64 Years | 17 (68.0%) | $0 |
| 65+ Years | 3 (12.0%) | $0 |
| Total | 25 (100.0%) | $0 |
Poverty in Hard Rock
Income Below Poverty by Sex and Age in Hard Rock
With 73.8% poverty level for males and 84.2% for females among the residents of Hard Rock, under 5 year old males and under 5 year old females are the most vulnerable to poverty, with 3 males (100.0%) and 2 females (100.0%) in their respective age groups living below the poverty level.
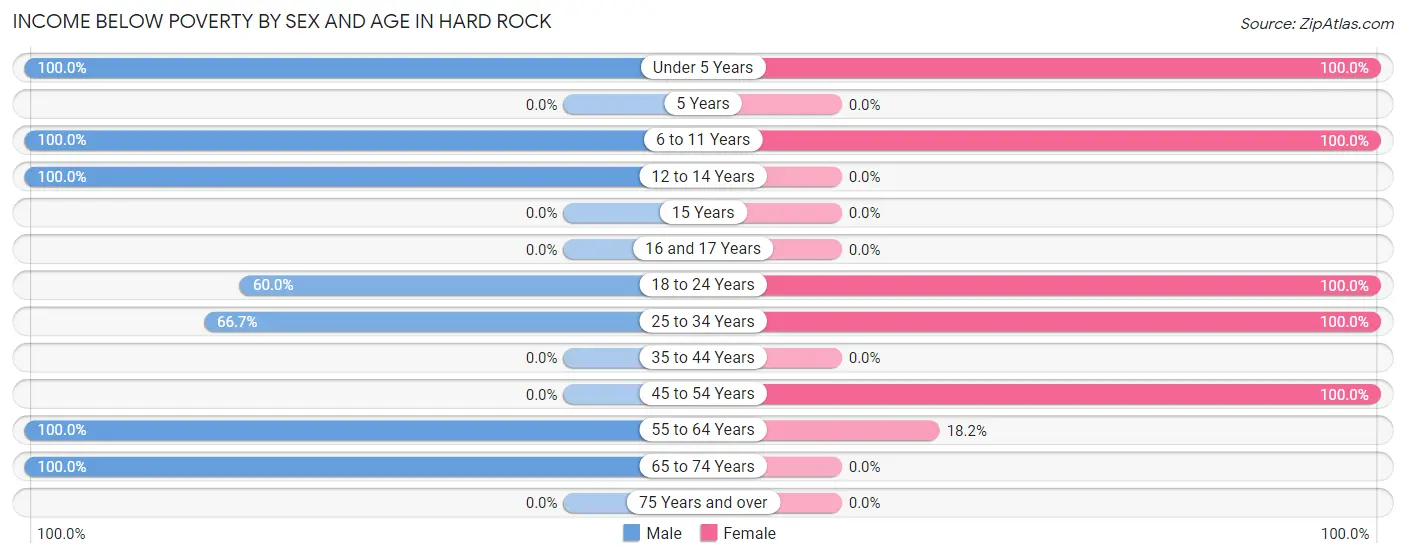
| Age Bracket | Male | Female |
| Under 5 Years | 3 (100.0%) | 2 (100.0%) |
| 5 Years | 0 (0.0%) | 0 (0.0%) |
| 6 to 11 Years | 6 (100.0%) | 12 (100.0%) |
| 12 to 14 Years | 4 (100.0%) | 0 (0.0%) |
| 15 Years | 0 (0.0%) | 0 (0.0%) |
| 16 and 17 Years | 0 (0.0%) | 0 (0.0%) |
| 18 to 24 Years | 9 (60.0%) | 7 (100.0%) |
| 25 to 34 Years | 12 (66.7%) | 17 (100.0%) |
| 35 to 44 Years | 0 (0.0%) | 0 (0.0%) |
| 45 to 54 Years | 0 (0.0%) | 8 (100.0%) |
| 55 to 64 Years | 8 (100.0%) | 2 (18.2%) |
| 65 to 74 Years | 3 (100.0%) | 0 (0.0%) |
| 75 Years and over | 0 (0.0%) | 0 (0.0%) |
| Total | 45 (73.8%) | 48 (84.2%) |
Income Above Poverty by Sex and Age in Hard Rock
According to the poverty statistics in Hard Rock, males aged 45 to 54 years and females aged 55 to 64 years are the age groups that are most secure financially, with 100.0% of males and 81.8% of females in these age groups living above the poverty line.
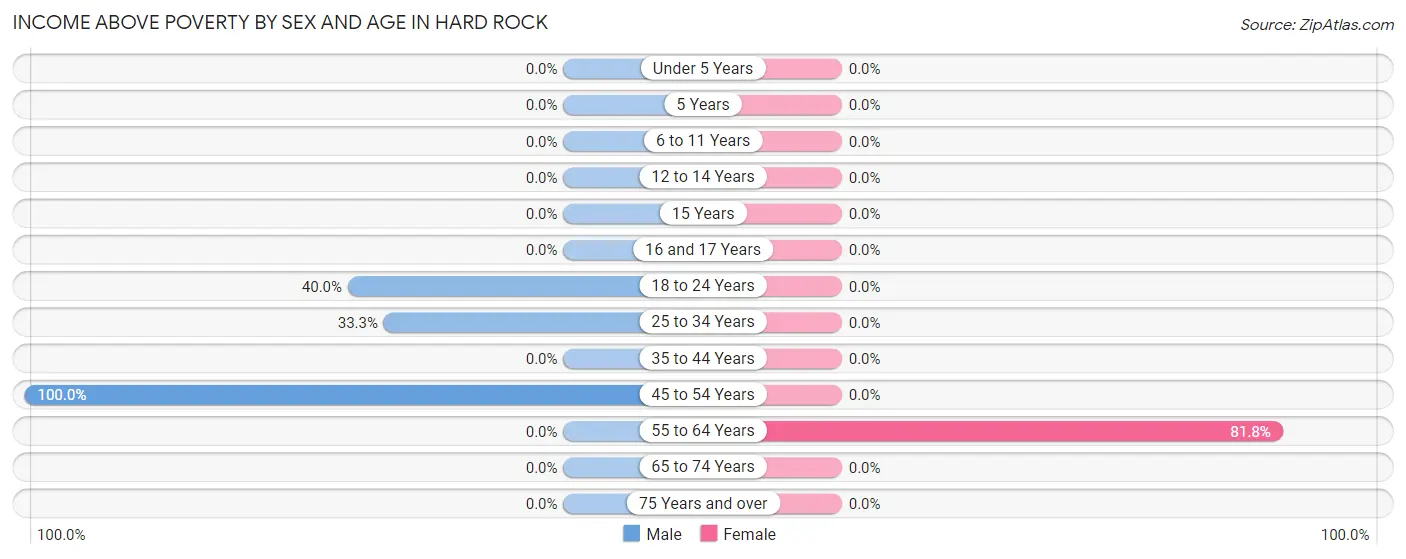
| Age Bracket | Male | Female |
| Under 5 Years | 0 (0.0%) | 0 (0.0%) |
| 5 Years | 0 (0.0%) | 0 (0.0%) |
| 6 to 11 Years | 0 (0.0%) | 0 (0.0%) |
| 12 to 14 Years | 0 (0.0%) | 0 (0.0%) |
| 15 Years | 0 (0.0%) | 0 (0.0%) |
| 16 and 17 Years | 0 (0.0%) | 0 (0.0%) |
| 18 to 24 Years | 6 (40.0%) | 0 (0.0%) |
| 25 to 34 Years | 6 (33.3%) | 0 (0.0%) |
| 35 to 44 Years | 0 (0.0%) | 0 (0.0%) |
| 45 to 54 Years | 4 (100.0%) | 0 (0.0%) |
| 55 to 64 Years | 0 (0.0%) | 9 (81.8%) |
| 65 to 74 Years | 0 (0.0%) | 0 (0.0%) |
| 75 Years and over | 0 (0.0%) | 0 (0.0%) |
| Total | 16 (26.2%) | 9 (15.8%) |
Income Below Poverty Among Married-Couple Families in Hard Rock
The poverty statistics for married-couple families in Hard Rock show that 100.0% or 8 of the total 8 families live below the poverty line. Families with 5 or more children have the highest poverty rate of 100.0%, comprising of 8 families. On the other hand, families with 5 or more children have the lowest poverty rate of 100.0%, which includes 8 families.
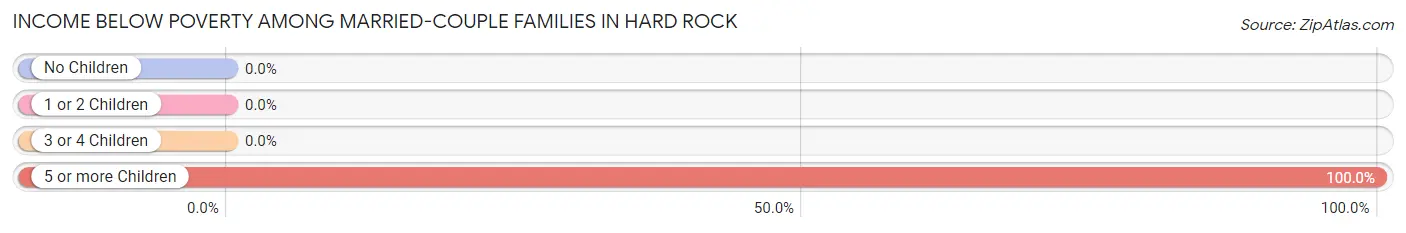
| Children | Above Poverty | Below Poverty |
| No Children | 0 (0.0%) | 0 (0.0%) |
| 1 or 2 Children | 0 (0.0%) | 0 (0.0%) |
| 3 or 4 Children | 0 (0.0%) | 0 (0.0%) |
| 5 or more Children | 0 (0.0%) | 8 (100.0%) |
| Total | 0 (0.0%) | 8 (100.0%) |
Income Below Poverty Among Single-Parent Households in Hard Rock
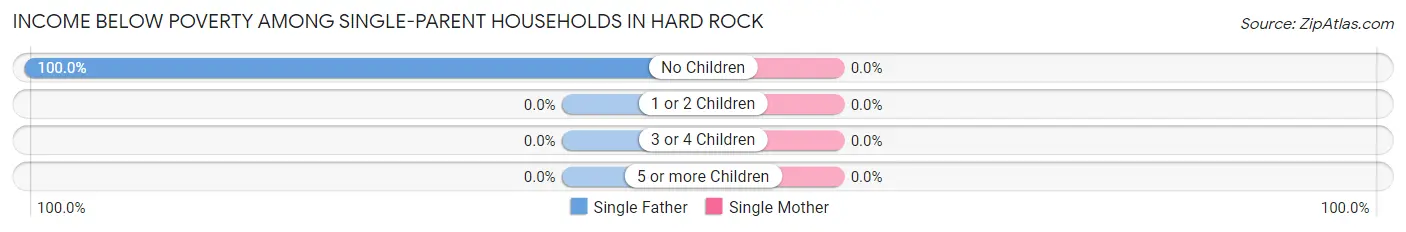
| Children | Single Father | Single Mother |
| No Children | 3 (100.0%) | 0 (0.0%) |
| 1 or 2 Children | 0 (0.0%) | 0 (0.0%) |
| 3 or 4 Children | 0 (0.0%) | 0 (0.0%) |
| 5 or more Children | 0 (0.0%) | 0 (0.0%) |
| Total | 3 (100.0%) | 0 (0.0%) |
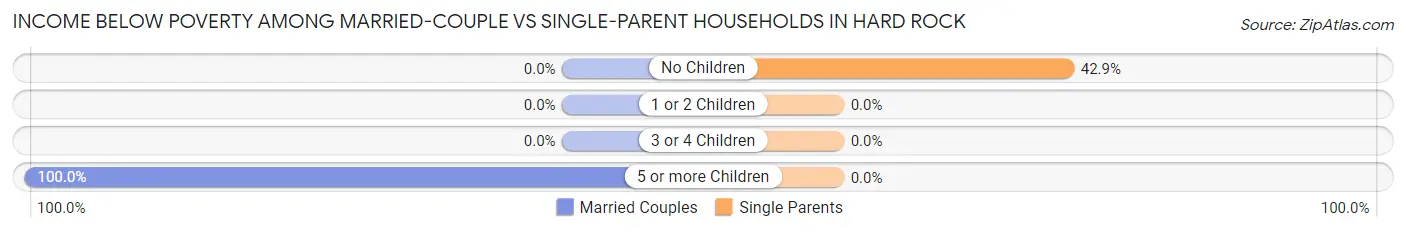
Income Below Poverty Among Married-Couple vs Single-Parent Households in Hard Rock
The poverty data for Hard Rock shows that 8 of the married-couple family households (100.0%) and 3 of the single-parent households (42.9%) are living below the poverty level. Within the married-couple family households, those with 5 or more children have the highest poverty rate, with 8 households (100.0%) falling below the poverty line. Among the single-parent households, those with no children have the highest poverty rate, with 3 household (42.9%) living below poverty.
| Children | Married-Couple Families | Single-Parent Households |
| No Children | 0 (0.0%) | 3 (42.9%) |
| 1 or 2 Children | 0 (0.0%) | 0 (0.0%) |
| 3 or 4 Children | 0 (0.0%) | 0 (0.0%) |
| 5 or more Children | 8 (100.0%) | 0 (0.0%) |
| Total | 8 (100.0%) | 3 (42.9%) |
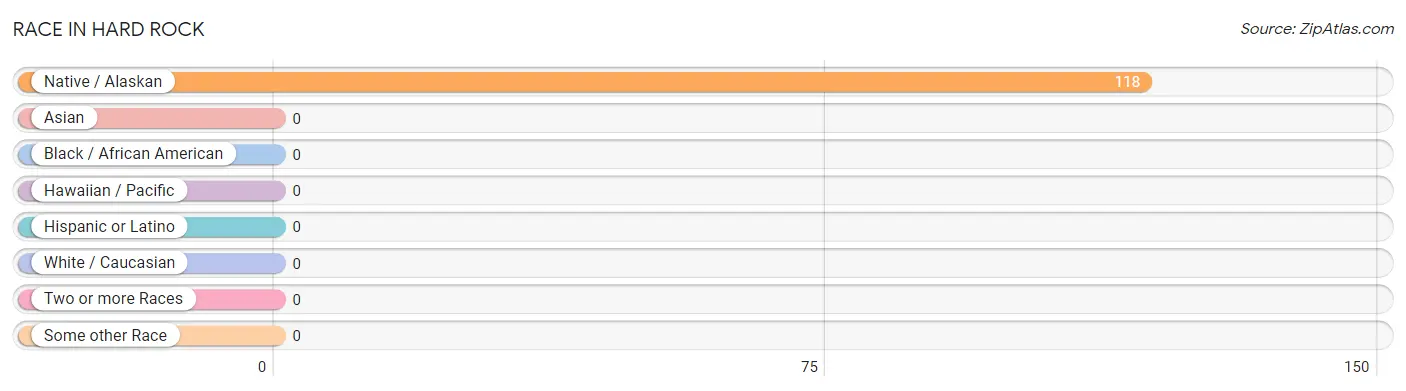
Race in Hard Rock
The most populous races in Hard Rock are , and Native / Alaskan (118 | 100.0%).
| Race | # Population | % Population |
| Asian | 0 | 0.0% |
| Black / African American | 0 | 0.0% |
| Hawaiian / Pacific | 0 | 0.0% |
| Hispanic or Latino | 0 | 0.0% |
| Native / Alaskan | 118 | 100.0% |
| White / Caucasian | 0 | 0.0% |
| Two or more Races | 0 | 0.0% |
| Some other Race | 0 | 0.0% |
| Total | 118 | 100.0% |
Ancestry in Hard Rock
The most populous ancestries reported in Hard Rock are , and Navajo (118 | 100.0%), together accounting for 100.0% of all Hard Rock residents.

| Ancestry | # Population | % Population |
| Navajo | 118 | 100.0% | View All 1 Rows |
Immigrants in Hard Rock

| Immigration Origin | # Population | % Population | View All 0 Rows |
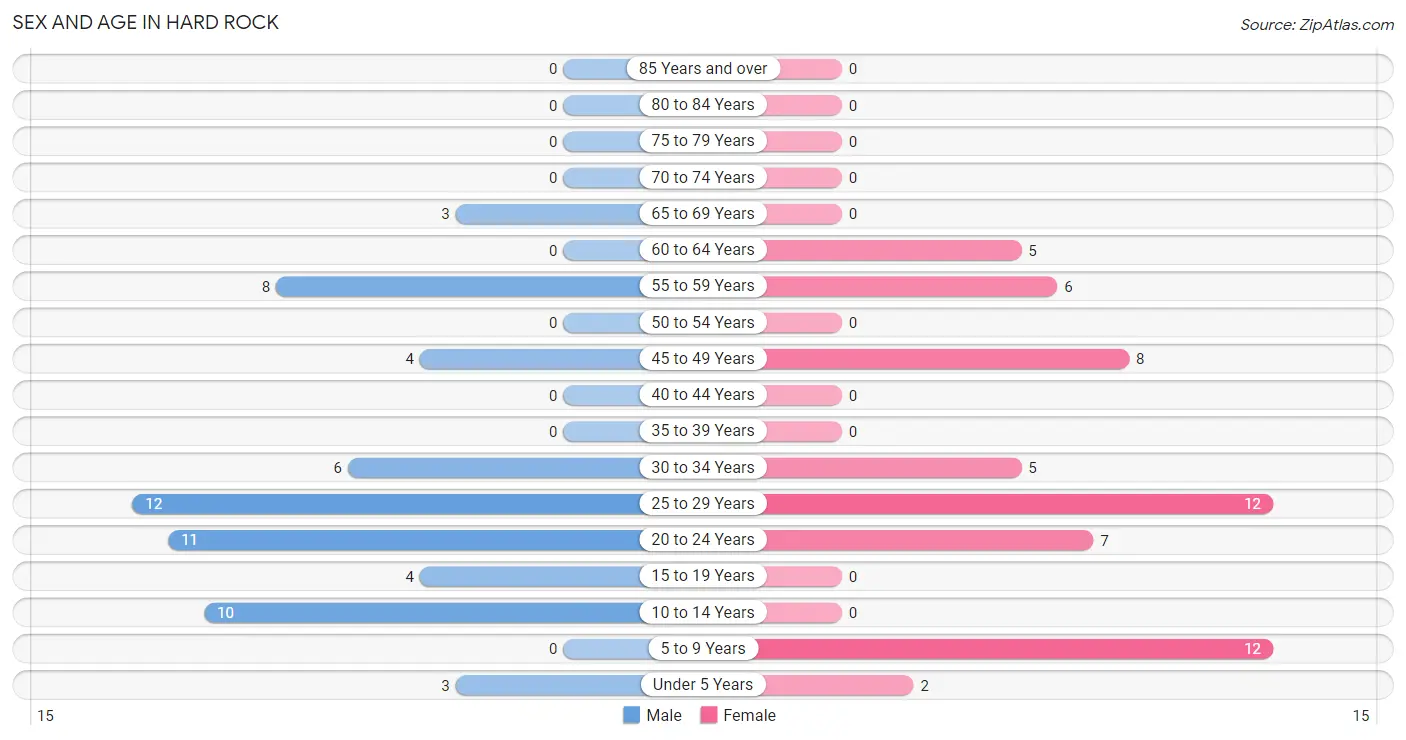
Sex and Age in Hard Rock
Sex and Age in Hard Rock
The most populous age groups in Hard Rock are 25 to 29 Years (12 | 19.7%) for men and 5 to 9 Years (12 | 21.0%) for women.
| Age Bracket | Male | Female |
| Under 5 Years | 3 (4.9%) | 2 (3.5%) |
| 5 to 9 Years | 0 (0.0%) | 12 (21.0%) |
| 10 to 14 Years | 10 (16.4%) | 0 (0.0%) |
| 15 to 19 Years | 4 (6.6%) | 0 (0.0%) |
| 20 to 24 Years | 11 (18.0%) | 7 (12.3%) |
| 25 to 29 Years | 12 (19.7%) | 12 (21.0%) |
| 30 to 34 Years | 6 (9.8%) | 5 (8.8%) |
| 35 to 39 Years | 0 (0.0%) | 0 (0.0%) |
| 40 to 44 Years | 0 (0.0%) | 0 (0.0%) |
| 45 to 49 Years | 4 (6.6%) | 8 (14.0%) |
| 50 to 54 Years | 0 (0.0%) | 0 (0.0%) |
| 55 to 59 Years | 8 (13.1%) | 6 (10.5%) |
| 60 to 64 Years | 0 (0.0%) | 5 (8.8%) |
| 65 to 69 Years | 3 (4.9%) | 0 (0.0%) |
| 70 to 74 Years | 0 (0.0%) | 0 (0.0%) |
| 75 to 79 Years | 0 (0.0%) | 0 (0.0%) |
| 80 to 84 Years | 0 (0.0%) | 0 (0.0%) |
| 85 Years and over | 0 (0.0%) | 0 (0.0%) |
| Total | 61 (100.0%) | 57 (100.0%) |
Families and Households in Hard Rock
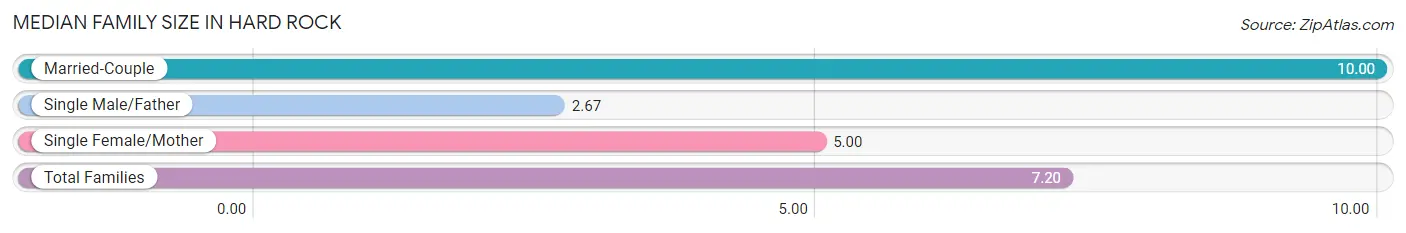
Median Family Size in Hard Rock
The median family size in Hard Rock is 7.20 persons per family, with married-couple families (8 | 53.3%) accounting for the largest median family size of 10 persons per family. On the other hand, single male/father families (3 | 20.0%) represent the smallest median family size with 2.67 persons per family.
| Family Type | # Families | Family Size |
| Married-Couple | 8 (53.3%) | 10.00 |
| Single Male/Father | 3 (20.0%) | 2.67 |
| Single Female/Mother | 4 (26.7%) | 5.00 |
| Total Families | 15 (100.0%) | 7.20 |
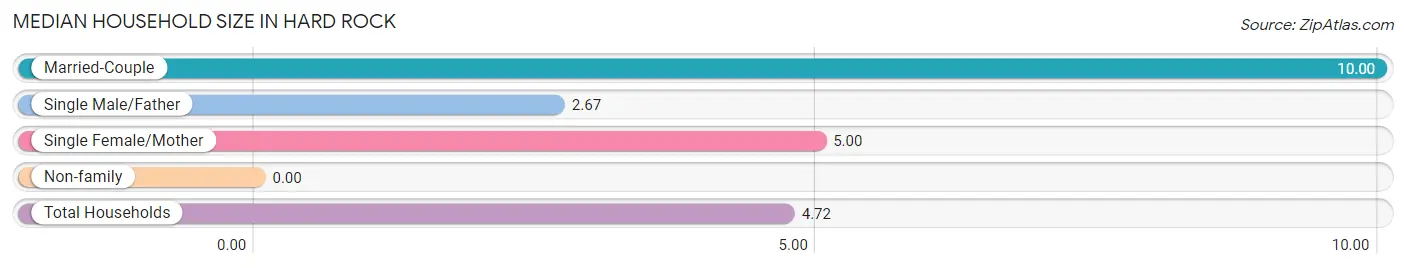
Median Household Size in Hard Rock
| Household Type | # Households | Household Size |
| Married-Couple | 8 (32.0%) | 10.00 |
| Single Male/Father | 3 (12.0%) | 2.67 |
| Single Female/Mother | 4 (16.0%) | 5.00 |
| Non-family | 10 (40.0%) | - |
| Total Households | 25 (100.0%) | 4.72 |
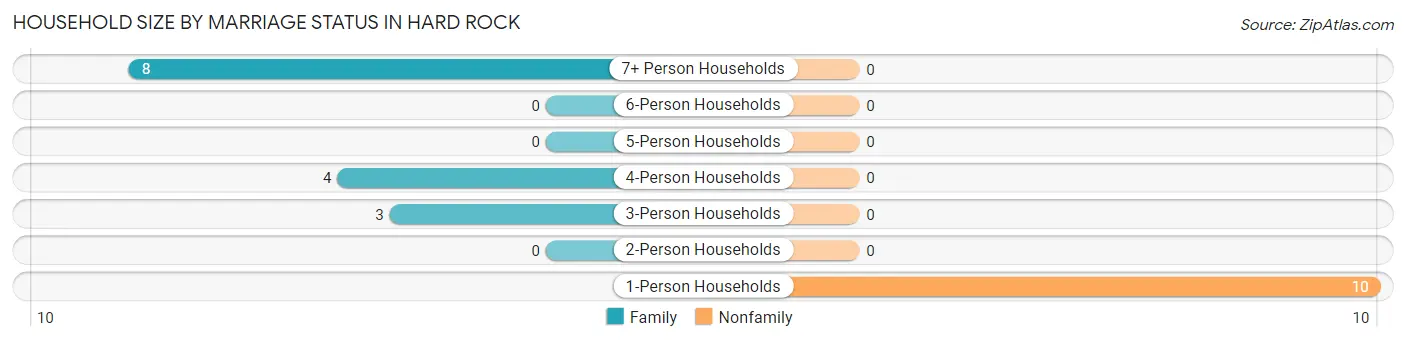
Household Size by Marriage Status in Hard Rock
Out of a total of 25 households in Hard Rock, 15 (60.0%) are family households, while 10 (40.0%) are nonfamily households. The most numerous type of family households are 7+ person households, comprising 8, and the most common type of nonfamily households are 1-person households, comprising 10.
| Household Size | Family Households | Nonfamily Households |
| 1-Person Households | - | 10 (40.0%) |
| 2-Person Households | 0 (0.0%) | 0 (0.0%) |
| 3-Person Households | 3 (12.0%) | 0 (0.0%) |
| 4-Person Households | 4 (16.0%) | 0 (0.0%) |
| 5-Person Households | 0 (0.0%) | 0 (0.0%) |
| 6-Person Households | 0 (0.0%) | 0 (0.0%) |
| 7+ Person Households | 8 (32.0%) | 0 (0.0%) |
| Total | 15 (60.0%) | 10 (40.0%) |
Female Fertility in Hard Rock
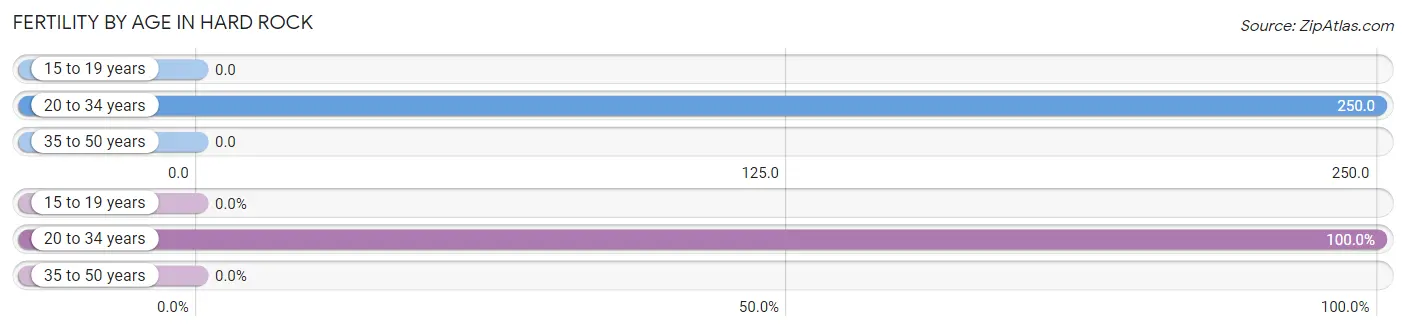
Fertility by Age in Hard Rock
Average fertility rate in Hard Rock is 188.0 births per 1,000 women. Women in the age bracket of 20 to 34 years have the highest fertility rate with 250.0 births per 1,000 women. Women in the age bracket of 20 to 34 years acount for 100.0% of all women with births.
| Age Bracket | Women with Births | Births / 1,000 Women |
| 15 to 19 years | 0 (0.0%) | 0.0 |
| 20 to 34 years | 6 (100.0%) | 250.0 |
| 35 to 50 years | 0 (0.0%) | 0.0 |
| Total | 6 (100.0%) | 188.0 |
Fertility by Age by Marriage Status in Hard Rock
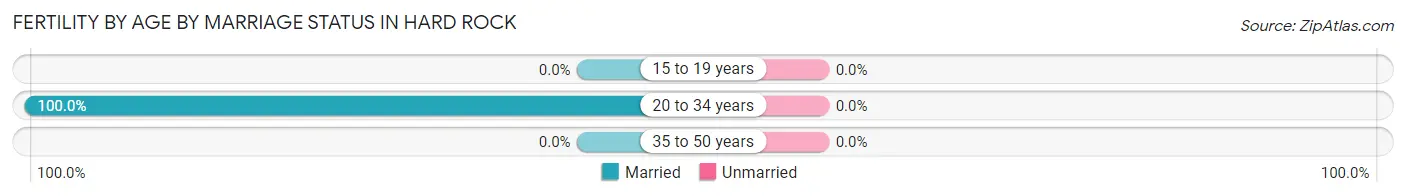
| Age Bracket | Married | Unmarried |
| 15 to 19 years | 0 (0.0%) | 0 (0.0%) |
| 20 to 34 years | 6 (100.0%) | 0 (0.0%) |
| 35 to 50 years | 0 (0.0%) | 0 (0.0%) |
| Total | 6 (100.0%) | 0 (0.0%) |
Fertility by Education in Hard Rock
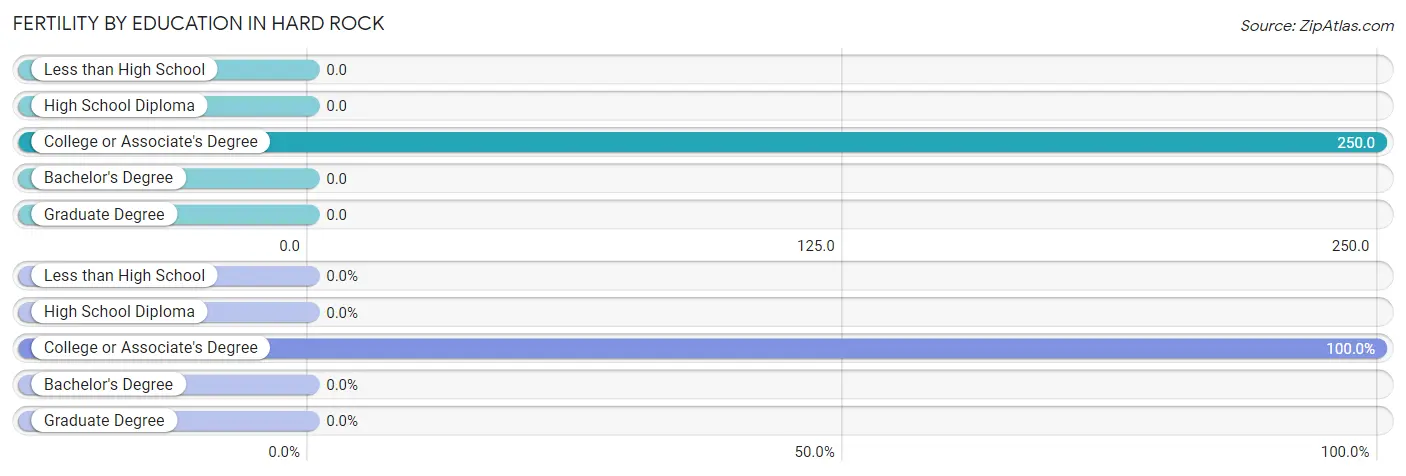
| Educational Attainment | Women with Births | Births / 1,000 Women |
| Less than High School | 0 (0.0%) | 0.0 |
| High School Diploma | 0 (0.0%) | 0.0 |
| College or Associate's Degree | 6 (100.0%) | 250.0 |
| Bachelor's Degree | 0 (0.0%) | 0.0 |
| Graduate Degree | 0 (0.0%) | 0.0 |
| Total | 6 (100.0%) | 188.0 |
Fertility by Education by Marriage Status in Hard Rock
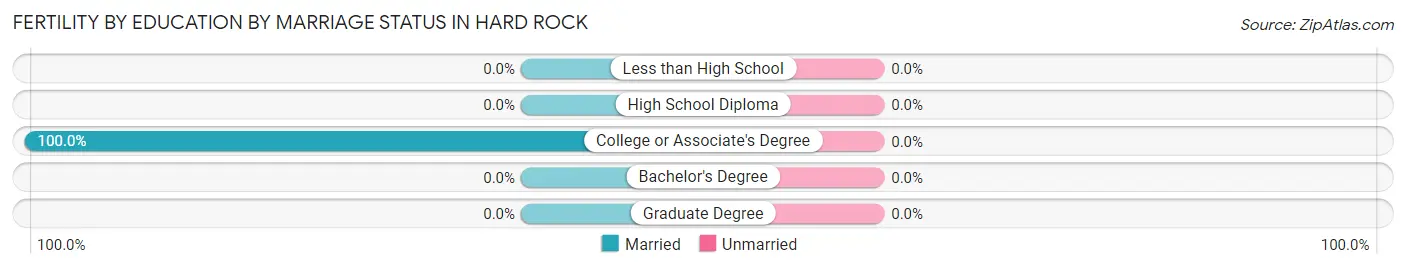
| Educational Attainment | Married | Unmarried |
| Less than High School | 0 (0.0%) | 0 (0.0%) |
| High School Diploma | 0 (0.0%) | 0 (0.0%) |
| College or Associate's Degree | 6 (100.0%) | 0 (0.0%) |
| Bachelor's Degree | 0 (0.0%) | 0 (0.0%) |
| Graduate Degree | 0 (0.0%) | 0 (0.0%) |
| Total | 6 (100.0%) | 0 (0.0%) |
Employment Characteristics in Hard Rock
Employment by Class of Employer in Hard Rock
Among the 9 employed individuals in Hard Rock, private company employees (5 | 55.6%), and federal government employees (4 | 44.4%) make up the most common classes of employment.
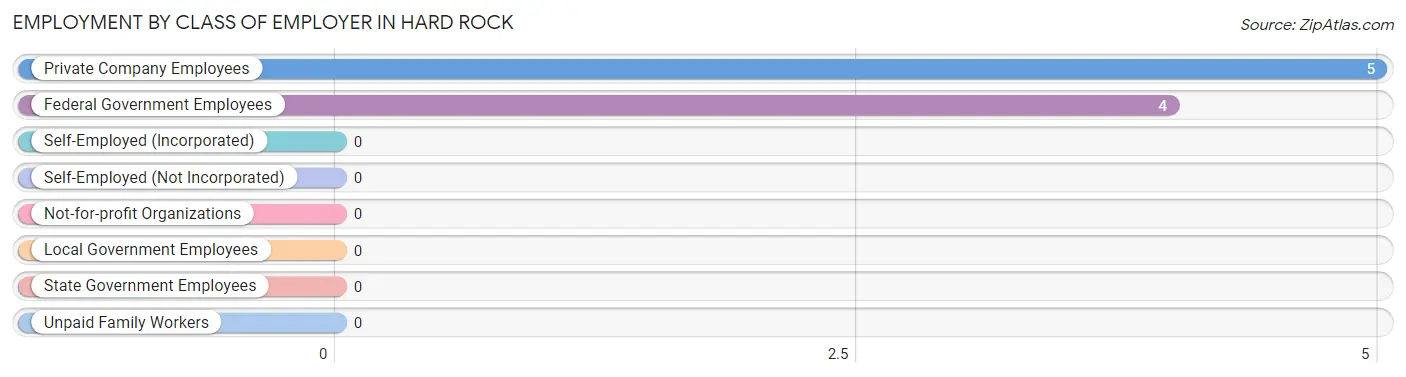
| Employer Class | # Employees | % Employees |
| Private Company Employees | 5 | 55.6% |
| Self-Employed (Incorporated) | 0 | 0.0% |
| Self-Employed (Not Incorporated) | 0 | 0.0% |
| Not-for-profit Organizations | 0 | 0.0% |
| Local Government Employees | 0 | 0.0% |
| State Government Employees | 0 | 0.0% |
| Federal Government Employees | 4 | 44.4% |
| Unpaid Family Workers | 0 | 0.0% |
| Total | 9 | 100.0% |
Employment Status by Age in Hard Rock
According to the labor force statistics for Hard Rock, out of the total population over 16 years of age (91), 12.1% or 11 individuals are in the labor force, with 18.2% or 2 of them unemployed. The age group with the highest labor force participation rate is 60 to 64 years, with 100.0% or 5 individuals in the labor force. Within the labor force, the 55 to 59 years age range has the highest percentage of unemployed individuals, with 33.3% or 2 of them being unemployed.
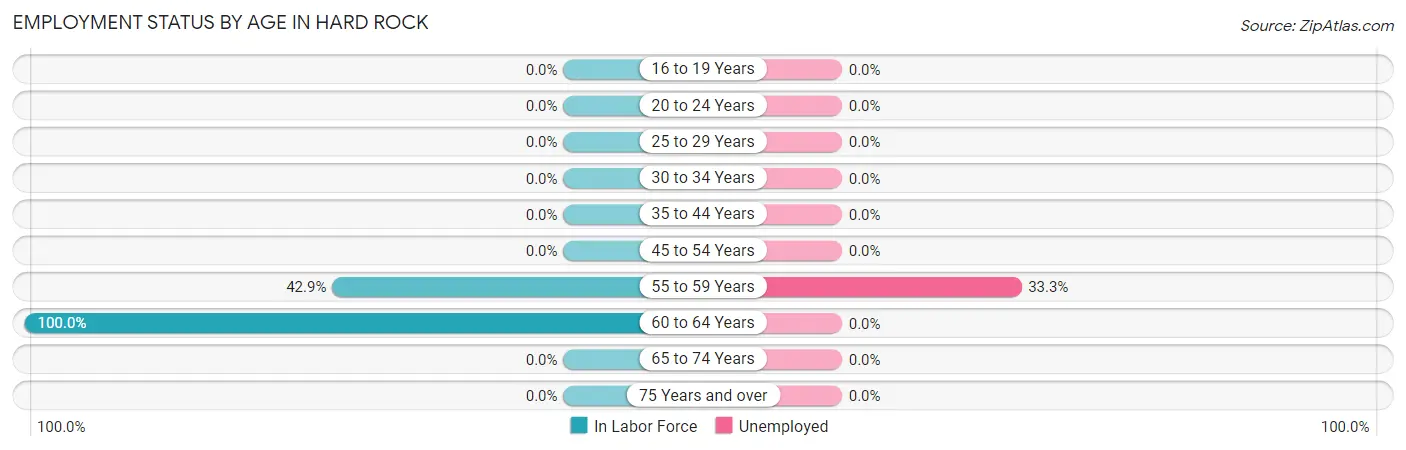
| Age Bracket | In Labor Force | Unemployed |
| 16 to 19 Years | 0 (0.0%) | 0 (0.0%) |
| 20 to 24 Years | 0 (0.0%) | 0 (0.0%) |
| 25 to 29 Years | 0 (0.0%) | 0 (0.0%) |
| 30 to 34 Years | 0 (0.0%) | 0 (0.0%) |
| 35 to 44 Years | 0 (0.0%) | 0 (0.0%) |
| 45 to 54 Years | 0 (0.0%) | 0 (0.0%) |
| 55 to 59 Years | 6 (42.9%) | 2 (33.3%) |
| 60 to 64 Years | 5 (100.0%) | 0 (0.0%) |
| 65 to 74 Years | 0 (0.0%) | 0 (0.0%) |
| 75 Years and over | 0 (0.0%) | 0 (0.0%) |
| Total | 11 (12.1%) | 2 (18.2%) |
Employment Status by Educational Attainment in Hard Rock
According to labor force statistics for Hard Rock, 16.7% of individuals (11) out of the total population between 25 and 64 years of age (66) are in the labor force, with 18.2% or 2 of them being unemployed. The group with the highest labor force participation rate are those with the educational attainment of bachelor's degree or higher, with 55.6% or 5 individuals in the labor force. Within the labor force, individuals with high school diploma education have the highest percentage of unemployment, with 100.0% or 2 of them being unemployed.
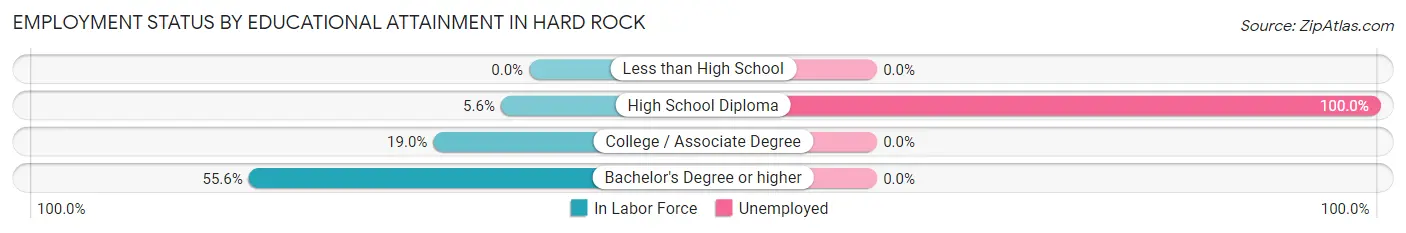
| Educational Attainment | In Labor Force | Unemployed |
| Less than High School | 0 (0.0%) | 0 (0.0%) |
| High School Diploma | 2 (5.6%) | 36 (100.0%) |
| College / Associate Degree | 4 (19.0%) | 0 (0.0%) |
| Bachelor's Degree or higher | 5 (55.6%) | 0 (0.0%) |
| Total | 11 (16.7%) | 12 (18.2%) |
Employment Occupations by Sex in Hard Rock
Management, Business, Science and Arts Occupations
The most common Management, Business, Science and Arts occupations in Hard Rock are , and Business & Financial (9 | 100.0%).
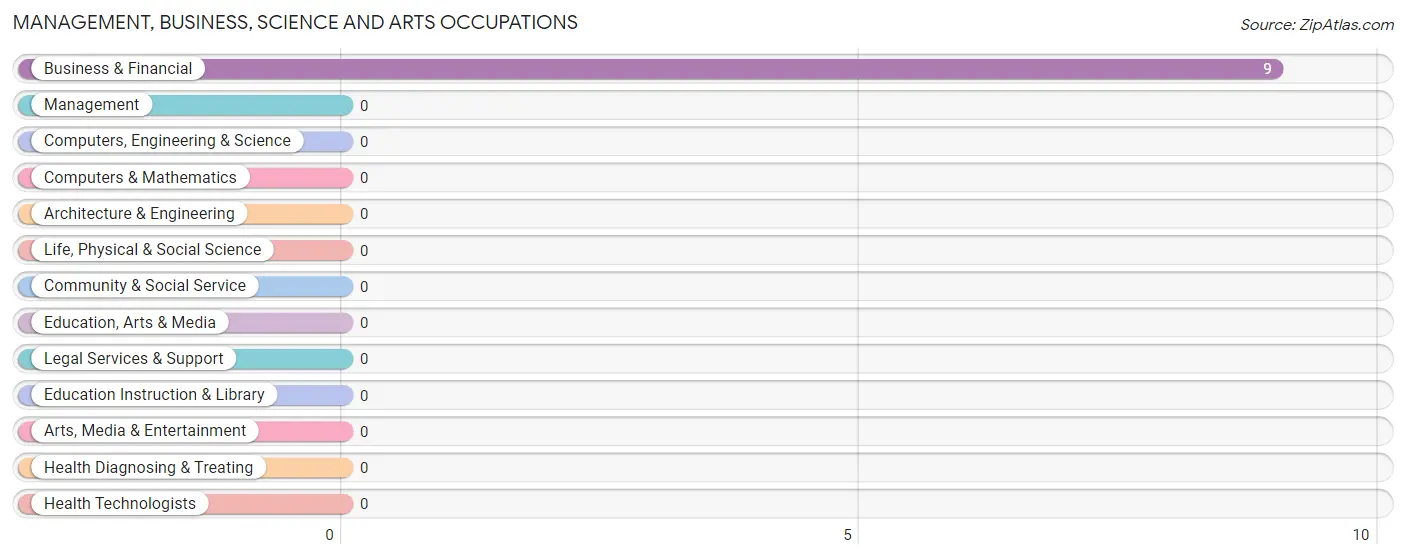
Management, Business, Science and Arts Occupations by Sex
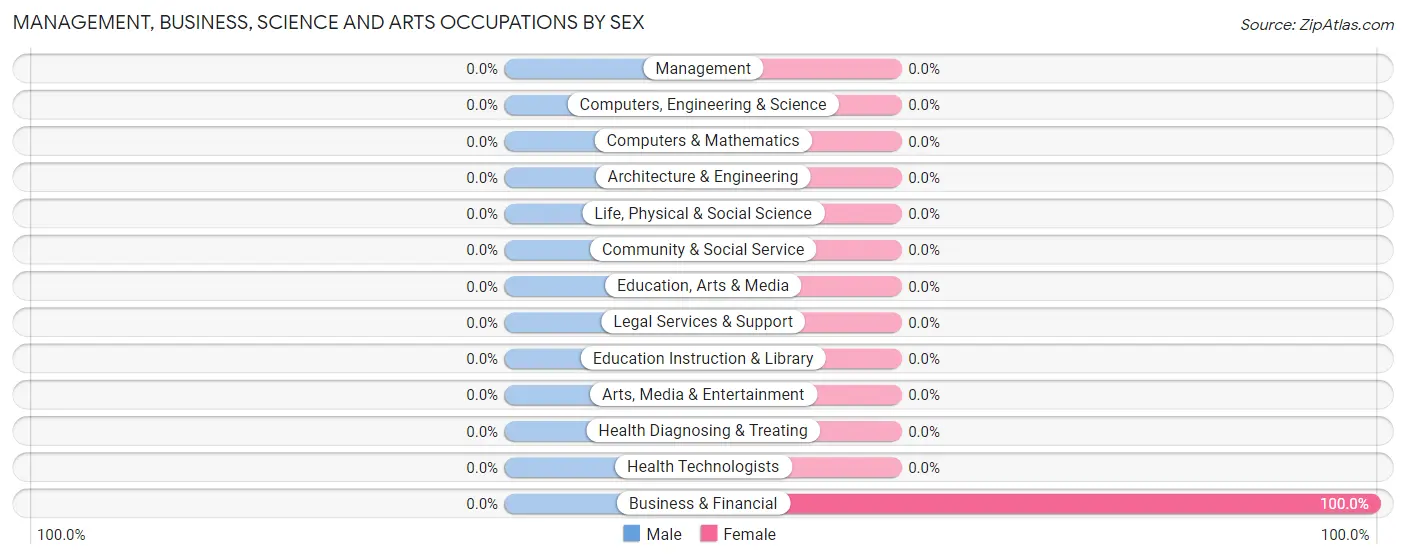
| Occupation | Male | Female |
| Management | 0 (0.0%) | 0 (0.0%) |
| Business & Financial | 0 (0.0%) | 9 (100.0%) |
| Computers, Engineering & Science | 0 (0.0%) | 0 (0.0%) |
| Computers & Mathematics | 0 (0.0%) | 0 (0.0%) |
| Architecture & Engineering | 0 (0.0%) | 0 (0.0%) |
| Life, Physical & Social Science | 0 (0.0%) | 0 (0.0%) |
| Community & Social Service | 0 (0.0%) | 0 (0.0%) |
| Education, Arts & Media | 0 (0.0%) | 0 (0.0%) |
| Legal Services & Support | 0 (0.0%) | 0 (0.0%) |
| Education Instruction & Library | 0 (0.0%) | 0 (0.0%) |
| Arts, Media & Entertainment | 0 (0.0%) | 0 (0.0%) |
| Health Diagnosing & Treating | 0 (0.0%) | 0 (0.0%) |
| Health Technologists | 0 (0.0%) | 0 (0.0%) |
| Total (Category) | 0 (0.0%) | 9 (100.0%) |
| Total (Overall) | 0 (0.0%) | 9 (100.0%) |
Services Occupations
Services Occupations by Sex
| Occupation | Male | Female |
| Healthcare Support | 0 (0.0%) | 0 (0.0%) |
| Security & Protection | 0 (0.0%) | 0 (0.0%) |
| Firefighting & Prevention | 0 (0.0%) | 0 (0.0%) |
| Law Enforcement | 0 (0.0%) | 0 (0.0%) |
| Food Preparation & Serving | 0 (0.0%) | 0 (0.0%) |
| Cleaning & Maintenance | 0 (0.0%) | 0 (0.0%) |
| Personal Care & Service | 0 (0.0%) | 0 (0.0%) |
| Total (Category) | 0 (0.0%) | 0 (0.0%) |
| Total (Overall) | 0 (0.0%) | 9 (100.0%) |
Sales and Office Occupations
Sales and Office Occupations by Sex
| Occupation | Male | Female |
| Sales & Related | 0 (0.0%) | 0 (0.0%) |
| Office & Administration | 0 (0.0%) | 0 (0.0%) |
| Total (Category) | 0 (0.0%) | 0 (0.0%) |
| Total (Overall) | 0 (0.0%) | 9 (100.0%) |
Natural Resources, Construction and Maintenance Occupations
Natural Resources, Construction and Maintenance Occupations by Sex
| Occupation | Male | Female |
| Farming, Fishing & Forestry | 0 (0.0%) | 0 (0.0%) |
| Construction & Extraction | 0 (0.0%) | 0 (0.0%) |
| Installation, Maintenance & Repair | 0 (0.0%) | 0 (0.0%) |
| Total (Category) | 0 (0.0%) | 0 (0.0%) |
| Total (Overall) | 0 (0.0%) | 9 (100.0%) |
Production, Transportation and Moving Occupations
Production, Transportation and Moving Occupations by Sex
| Occupation | Male | Female |
| Production | 0 (0.0%) | 0 (0.0%) |
| Transportation | 0 (0.0%) | 0 (0.0%) |
| Material Moving | 0 (0.0%) | 0 (0.0%) |
| Total (Category) | 0 (0.0%) | 0 (0.0%) |
| Total (Overall) | 0 (0.0%) | 9 (100.0%) |
Employment Industries by Sex in Hard Rock
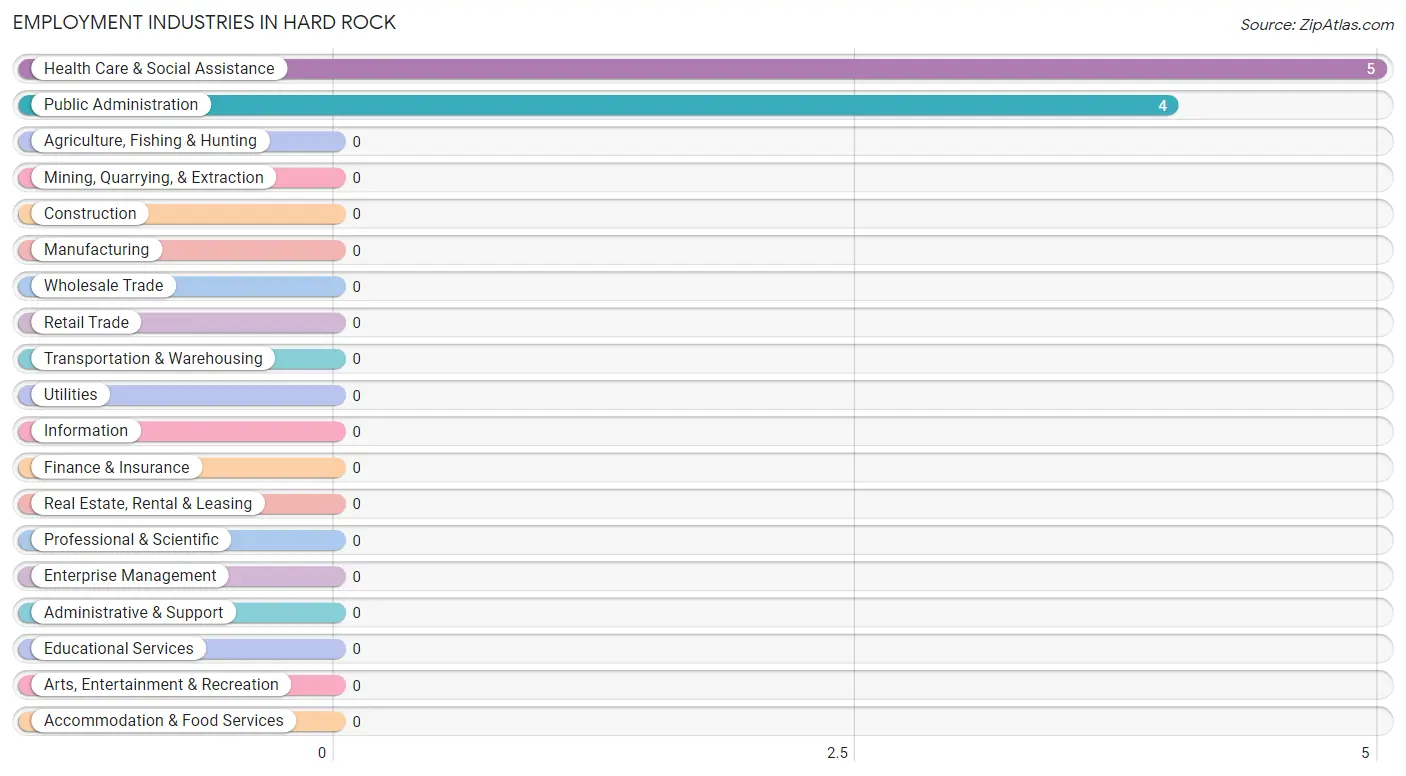
Employment Industries in Hard Rock
The major employment industries in Hard Rock include Health Care & Social Assistance (5 | 55.6%), and Public Administration (4 | 44.4%).
Employment Industries by Sex in Hard Rock
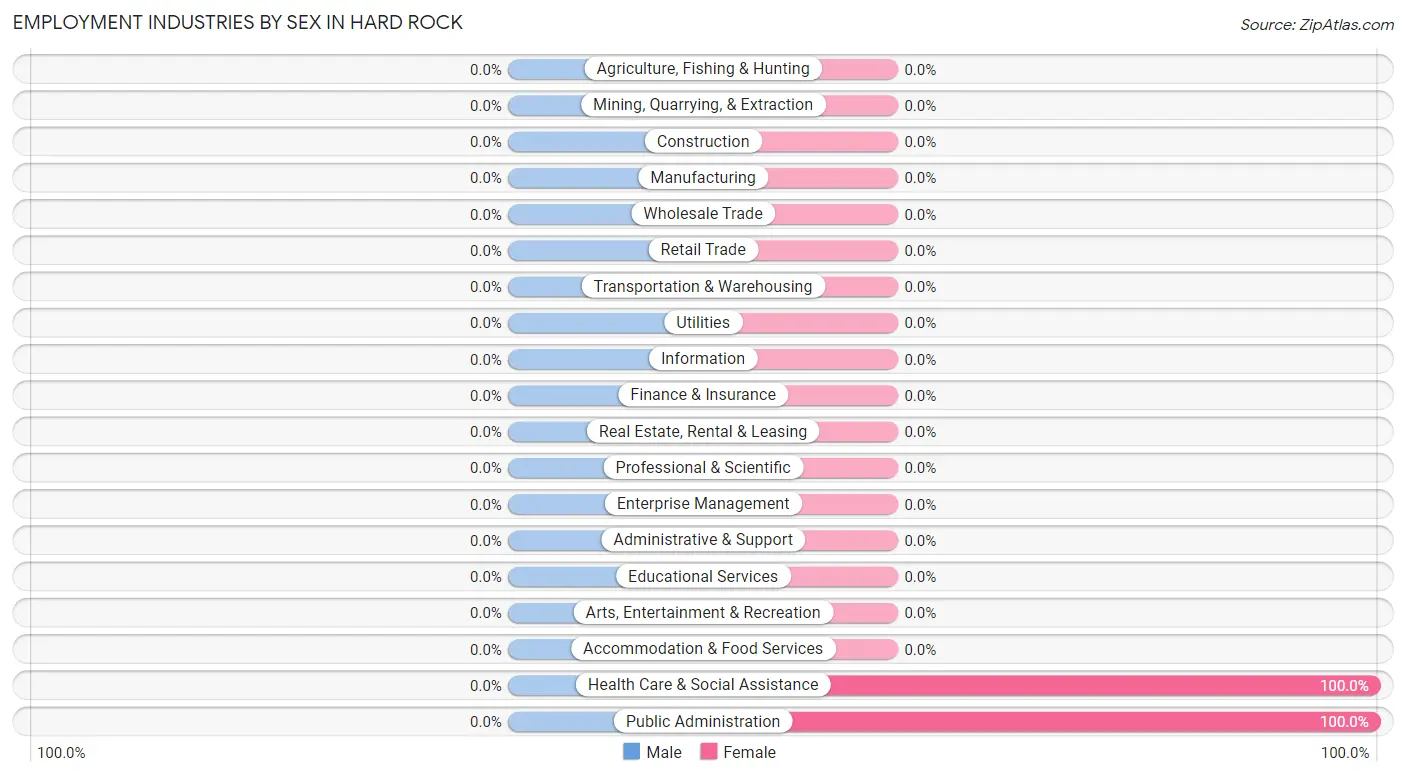
| Industry | Male | Female |
| Agriculture, Fishing & Hunting | 0 (0.0%) | 0 (0.0%) |
| Mining, Quarrying, & Extraction | 0 (0.0%) | 0 (0.0%) |
| Construction | 0 (0.0%) | 0 (0.0%) |
| Manufacturing | 0 (0.0%) | 0 (0.0%) |
| Wholesale Trade | 0 (0.0%) | 0 (0.0%) |
| Retail Trade | 0 (0.0%) | 0 (0.0%) |
| Transportation & Warehousing | 0 (0.0%) | 0 (0.0%) |
| Utilities | 0 (0.0%) | 0 (0.0%) |
| Information | 0 (0.0%) | 0 (0.0%) |
| Finance & Insurance | 0 (0.0%) | 0 (0.0%) |
| Real Estate, Rental & Leasing | 0 (0.0%) | 0 (0.0%) |
| Professional & Scientific | 0 (0.0%) | 0 (0.0%) |
| Enterprise Management | 0 (0.0%) | 0 (0.0%) |
| Administrative & Support | 0 (0.0%) | 0 (0.0%) |
| Educational Services | 0 (0.0%) | 0 (0.0%) |
| Health Care & Social Assistance | 0 (0.0%) | 5 (100.0%) |
| Arts, Entertainment & Recreation | 0 (0.0%) | 0 (0.0%) |
| Accommodation & Food Services | 0 (0.0%) | 0 (0.0%) |
| Public Administration | 0 (0.0%) | 4 (100.0%) |
| Total | 0 (0.0%) | 9 (100.0%) |
Education in Hard Rock
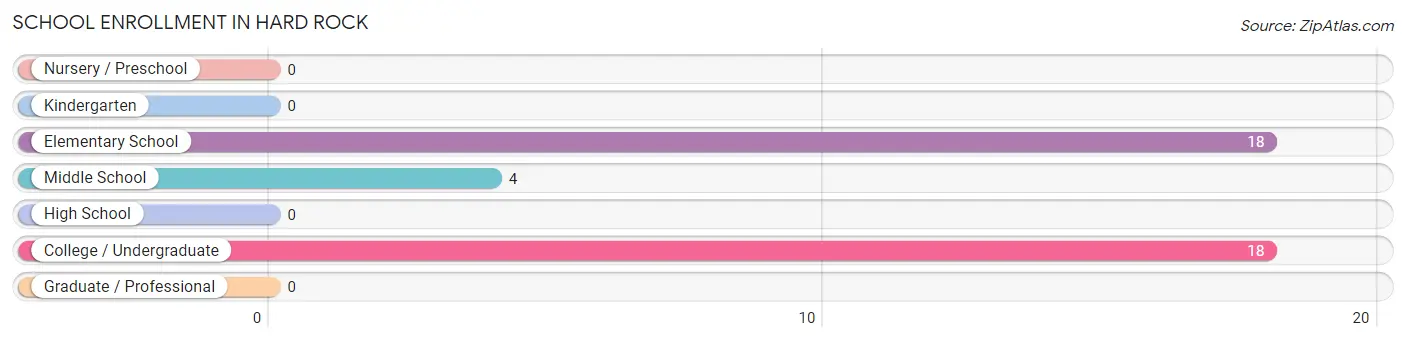
School Enrollment in Hard Rock
The most common levels of schooling among the 40 students in Hard Rock are elementary school (18 | 45.0%), college / undergraduate (18 | 45.0%), and middle school (4 | 10.0%).
| School Level | # Students | % Students |
| Nursery / Preschool | 0 | 0.0% |
| Kindergarten | 0 | 0.0% |
| Elementary School | 18 | 45.0% |
| Middle School | 4 | 10.0% |
| High School | 0 | 0.0% |
| College / Undergraduate | 18 | 45.0% |
| Graduate / Professional | 0 | 0.0% |
| Total | 40 | 100.0% |
School Enrollment by Age by Funding Source in Hard Rock
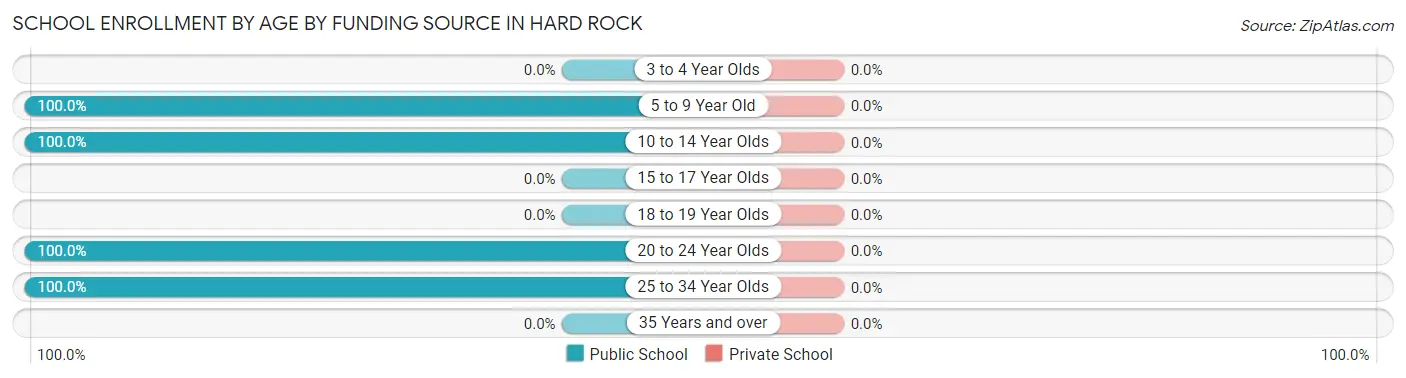
| Age Bracket | Public School | Private School |
| 3 to 4 Year Olds | 0 (0.0%) | 0 (0.0%) |
| 5 to 9 Year Old | 12 (100.0%) | 0 (0.0%) |
| 10 to 14 Year Olds | 10 (100.0%) | 0 (0.0%) |
| 15 to 17 Year Olds | 0 (0.0%) | 0 (0.0%) |
| 18 to 19 Year Olds | 0 (0.0%) | 0 (0.0%) |
| 20 to 24 Year Olds | 6 (100.0%) | 0 (0.0%) |
| 25 to 34 Year Olds | 12 (100.0%) | 0 (0.0%) |
| 35 Years and over | 0 (0.0%) | 0 (0.0%) |
| Total | 40 (100.0%) | 0 (0.0%) |
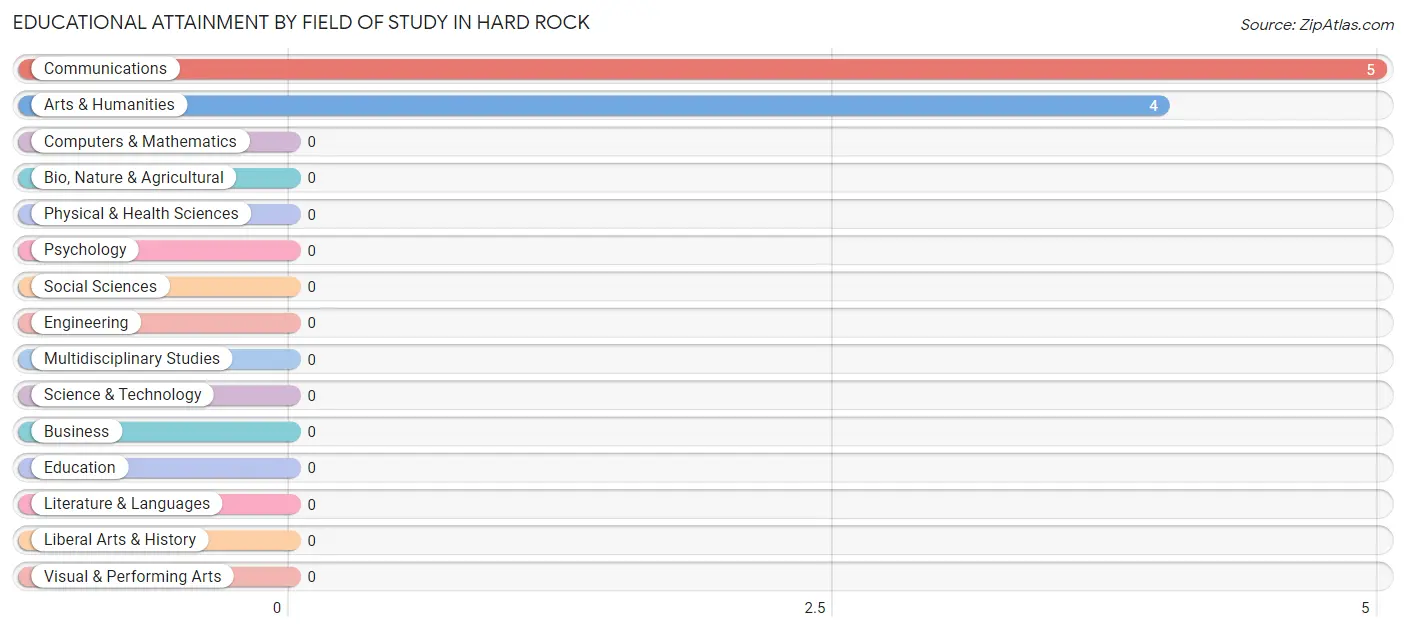
Educational Attainment by Field of Study in Hard Rock
Communications (5 | 55.6%), and arts & humanities (4 | 44.4%) are the most common fields of study among 9 individuals in Hard Rock who have obtained a bachelor's degree or higher.
| Field of Study | # Graduates | % Graduates |
| Computers & Mathematics | 0 | 0.0% |
| Bio, Nature & Agricultural | 0 | 0.0% |
| Physical & Health Sciences | 0 | 0.0% |
| Psychology | 0 | 0.0% |
| Social Sciences | 0 | 0.0% |
| Engineering | 0 | 0.0% |
| Multidisciplinary Studies | 0 | 0.0% |
| Science & Technology | 0 | 0.0% |
| Business | 0 | 0.0% |
| Education | 0 | 0.0% |
| Literature & Languages | 0 | 0.0% |
| Liberal Arts & History | 0 | 0.0% |
| Visual & Performing Arts | 0 | 0.0% |
| Communications | 5 | 55.6% |
| Arts & Humanities | 4 | 44.4% |
| Total | 9 | 100.0% |
Transportation & Commute in Hard Rock
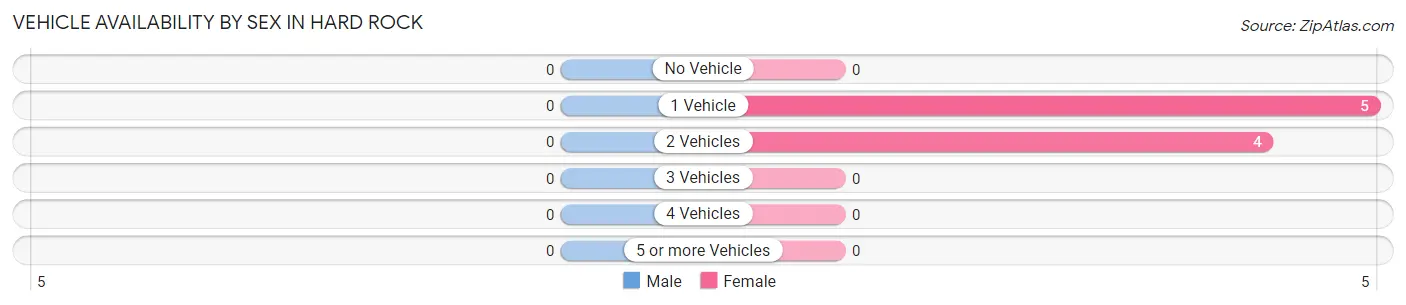
Vehicle Availability by Sex in Hard Rock
| Vehicles Available | Male | Female |
| No Vehicle | 0 (0.0%) | 0 (0.0%) |
| 1 Vehicle | 0 (0.0%) | 5 (55.6%) |
| 2 Vehicles | 0 (0.0%) | 4 (44.4%) |
| 3 Vehicles | 0 (0.0%) | 0 (0.0%) |
| 4 Vehicles | 0 (0.0%) | 0 (0.0%) |
| 5 or more Vehicles | 0 (0.0%) | 0 (0.0%) |
| Total | 0 (0.0%) | 9 (100.0%) |
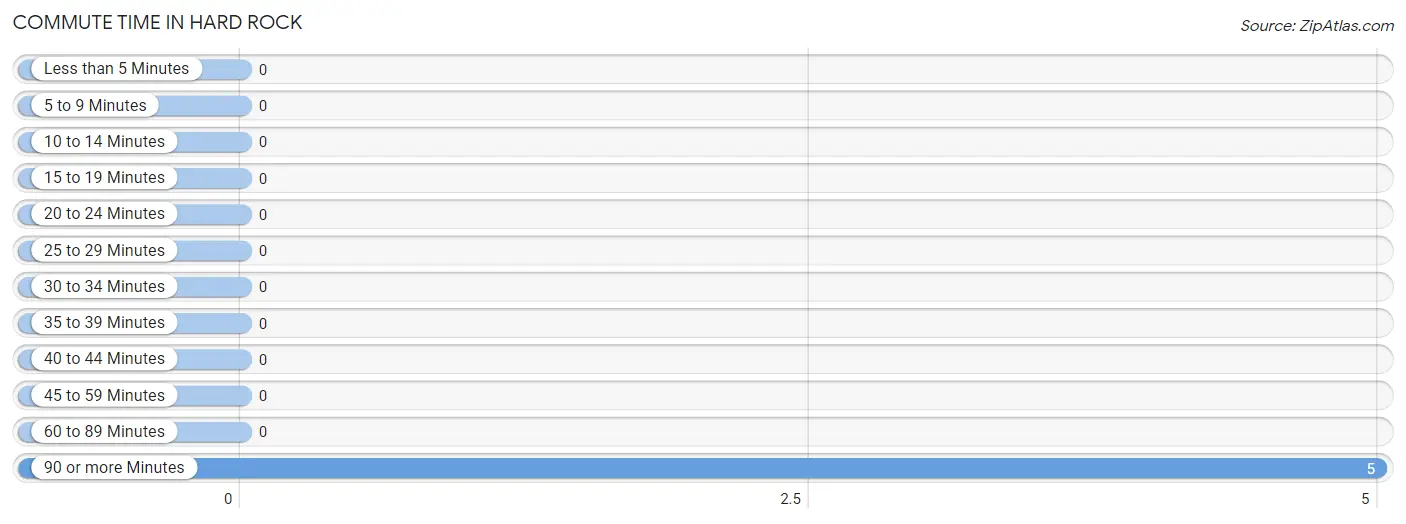
Commute Time in Hard Rock
The most frequently occuring commute durations in Hard Rock are 90 or more minutes (5 commuters, 100.0%), less than 5 minutes (0 commuters, 0.0%), and 5 to 9 minutes (0 commuters, 0.0%).
| Commute Time | # Commuters | % Commuters |
| Less than 5 Minutes | 0 | 0.0% |
| 5 to 9 Minutes | 0 | 0.0% |
| 10 to 14 Minutes | 0 | 0.0% |
| 15 to 19 Minutes | 0 | 0.0% |
| 20 to 24 Minutes | 0 | 0.0% |
| 25 to 29 Minutes | 0 | 0.0% |
| 30 to 34 Minutes | 0 | 0.0% |
| 35 to 39 Minutes | 0 | 0.0% |
| 40 to 44 Minutes | 0 | 0.0% |
| 45 to 59 Minutes | 0 | 0.0% |
| 60 to 89 Minutes | 0 | 0.0% |
| 90 or more Minutes | 5 | 100.0% |
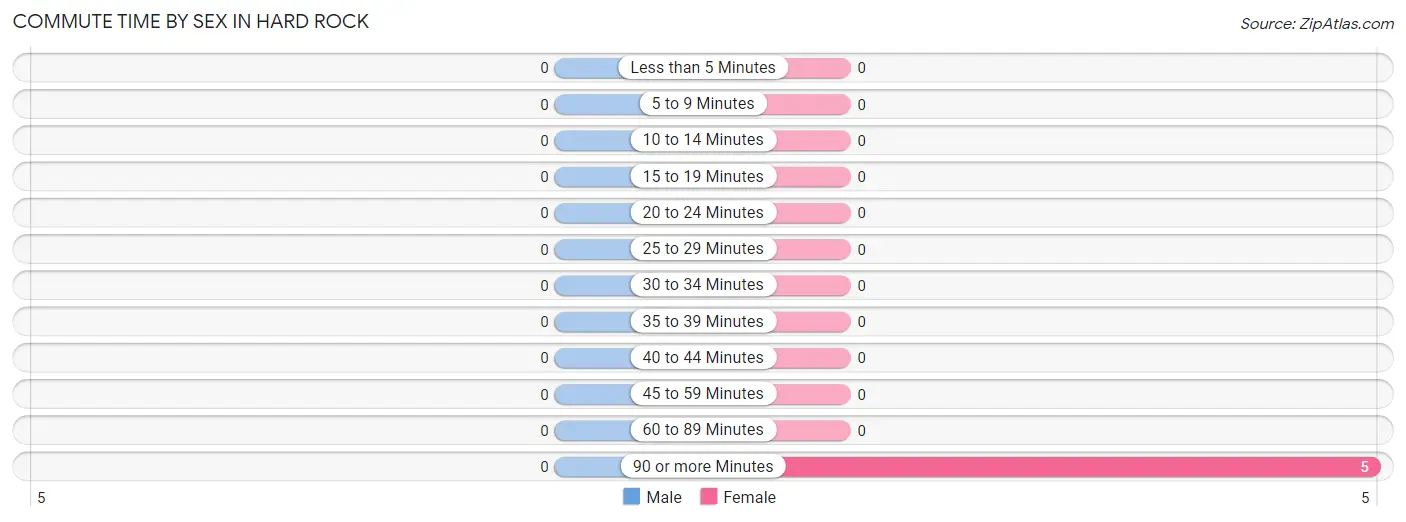
Commute Time by Sex in Hard Rock
| Commute Time | Male | Female |
| Less than 5 Minutes | 0 (0.0%) | 0 (0.0%) |
| 5 to 9 Minutes | 0 (0.0%) | 0 (0.0%) |
| 10 to 14 Minutes | 0 (0.0%) | 0 (0.0%) |
| 15 to 19 Minutes | 0 (0.0%) | 0 (0.0%) |
| 20 to 24 Minutes | 0 (0.0%) | 0 (0.0%) |
| 25 to 29 Minutes | 0 (0.0%) | 0 (0.0%) |
| 30 to 34 Minutes | 0 (0.0%) | 0 (0.0%) |
| 35 to 39 Minutes | 0 (0.0%) | 0 (0.0%) |
| 40 to 44 Minutes | 0 (0.0%) | 0 (0.0%) |
| 45 to 59 Minutes | 0 (0.0%) | 0 (0.0%) |
| 60 to 89 Minutes | 0 (0.0%) | 0 (0.0%) |
| 90 or more Minutes | 0 (0.0%) | 5 (100.0%) |
Time of Departure to Work by Sex in Hard Rock
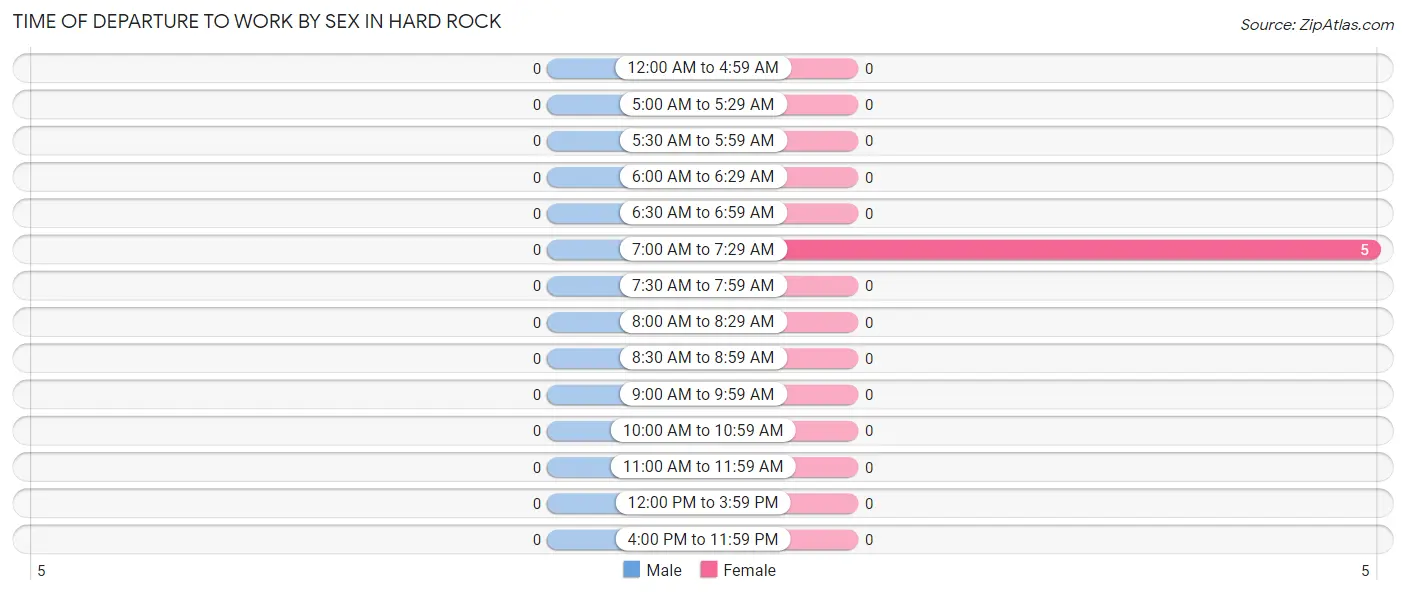
| Time of Departure | Male | Female |
| 12:00 AM to 4:59 AM | 0 (0.0%) | 0 (0.0%) |
| 5:00 AM to 5:29 AM | 0 (0.0%) | 0 (0.0%) |
| 5:30 AM to 5:59 AM | 0 (0.0%) | 0 (0.0%) |
| 6:00 AM to 6:29 AM | 0 (0.0%) | 0 (0.0%) |
| 6:30 AM to 6:59 AM | 0 (0.0%) | 0 (0.0%) |
| 7:00 AM to 7:29 AM | 0 (0.0%) | 5 (100.0%) |
| 7:30 AM to 7:59 AM | 0 (0.0%) | 0 (0.0%) |
| 8:00 AM to 8:29 AM | 0 (0.0%) | 0 (0.0%) |
| 8:30 AM to 8:59 AM | 0 (0.0%) | 0 (0.0%) |
| 9:00 AM to 9:59 AM | 0 (0.0%) | 0 (0.0%) |
| 10:00 AM to 10:59 AM | 0 (0.0%) | 0 (0.0%) |
| 11:00 AM to 11:59 AM | 0 (0.0%) | 0 (0.0%) |
| 12:00 PM to 3:59 PM | 0 (0.0%) | 0 (0.0%) |
| 4:00 PM to 11:59 PM | 0 (0.0%) | 0 (0.0%) |
| Total | 0 (0.0%) | 5 (100.0%) |
Housing Occupancy in Hard Rock
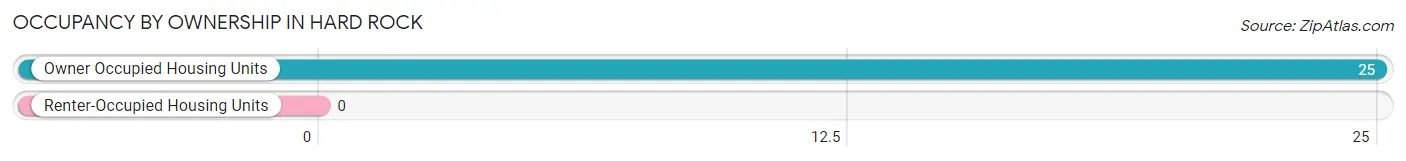
Occupancy by Ownership in Hard Rock
Of the total 25 dwellings in Hard Rock, owner-occupied units account for 25 (100.0%), while renter-occupied units make up 0 (0.0%).
| Occupancy | # Housing Units | % Housing Units |
| Owner Occupied Housing Units | 25 | 100.0% |
| Renter-Occupied Housing Units | 0 | 0.0% |
| Total Occupied Housing Units | 25 | 100.0% |
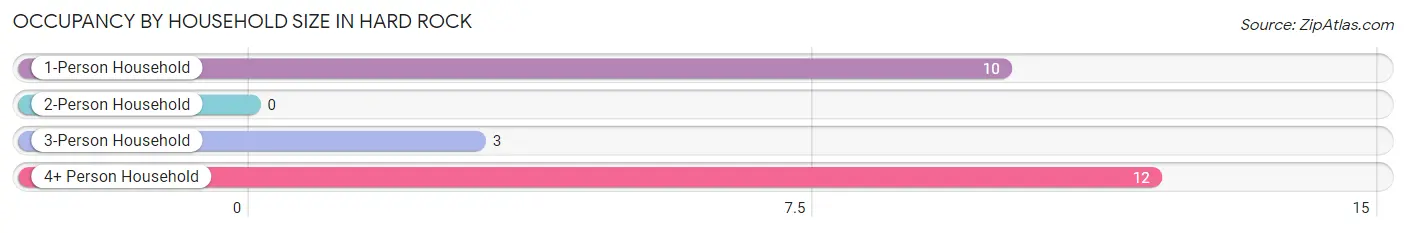
Occupancy by Household Size in Hard Rock
| Household Size | # Housing Units | % Housing Units |
| 1-Person Household | 10 | 40.0% |
| 2-Person Household | 0 | 0.0% |
| 3-Person Household | 3 | 12.0% |
| 4+ Person Household | 12 | 48.0% |
| Total Housing Units | 25 | 100.0% |
Occupancy by Ownership by Household Size in Hard Rock
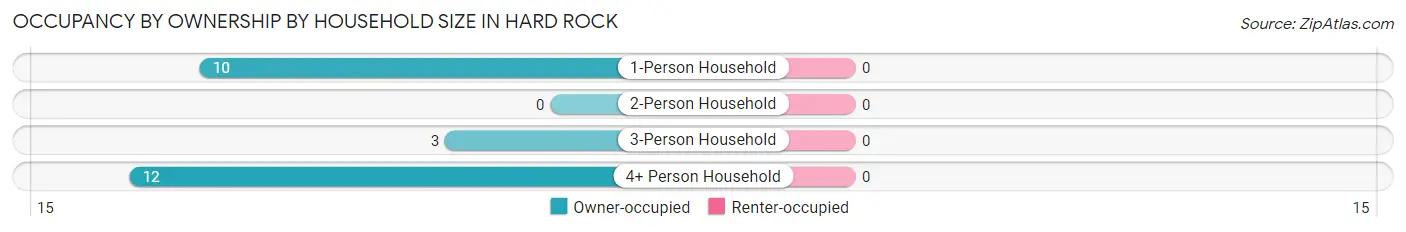
| Household Size | Owner-occupied | Renter-occupied |
| 1-Person Household | 10 (100.0%) | 0 (0.0%) |
| 2-Person Household | 0 (0.0%) | 0 (0.0%) |
| 3-Person Household | 3 (100.0%) | 0 (0.0%) |
| 4+ Person Household | 12 (100.0%) | 0 (0.0%) |
| Total Housing Units | 25 (100.0%) | 0 (0.0%) |
Occupancy by Educational Attainment in Hard Rock
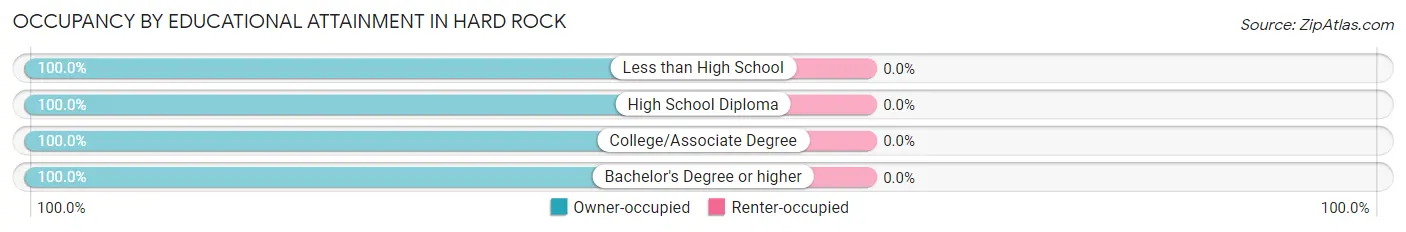
| Household Size | Owner-occupied | Renter-occupied |
| Less than High School | 3 (100.0%) | 0 (0.0%) |
| High School Diploma | 8 (100.0%) | 0 (0.0%) |
| College/Associate Degree | 9 (100.0%) | 0 (0.0%) |
| Bachelor's Degree or higher | 5 (100.0%) | 0 (0.0%) |
Occupancy by Age of Householder in Hard Rock
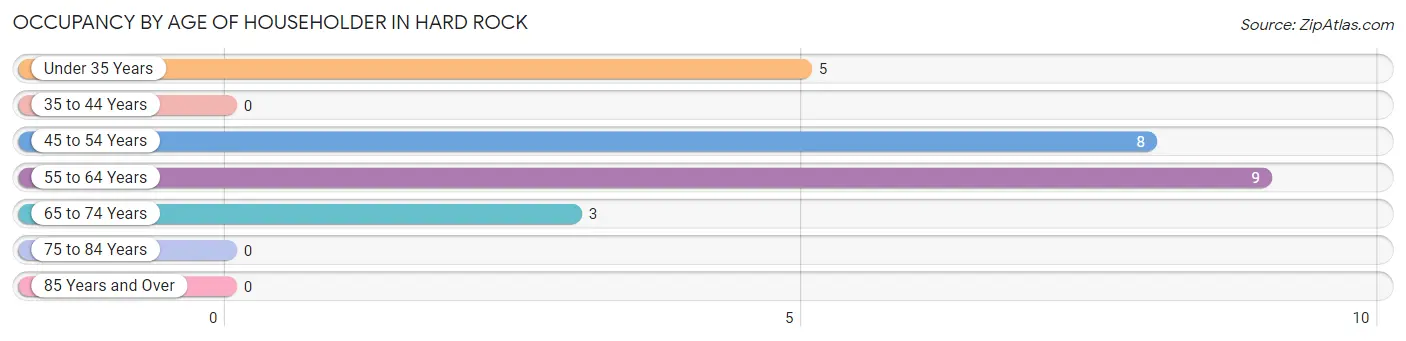
| Age Bracket | # Households | % Households |
| Under 35 Years | 5 | 20.0% |
| 35 to 44 Years | 0 | 0.0% |
| 45 to 54 Years | 8 | 32.0% |
| 55 to 64 Years | 9 | 36.0% |
| 65 to 74 Years | 3 | 12.0% |
| 75 to 84 Years | 0 | 0.0% |
| 85 Years and Over | 0 | 0.0% |
| Total | 25 | 100.0% |
Housing Finances in Hard Rock
Median Income by Occupancy in Hard Rock
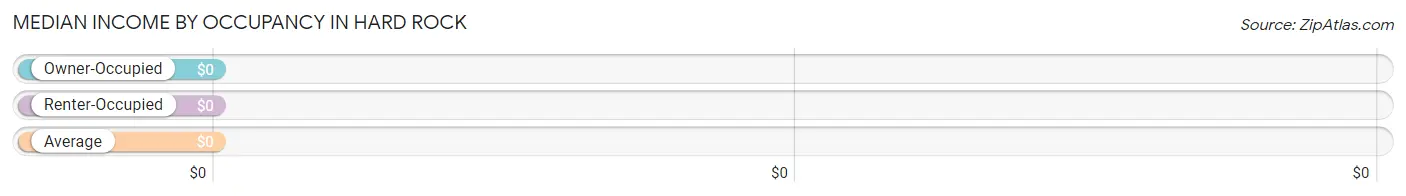
| Occupancy Type | # Households | Median Income |
| Owner-Occupied | 25 (100.0%) | $0 |
| Renter-Occupied | 0 (0.0%) | $0 |
| Average | 25 (100.0%) | $0 |
Occupancy by Householder Income Bracket in Hard Rock
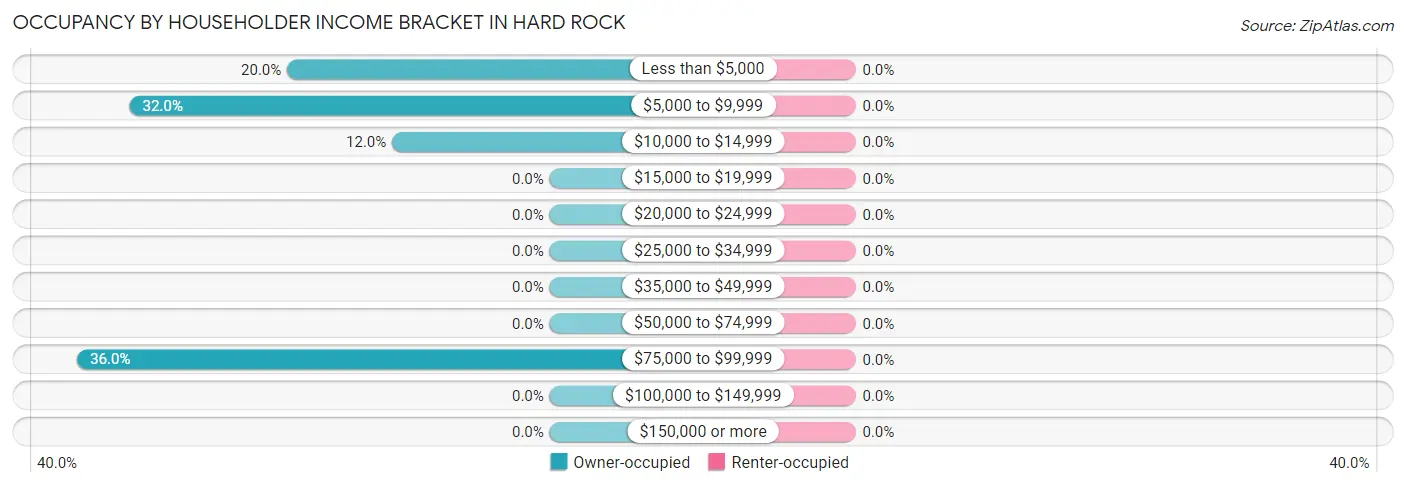
| Income Bracket | Owner-occupied | Renter-occupied |
| Less than $5,000 | 5 (20.0%) | 0 (0.0%) |
| $5,000 to $9,999 | 8 (32.0%) | 0 (0.0%) |
| $10,000 to $14,999 | 3 (12.0%) | 0 (0.0%) |
| $15,000 to $19,999 | 0 (0.0%) | 0 (0.0%) |
| $20,000 to $24,999 | 0 (0.0%) | 0 (0.0%) |
| $25,000 to $34,999 | 0 (0.0%) | 0 (0.0%) |
| $35,000 to $49,999 | 0 (0.0%) | 0 (0.0%) |
| $50,000 to $74,999 | 0 (0.0%) | 0 (0.0%) |
| $75,000 to $99,999 | 9 (36.0%) | 0 (0.0%) |
| $100,000 to $149,999 | 0 (0.0%) | 0 (0.0%) |
| $150,000 or more | 0 (0.0%) | 0 (0.0%) |
| Total | 25 (100.0%) | 0 (0.0%) |
Monthly Housing Cost Tiers in Hard Rock
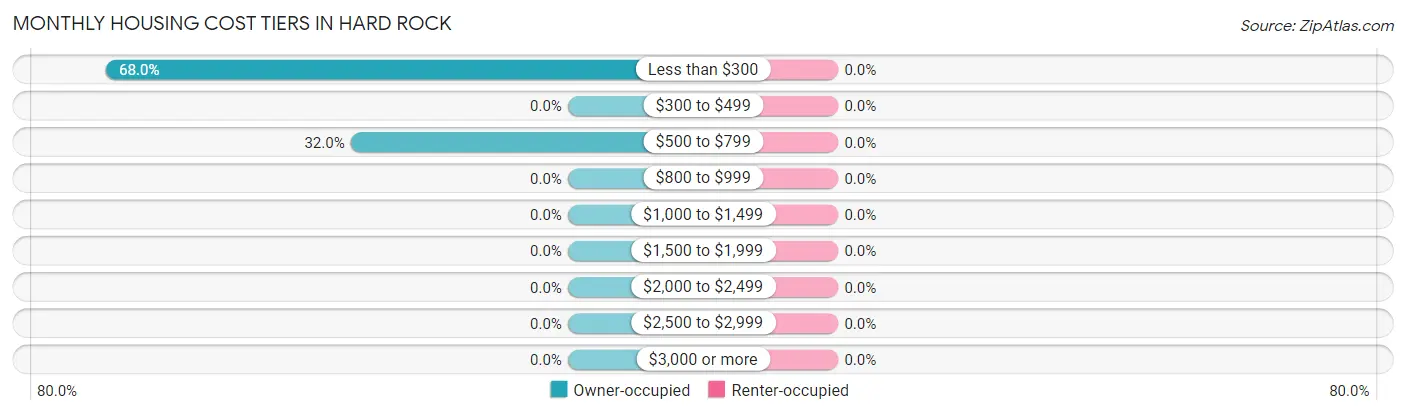
| Monthly Cost | Owner-occupied | Renter-occupied |
| Less than $300 | 17 (68.0%) | 0 (0.0%) |
| $300 to $499 | 0 (0.0%) | 0 (0.0%) |
| $500 to $799 | 8 (32.0%) | 0 (0.0%) |
| $800 to $999 | 0 (0.0%) | 0 (0.0%) |
| $1,000 to $1,499 | 0 (0.0%) | 0 (0.0%) |
| $1,500 to $1,999 | 0 (0.0%) | 0 (0.0%) |
| $2,000 to $2,499 | 0 (0.0%) | 0 (0.0%) |
| $2,500 to $2,999 | 0 (0.0%) | 0 (0.0%) |
| $3,000 or more | 0 (0.0%) | 0 (0.0%) |
| Total | 25 (100.0%) | 0 (0.0%) |
Physical Housing Characteristics in Hard Rock
Housing Structures in Hard Rock
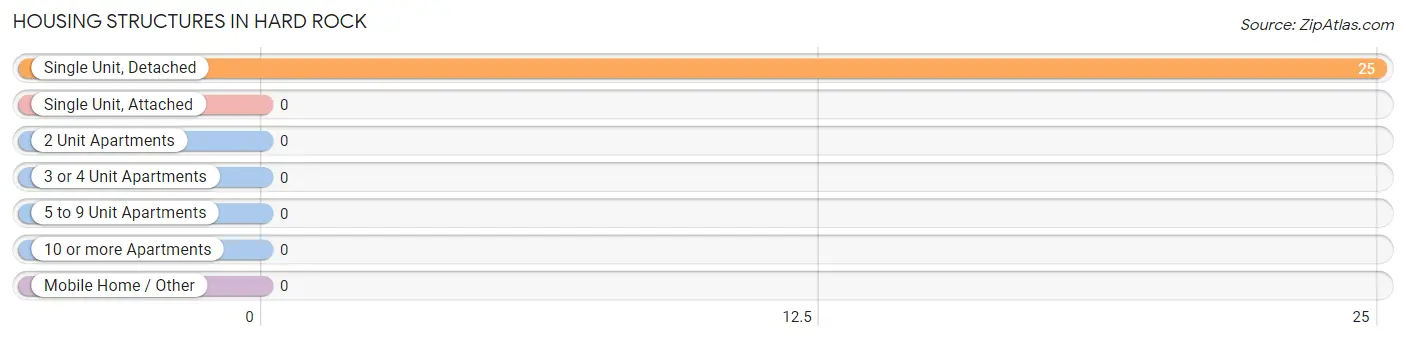
| Structure Type | # Housing Units | % Housing Units |
| Single Unit, Detached | 25 | 100.0% |
| Single Unit, Attached | 0 | 0.0% |
| 2 Unit Apartments | 0 | 0.0% |
| 3 or 4 Unit Apartments | 0 | 0.0% |
| 5 to 9 Unit Apartments | 0 | 0.0% |
| 10 or more Apartments | 0 | 0.0% |
| Mobile Home / Other | 0 | 0.0% |
| Total | 25 | 100.0% |
Housing Structures by Occupancy in Hard Rock
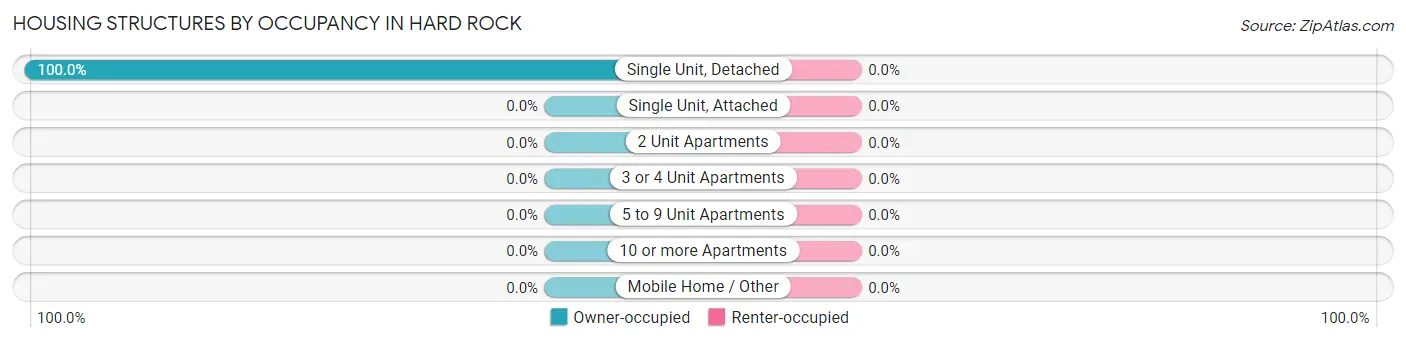
| Structure Type | Owner-occupied | Renter-occupied |
| Single Unit, Detached | 25 (100.0%) | 0 (0.0%) |
| Single Unit, Attached | 0 (0.0%) | 0 (0.0%) |
| 2 Unit Apartments | 0 (0.0%) | 0 (0.0%) |
| 3 or 4 Unit Apartments | 0 (0.0%) | 0 (0.0%) |
| 5 to 9 Unit Apartments | 0 (0.0%) | 0 (0.0%) |
| 10 or more Apartments | 0 (0.0%) | 0 (0.0%) |
| Mobile Home / Other | 0 (0.0%) | 0 (0.0%) |
| Total | 25 (100.0%) | 0 (0.0%) |
Housing Structures by Number of Rooms in Hard Rock
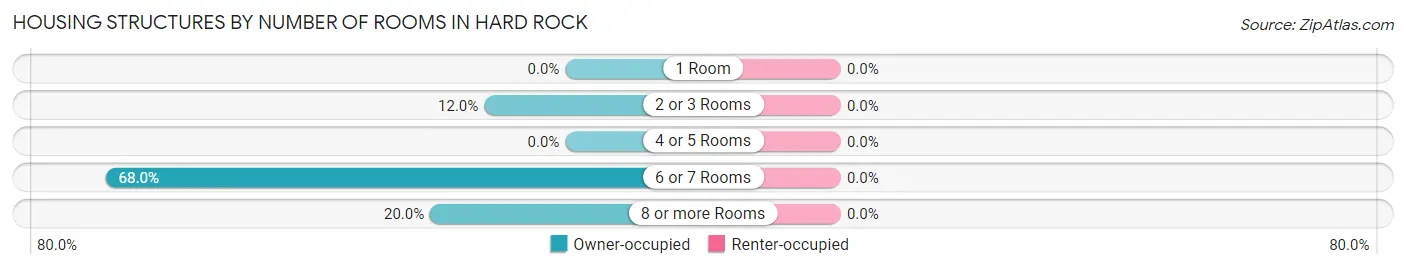
| Number of Rooms | Owner-occupied | Renter-occupied |
| 1 Room | 0 (0.0%) | 0 (0.0%) |
| 2 or 3 Rooms | 3 (12.0%) | 0 (0.0%) |
| 4 or 5 Rooms | 0 (0.0%) | 0 (0.0%) |
| 6 or 7 Rooms | 17 (68.0%) | 0 (0.0%) |
| 8 or more Rooms | 5 (20.0%) | 0 (0.0%) |
| Total | 25 (100.0%) | 0 (0.0%) |
Housing Structure by Heating Type in Hard Rock
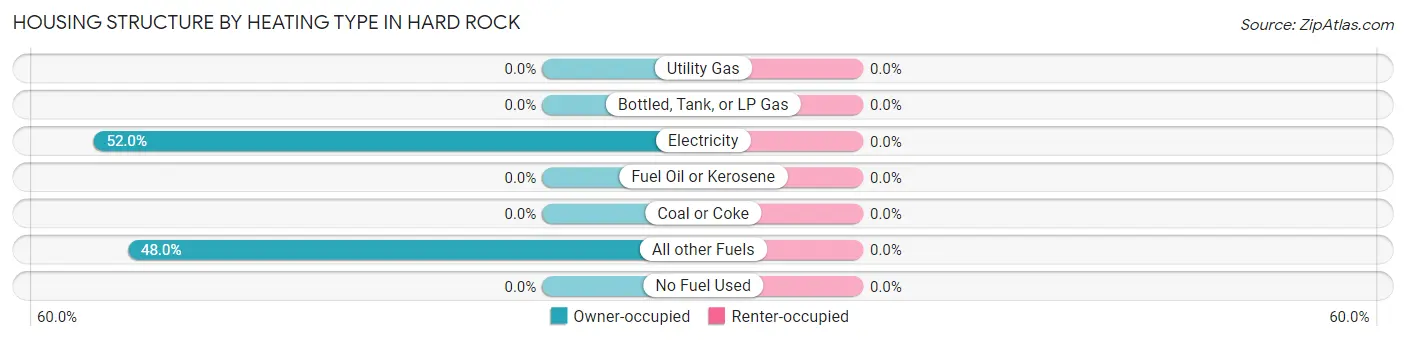
| Heating Type | Owner-occupied | Renter-occupied |
| Utility Gas | 0 (0.0%) | 0 (0.0%) |
| Bottled, Tank, or LP Gas | 0 (0.0%) | 0 (0.0%) |
| Electricity | 13 (52.0%) | 0 (0.0%) |
| Fuel Oil or Kerosene | 0 (0.0%) | 0 (0.0%) |
| Coal or Coke | 0 (0.0%) | 0 (0.0%) |
| All other Fuels | 12 (48.0%) | 0 (0.0%) |
| No Fuel Used | 0 (0.0%) | 0 (0.0%) |
| Total | 25 (100.0%) | 0 (0.0%) |
Household Vehicle Usage in Hard Rock
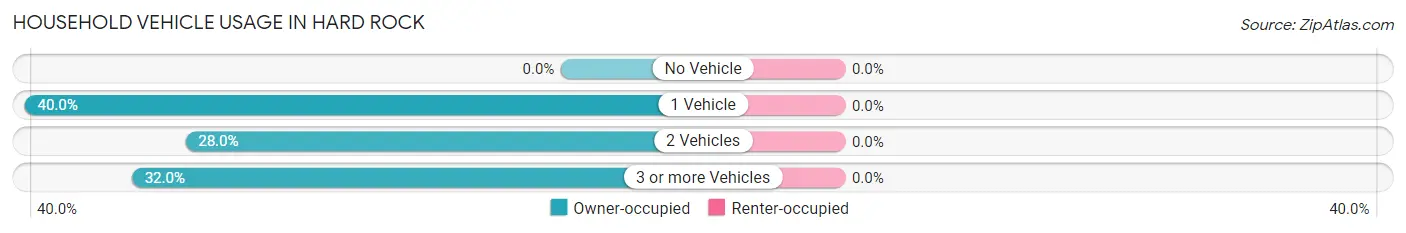
| Vehicles per Household | Owner-occupied | Renter-occupied |
| No Vehicle | 0 (0.0%) | 0 (0.0%) |
| 1 Vehicle | 10 (40.0%) | 0 (0.0%) |
| 2 Vehicles | 7 (28.0%) | 0 (0.0%) |
| 3 or more Vehicles | 8 (32.0%) | 0 (0.0%) |
| Total | 25 (100.0%) | 0 (0.0%) |
Real Estate & Mortgages in Hard Rock
Real Estate and Mortgage Overview in Hard Rock
| Characteristic | Without Mortgage | With Mortgage |
| Housing Units | 25 | 0 |
| Median Property Value | $176,300 | $0 |
| Median Household Income | - | - |
| Monthly Housing Costs | - | - |
| Real Estate Taxes | - | - |
Property Value by Mortgage Status in Hard Rock
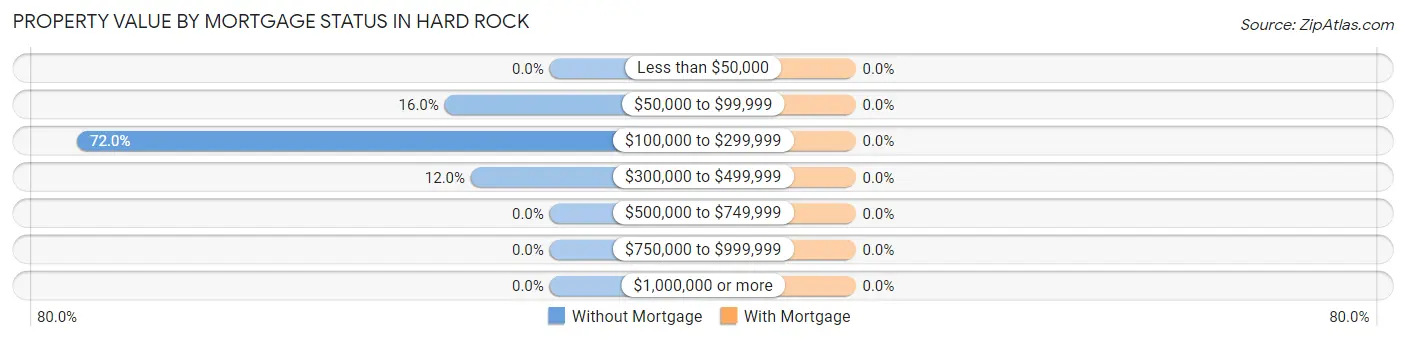
| Property Value | Without Mortgage | With Mortgage |
| Less than $50,000 | 0 (0.0%) | 0 (0.0%) |
| $50,000 to $99,999 | 4 (16.0%) | 0 (0.0%) |
| $100,000 to $299,999 | 18 (72.0%) | 0 (0.0%) |
| $300,000 to $499,999 | 3 (12.0%) | 0 (0.0%) |
| $500,000 to $749,999 | 0 (0.0%) | 0 (0.0%) |
| $750,000 to $999,999 | 0 (0.0%) | 0 (0.0%) |
| $1,000,000 or more | 0 (0.0%) | 0 (0.0%) |
| Total | 25 (100.0%) | 0 (0.0%) |
Household Income by Mortgage Status in Hard Rock
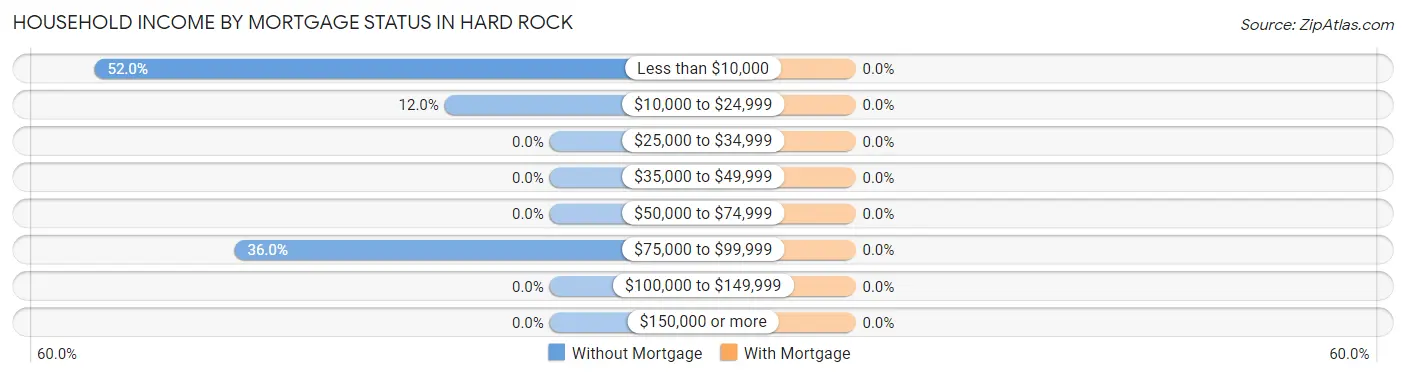
| Household Income | Without Mortgage | With Mortgage |
| Less than $10,000 | 13 (52.0%) | 0 (0.0%) |
| $10,000 to $24,999 | 3 (12.0%) | 0 (0.0%) |
| $25,000 to $34,999 | 0 (0.0%) | 0 (0.0%) |
| $35,000 to $49,999 | 0 (0.0%) | 0 (0.0%) |
| $50,000 to $74,999 | 0 (0.0%) | 0 (0.0%) |
| $75,000 to $99,999 | 9 (36.0%) | 0 (0.0%) |
| $100,000 to $149,999 | 0 (0.0%) | 0 (0.0%) |
| $150,000 or more | 0 (0.0%) | 0 (0.0%) |
| Total | 25 (100.0%) | 0 (0.0%) |
Property Value to Household Income Ratio in Hard Rock
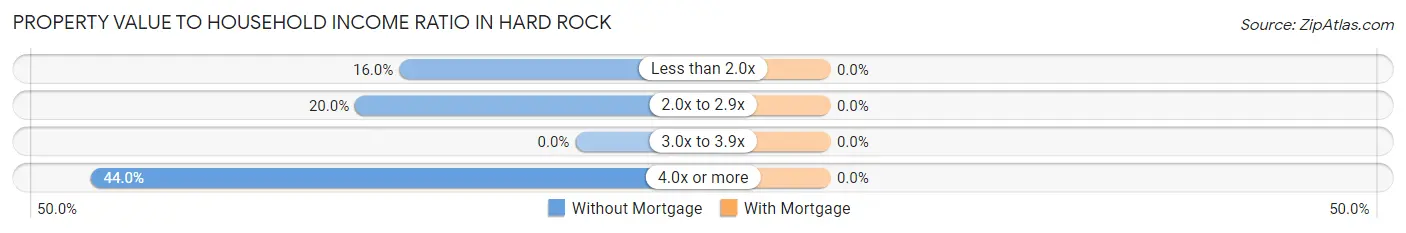
| Value-to-Income Ratio | Without Mortgage | With Mortgage |
| Less than 2.0x | 4 (16.0%) | 0 (0.0%) |
| 2.0x to 2.9x | 5 (20.0%) | 0 (0.0%) |
| 3.0x to 3.9x | 0 (0.0%) | 0 (0.0%) |
| 4.0x or more | 11 (44.0%) | 0 (0.0%) |
| Total | 25 (100.0%) | 0 (0.0%) |
Real Estate Taxes by Mortgage Status in Hard Rock
| Property Taxes | Without Mortgage | With Mortgage |
| Less than $800 | 0 (0.0%) | 0 (0.0%) |
| $800 to $1,499 | 0 (0.0%) | 0 (0.0%) |
| $800 to $1,499 | 0 (0.0%) | 0 (0.0%) |
| Total | 25 (100.0%) | 0 (0.0%) |
Health & Disability in Hard Rock
Health Insurance Coverage by Age in Hard Rock
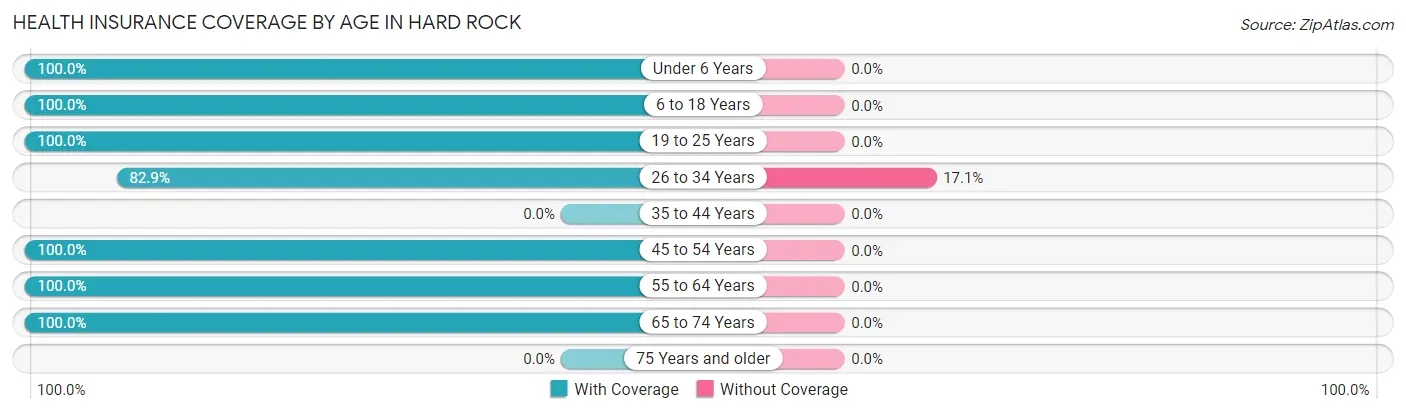
| Age Bracket | With Coverage | Without Coverage |
| Under 6 Years | 5 (100.0%) | 0 (0.0%) |
| 6 to 18 Years | 22 (100.0%) | 0 (0.0%) |
| 19 to 25 Years | 22 (100.0%) | 0 (0.0%) |
| 26 to 34 Years | 29 (82.9%) | 6 (17.1%) |
| 35 to 44 Years | 0 (0.0%) | 0 (0.0%) |
| 45 to 54 Years | 12 (100.0%) | 0 (0.0%) |
| 55 to 64 Years | 19 (100.0%) | 0 (0.0%) |
| 65 to 74 Years | 3 (100.0%) | 0 (0.0%) |
| 75 Years and older | 0 (0.0%) | 0 (0.0%) |
| Total | 112 (94.9%) | 6 (5.1%) |
Health Insurance Coverage by Citizenship Status in Hard Rock
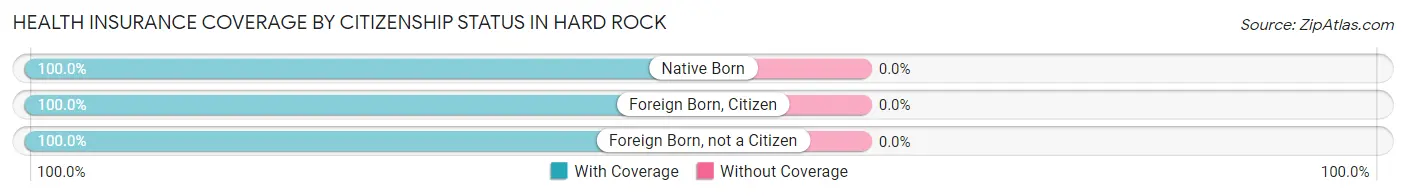
| Citizenship Status | With Coverage | Without Coverage |
| Native Born | 5 (100.0%) | 0 (0.0%) |
| Foreign Born, Citizen | 22 (100.0%) | 0 (0.0%) |
| Foreign Born, not a Citizen | 22 (100.0%) | 0 (0.0%) |
Health Insurance Coverage by Household Income in Hard Rock
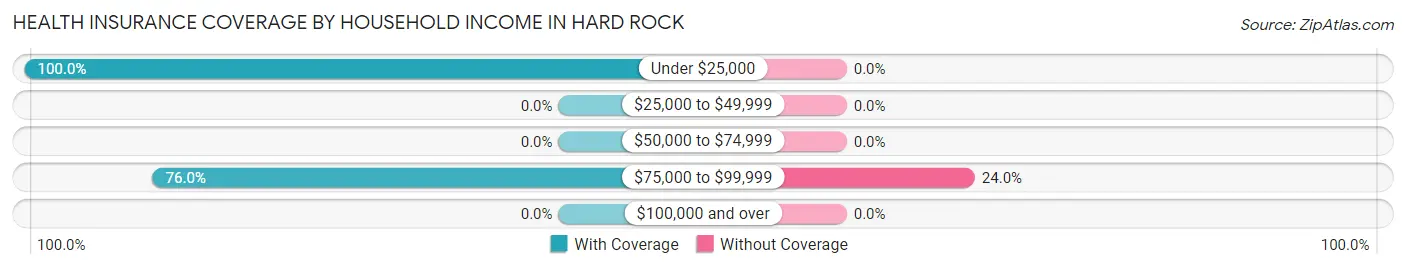
| Household Income | With Coverage | Without Coverage |
| Under $25,000 | 93 (100.0%) | 0 (0.0%) |
| $25,000 to $49,999 | 0 (0.0%) | 0 (0.0%) |
| $50,000 to $74,999 | 0 (0.0%) | 0 (0.0%) |
| $75,000 to $99,999 | 19 (76.0%) | 6 (24.0%) |
| $100,000 and over | 0 (0.0%) | 0 (0.0%) |
Public vs Private Health Insurance Coverage by Age in Hard Rock
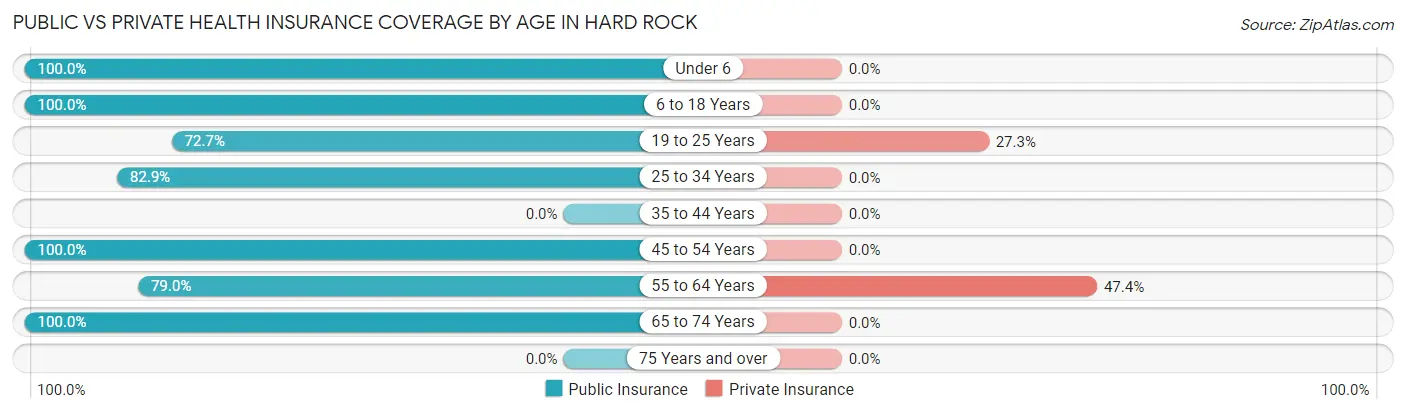
| Age Bracket | Public Insurance | Private Insurance |
| Under 6 | 5 (100.0%) | 0 (0.0%) |
| 6 to 18 Years | 22 (100.0%) | 0 (0.0%) |
| 19 to 25 Years | 16 (72.7%) | 6 (27.3%) |
| 25 to 34 Years | 29 (82.9%) | 0 (0.0%) |
| 35 to 44 Years | 0 (0.0%) | 0 (0.0%) |
| 45 to 54 Years | 12 (100.0%) | 0 (0.0%) |
| 55 to 64 Years | 15 (78.9%) | 9 (47.4%) |
| 65 to 74 Years | 3 (100.0%) | 0 (0.0%) |
| 75 Years and over | 0 (0.0%) | 0 (0.0%) |
| Total | 102 (86.4%) | 15 (12.7%) |
Disability Status by Sex by Age in Hard Rock
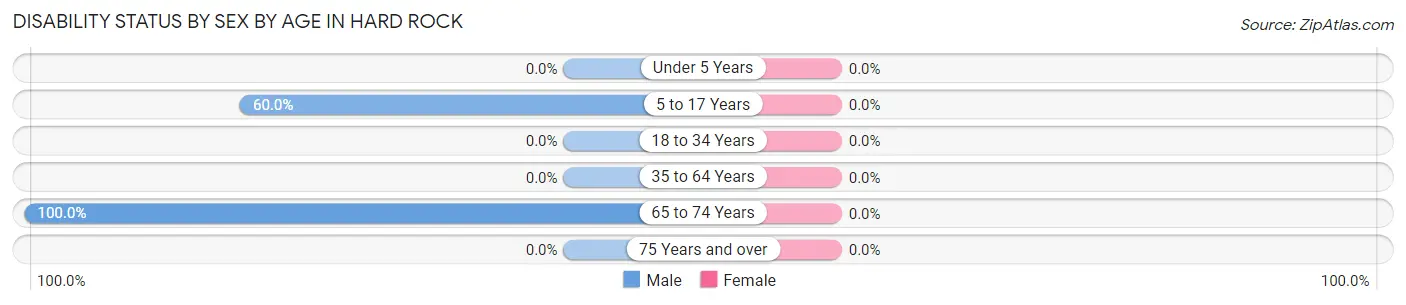
| Age Bracket | Male | Female |
| Under 5 Years | 0 (0.0%) | 0 (0.0%) |
| 5 to 17 Years | 6 (60.0%) | 0 (0.0%) |
| 18 to 34 Years | 0 (0.0%) | 0 (0.0%) |
| 35 to 64 Years | 0 (0.0%) | 0 (0.0%) |
| 65 to 74 Years | 3 (100.0%) | 0 (0.0%) |
| 75 Years and over | 0 (0.0%) | 0 (0.0%) |
Disability Class by Sex by Age in Hard Rock
Disability Class: Hearing Difficulty
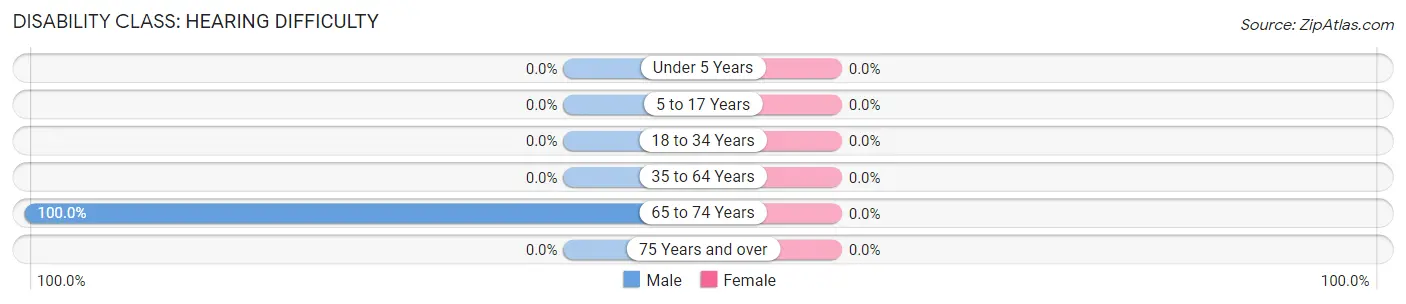
| Age Bracket | Male | Female |
| Under 5 Years | 0 (0.0%) | 0 (0.0%) |
| 5 to 17 Years | 0 (0.0%) | 0 (0.0%) |
| 18 to 34 Years | 0 (0.0%) | 0 (0.0%) |
| 35 to 64 Years | 0 (0.0%) | 0 (0.0%) |
| 65 to 74 Years | 3 (100.0%) | 0 (0.0%) |
| 75 Years and over | 0 (0.0%) | 0 (0.0%) |
Disability Class: Vision Difficulty

| Age Bracket | Male | Female |
| Under 5 Years | 0 (0.0%) | 0 (0.0%) |
| 5 to 17 Years | 0 (0.0%) | 0 (0.0%) |
| 18 to 34 Years | 0 (0.0%) | 0 (0.0%) |
| 35 to 64 Years | 0 (0.0%) | 0 (0.0%) |
| 65 to 74 Years | 3 (100.0%) | 0 (0.0%) |
| 75 Years and over | 0 (0.0%) | 0 (0.0%) |
Disability Class: Cognitive Difficulty
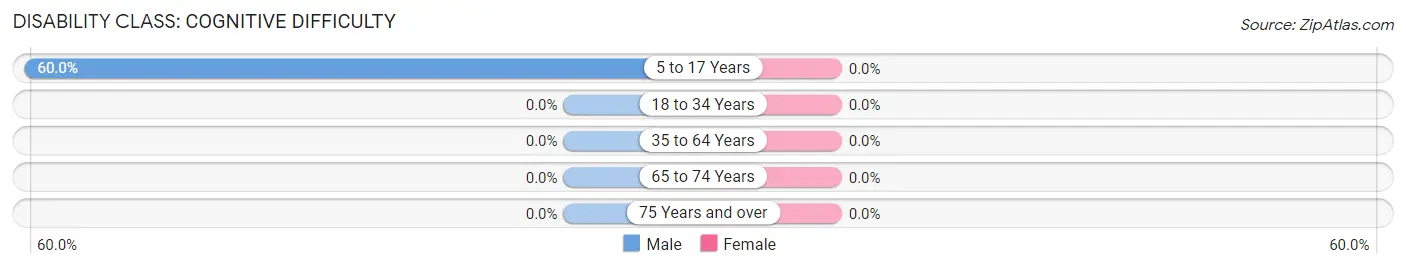
| Age Bracket | Male | Female |
| 5 to 17 Years | 6 (60.0%) | 0 (0.0%) |
| 18 to 34 Years | 0 (0.0%) | 0 (0.0%) |
| 35 to 64 Years | 0 (0.0%) | 0 (0.0%) |
| 65 to 74 Years | 0 (0.0%) | 0 (0.0%) |
| 75 Years and over | 0 (0.0%) | 0 (0.0%) |
Disability Class: Ambulatory Difficulty
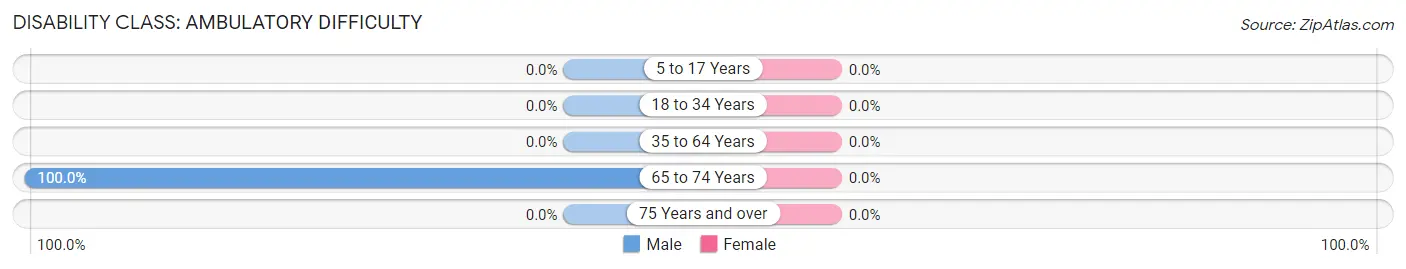
| Age Bracket | Male | Female |
| 5 to 17 Years | 0 (0.0%) | 0 (0.0%) |
| 18 to 34 Years | 0 (0.0%) | 0 (0.0%) |
| 35 to 64 Years | 0 (0.0%) | 0 (0.0%) |
| 65 to 74 Years | 3 (100.0%) | 0 (0.0%) |
| 75 Years and over | 0 (0.0%) | 0 (0.0%) |
Disability Class: Self-Care Difficulty
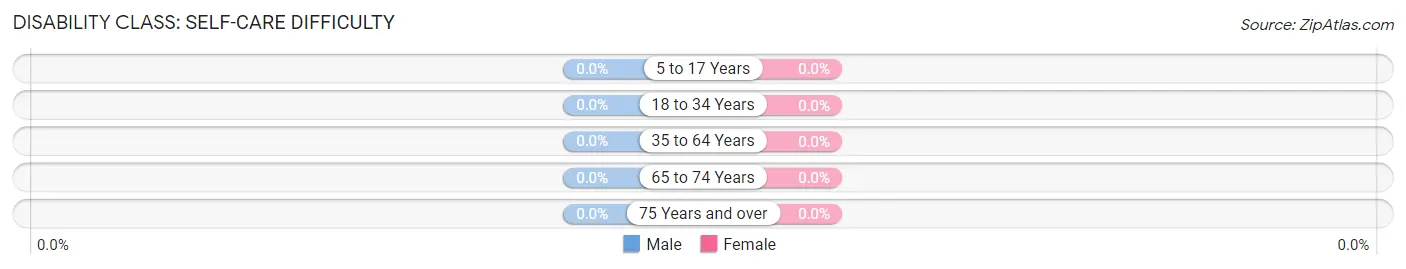
| Age Bracket | Male | Female |
| 5 to 17 Years | 0 (0.0%) | 0 (0.0%) |
| 18 to 34 Years | 0 (0.0%) | 0 (0.0%) |
| 35 to 64 Years | 0 (0.0%) | 0 (0.0%) |
| 65 to 74 Years | 0 (0.0%) | 0 (0.0%) |
| 75 Years and over | 0 (0.0%) | 0 (0.0%) |
Technology Access in Hard Rock
Computing Device Access in Hard Rock
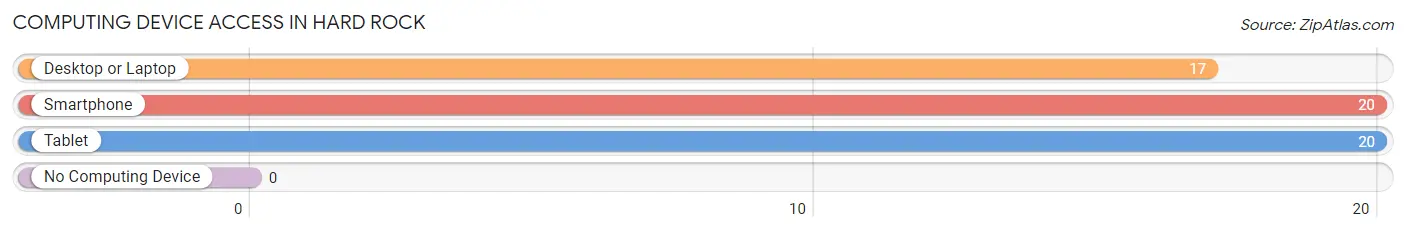
| Device Type | # Households | % Households |
| Desktop or Laptop | 17 | 68.0% |
| Smartphone | 20 | 80.0% |
| Tablet | 20 | 80.0% |
| No Computing Device | 0 | 0.0% |
| Total | 25 | 100.0% |
Internet Access in Hard Rock
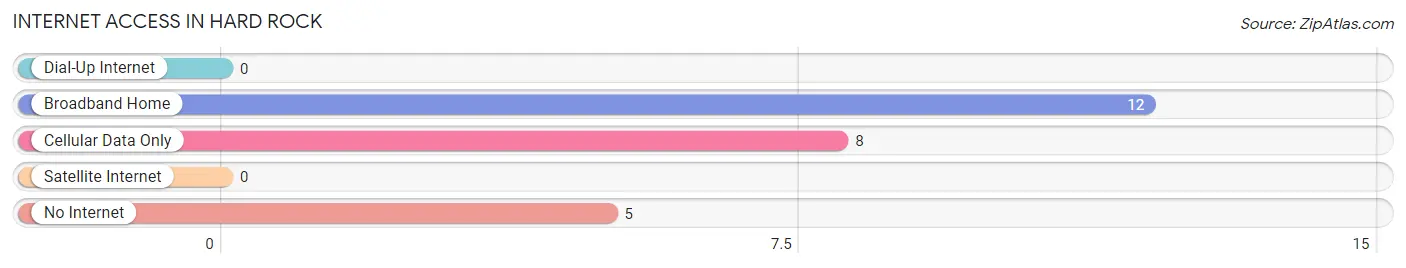
| Internet Type | # Households | % Households |
| Dial-Up Internet | 0 | 0.0% |
| Broadband Home | 12 | 48.0% |
| Cellular Data Only | 8 | 32.0% |
| Satellite Internet | 0 | 0.0% |
| No Internet | 5 | 20.0% |
| Total | 25 | 100.0% |
Hard Rock Summary
Hard Rock, Arizona is a small unincorporated community located in Apache County, Arizona. It is situated in the Navajo Nation, approximately 20 miles east of the city of Chinle. The community is located in the Chuska Mountains, near the Arizona-New Mexico border. Hard Rock is a rural, isolated community with a population of approximately 200 people.
History
Hard Rock was established in the late 1800s by Navajo families who were looking for a place to settle and raise their families. The community was named after the nearby Hard Rock Canyon, which was named for the large, hard rocks that were found in the area. The community was originally a small farming and ranching community, with the main crops being corn, beans, and squash.
In the early 1900s, the community began to grow as more families moved to the area. The community was home to a trading post, a school, and a church. The trading post was the main source of income for the community, as it provided goods and services to the local residents.
Geography
Hard Rock is located in the Chuska Mountains, which are part of the Colorado Plateau. The area is characterized by high desert terrain, with elevations ranging from 5,000 to 8,000 feet. The area is home to a variety of wildlife, including deer, elk, and antelope.
The climate in Hard Rock is semi-arid, with hot summers and cold winters. The average annual temperature is approximately 60 degrees Fahrenheit. The area receives an average of 10 inches of precipitation per year, with most of it falling in the summer months.
Economy
The economy of Hard Rock is largely based on agriculture and ranching. The main crops grown in the area are corn, beans, and squash. The community also has a small trading post, which provides goods and services to the local residents.
In recent years, the community has seen an increase in tourism, as visitors come to explore the nearby canyons and mountains. The area is also home to a number of Native American cultural sites, which attract visitors from around the world.
Demographics
As of the 2010 census, the population of Hard Rock was approximately 200 people. The population is primarily Native American, with the majority of the population being Navajo. The median household income in the community is approximately $20,000 per year.
Conclusion
Hard Rock, Arizona is a small, rural community located in Apache County, Arizona. The community was established in the late 1800s by Navajo families and has since grown to a population of approximately 200 people. The economy of the community is largely based on agriculture and ranching, with a small trading post providing goods and services to the local residents. The population is primarily Native American, with the majority of the population being Navajo. The area is also home to a number of Native American cultural sites, which attract visitors from around the world.
Common Questions
What is Per Capita Income in Hard Rock?
Per Capita income in Hard Rock is $7,080.
What is Inequality or Gini Index in Hard Rock?
Inequality or Gini Index in Hard Rock is 0.53.
What is the Total Population of Hard Rock?
Total Population of Hard Rock is 118.
What is the Total Male Population of Hard Rock?
Total Male Population of Hard Rock is 61.
What is the Total Female Population of Hard Rock?
Total Female Population of Hard Rock is 57.
What is the Ratio of Males per 100 Females in Hard Rock?
There are 107.02 Males per 100 Females in Hard Rock.
What is the Ratio of Females per 100 Males in Hard Rock?
There are 93.44 Females per 100 Males in Hard Rock.
What is the Median Population Age in Hard Rock?
Median Population Age in Hard Rock is 26.8 Years.
What is the Average Family Size in Hard Rock
Average Family Size in Hard Rock is 7.2 People.
What is the Average Household Size in Hard Rock
Average Household Size in Hard Rock is 4.7 People.
How Large is the Labor Force in Hard Rock?
There are 11 People in the Labor Forcein in Hard Rock.
What is the Percentage of People in the Labor Force in Hard Rock?
12.1% of People are in the Labor Force in Hard Rock.
What is the Unemployment Rate in Hard Rock?
Unemployment Rate in Hard Rock is 18.2%.