Santa Rosa, AZ Map & Demographics
Santa Rosa Map
Santa Rosa Overview
$14,178
PER CAPITA INCOME
$51,500
AVG FAMILY INCOME
$50,500
AVG HOUSEHOLD INCOME
53.6%
WAGE / INCOME GAP [ % ]
46.4¢/ $1
WAGE / INCOME GAP [ $ ]
0.47
INEQUALITY / GINI INDEX
749
TOTAL POPULATION
341
MALE POPULATION
408
FEMALE POPULATION
83.58
MALES / 100 FEMALES
119.65
FEMALES / 100 MALES
33.2
MEDIAN AGE
5.0
AVG FAMILY SIZE
4.9
AVG HOUSEHOLD SIZE
215
LABOR FORCE [ PEOPLE ]
37.3%
PERCENT IN LABOR FORCE
12.1%
UNEMPLOYMENT RATE
Income in Santa Rosa
Income Overview in Santa Rosa
Per Capita Income in Santa Rosa is $14,178, while median incomes of families and households are $51,500 and $50,500 respectively.
| Characteristic | Number | Measure |
| Per Capita Income | 749 | $14,178 |
| Median Family Income | 134 | $51,500 |
| Mean Family Income | 134 | $64,924 |
| Median Household Income | 154 | $50,500 |
| Mean Household Income | 154 | $62,310 |
| Income Deficit | 134 | $0 |
| Wage / Income Gap (%) | 749 | 53.65% |
| Wage / Income Gap ($) | 749 | 46.35¢ per $1 |
| Gini / Inequality Index | 749 | 0.47 |
Earnings by Sex in Santa Rosa
Average Earnings in Santa Rosa are $27,708, $15,875 for men and $34,250 for women, a difference of 53.6%.
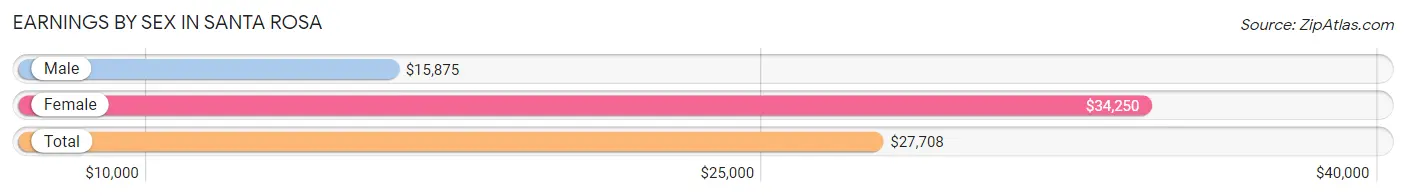
| Sex | Number | Average Earnings |
| Male | 77 (37.0%) | $15,875 |
| Female | 131 (63.0%) | $34,250 |
| Total | 208 (100.0%) | $27,708 |
Earnings by Sex by Income Bracket in Santa Rosa
The most common earnings brackets in Santa Rosa are $100,000+ for men (17 | 22.1%) and $45,000 to $49,999 for women (27 | 20.6%).
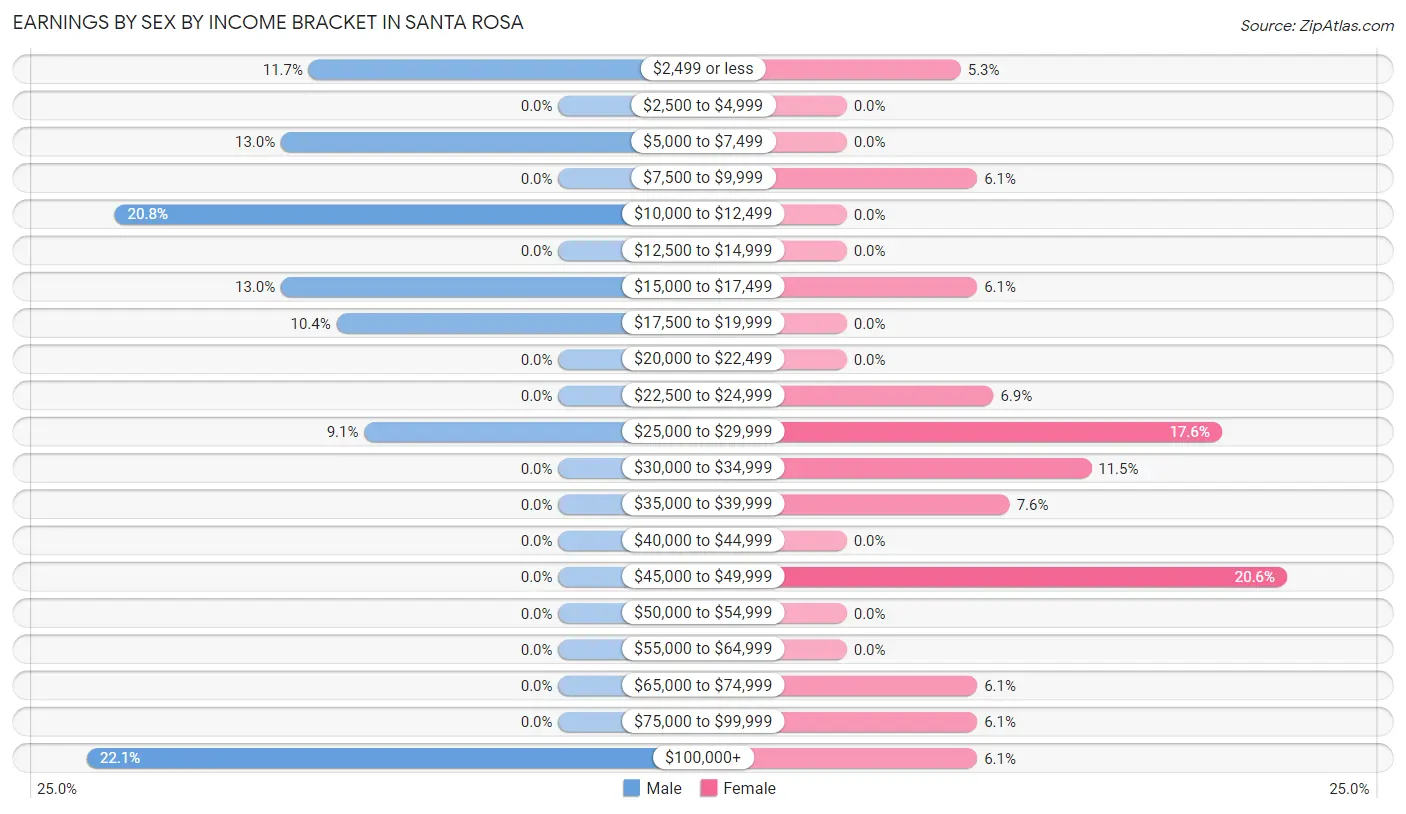
| Income | Male | Female |
| $2,499 or less | 9 (11.7%) | 7 (5.3%) |
| $2,500 to $4,999 | 0 (0.0%) | 0 (0.0%) |
| $5,000 to $7,499 | 10 (13.0%) | 0 (0.0%) |
| $7,500 to $9,999 | 0 (0.0%) | 8 (6.1%) |
| $10,000 to $12,499 | 16 (20.8%) | 0 (0.0%) |
| $12,500 to $14,999 | 0 (0.0%) | 0 (0.0%) |
| $15,000 to $17,499 | 10 (13.0%) | 8 (6.1%) |
| $17,500 to $19,999 | 8 (10.4%) | 0 (0.0%) |
| $20,000 to $22,499 | 0 (0.0%) | 0 (0.0%) |
| $22,500 to $24,999 | 0 (0.0%) | 9 (6.9%) |
| $25,000 to $29,999 | 7 (9.1%) | 23 (17.6%) |
| $30,000 to $34,999 | 0 (0.0%) | 15 (11.5%) |
| $35,000 to $39,999 | 0 (0.0%) | 10 (7.6%) |
| $40,000 to $44,999 | 0 (0.0%) | 0 (0.0%) |
| $45,000 to $49,999 | 0 (0.0%) | 27 (20.6%) |
| $50,000 to $54,999 | 0 (0.0%) | 0 (0.0%) |
| $55,000 to $64,999 | 0 (0.0%) | 0 (0.0%) |
| $65,000 to $74,999 | 0 (0.0%) | 8 (6.1%) |
| $75,000 to $99,999 | 0 (0.0%) | 8 (6.1%) |
| $100,000+ | 17 (22.1%) | 8 (6.1%) |
| Total | 77 (100.0%) | 131 (100.0%) |
Earnings by Sex by Educational Attainment in Santa Rosa
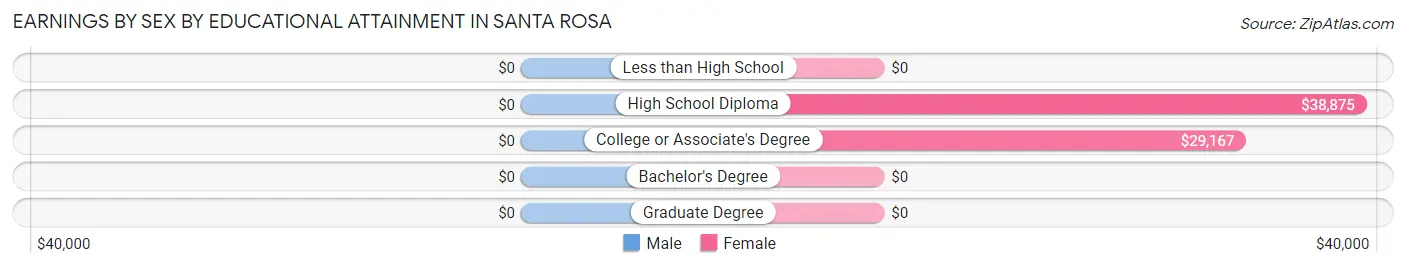
| Educational Attainment | Male Income | Female Income |
| Less than High School | - | - |
| High School Diploma | - | - |
| College or Associate's Degree | - | - |
| Bachelor's Degree | - | - |
| Graduate Degree | - | - |
| Total | $15,875 | $34,250 |
Family Income in Santa Rosa
Family Income Brackets in Santa Rosa
According to the Santa Rosa family income data, there are 28 families falling into the less than $10,000 income range, which is the most common income bracket and makes up 20.9% of all families.
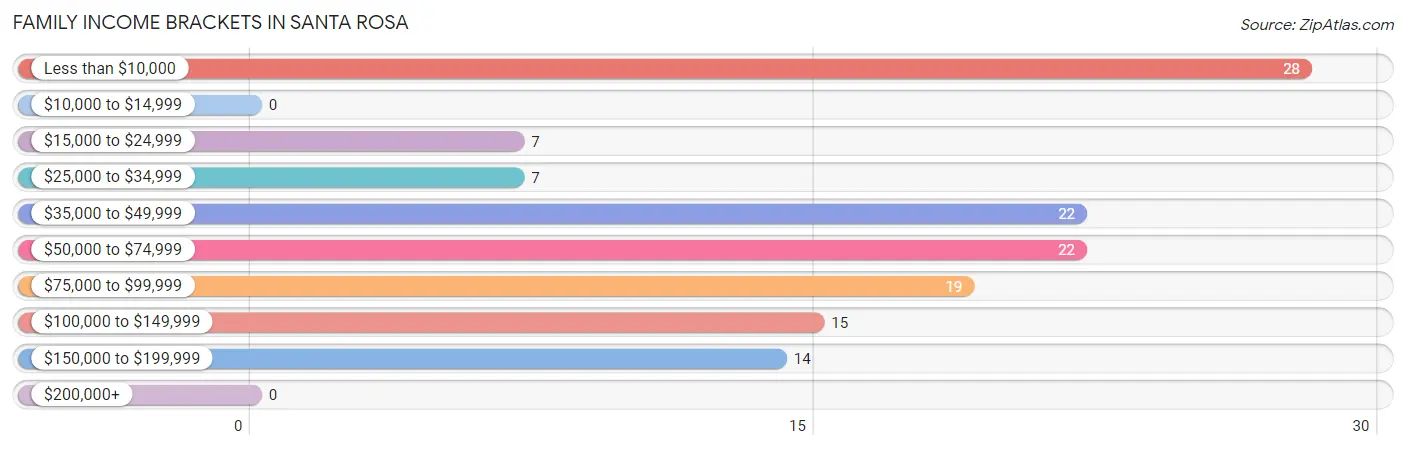
| Income Bracket | # Families | % Families |
| Less than $10,000 | 28 | 20.9% |
| $10,000 to $14,999 | 0 | 0.0% |
| $15,000 to $24,999 | 7 | 5.2% |
| $25,000 to $34,999 | 7 | 5.2% |
| $35,000 to $49,999 | 22 | 16.4% |
| $50,000 to $74,999 | 22 | 16.4% |
| $75,000 to $99,999 | 19 | 14.2% |
| $100,000 to $149,999 | 15 | 11.2% |
| $150,000 to $199,999 | 14 | 10.4% |
| $200,000+ | 0 | 0.0% |
Family Income by Famaliy Size in Santa Rosa
7+ person families (21 | 15.7%) account for the highest median family income in Santa Rosa with $126,719 per family, while 7+ person families (21 | 15.7%) have the highest median income of $18,103 per family member.
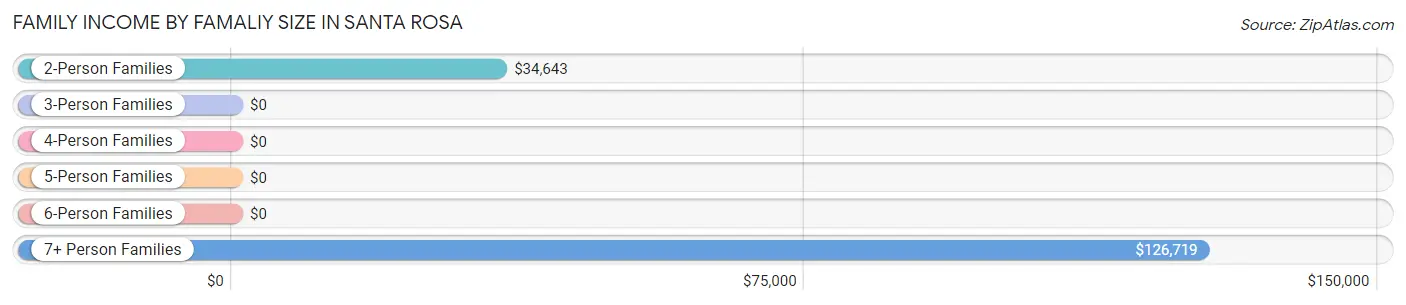
| Income Bracket | # Families | Median Income |
| 2-Person Families | 34 (25.4%) | $34,643 |
| 3-Person Families | 24 (17.9%) | $0 |
| 4-Person Families | 15 (11.2%) | $0 |
| 5-Person Families | 33 (24.6%) | $0 |
| 6-Person Families | 7 (5.2%) | $0 |
| 7+ Person Families | 21 (15.7%) | $126,719 |
| Total | 134 (100.0%) | $51,500 |
Family Income by Number of Earners in Santa Rosa
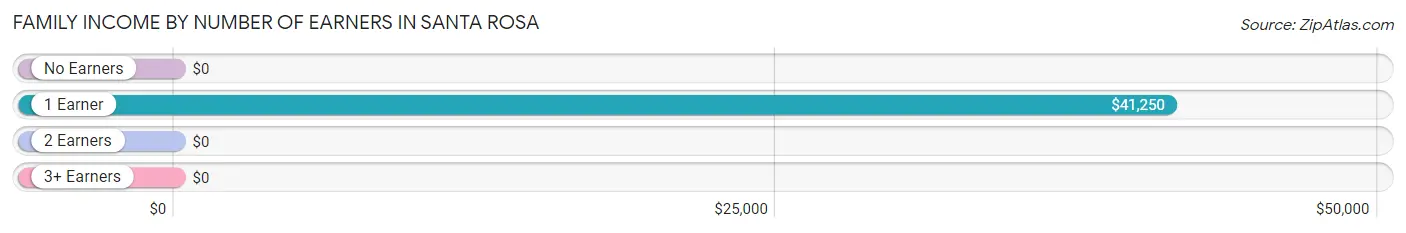
| Number of Earners | # Families | Median Income |
| No Earners | 26 (19.4%) | $0 |
| 1 Earner | 56 (41.8%) | $41,250 |
| 2 Earners | 44 (32.8%) | $0 |
| 3+ Earners | 8 (6.0%) | $0 |
| Total | 134 (100.0%) | $51,500 |
Household Income in Santa Rosa
Household Income Brackets in Santa Rosa
With 35 households falling in the category, the $75,000 to $99,999 income range is the most frequent in Santa Rosa, accounting for 22.7% of all households.
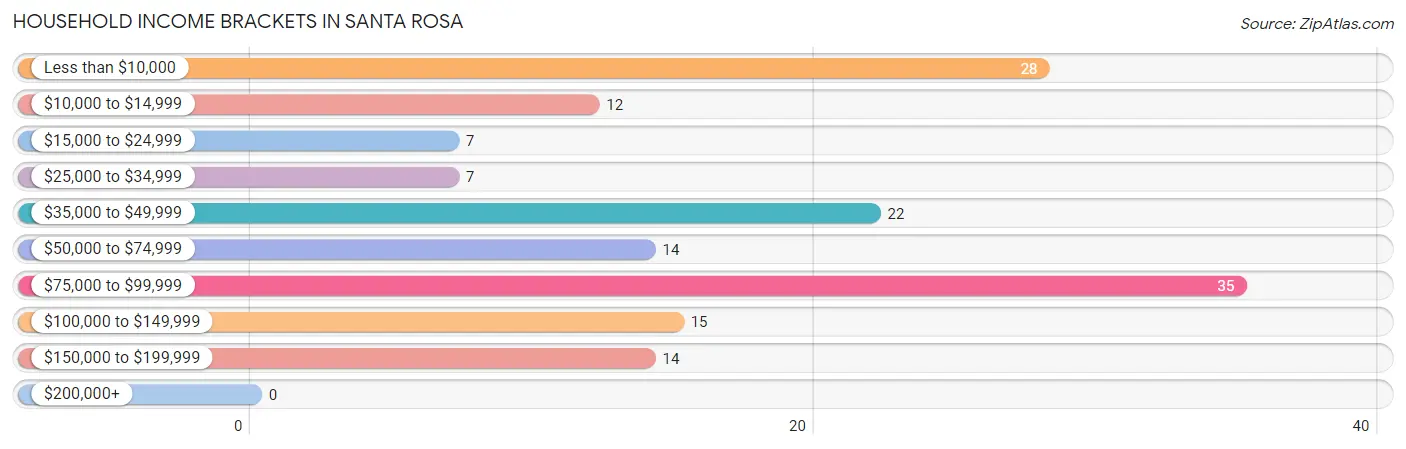
| Income Bracket | # Households | % Households |
| Less than $10,000 | 28 | 18.2% |
| $10,000 to $14,999 | 12 | 7.8% |
| $15,000 to $24,999 | 7 | 4.5% |
| $25,000 to $34,999 | 7 | 4.5% |
| $35,000 to $49,999 | 22 | 14.3% |
| $50,000 to $74,999 | 14 | 9.1% |
| $75,000 to $99,999 | 35 | 22.7% |
| $100,000 to $149,999 | 15 | 9.7% |
| $150,000 to $199,999 | 14 | 9.1% |
| $200,000+ | 0 | 0.0% |
Household Income by Householder Age in Santa Rosa
The median household income in Santa Rosa is $50,500, with the highest median household income of $75,324 found in the 65+ years age bracket for the primary householder. A total of 73 households (47.4%) fall into this category.
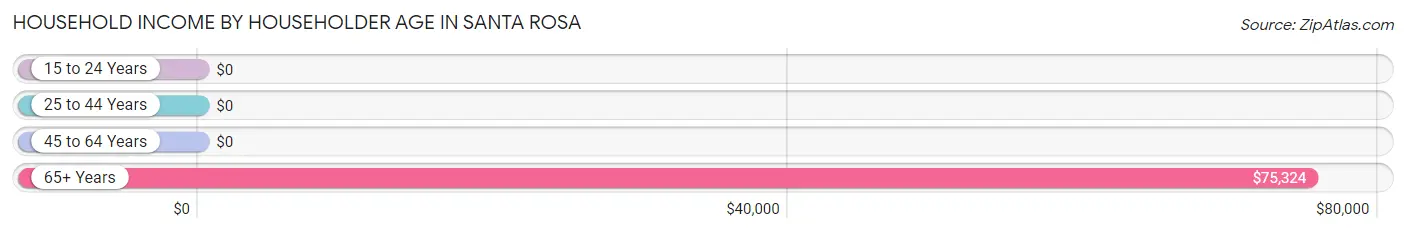
| Income Bracket | # Households | Median Income |
| 15 to 24 Years | 0 (0.0%) | $0 |
| 25 to 44 Years | 18 (11.7%) | $0 |
| 45 to 64 Years | 63 (40.9%) | $0 |
| 65+ Years | 73 (47.4%) | $75,324 |
| Total | 154 (100.0%) | $50,500 |
Poverty in Santa Rosa
Income Below Poverty by Sex and Age in Santa Rosa
With 37.5% poverty level for males and 25.0% for females among the residents of Santa Rosa, 16 and 17 year old males and under 5 year old females are the most vulnerable to poverty, with 27 males (75.0%) and 7 females (100.0%) in their respective age groups living below the poverty level.
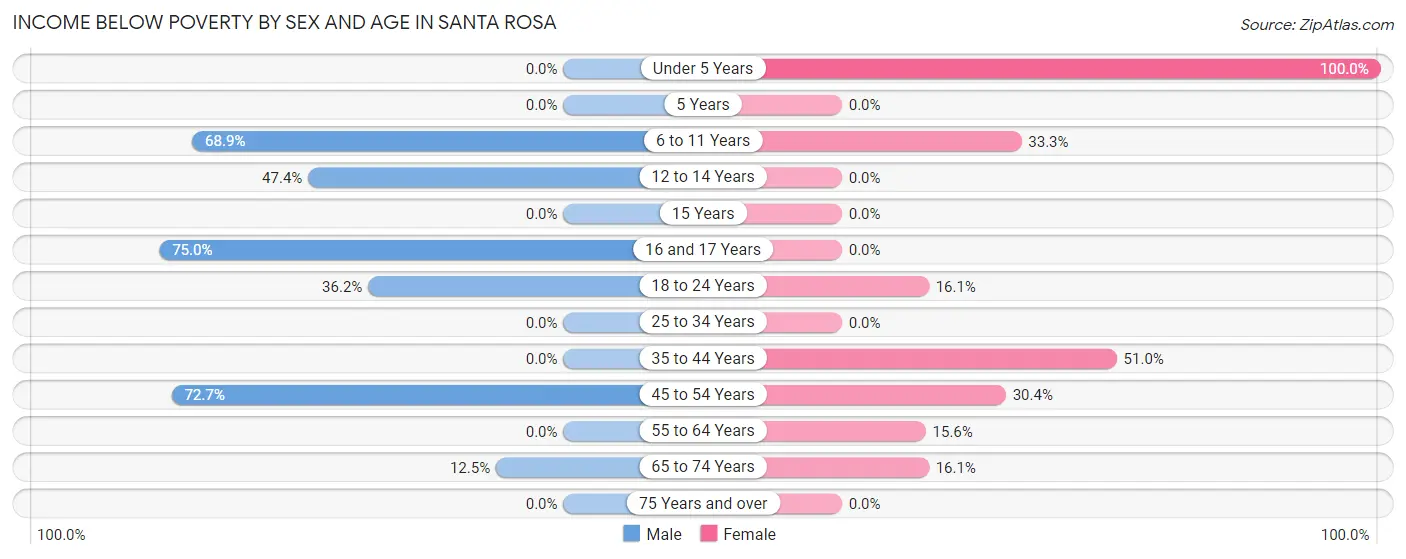
| Age Bracket | Male | Female |
| Under 5 Years | 0 (0.0%) | 7 (100.0%) |
| 5 Years | 0 (0.0%) | 0 (0.0%) |
| 6 to 11 Years | 31 (68.9%) | 16 (33.3%) |
| 12 to 14 Years | 9 (47.4%) | 0 (0.0%) |
| 15 Years | 0 (0.0%) | 0 (0.0%) |
| 16 and 17 Years | 27 (75.0%) | 0 (0.0%) |
| 18 to 24 Years | 25 (36.2%) | 10 (16.1%) |
| 25 to 34 Years | 0 (0.0%) | 0 (0.0%) |
| 35 to 44 Years | 0 (0.0%) | 50 (51.0%) |
| 45 to 54 Years | 24 (72.7%) | 7 (30.4%) |
| 55 to 64 Years | 0 (0.0%) | 7 (15.6%) |
| 65 to 74 Years | 6 (12.5%) | 5 (16.1%) |
| 75 Years and over | 0 (0.0%) | 0 (0.0%) |
| Total | 122 (37.5%) | 102 (25.0%) |
Income Above Poverty by Sex and Age in Santa Rosa
According to the poverty statistics in Santa Rosa, males aged under 5 years and females aged 12 to 14 years are the age groups that are most secure financially, with 100.0% of males and 100.0% of females in these age groups living above the poverty line.
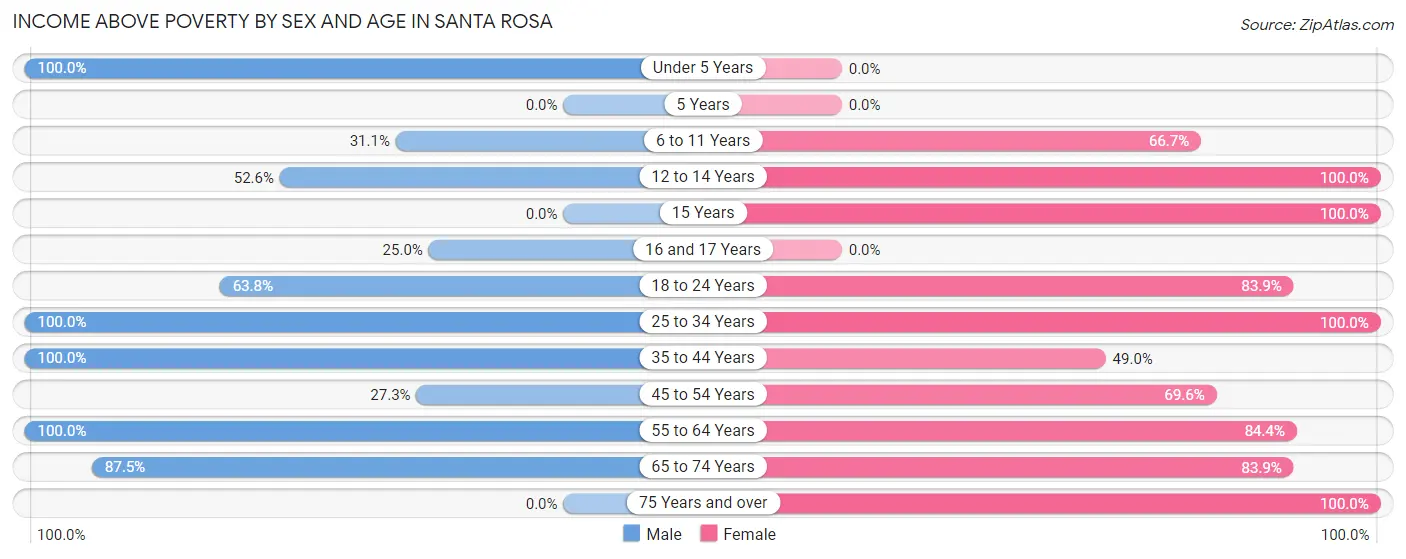
| Age Bracket | Male | Female |
| Under 5 Years | 3 (100.0%) | 0 (0.0%) |
| 5 Years | 0 (0.0%) | 0 (0.0%) |
| 6 to 11 Years | 14 (31.1%) | 32 (66.7%) |
| 12 to 14 Years | 10 (52.6%) | 25 (100.0%) |
| 15 Years | 0 (0.0%) | 10 (100.0%) |
| 16 and 17 Years | 9 (25.0%) | 0 (0.0%) |
| 18 to 24 Years | 44 (63.8%) | 52 (83.9%) |
| 25 to 34 Years | 19 (100.0%) | 45 (100.0%) |
| 35 to 44 Years | 30 (100.0%) | 48 (49.0%) |
| 45 to 54 Years | 9 (27.3%) | 16 (69.6%) |
| 55 to 64 Years | 23 (100.0%) | 38 (84.4%) |
| 65 to 74 Years | 42 (87.5%) | 26 (83.9%) |
| 75 Years and over | 0 (0.0%) | 14 (100.0%) |
| Total | 203 (62.5%) | 306 (75.0%) |
Income Below Poverty Among Married-Couple Families in Santa Rosa
The poverty statistics for married-couple families in Santa Rosa show that 14.6% or 7 of the total 48 families live below the poverty line. Families with 3 or 4 children have the highest poverty rate of 31.8%, comprising of 7 families. On the other hand, families with no children have the lowest poverty rate of 0.0%, which includes 0 families.
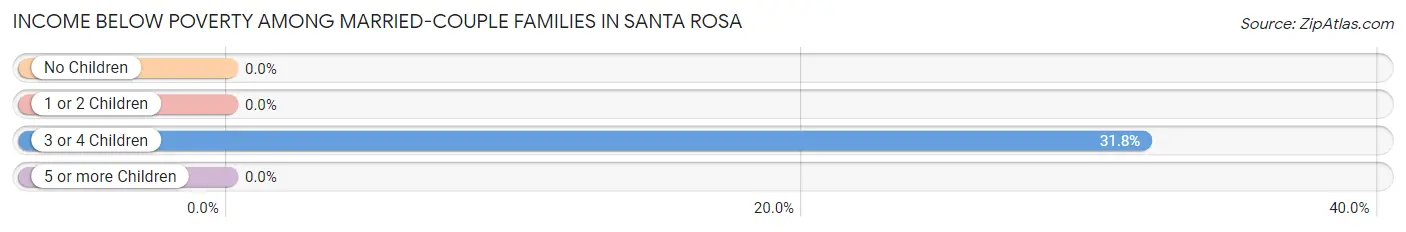
| Children | Above Poverty | Below Poverty |
| No Children | 26 (100.0%) | 0 (0.0%) |
| 1 or 2 Children | 0 (0.0%) | 0 (0.0%) |
| 3 or 4 Children | 15 (68.2%) | 7 (31.8%) |
| 5 or more Children | 0 (0.0%) | 0 (0.0%) |
| Total | 41 (85.4%) | 7 (14.6%) |
Income Below Poverty Among Single-Parent Households in Santa Rosa
According to the poverty data in Santa Rosa, 38.5% or 10 single-father households and 38.3% or 23 single-mother households are living below the poverty line. Among single-father households, those with 1 or 2 children have the highest poverty rate, with 10 households (55.6%) experiencing poverty. Likewise, among single-mother households, those with no children have the highest poverty rate, with 11 households (40.7%) falling below the poverty line.
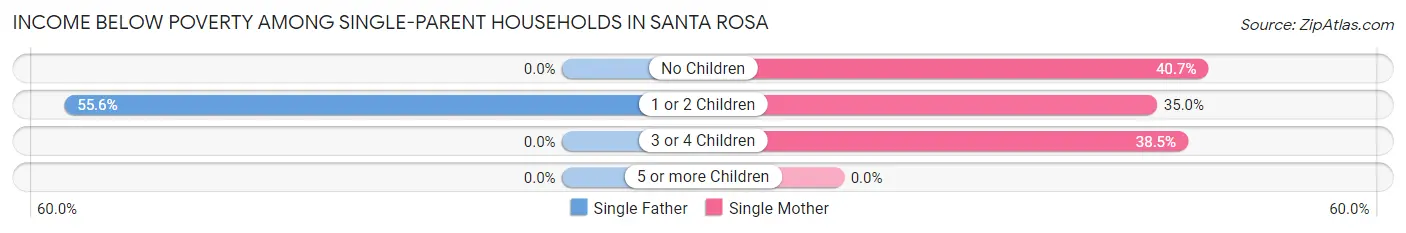
| Children | Single Father | Single Mother |
| No Children | 0 (0.0%) | 11 (40.7%) |
| 1 or 2 Children | 10 (55.6%) | 7 (35.0%) |
| 3 or 4 Children | 0 (0.0%) | 5 (38.5%) |
| 5 or more Children | 0 (0.0%) | 0 (0.0%) |
| Total | 10 (38.5%) | 23 (38.3%) |
Income Below Poverty Among Married-Couple vs Single-Parent Households in Santa Rosa
The poverty data for Santa Rosa shows that 7 of the married-couple family households (14.6%) and 33 of the single-parent households (38.4%) are living below the poverty level. Within the married-couple family households, those with 3 or 4 children have the highest poverty rate, with 7 households (31.8%) falling below the poverty line. Among the single-parent households, those with 1 or 2 children have the highest poverty rate, with 17 household (44.7%) living below poverty.
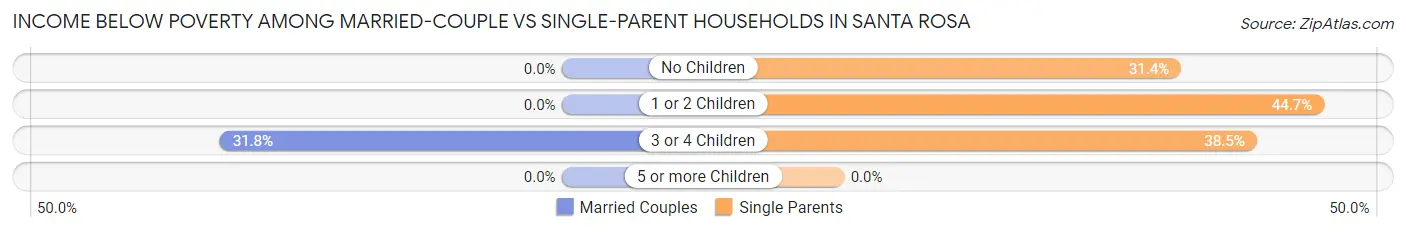
| Children | Married-Couple Families | Single-Parent Households |
| No Children | 0 (0.0%) | 11 (31.4%) |
| 1 or 2 Children | 0 (0.0%) | 17 (44.7%) |
| 3 or 4 Children | 7 (31.8%) | 5 (38.5%) |
| 5 or more Children | 0 (0.0%) | 0 (0.0%) |
| Total | 7 (14.6%) | 33 (38.4%) |
Race in Santa Rosa
The most populous races in Santa Rosa are Native / Alaskan (702 | 93.7%), Hispanic or Latino (47 | 6.3%), and White / Caucasian (47 | 6.3%).
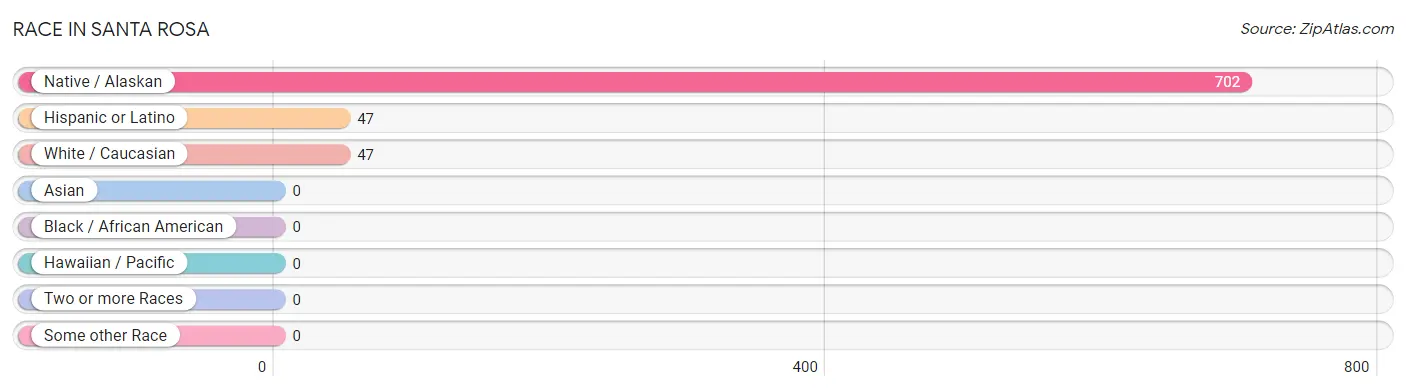
| Race | # Population | % Population |
| Asian | 0 | 0.0% |
| Black / African American | 0 | 0.0% |
| Hawaiian / Pacific | 0 | 0.0% |
| Hispanic or Latino | 47 | 6.3% |
| Native / Alaskan | 702 | 93.7% |
| White / Caucasian | 47 | 6.3% |
| Two or more Races | 0 | 0.0% |
| Some other Race | 0 | 0.0% |
| Total | 749 | 100.0% |
Ancestry in Santa Rosa
The most populous ancestries reported in Santa Rosa are Tohono O'Odham (498 | 66.5%), Mexican (47 | 6.3%), Italian (9 | 1.2%), and Pima (7 | 0.9%), together accounting for 74.9% of all Santa Rosa residents.
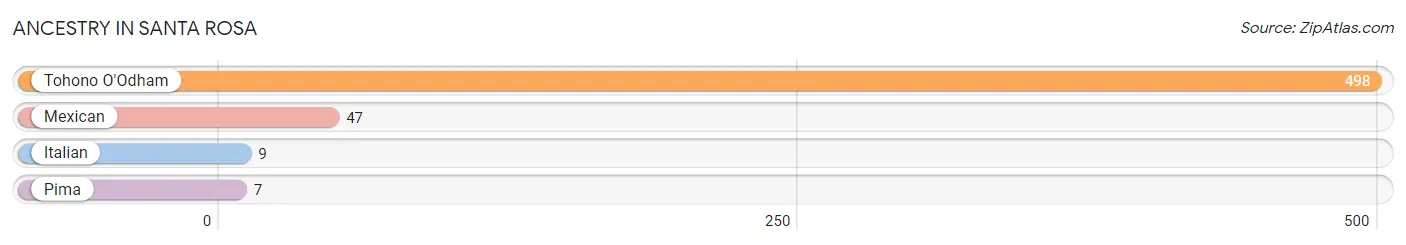
| Ancestry | # Population | % Population |
| Italian | 9 | 1.2% |
| Mexican | 47 | 6.3% |
| Pima | 7 | 0.9% |
| Tohono O'Odham | 498 | 66.5% | View All 4 Rows |
Immigrants in Santa Rosa

| Immigration Origin | # Population | % Population | View All 0 Rows |
Sex and Age in Santa Rosa
Sex and Age in Santa Rosa
The most populous age groups in Santa Rosa are 15 to 19 Years (54 | 15.8%) for men and 15 to 19 Years (61 | 14.9%) for women.
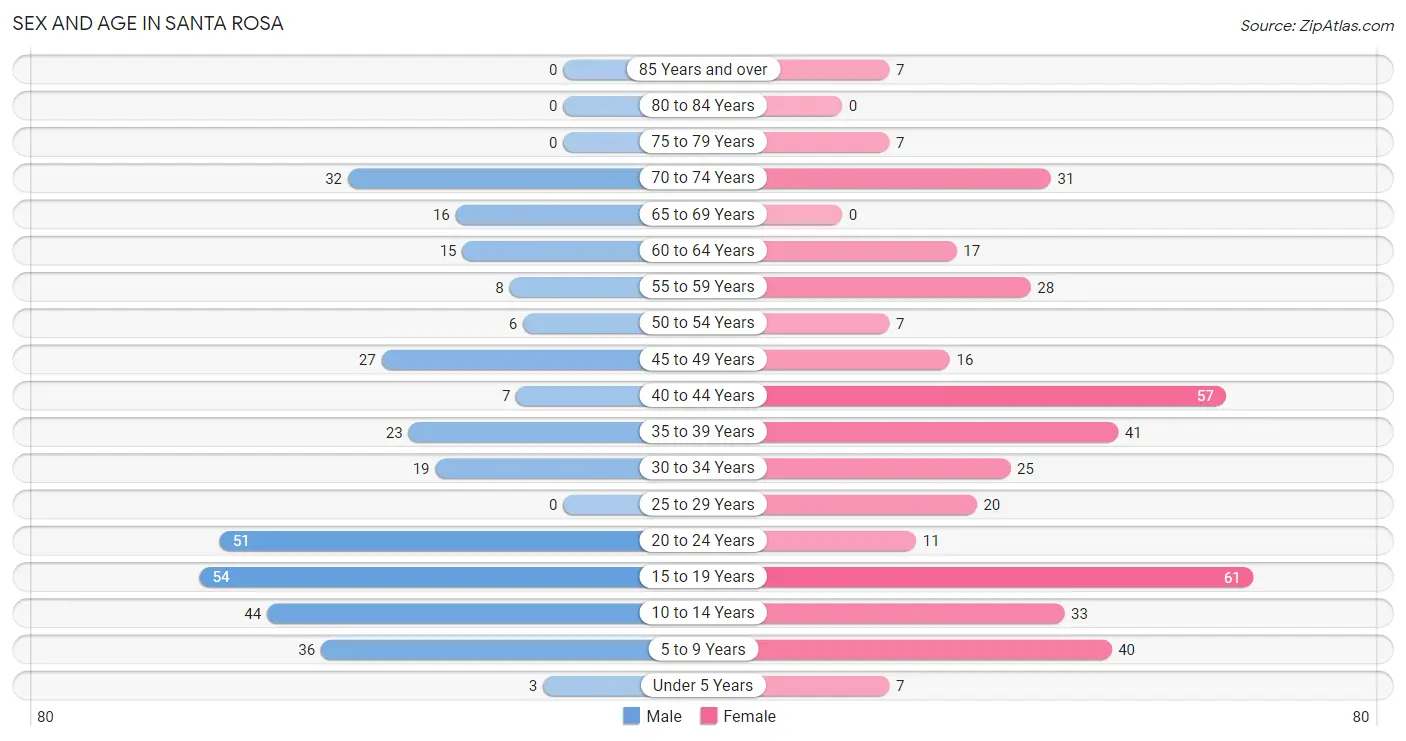
| Age Bracket | Male | Female |
| Under 5 Years | 3 (0.9%) | 7 (1.7%) |
| 5 to 9 Years | 36 (10.6%) | 40 (9.8%) |
| 10 to 14 Years | 44 (12.9%) | 33 (8.1%) |
| 15 to 19 Years | 54 (15.8%) | 61 (14.9%) |
| 20 to 24 Years | 51 (15.0%) | 11 (2.7%) |
| 25 to 29 Years | 0 (0.0%) | 20 (4.9%) |
| 30 to 34 Years | 19 (5.6%) | 25 (6.1%) |
| 35 to 39 Years | 23 (6.7%) | 41 (10.1%) |
| 40 to 44 Years | 7 (2.1%) | 57 (14.0%) |
| 45 to 49 Years | 27 (7.9%) | 16 (3.9%) |
| 50 to 54 Years | 6 (1.8%) | 7 (1.7%) |
| 55 to 59 Years | 8 (2.4%) | 28 (6.9%) |
| 60 to 64 Years | 15 (4.4%) | 17 (4.2%) |
| 65 to 69 Years | 16 (4.7%) | 0 (0.0%) |
| 70 to 74 Years | 32 (9.4%) | 31 (7.6%) |
| 75 to 79 Years | 0 (0.0%) | 7 (1.7%) |
| 80 to 84 Years | 0 (0.0%) | 0 (0.0%) |
| 85 Years and over | 0 (0.0%) | 7 (1.7%) |
| Total | 341 (100.0%) | 408 (100.0%) |
Families and Households in Santa Rosa
Median Family Size in Santa Rosa
The median family size in Santa Rosa is 5.01 persons per family, with single female/mother families (60 | 44.8%) accounting for the largest median family size of 6.18 persons per family. On the other hand, single male/father families (26 | 19.4%) represent the smallest median family size with 2.46 persons per family.
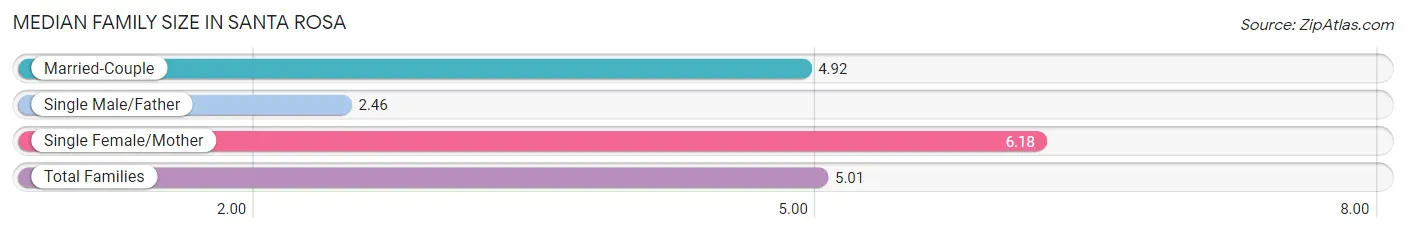
| Family Type | # Families | Family Size |
| Married-Couple | 48 (35.8%) | 4.92 |
| Single Male/Father | 26 (19.4%) | 2.46 |
| Single Female/Mother | 60 (44.8%) | 6.18 |
| Total Families | 134 (100.0%) | 5.01 |
Median Household Size in Santa Rosa
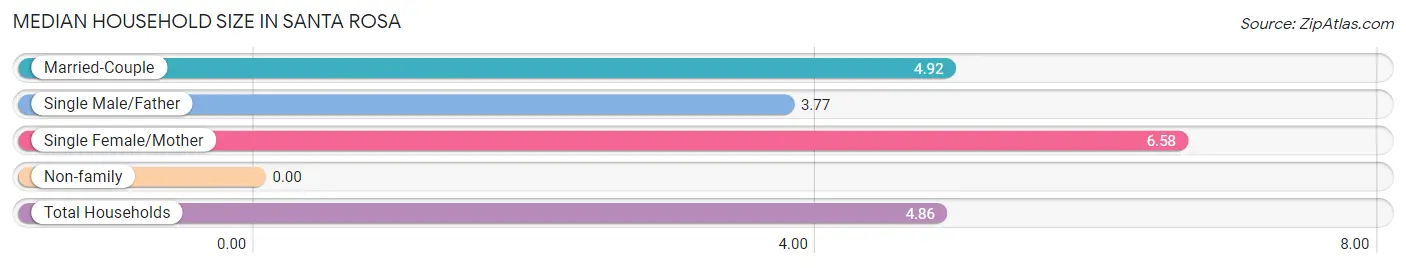
| Household Type | # Households | Household Size |
| Married-Couple | 48 (31.2%) | 4.92 |
| Single Male/Father | 26 (16.9%) | 3.77 |
| Single Female/Mother | 60 (39.0%) | 6.58 |
| Non-family | 20 (13.0%) | - |
| Total Households | 154 (100.0%) | 4.86 |
Household Size by Marriage Status in Santa Rosa
Out of a total of 154 households in Santa Rosa, 134 (87.0%) are family households, while 20 (13.0%) are nonfamily households. The most numerous type of family households are 5-person households, comprising 50, and the most common type of nonfamily households are 1-person households, comprising 20.
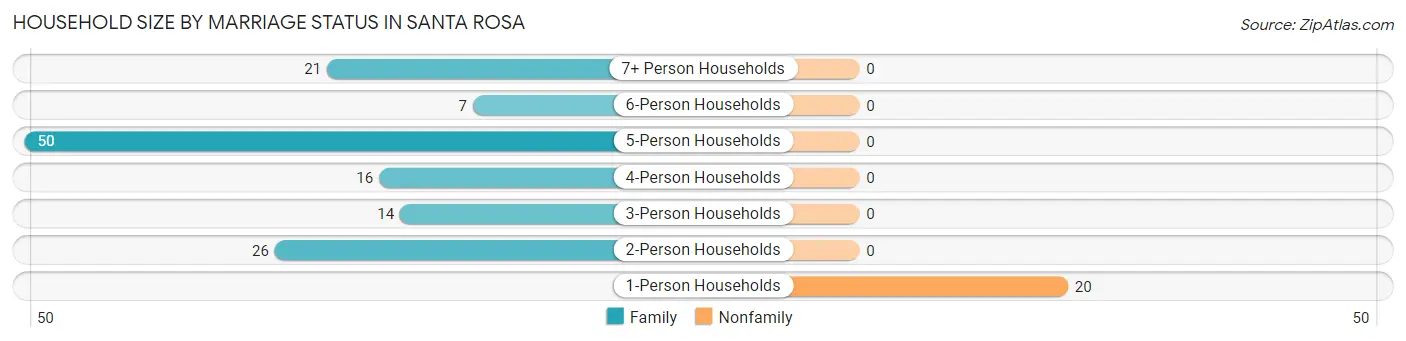
| Household Size | Family Households | Nonfamily Households |
| 1-Person Households | - | 20 (13.0%) |
| 2-Person Households | 26 (16.9%) | 0 (0.0%) |
| 3-Person Households | 14 (9.1%) | 0 (0.0%) |
| 4-Person Households | 16 (10.4%) | 0 (0.0%) |
| 5-Person Households | 50 (32.5%) | 0 (0.0%) |
| 6-Person Households | 7 (4.5%) | 0 (0.0%) |
| 7+ Person Households | 21 (13.6%) | 0 (0.0%) |
| Total | 134 (87.0%) | 20 (13.0%) |
Female Fertility in Santa Rosa
Fertility by Age in Santa Rosa
Average fertility rate in Santa Rosa is 139.0 births per 1,000 women. Women in the age bracket of 15 to 19 years have the highest fertility rate with 525.0 births per 1,000 women. Women in the age bracket of 15 to 19 years acount for 100.0% of all women with births.
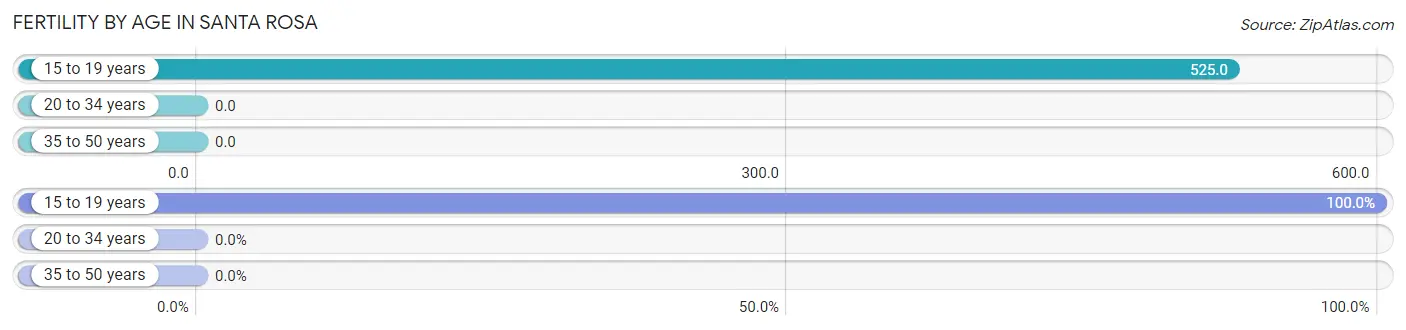
| Age Bracket | Women with Births | Births / 1,000 Women |
| 15 to 19 years | 32 (100.0%) | 525.0 |
| 20 to 34 years | 0 (0.0%) | 0.0 |
| 35 to 50 years | 0 (0.0%) | 0.0 |
| Total | 32 (100.0%) | 139.0 |
Fertility by Age by Marriage Status in Santa Rosa
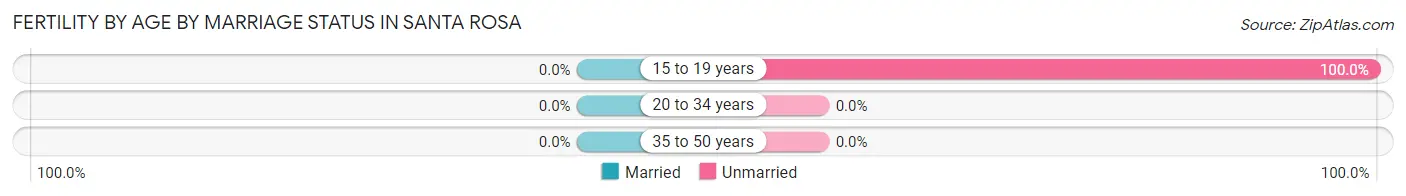
| Age Bracket | Married | Unmarried |
| 15 to 19 years | 0 (0.0%) | 32 (100.0%) |
| 20 to 34 years | 0 (0.0%) | 0 (0.0%) |
| 35 to 50 years | 0 (0.0%) | 0 (0.0%) |
| Total | 0 (0.0%) | 32 (100.0%) |
Fertility by Education in Santa Rosa
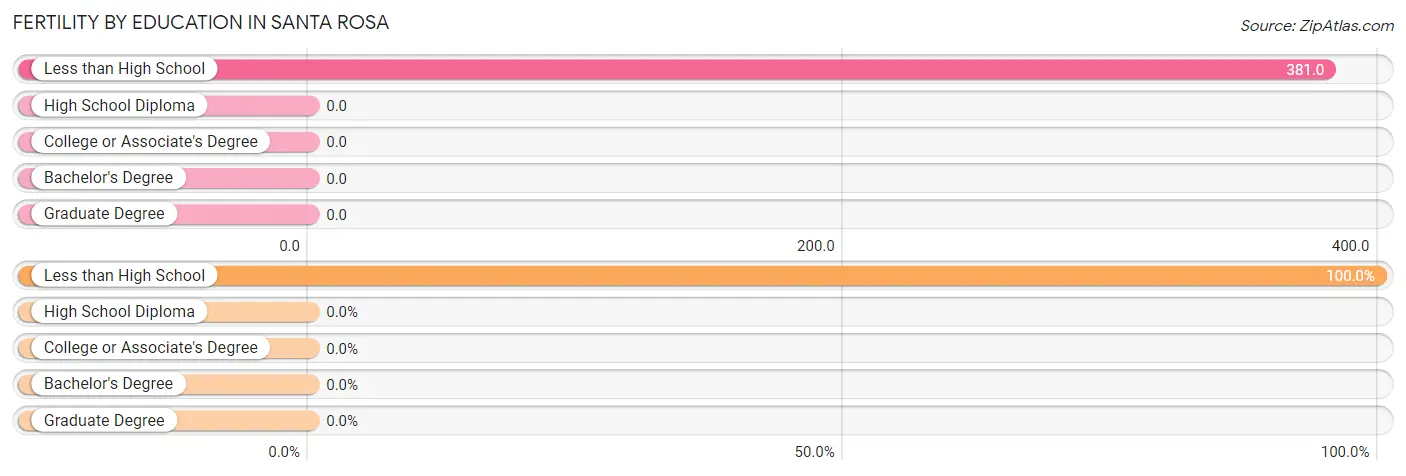
| Educational Attainment | Women with Births | Births / 1,000 Women |
| Less than High School | 32 (100.0%) | 381.0 |
| High School Diploma | 0 (0.0%) | 0.0 |
| College or Associate's Degree | 0 (0.0%) | 0.0 |
| Bachelor's Degree | 0 (0.0%) | 0.0 |
| Graduate Degree | 0 (0.0%) | 0.0 |
| Total | 32 (100.0%) | 139.0 |
Fertility by Education by Marriage Status in Santa Rosa
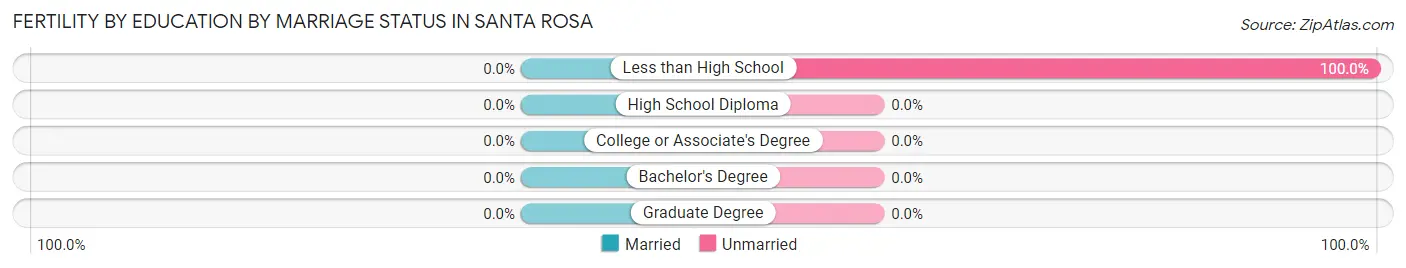
| Educational Attainment | Married | Unmarried |
| Less than High School | 0 (0.0%) | 32 (100.0%) |
| High School Diploma | 0 (0.0%) | 0 (0.0%) |
| College or Associate's Degree | 0 (0.0%) | 0 (0.0%) |
| Bachelor's Degree | 0 (0.0%) | 0 (0.0%) |
| Graduate Degree | 0 (0.0%) | 0 (0.0%) |
| Total | 0 (0.0%) | 32 (100.0%) |
Employment Characteristics in Santa Rosa
Employment by Class of Employer in Santa Rosa
Among the 164 employed individuals in Santa Rosa, local government employees (95 | 57.9%), private company employees (54 | 32.9%), and not-for-profit organizations (9 | 5.5%) make up the most common classes of employment.
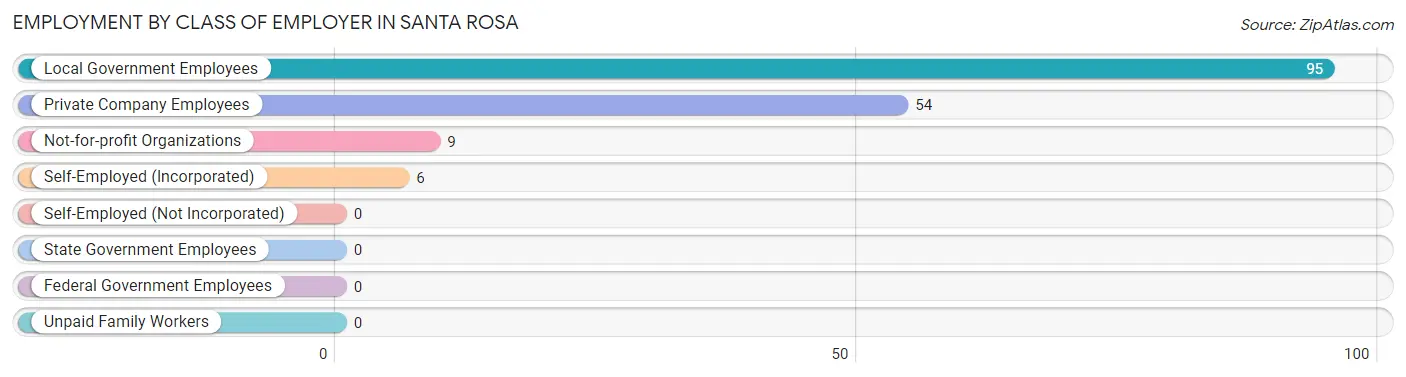
| Employer Class | # Employees | % Employees |
| Private Company Employees | 54 | 32.9% |
| Self-Employed (Incorporated) | 6 | 3.7% |
| Self-Employed (Not Incorporated) | 0 | 0.0% |
| Not-for-profit Organizations | 9 | 5.5% |
| Local Government Employees | 95 | 57.9% |
| State Government Employees | 0 | 0.0% |
| Federal Government Employees | 0 | 0.0% |
| Unpaid Family Workers | 0 | 0.0% |
| Total | 164 | 100.0% |
Employment Status by Age in Santa Rosa
According to the labor force statistics for Santa Rosa, out of the total population over 16 years of age (576), 37.3% or 215 individuals are in the labor force, with 12.1% or 26 of them unemployed. The age group with the highest labor force participation rate is 45 to 54 years, with 100.0% or 56 individuals in the labor force. Within the labor force, the 30 to 34 years age range has the highest percentage of unemployed individuals, with 34.6% or 9 of them being unemployed.
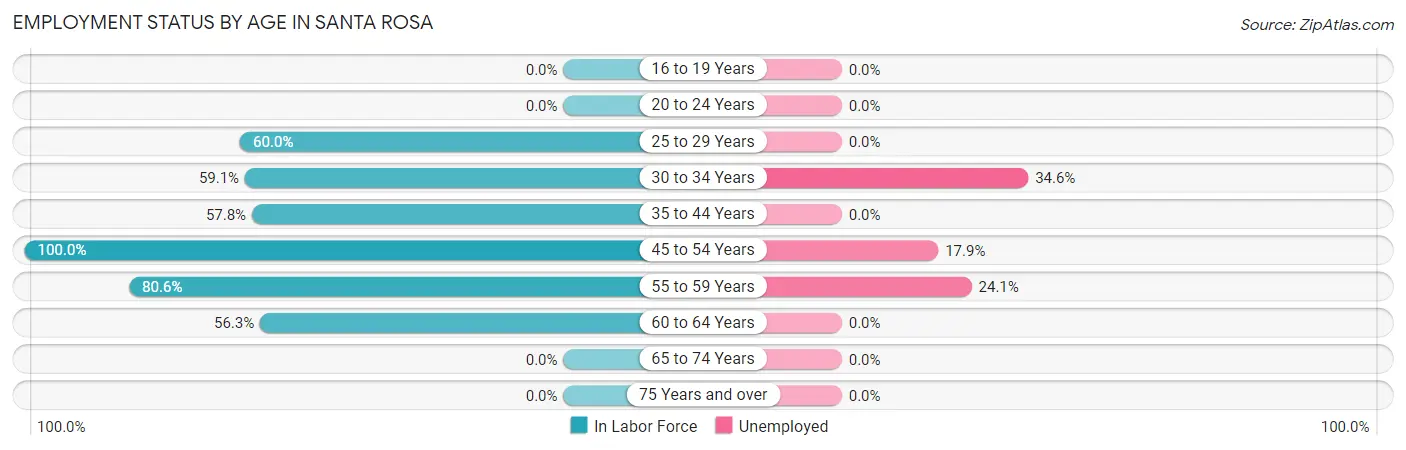
| Age Bracket | In Labor Force | Unemployed |
| 16 to 19 Years | 0 (0.0%) | 0 (0.0%) |
| 20 to 24 Years | 0 (0.0%) | 0 (0.0%) |
| 25 to 29 Years | 12 (60.0%) | 0 (0.0%) |
| 30 to 34 Years | 26 (59.1%) | 9 (34.6%) |
| 35 to 44 Years | 74 (57.8%) | 0 (0.0%) |
| 45 to 54 Years | 56 (100.0%) | 10 (17.9%) |
| 55 to 59 Years | 29 (80.6%) | 7 (24.1%) |
| 60 to 64 Years | 18 (56.3%) | 0 (0.0%) |
| 65 to 74 Years | 0 (0.0%) | 0 (0.0%) |
| 75 Years and over | 0 (0.0%) | 0 (0.0%) |
| Total | 215 (37.3%) | 26 (12.1%) |
Employment Status by Educational Attainment in Santa Rosa
According to labor force statistics for Santa Rosa, 68.0% of individuals (215) out of the total population between 25 and 64 years of age (316) are in the labor force, with 12.1% or 26 of them being unemployed. The group with the highest labor force participation rate are those with the educational attainment of bachelor's degree or higher, with 100.0% or 7 individuals in the labor force. Within the labor force, individuals with bachelor's degree or higher education have the highest percentage of unemployment, with 100.0% or 7 of them being unemployed.
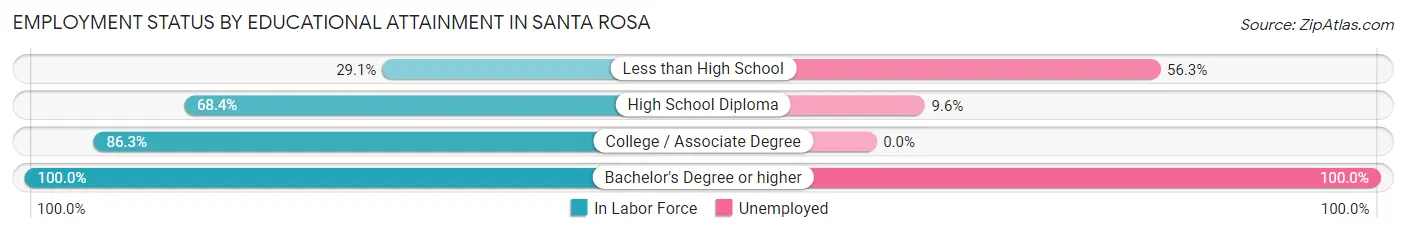
| Educational Attainment | In Labor Force | Unemployed |
| Less than High School | 16 (29.1%) | 31 (56.3%) |
| High School Diploma | 104 (68.4%) | 15 (9.6%) |
| College / Associate Degree | 88 (86.3%) | 0 (0.0%) |
| Bachelor's Degree or higher | 7 (100.0%) | 7 (100.0%) |
| Total | 215 (68.0%) | 38 (12.1%) |
Employment Occupations by Sex in Santa Rosa
Management, Business, Science and Arts Occupations
The most common Management, Business, Science and Arts occupations in Santa Rosa are Community & Social Service (9 | 4.8%), Arts, Media & Entertainment (9 | 4.8%), Management (8 | 4.2%), Health Diagnosing & Treating (8 | 4.2%), and Health Technologists (8 | 4.2%).
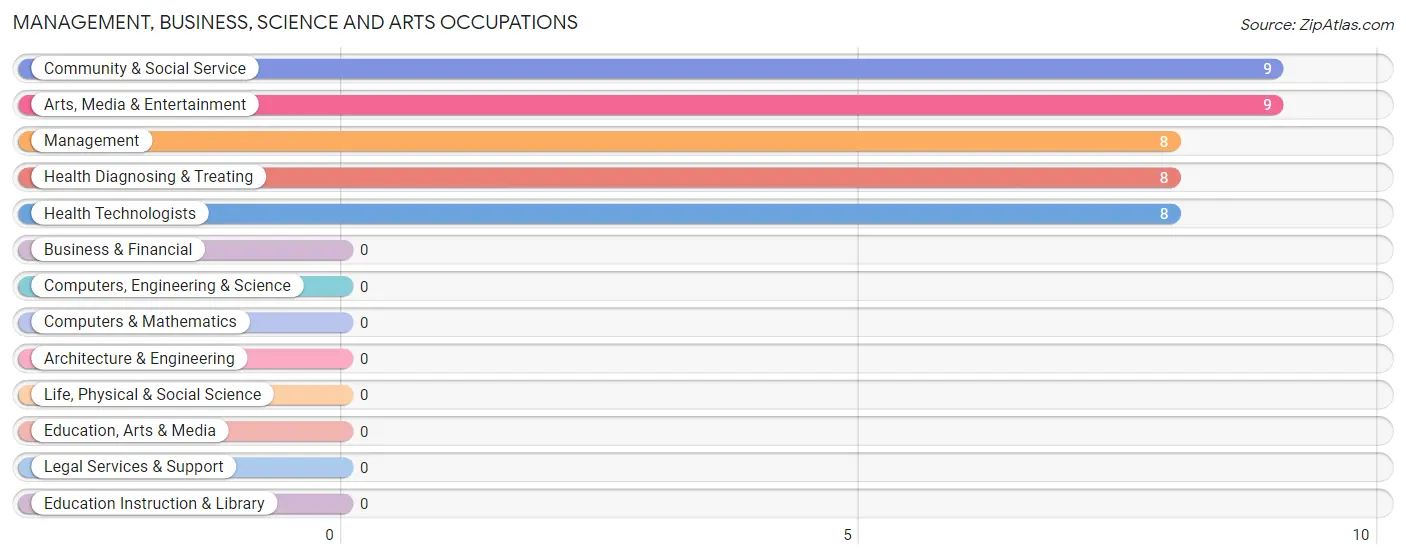
Management, Business, Science and Arts Occupations by Sex
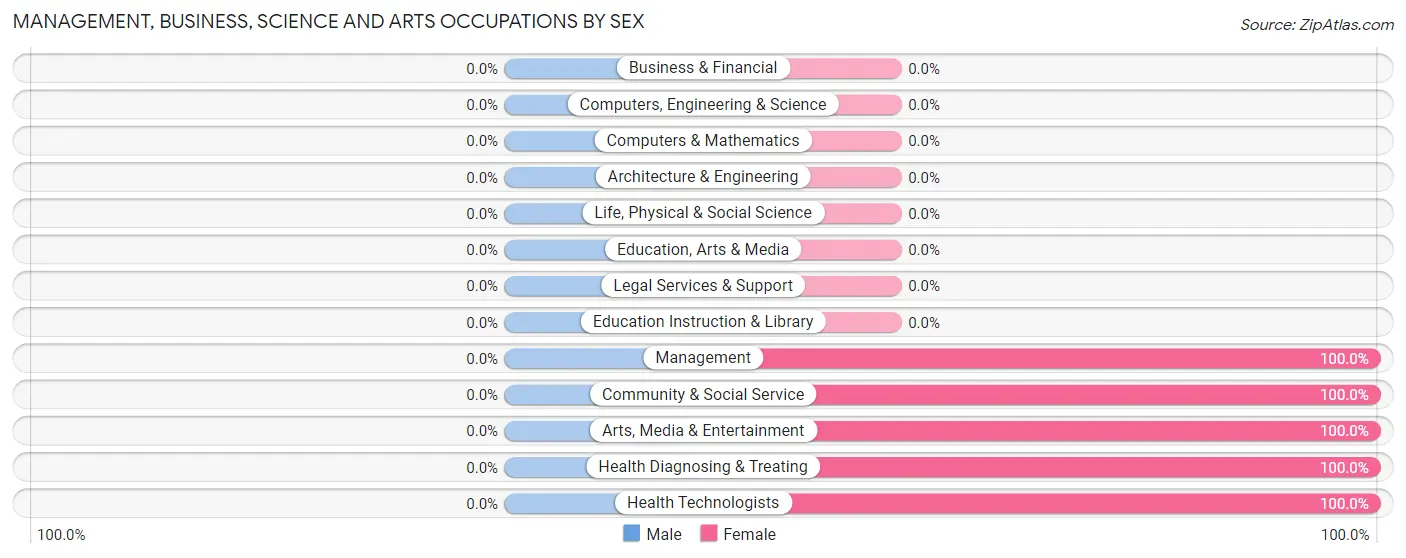
| Occupation | Male | Female |
| Management | 0 (0.0%) | 8 (100.0%) |
| Business & Financial | 0 (0.0%) | 0 (0.0%) |
| Computers, Engineering & Science | 0 (0.0%) | 0 (0.0%) |
| Computers & Mathematics | 0 (0.0%) | 0 (0.0%) |
| Architecture & Engineering | 0 (0.0%) | 0 (0.0%) |
| Life, Physical & Social Science | 0 (0.0%) | 0 (0.0%) |
| Community & Social Service | 0 (0.0%) | 9 (100.0%) |
| Education, Arts & Media | 0 (0.0%) | 0 (0.0%) |
| Legal Services & Support | 0 (0.0%) | 0 (0.0%) |
| Education Instruction & Library | 0 (0.0%) | 0 (0.0%) |
| Arts, Media & Entertainment | 0 (0.0%) | 9 (100.0%) |
| Health Diagnosing & Treating | 0 (0.0%) | 8 (100.0%) |
| Health Technologists | 0 (0.0%) | 8 (100.0%) |
| Total (Category) | 0 (0.0%) | 25 (100.0%) |
| Total (Overall) | 58 (30.7%) | 131 (69.3%) |
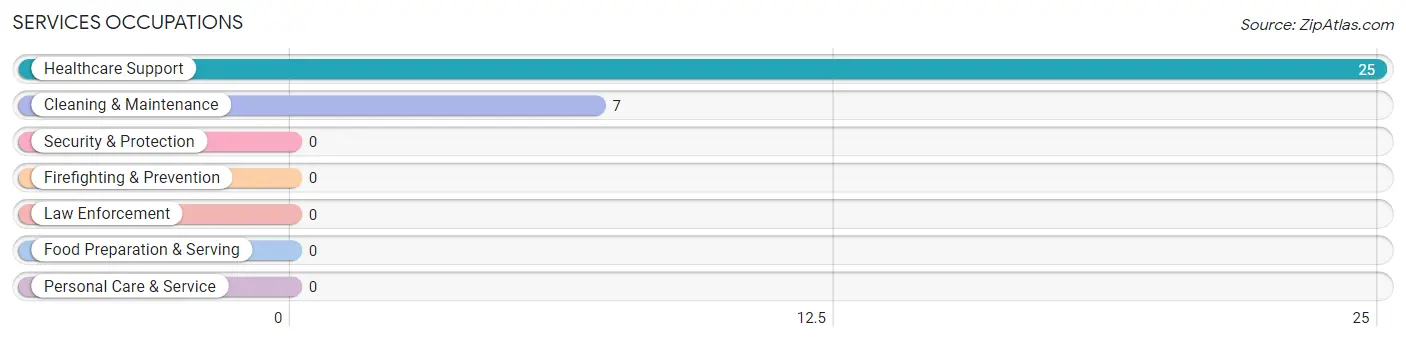
Services Occupations
The most common Services occupations in Santa Rosa are Healthcare Support (25 | 13.2%), and Cleaning & Maintenance (7 | 3.7%).
Services Occupations by Sex
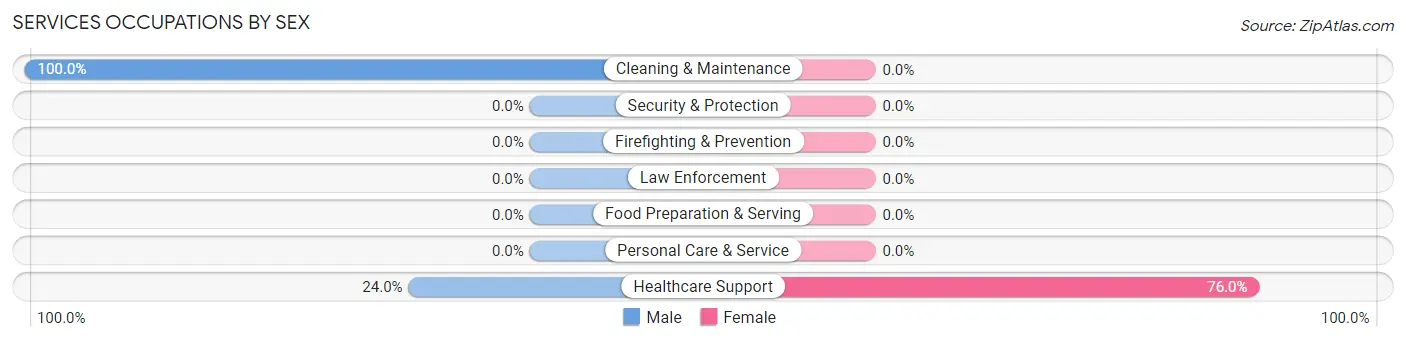
| Occupation | Male | Female |
| Healthcare Support | 6 (24.0%) | 19 (76.0%) |
| Security & Protection | 0 (0.0%) | 0 (0.0%) |
| Firefighting & Prevention | 0 (0.0%) | 0 (0.0%) |
| Law Enforcement | 0 (0.0%) | 0 (0.0%) |
| Food Preparation & Serving | 0 (0.0%) | 0 (0.0%) |
| Cleaning & Maintenance | 7 (100.0%) | 0 (0.0%) |
| Personal Care & Service | 0 (0.0%) | 0 (0.0%) |
| Total (Category) | 13 (40.6%) | 19 (59.4%) |
| Total (Overall) | 58 (30.7%) | 131 (69.3%) |
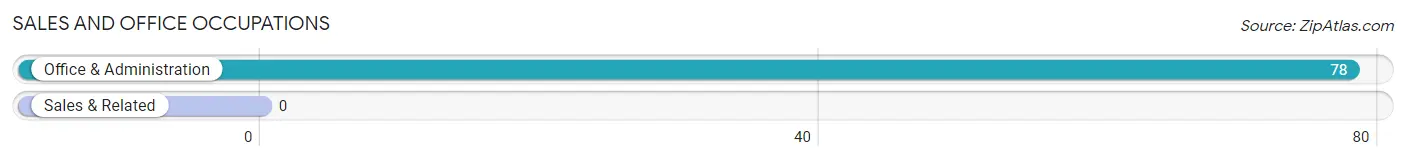
Sales and Office Occupations
The most common Sales and Office occupations in Santa Rosa are , and Office & Administration (78 | 41.3%).
Sales and Office Occupations by Sex
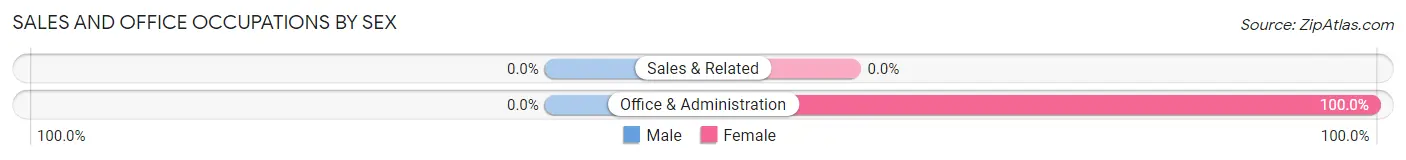
| Occupation | Male | Female |
| Sales & Related | 0 (0.0%) | 0 (0.0%) |
| Office & Administration | 0 (0.0%) | 78 (100.0%) |
| Total (Category) | 0 (0.0%) | 78 (100.0%) |
| Total (Overall) | 58 (30.7%) | 131 (69.3%) |
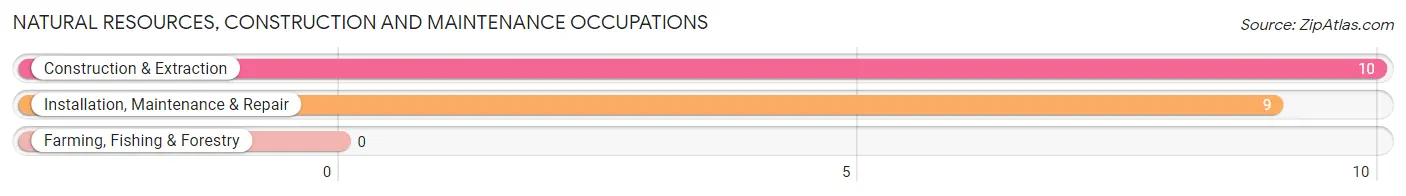
Natural Resources, Construction and Maintenance Occupations
The most common Natural Resources, Construction and Maintenance occupations in Santa Rosa are Construction & Extraction (10 | 5.3%), and Installation, Maintenance & Repair (9 | 4.8%).
Natural Resources, Construction and Maintenance Occupations by Sex
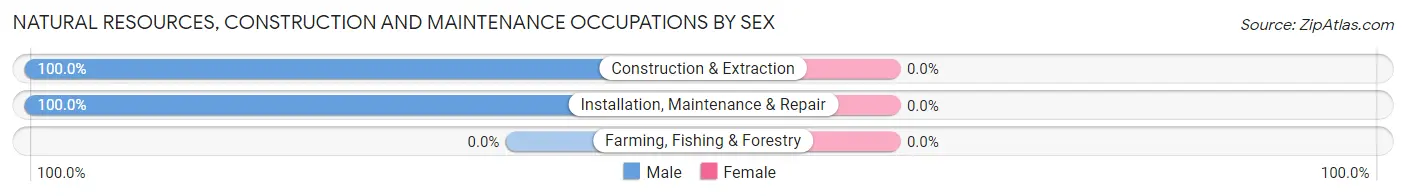
| Occupation | Male | Female |
| Farming, Fishing & Forestry | 0 (0.0%) | 0 (0.0%) |
| Construction & Extraction | 10 (100.0%) | 0 (0.0%) |
| Installation, Maintenance & Repair | 9 (100.0%) | 0 (0.0%) |
| Total (Category) | 19 (100.0%) | 0 (0.0%) |
| Total (Overall) | 58 (30.7%) | 131 (69.3%) |
Production, Transportation and Moving Occupations
The most common Production, Transportation and Moving occupations in Santa Rosa are Transportation (27 | 14.3%), and Production (8 | 4.2%).
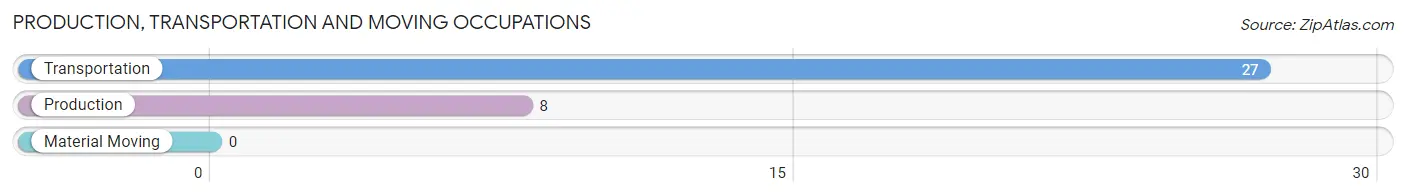
Production, Transportation and Moving Occupations by Sex
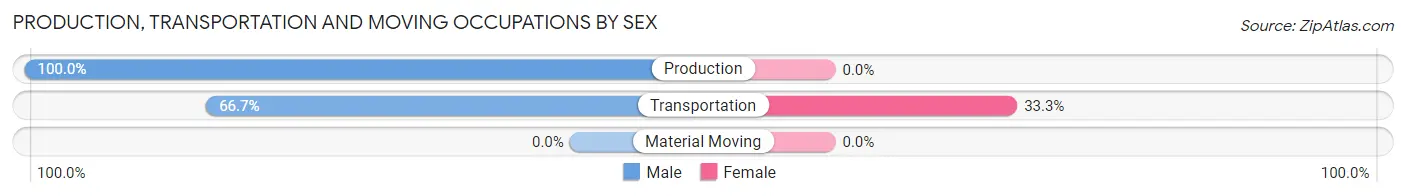
| Occupation | Male | Female |
| Production | 8 (100.0%) | 0 (0.0%) |
| Transportation | 18 (66.7%) | 9 (33.3%) |
| Material Moving | 0 (0.0%) | 0 (0.0%) |
| Total (Category) | 26 (74.3%) | 9 (25.7%) |
| Total (Overall) | 58 (30.7%) | 131 (69.3%) |
Employment Industries by Sex in Santa Rosa
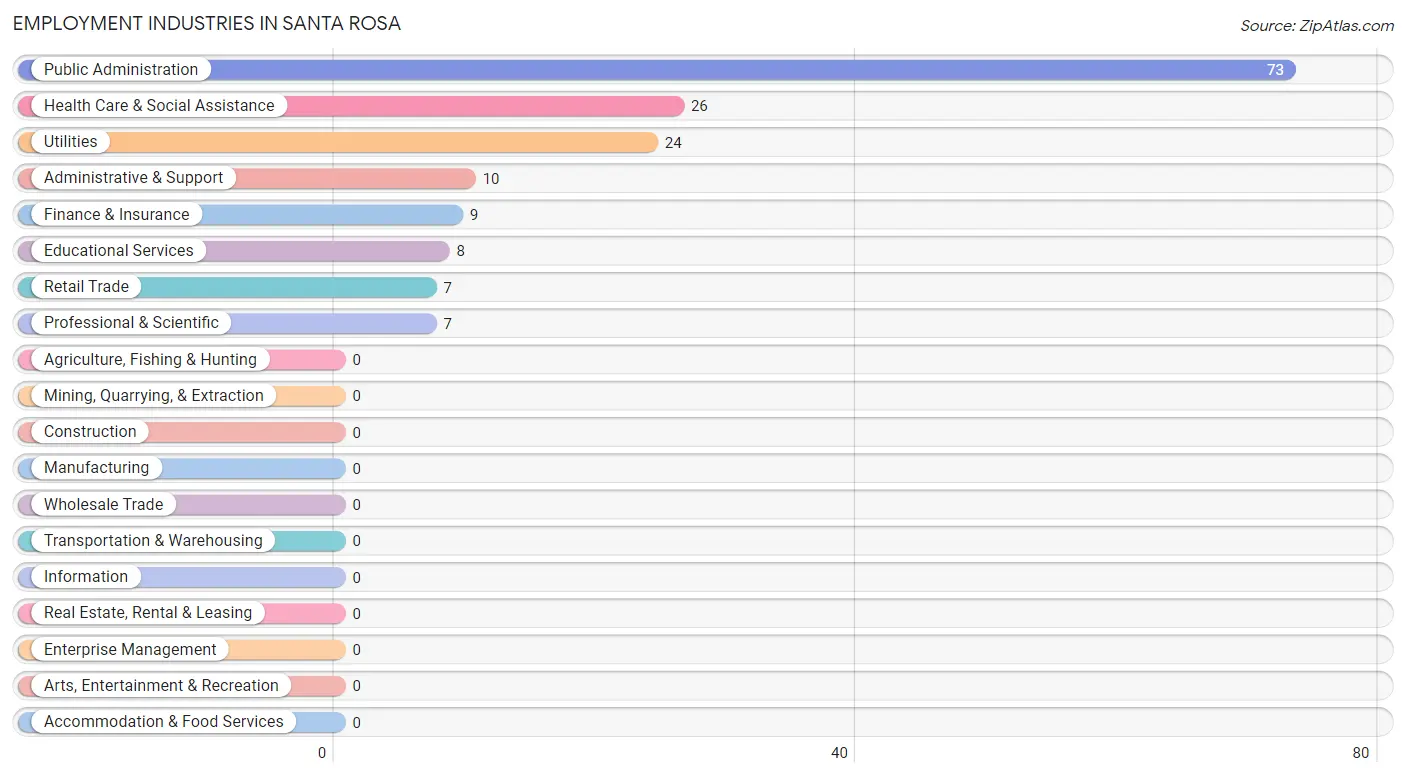
Employment Industries in Santa Rosa
The major employment industries in Santa Rosa include Public Administration (73 | 38.6%), Health Care & Social Assistance (26 | 13.8%), Utilities (24 | 12.7%), Administrative & Support (10 | 5.3%), and Finance & Insurance (9 | 4.8%).
Employment Industries by Sex in Santa Rosa
The Santa Rosa industries that see more men than women are Retail Trade (100.0%), Administrative & Support (100.0%), and Educational Services (100.0%), whereas the industries that tend to have a higher number of women are Finance & Insurance (100.0%), Professional & Scientific (100.0%), and Health Care & Social Assistance (100.0%).
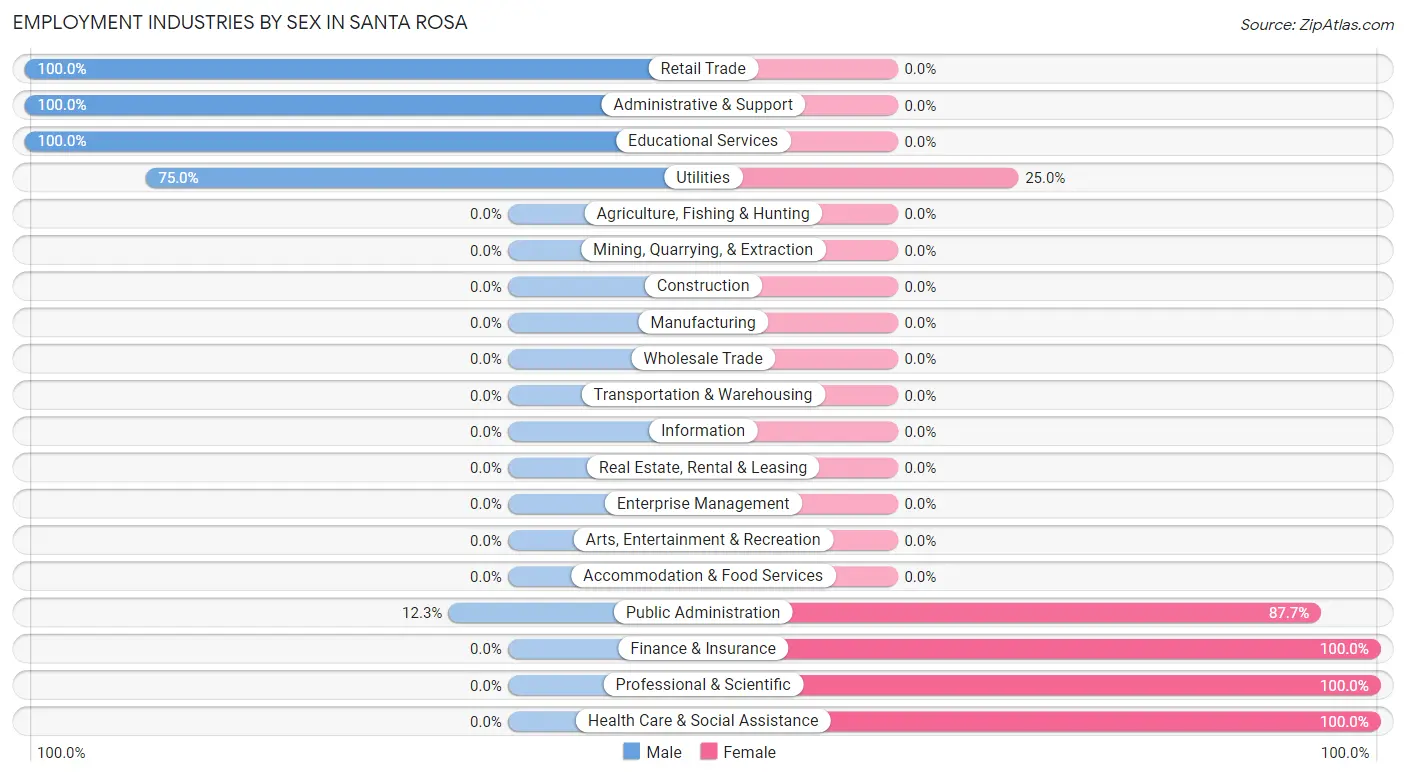
| Industry | Male | Female |
| Agriculture, Fishing & Hunting | 0 (0.0%) | 0 (0.0%) |
| Mining, Quarrying, & Extraction | 0 (0.0%) | 0 (0.0%) |
| Construction | 0 (0.0%) | 0 (0.0%) |
| Manufacturing | 0 (0.0%) | 0 (0.0%) |
| Wholesale Trade | 0 (0.0%) | 0 (0.0%) |
| Retail Trade | 7 (100.0%) | 0 (0.0%) |
| Transportation & Warehousing | 0 (0.0%) | 0 (0.0%) |
| Utilities | 18 (75.0%) | 6 (25.0%) |
| Information | 0 (0.0%) | 0 (0.0%) |
| Finance & Insurance | 0 (0.0%) | 9 (100.0%) |
| Real Estate, Rental & Leasing | 0 (0.0%) | 0 (0.0%) |
| Professional & Scientific | 0 (0.0%) | 7 (100.0%) |
| Enterprise Management | 0 (0.0%) | 0 (0.0%) |
| Administrative & Support | 10 (100.0%) | 0 (0.0%) |
| Educational Services | 8 (100.0%) | 0 (0.0%) |
| Health Care & Social Assistance | 0 (0.0%) | 26 (100.0%) |
| Arts, Entertainment & Recreation | 0 (0.0%) | 0 (0.0%) |
| Accommodation & Food Services | 0 (0.0%) | 0 (0.0%) |
| Public Administration | 9 (12.3%) | 64 (87.7%) |
| Total | 58 (30.7%) | 131 (69.3%) |
Education in Santa Rosa
School Enrollment in Santa Rosa
The most common levels of schooling among the 316 students in Santa Rosa are high school (141 | 44.6%), elementary school (76 | 24.0%), and middle school (69 | 21.8%).
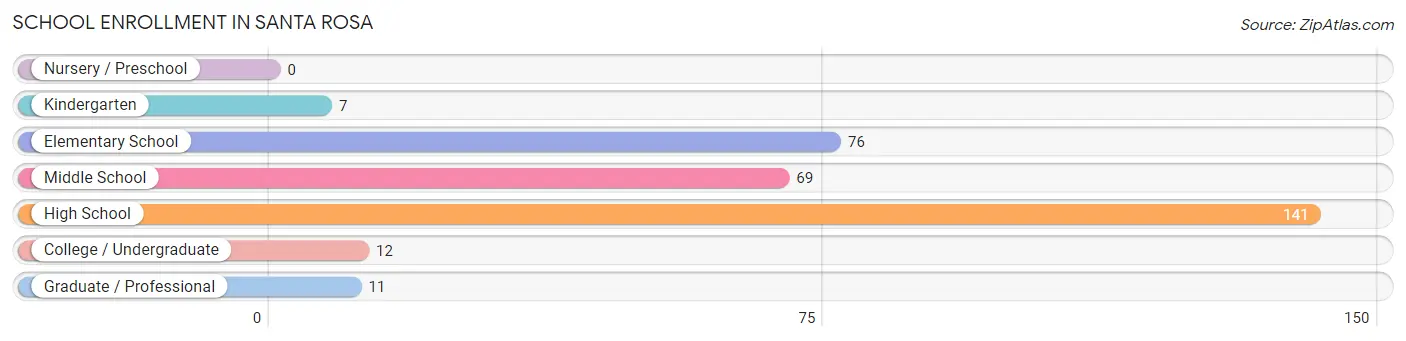
| School Level | # Students | % Students |
| Nursery / Preschool | 0 | 0.0% |
| Kindergarten | 7 | 2.2% |
| Elementary School | 76 | 24.0% |
| Middle School | 69 | 21.8% |
| High School | 141 | 44.6% |
| College / Undergraduate | 12 | 3.8% |
| Graduate / Professional | 11 | 3.5% |
| Total | 316 | 100.0% |
School Enrollment by Age by Funding Source in Santa Rosa
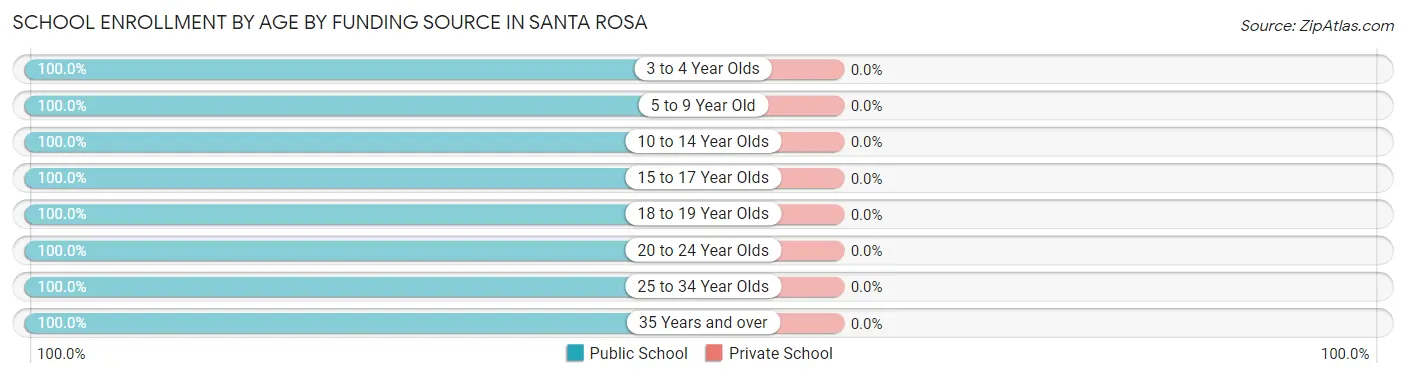
| Age Bracket | Public School | Private School |
| 3 to 4 Year Olds | 7 (100.0%) | 0 (0.0%) |
| 5 to 9 Year Old | 68 (100.0%) | 0 (0.0%) |
| 10 to 14 Year Olds | 77 (100.0%) | 0 (0.0%) |
| 15 to 17 Year Olds | 46 (100.0%) | 0 (0.0%) |
| 18 to 19 Year Olds | 60 (100.0%) | 0 (0.0%) |
| 20 to 24 Year Olds | 26 (100.0%) | 0 (0.0%) |
| 25 to 34 Year Olds | 21 (100.0%) | 0 (0.0%) |
| 35 Years and over | 11 (100.0%) | 0 (0.0%) |
| Total | 316 (100.0%) | 0 (0.0%) |
Educational Attainment by Field of Study in Santa Rosa
, and psychology (7 | 100.0%) are the most common fields of study among 7 individuals in Santa Rosa who have obtained a bachelor's degree or higher.
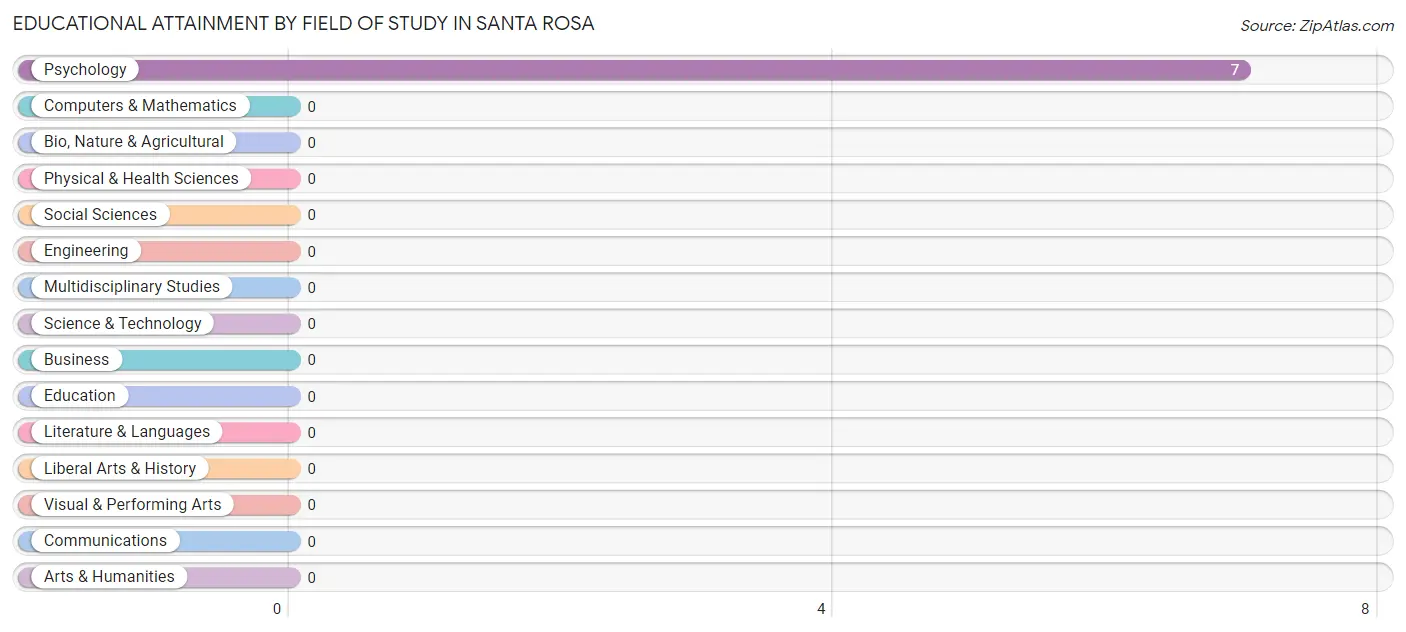
| Field of Study | # Graduates | % Graduates |
| Computers & Mathematics | 0 | 0.0% |
| Bio, Nature & Agricultural | 0 | 0.0% |
| Physical & Health Sciences | 0 | 0.0% |
| Psychology | 7 | 100.0% |
| Social Sciences | 0 | 0.0% |
| Engineering | 0 | 0.0% |
| Multidisciplinary Studies | 0 | 0.0% |
| Science & Technology | 0 | 0.0% |
| Business | 0 | 0.0% |
| Education | 0 | 0.0% |
| Literature & Languages | 0 | 0.0% |
| Liberal Arts & History | 0 | 0.0% |
| Visual & Performing Arts | 0 | 0.0% |
| Communications | 0 | 0.0% |
| Arts & Humanities | 0 | 0.0% |
| Total | 7 | 100.0% |
Transportation & Commute in Santa Rosa
Vehicle Availability by Sex in Santa Rosa
The most prevalent vehicle ownership categories in Santa Rosa are males with 2 vehicles (27, accounting for 46.6%) and females with 2 vehicles (59, making up 25.5%).
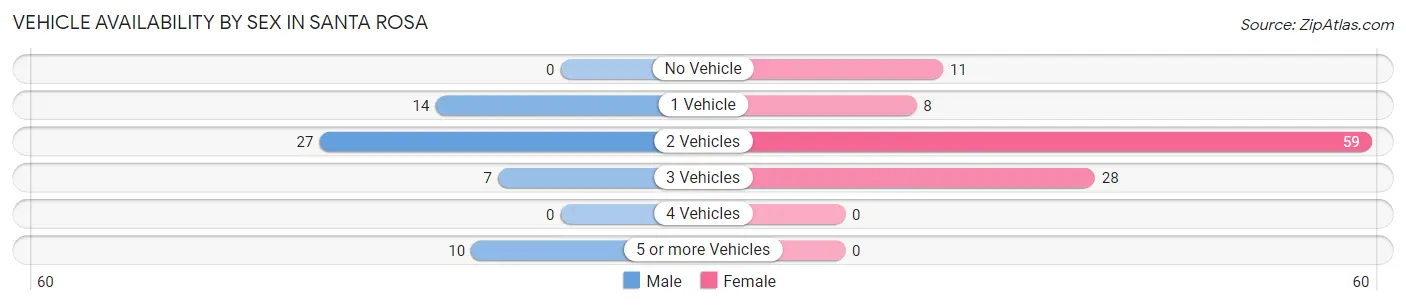
| Vehicles Available | Male | Female |
| No Vehicle | 0 (0.0%) | 11 (10.4%) |
| 1 Vehicle | 14 (24.1%) | 8 (7.5%) |
| 2 Vehicles | 27 (46.6%) | 59 (55.7%) |
| 3 Vehicles | 7 (12.1%) | 28 (26.4%) |
| 4 Vehicles | 0 (0.0%) | 0 (0.0%) |
| 5 or more Vehicles | 10 (17.2%) | 0 (0.0%) |
| Total | 58 (100.0%) | 106 (100.0%) |
Commute Time in Santa Rosa
The most frequently occuring commute durations in Santa Rosa are 5 to 9 minutes (46 commuters, 30.1%), 45 to 59 minutes (38 commuters, 24.8%), and 30 to 34 minutes (22 commuters, 14.4%).
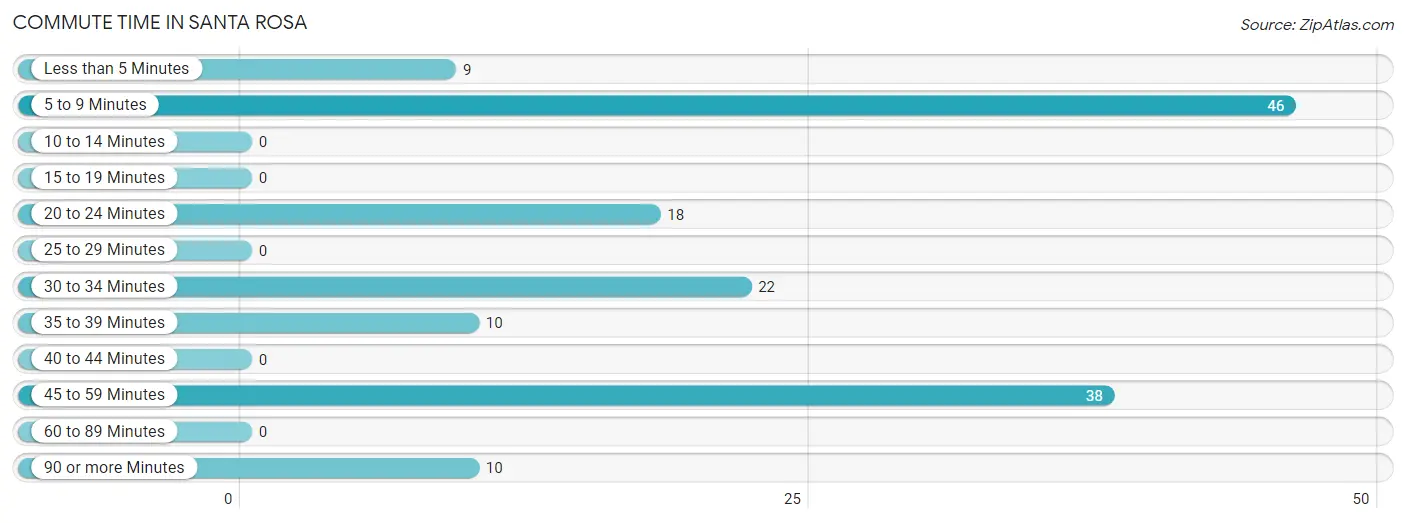
| Commute Time | # Commuters | % Commuters |
| Less than 5 Minutes | 9 | 5.9% |
| 5 to 9 Minutes | 46 | 30.1% |
| 10 to 14 Minutes | 0 | 0.0% |
| 15 to 19 Minutes | 0 | 0.0% |
| 20 to 24 Minutes | 18 | 11.8% |
| 25 to 29 Minutes | 0 | 0.0% |
| 30 to 34 Minutes | 22 | 14.4% |
| 35 to 39 Minutes | 10 | 6.5% |
| 40 to 44 Minutes | 0 | 0.0% |
| 45 to 59 Minutes | 38 | 24.8% |
| 60 to 89 Minutes | 0 | 0.0% |
| 90 or more Minutes | 10 | 6.5% |
Commute Time by Sex in Santa Rosa
The most common commute times in Santa Rosa are 45 to 59 minutes (13 commuters, 22.4%) for males and 5 to 9 minutes (38 commuters, 40.0%) for females.
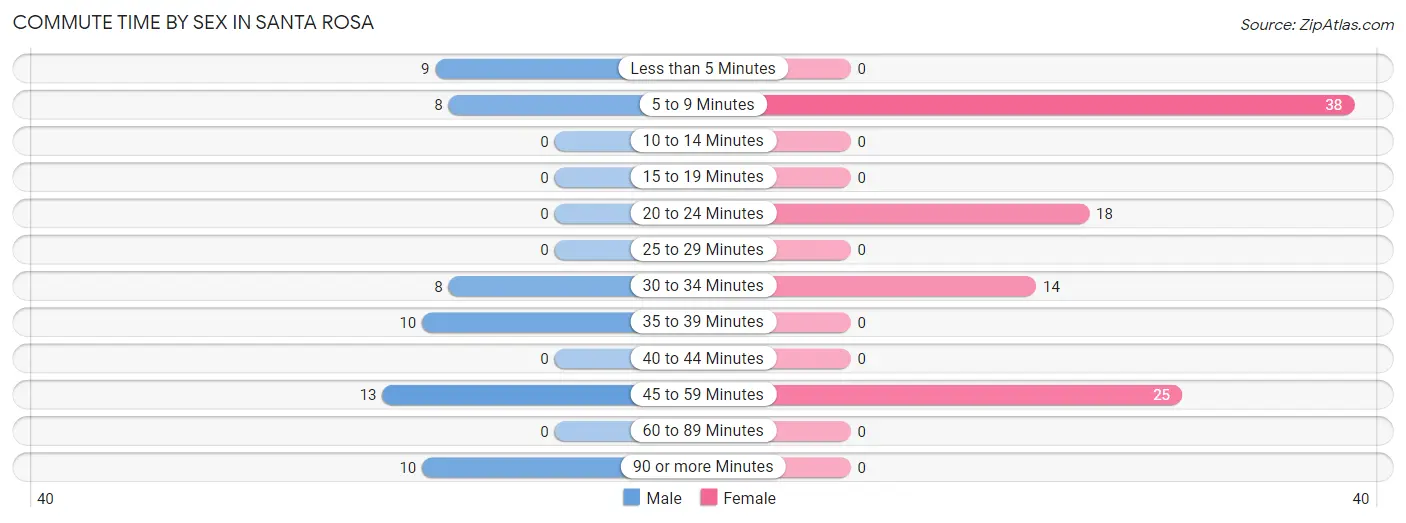
| Commute Time | Male | Female |
| Less than 5 Minutes | 9 (15.5%) | 0 (0.0%) |
| 5 to 9 Minutes | 8 (13.8%) | 38 (40.0%) |
| 10 to 14 Minutes | 0 (0.0%) | 0 (0.0%) |
| 15 to 19 Minutes | 0 (0.0%) | 0 (0.0%) |
| 20 to 24 Minutes | 0 (0.0%) | 18 (19.0%) |
| 25 to 29 Minutes | 0 (0.0%) | 0 (0.0%) |
| 30 to 34 Minutes | 8 (13.8%) | 14 (14.7%) |
| 35 to 39 Minutes | 10 (17.2%) | 0 (0.0%) |
| 40 to 44 Minutes | 0 (0.0%) | 0 (0.0%) |
| 45 to 59 Minutes | 13 (22.4%) | 25 (26.3%) |
| 60 to 89 Minutes | 0 (0.0%) | 0 (0.0%) |
| 90 or more Minutes | 10 (17.2%) | 0 (0.0%) |
Time of Departure to Work by Sex in Santa Rosa
The most frequent times of departure to work in Santa Rosa are 12:00 AM to 4:59 AM (10, 17.2%) for males and 7:30 AM to 7:59 AM (34, 35.8%) for females.
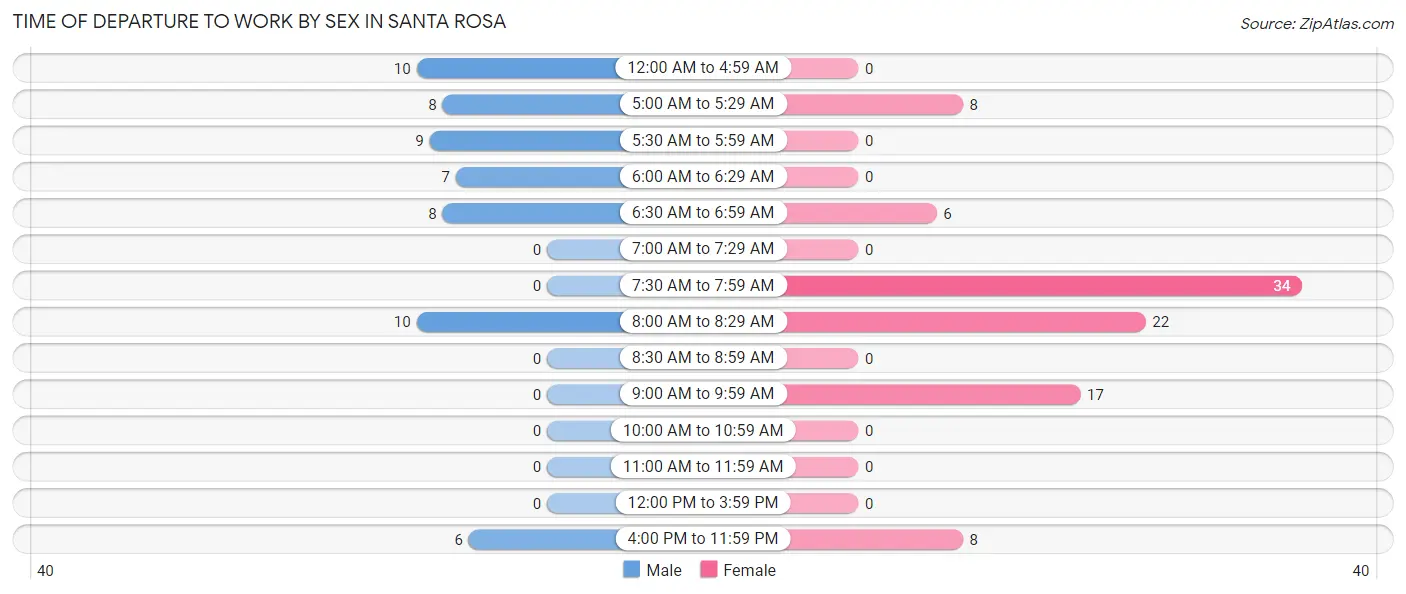
| Time of Departure | Male | Female |
| 12:00 AM to 4:59 AM | 10 (17.2%) | 0 (0.0%) |
| 5:00 AM to 5:29 AM | 8 (13.8%) | 8 (8.4%) |
| 5:30 AM to 5:59 AM | 9 (15.5%) | 0 (0.0%) |
| 6:00 AM to 6:29 AM | 7 (12.1%) | 0 (0.0%) |
| 6:30 AM to 6:59 AM | 8 (13.8%) | 6 (6.3%) |
| 7:00 AM to 7:29 AM | 0 (0.0%) | 0 (0.0%) |
| 7:30 AM to 7:59 AM | 0 (0.0%) | 34 (35.8%) |
| 8:00 AM to 8:29 AM | 10 (17.2%) | 22 (23.2%) |
| 8:30 AM to 8:59 AM | 0 (0.0%) | 0 (0.0%) |
| 9:00 AM to 9:59 AM | 0 (0.0%) | 17 (17.9%) |
| 10:00 AM to 10:59 AM | 0 (0.0%) | 0 (0.0%) |
| 11:00 AM to 11:59 AM | 0 (0.0%) | 0 (0.0%) |
| 12:00 PM to 3:59 PM | 0 (0.0%) | 0 (0.0%) |
| 4:00 PM to 11:59 PM | 6 (10.3%) | 8 (8.4%) |
| Total | 58 (100.0%) | 95 (100.0%) |
Housing Occupancy in Santa Rosa
Occupancy by Ownership in Santa Rosa
Of the total 154 dwellings in Santa Rosa, owner-occupied units account for 100 (64.9%), while renter-occupied units make up 54 (35.1%).
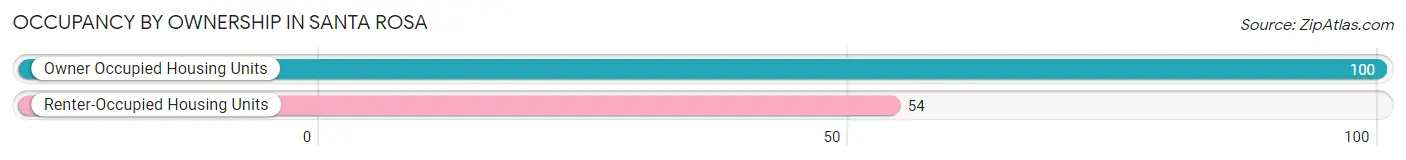
| Occupancy | # Housing Units | % Housing Units |
| Owner Occupied Housing Units | 100 | 64.9% |
| Renter-Occupied Housing Units | 54 | 35.1% |
| Total Occupied Housing Units | 154 | 100.0% |
Occupancy by Household Size in Santa Rosa
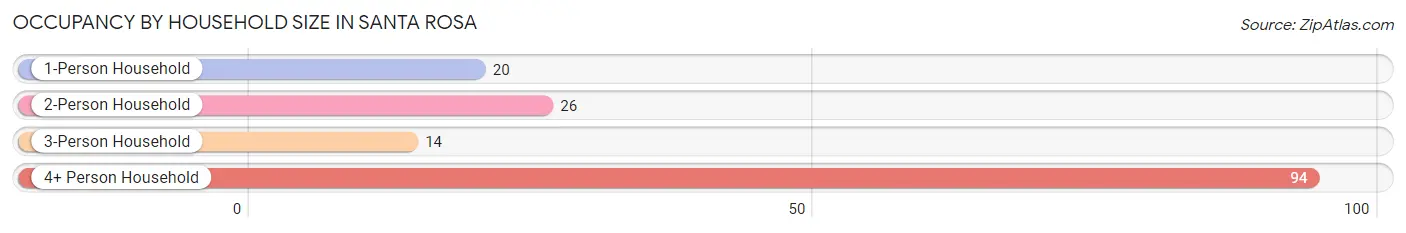
| Household Size | # Housing Units | % Housing Units |
| 1-Person Household | 20 | 13.0% |
| 2-Person Household | 26 | 16.9% |
| 3-Person Household | 14 | 9.1% |
| 4+ Person Household | 94 | 61.0% |
| Total Housing Units | 154 | 100.0% |
Occupancy by Ownership by Household Size in Santa Rosa
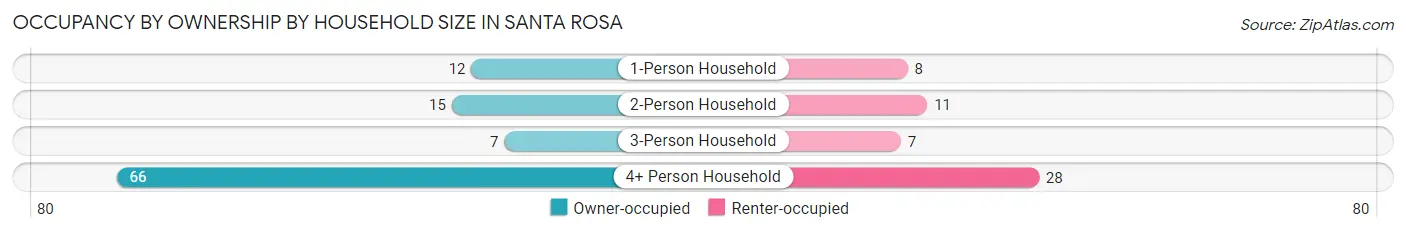
| Household Size | Owner-occupied | Renter-occupied |
| 1-Person Household | 12 (60.0%) | 8 (40.0%) |
| 2-Person Household | 15 (57.7%) | 11 (42.3%) |
| 3-Person Household | 7 (50.0%) | 7 (50.0%) |
| 4+ Person Household | 66 (70.2%) | 28 (29.8%) |
| Total Housing Units | 100 (64.9%) | 54 (35.1%) |
Occupancy by Educational Attainment in Santa Rosa
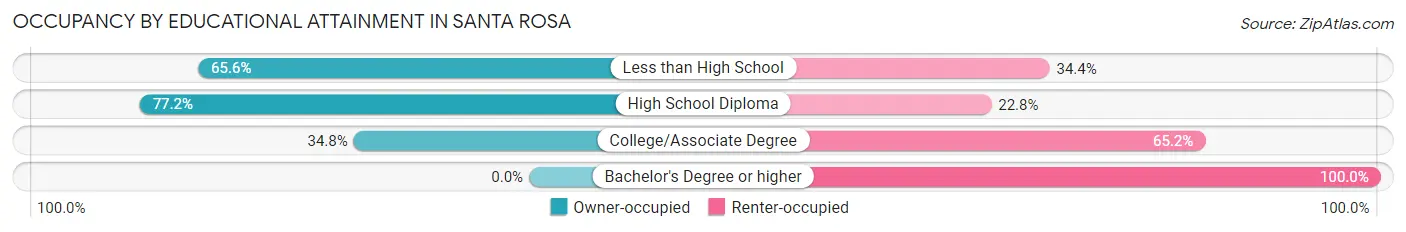
| Household Size | Owner-occupied | Renter-occupied |
| Less than High School | 21 (65.6%) | 11 (34.4%) |
| High School Diploma | 71 (77.2%) | 21 (22.8%) |
| College/Associate Degree | 8 (34.8%) | 15 (65.2%) |
| Bachelor's Degree or higher | 0 (0.0%) | 7 (100.0%) |
Occupancy by Age of Householder in Santa Rosa
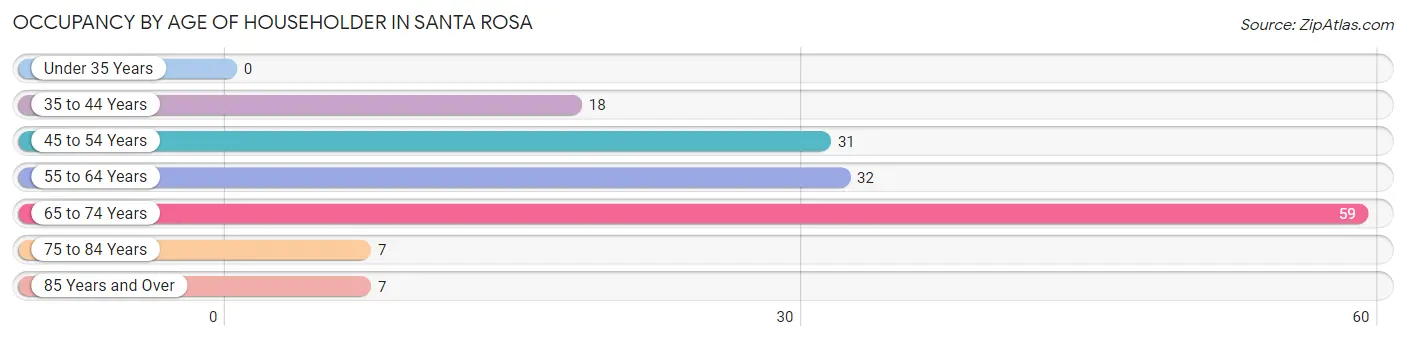
| Age Bracket | # Households | % Households |
| Under 35 Years | 0 | 0.0% |
| 35 to 44 Years | 18 | 11.7% |
| 45 to 54 Years | 31 | 20.1% |
| 55 to 64 Years | 32 | 20.8% |
| 65 to 74 Years | 59 | 38.3% |
| 75 to 84 Years | 7 | 4.5% |
| 85 Years and Over | 7 | 4.5% |
| Total | 154 | 100.0% |
Housing Finances in Santa Rosa
Median Income by Occupancy in Santa Rosa
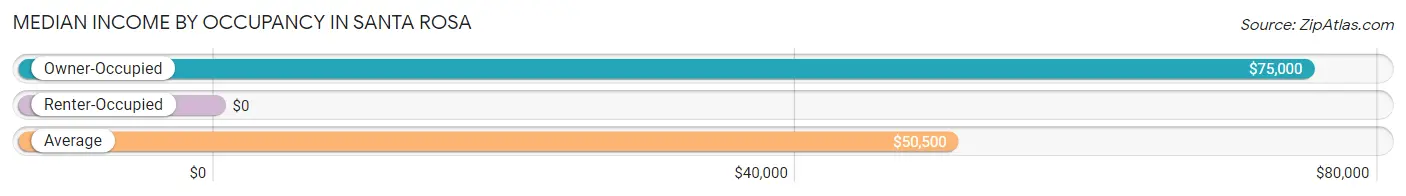
| Occupancy Type | # Households | Median Income |
| Owner-Occupied | 100 (64.9%) | $75,000 |
| Renter-Occupied | 54 (35.1%) | $0 |
| Average | 154 (100.0%) | $50,500 |
Occupancy by Householder Income Bracket in Santa Rosa
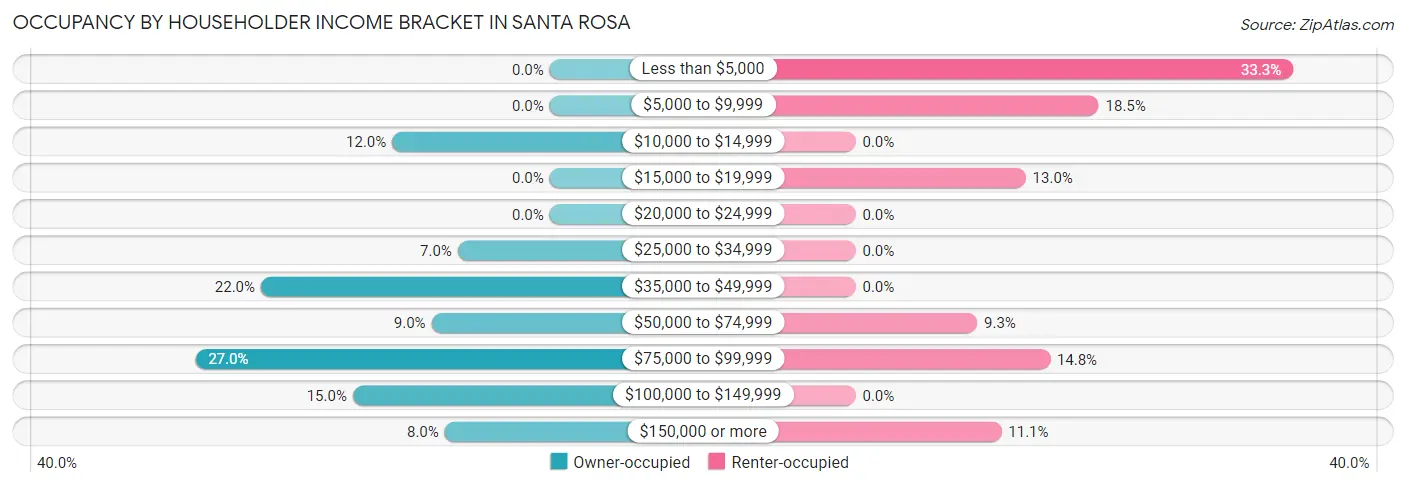
| Income Bracket | Owner-occupied | Renter-occupied |
| Less than $5,000 | 0 (0.0%) | 18 (33.3%) |
| $5,000 to $9,999 | 0 (0.0%) | 10 (18.5%) |
| $10,000 to $14,999 | 12 (12.0%) | 0 (0.0%) |
| $15,000 to $19,999 | 0 (0.0%) | 7 (13.0%) |
| $20,000 to $24,999 | 0 (0.0%) | 0 (0.0%) |
| $25,000 to $34,999 | 7 (7.0%) | 0 (0.0%) |
| $35,000 to $49,999 | 22 (22.0%) | 0 (0.0%) |
| $50,000 to $74,999 | 9 (9.0%) | 5 (9.3%) |
| $75,000 to $99,999 | 27 (27.0%) | 8 (14.8%) |
| $100,000 to $149,999 | 15 (15.0%) | 0 (0.0%) |
| $150,000 or more | 8 (8.0%) | 6 (11.1%) |
| Total | 100 (100.0%) | 54 (100.0%) |
Monthly Housing Cost Tiers in Santa Rosa
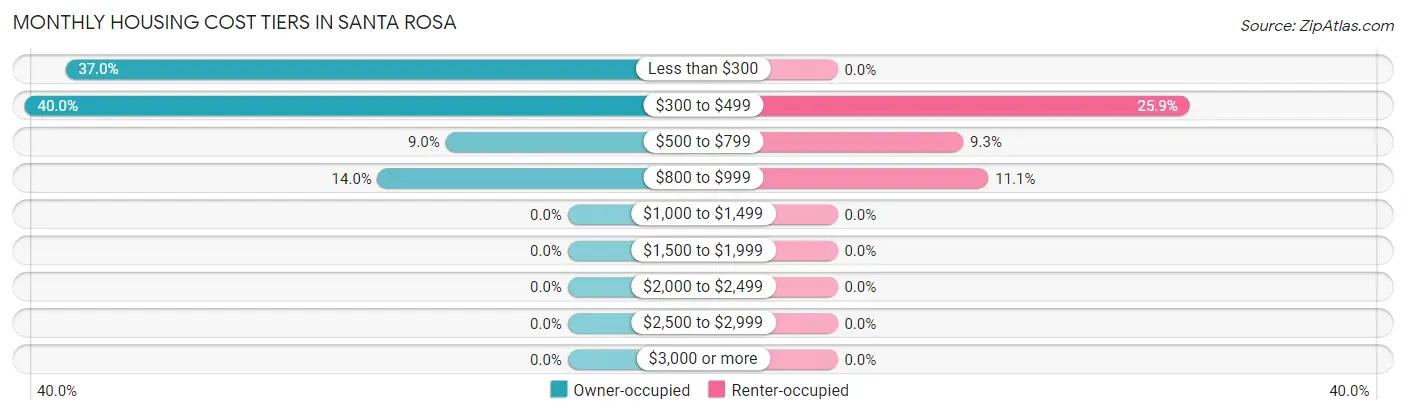
| Monthly Cost | Owner-occupied | Renter-occupied |
| Less than $300 | 37 (37.0%) | 0 (0.0%) |
| $300 to $499 | 40 (40.0%) | 14 (25.9%) |
| $500 to $799 | 9 (9.0%) | 5 (9.3%) |
| $800 to $999 | 14 (14.0%) | 6 (11.1%) |
| $1,000 to $1,499 | 0 (0.0%) | 0 (0.0%) |
| $1,500 to $1,999 | 0 (0.0%) | 0 (0.0%) |
| $2,000 to $2,499 | 0 (0.0%) | 0 (0.0%) |
| $2,500 to $2,999 | 0 (0.0%) | 0 (0.0%) |
| $3,000 or more | 0 (0.0%) | 0 (0.0%) |
| Total | 100 (100.0%) | 54 (100.0%) |
Physical Housing Characteristics in Santa Rosa
Housing Structures in Santa Rosa
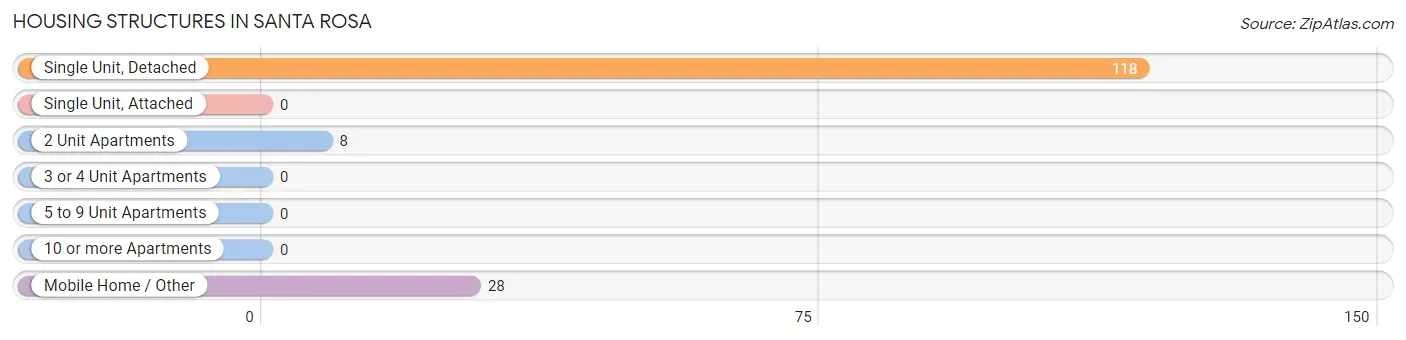
| Structure Type | # Housing Units | % Housing Units |
| Single Unit, Detached | 118 | 76.6% |
| Single Unit, Attached | 0 | 0.0% |
| 2 Unit Apartments | 8 | 5.2% |
| 3 or 4 Unit Apartments | 0 | 0.0% |
| 5 to 9 Unit Apartments | 0 | 0.0% |
| 10 or more Apartments | 0 | 0.0% |
| Mobile Home / Other | 28 | 18.2% |
| Total | 154 | 100.0% |
Housing Structures by Occupancy in Santa Rosa
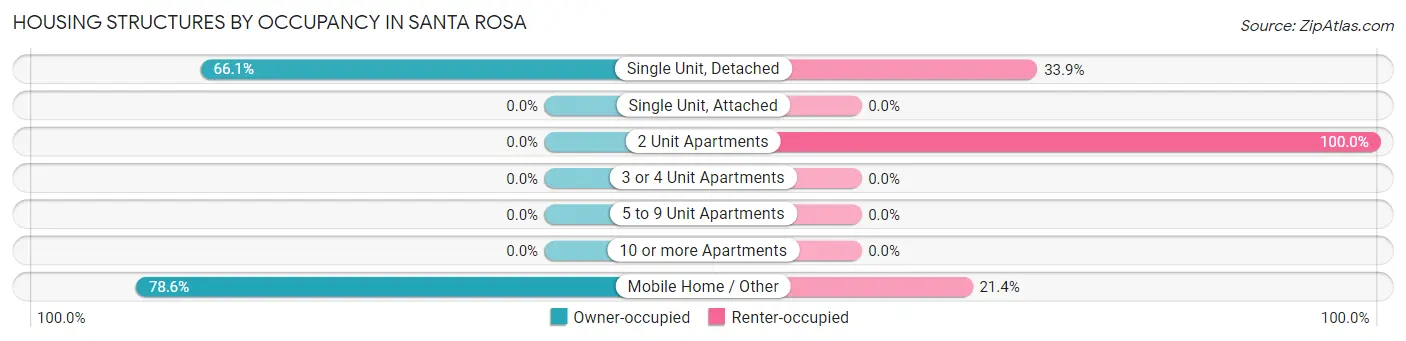
| Structure Type | Owner-occupied | Renter-occupied |
| Single Unit, Detached | 78 (66.1%) | 40 (33.9%) |
| Single Unit, Attached | 0 (0.0%) | 0 (0.0%) |
| 2 Unit Apartments | 0 (0.0%) | 8 (100.0%) |
| 3 or 4 Unit Apartments | 0 (0.0%) | 0 (0.0%) |
| 5 to 9 Unit Apartments | 0 (0.0%) | 0 (0.0%) |
| 10 or more Apartments | 0 (0.0%) | 0 (0.0%) |
| Mobile Home / Other | 22 (78.6%) | 6 (21.4%) |
| Total | 100 (64.9%) | 54 (35.1%) |
Housing Structures by Number of Rooms in Santa Rosa
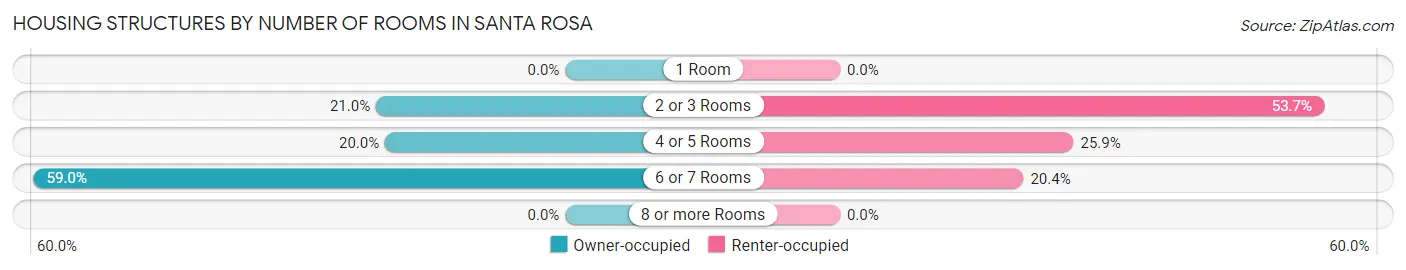
| Number of Rooms | Owner-occupied | Renter-occupied |
| 1 Room | 0 (0.0%) | 0 (0.0%) |
| 2 or 3 Rooms | 21 (21.0%) | 29 (53.7%) |
| 4 or 5 Rooms | 20 (20.0%) | 14 (25.9%) |
| 6 or 7 Rooms | 59 (59.0%) | 11 (20.4%) |
| 8 or more Rooms | 0 (0.0%) | 0 (0.0%) |
| Total | 100 (100.0%) | 54 (100.0%) |
Housing Structure by Heating Type in Santa Rosa
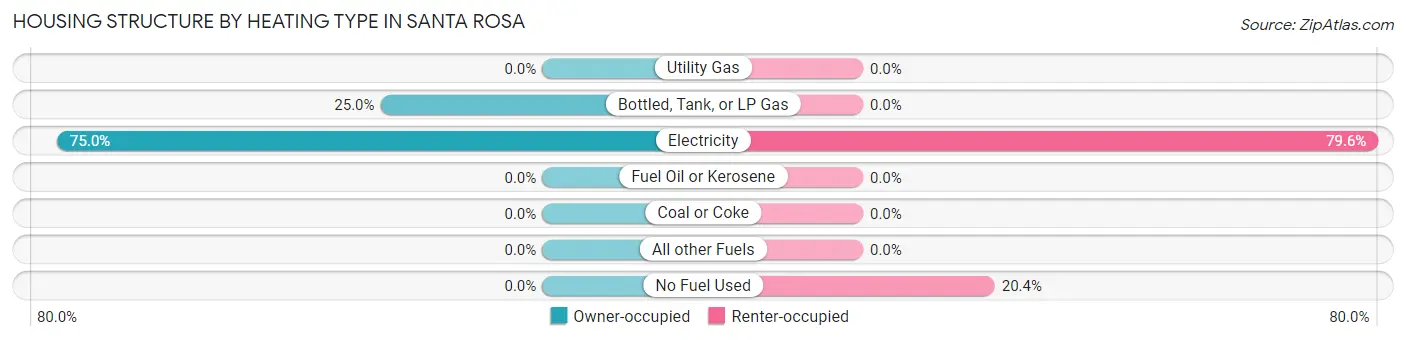
| Heating Type | Owner-occupied | Renter-occupied |
| Utility Gas | 0 (0.0%) | 0 (0.0%) |
| Bottled, Tank, or LP Gas | 25 (25.0%) | 0 (0.0%) |
| Electricity | 75 (75.0%) | 43 (79.6%) |
| Fuel Oil or Kerosene | 0 (0.0%) | 0 (0.0%) |
| Coal or Coke | 0 (0.0%) | 0 (0.0%) |
| All other Fuels | 0 (0.0%) | 0 (0.0%) |
| No Fuel Used | 0 (0.0%) | 11 (20.4%) |
| Total | 100 (100.0%) | 54 (100.0%) |
Household Vehicle Usage in Santa Rosa
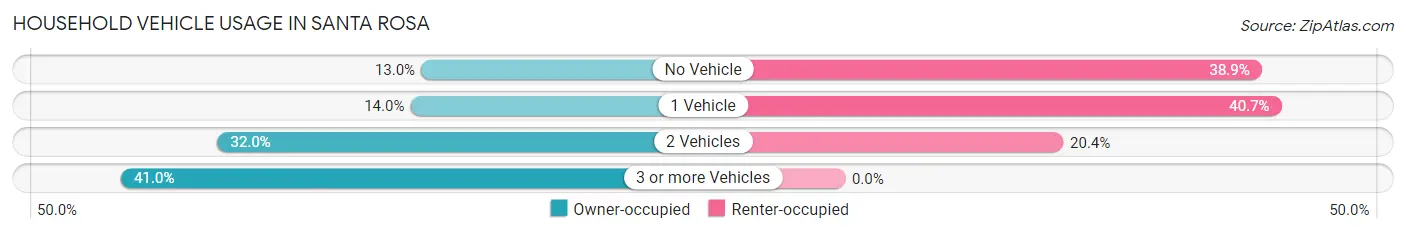
| Vehicles per Household | Owner-occupied | Renter-occupied |
| No Vehicle | 13 (13.0%) | 21 (38.9%) |
| 1 Vehicle | 14 (14.0%) | 22 (40.7%) |
| 2 Vehicles | 32 (32.0%) | 11 (20.4%) |
| 3 or more Vehicles | 41 (41.0%) | 0 (0.0%) |
| Total | 100 (100.0%) | 54 (100.0%) |
Real Estate & Mortgages in Santa Rosa
Real Estate and Mortgage Overview in Santa Rosa
| Characteristic | Without Mortgage | With Mortgage |
| Housing Units | 86 | 14 |
| Median Property Value | $94,400 | $0 |
| Median Household Income | $74,722 | $8 |
| Monthly Housing Costs | $375 | $0 |
| Real Estate Taxes | - | - |
Property Value by Mortgage Status in Santa Rosa
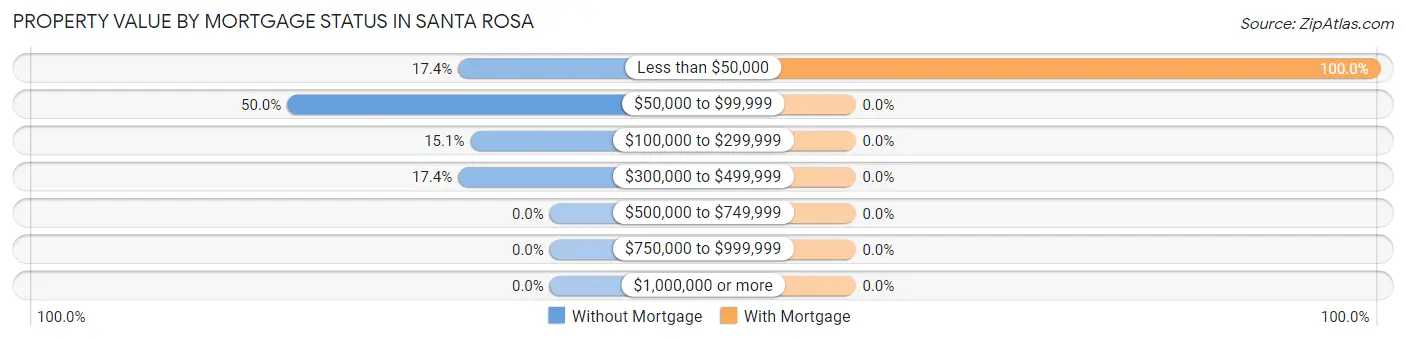
| Property Value | Without Mortgage | With Mortgage |
| Less than $50,000 | 15 (17.4%) | 14 (100.0%) |
| $50,000 to $99,999 | 43 (50.0%) | 0 (0.0%) |
| $100,000 to $299,999 | 13 (15.1%) | 0 (0.0%) |
| $300,000 to $499,999 | 15 (17.4%) | 0 (0.0%) |
| $500,000 to $749,999 | 0 (0.0%) | 0 (0.0%) |
| $750,000 to $999,999 | 0 (0.0%) | 0 (0.0%) |
| $1,000,000 or more | 0 (0.0%) | 0 (0.0%) |
| Total | 86 (100.0%) | 14 (100.0%) |
Household Income by Mortgage Status in Santa Rosa
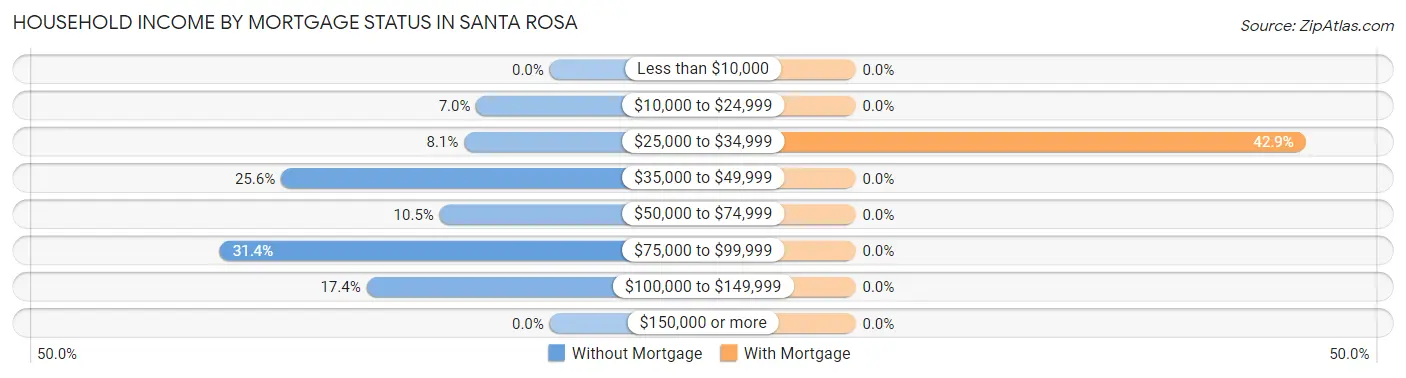
| Household Income | Without Mortgage | With Mortgage |
| Less than $10,000 | 0 (0.0%) | 0 (0.0%) |
| $10,000 to $24,999 | 6 (7.0%) | 0 (0.0%) |
| $25,000 to $34,999 | 7 (8.1%) | 6 (42.9%) |
| $35,000 to $49,999 | 22 (25.6%) | 0 (0.0%) |
| $50,000 to $74,999 | 9 (10.5%) | 0 (0.0%) |
| $75,000 to $99,999 | 27 (31.4%) | 0 (0.0%) |
| $100,000 to $149,999 | 15 (17.4%) | 0 (0.0%) |
| $150,000 or more | 0 (0.0%) | 0 (0.0%) |
| Total | 86 (100.0%) | 14 (100.0%) |
Property Value to Household Income Ratio in Santa Rosa
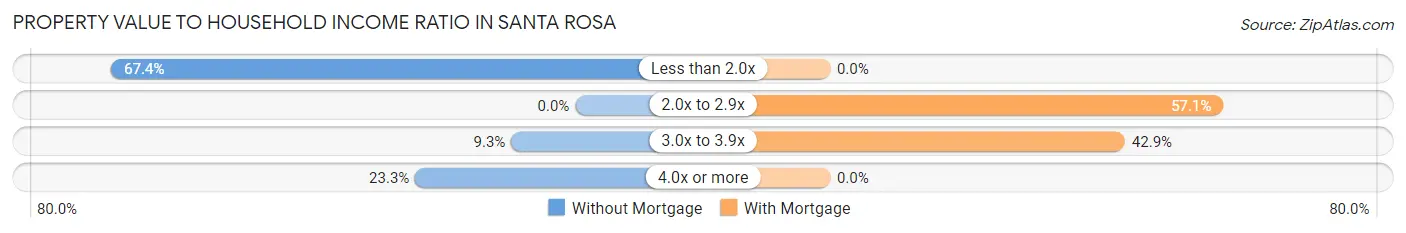
| Value-to-Income Ratio | Without Mortgage | With Mortgage |
| Less than 2.0x | 58 (67.4%) | 0 (0.0%) |
| 2.0x to 2.9x | 0 (0.0%) | 8 (57.1%) |
| 3.0x to 3.9x | 8 (9.3%) | 6 (42.9%) |
| 4.0x or more | 20 (23.3%) | 0 (0.0%) |
| Total | 86 (100.0%) | 14 (100.0%) |
Real Estate Taxes by Mortgage Status in Santa Rosa
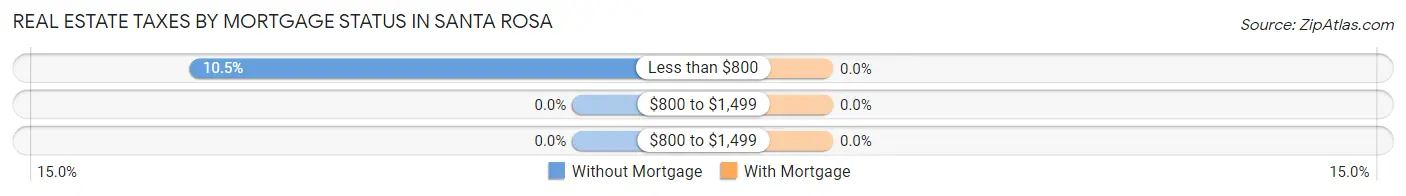
| Property Taxes | Without Mortgage | With Mortgage |
| Less than $800 | 9 (10.5%) | 0 (0.0%) |
| $800 to $1,499 | 0 (0.0%) | 0 (0.0%) |
| $800 to $1,499 | 0 (0.0%) | 0 (0.0%) |
| Total | 86 (100.0%) | 14 (100.0%) |
Health & Disability in Santa Rosa
Health Insurance Coverage by Age in Santa Rosa
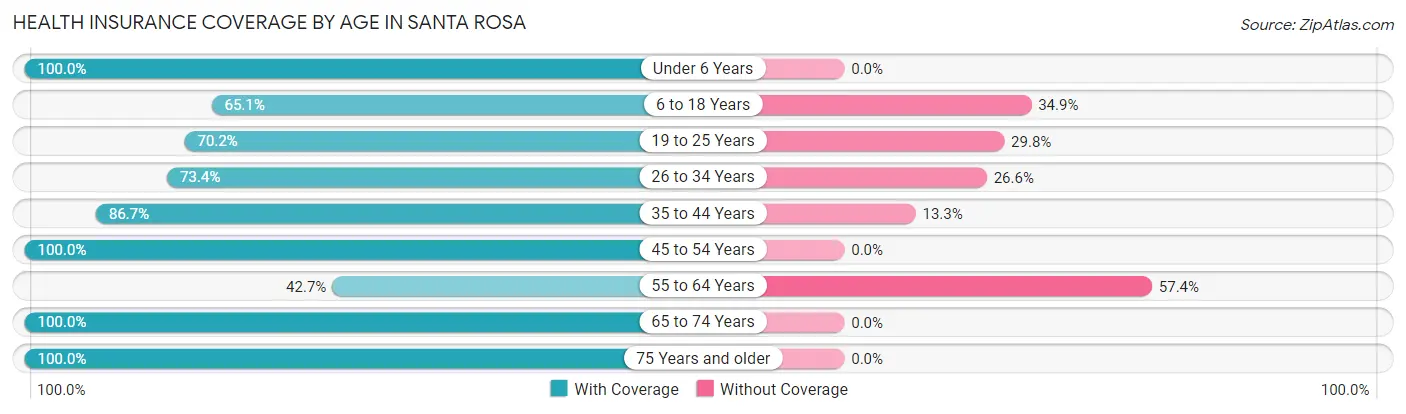
| Age Bracket | With Coverage | Without Coverage |
| Under 6 Years | 18 (100.0%) | 0 (0.0%) |
| 6 to 18 Years | 142 (65.1%) | 76 (34.9%) |
| 19 to 25 Years | 73 (70.2%) | 31 (29.8%) |
| 26 to 34 Years | 47 (73.4%) | 17 (26.6%) |
| 35 to 44 Years | 111 (86.7%) | 17 (13.3%) |
| 45 to 54 Years | 56 (100.0%) | 0 (0.0%) |
| 55 to 64 Years | 29 (42.6%) | 39 (57.4%) |
| 65 to 74 Years | 79 (100.0%) | 0 (0.0%) |
| 75 Years and older | 14 (100.0%) | 0 (0.0%) |
| Total | 569 (76.0%) | 180 (24.0%) |
Health Insurance Coverage by Citizenship Status in Santa Rosa
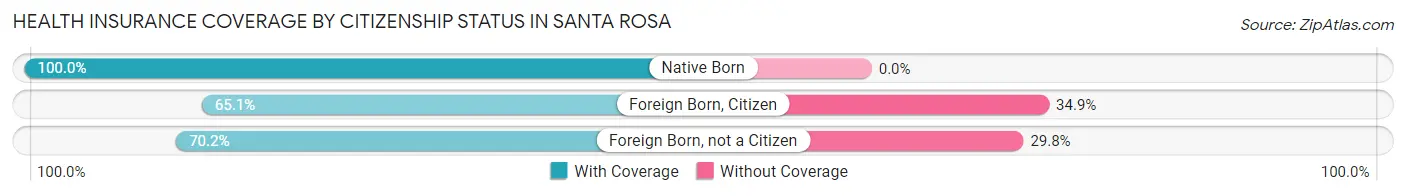
| Citizenship Status | With Coverage | Without Coverage |
| Native Born | 18 (100.0%) | 0 (0.0%) |
| Foreign Born, Citizen | 142 (65.1%) | 76 (34.9%) |
| Foreign Born, not a Citizen | 73 (70.2%) | 31 (29.8%) |
Health Insurance Coverage by Household Income in Santa Rosa
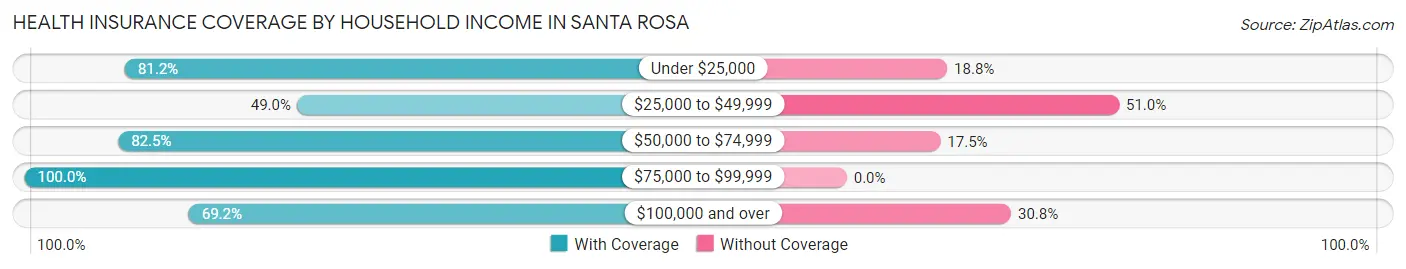
| Household Income | With Coverage | Without Coverage |
| Under $25,000 | 108 (81.2%) | 25 (18.8%) |
| $25,000 to $49,999 | 49 (49.0%) | 51 (51.0%) |
| $50,000 to $74,999 | 94 (82.5%) | 20 (17.5%) |
| $75,000 to $99,999 | 129 (100.0%) | 0 (0.0%) |
| $100,000 and over | 189 (69.2%) | 84 (30.8%) |
Public vs Private Health Insurance Coverage by Age in Santa Rosa
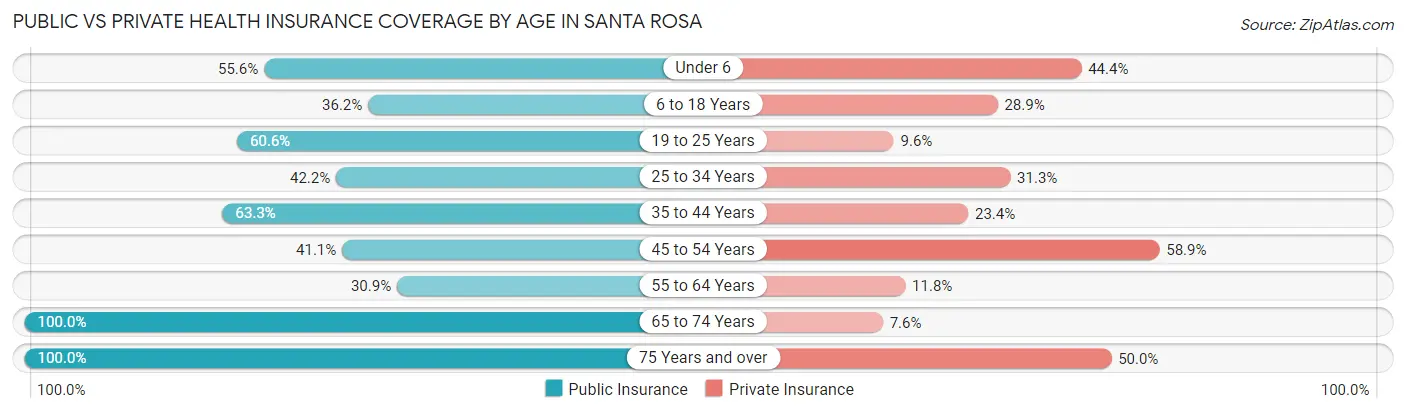
| Age Bracket | Public Insurance | Private Insurance |
| Under 6 | 10 (55.6%) | 8 (44.4%) |
| 6 to 18 Years | 79 (36.2%) | 63 (28.9%) |
| 19 to 25 Years | 63 (60.6%) | 10 (9.6%) |
| 25 to 34 Years | 27 (42.2%) | 20 (31.2%) |
| 35 to 44 Years | 81 (63.3%) | 30 (23.4%) |
| 45 to 54 Years | 23 (41.1%) | 33 (58.9%) |
| 55 to 64 Years | 21 (30.9%) | 8 (11.8%) |
| 65 to 74 Years | 79 (100.0%) | 6 (7.6%) |
| 75 Years and over | 14 (100.0%) | 7 (50.0%) |
| Total | 397 (53.0%) | 185 (24.7%) |
Disability Status by Sex by Age in Santa Rosa
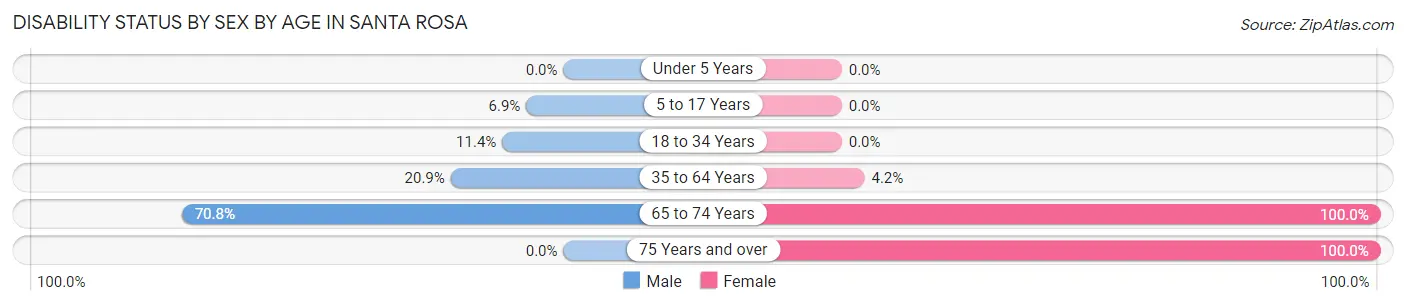
| Age Bracket | Male | Female |
| Under 5 Years | 0 (0.0%) | 0 (0.0%) |
| 5 to 17 Years | 8 (6.9%) | 0 (0.0%) |
| 18 to 34 Years | 10 (11.4%) | 0 (0.0%) |
| 35 to 64 Years | 18 (20.9%) | 7 (4.2%) |
| 65 to 74 Years | 34 (70.8%) | 31 (100.0%) |
| 75 Years and over | 0 (0.0%) | 14 (100.0%) |
Disability Class by Sex by Age in Santa Rosa
Disability Class: Hearing Difficulty
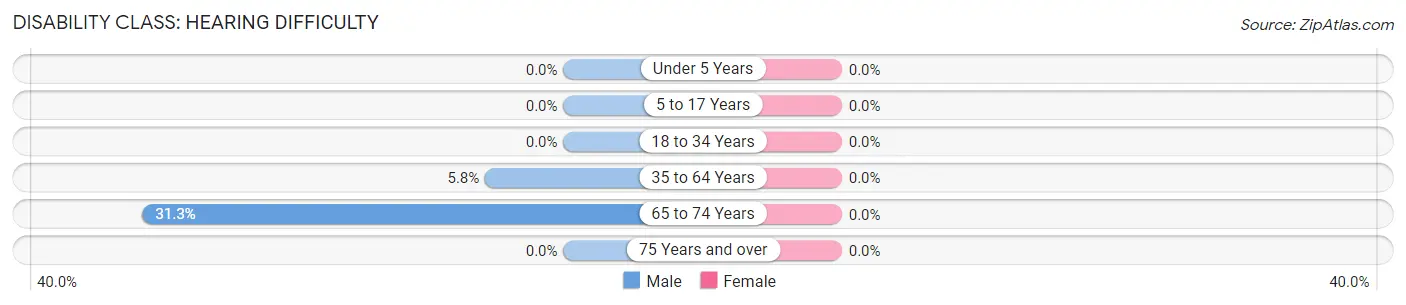
| Age Bracket | Male | Female |
| Under 5 Years | 0 (0.0%) | 0 (0.0%) |
| 5 to 17 Years | 0 (0.0%) | 0 (0.0%) |
| 18 to 34 Years | 0 (0.0%) | 0 (0.0%) |
| 35 to 64 Years | 5 (5.8%) | 0 (0.0%) |
| 65 to 74 Years | 15 (31.2%) | 0 (0.0%) |
| 75 Years and over | 0 (0.0%) | 0 (0.0%) |
Disability Class: Vision Difficulty
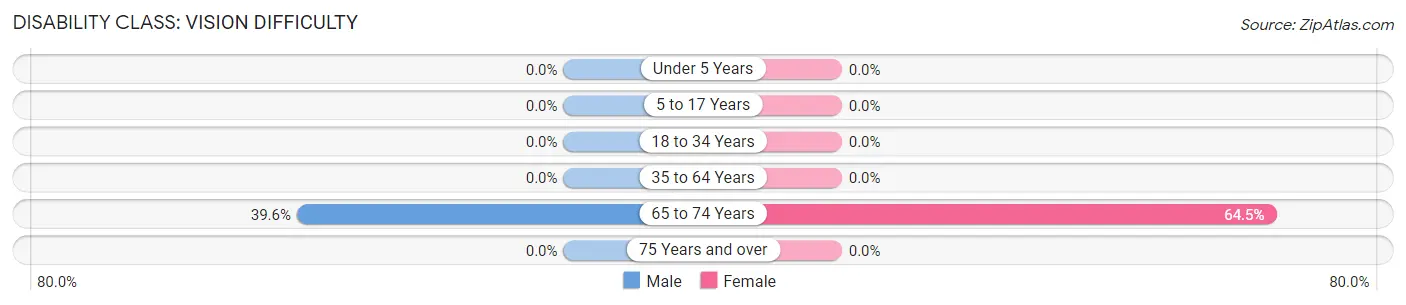
| Age Bracket | Male | Female |
| Under 5 Years | 0 (0.0%) | 0 (0.0%) |
| 5 to 17 Years | 0 (0.0%) | 0 (0.0%) |
| 18 to 34 Years | 0 (0.0%) | 0 (0.0%) |
| 35 to 64 Years | 0 (0.0%) | 0 (0.0%) |
| 65 to 74 Years | 19 (39.6%) | 20 (64.5%) |
| 75 Years and over | 0 (0.0%) | 0 (0.0%) |
Disability Class: Cognitive Difficulty
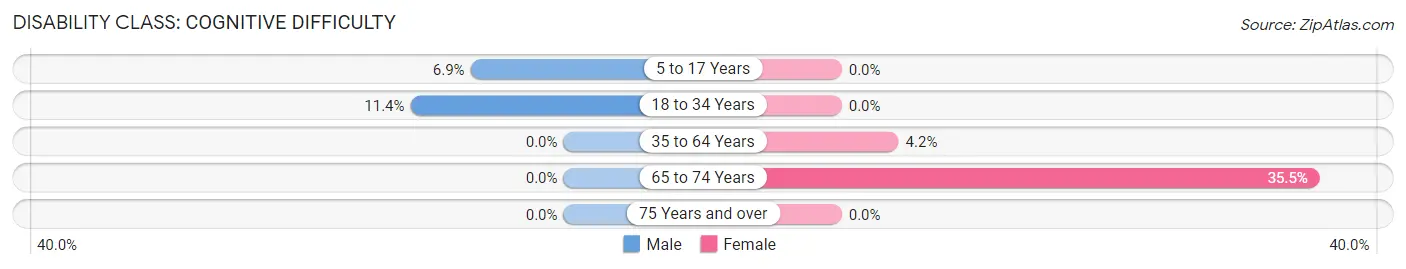
| Age Bracket | Male | Female |
| 5 to 17 Years | 8 (6.9%) | 0 (0.0%) |
| 18 to 34 Years | 10 (11.4%) | 0 (0.0%) |
| 35 to 64 Years | 0 (0.0%) | 7 (4.2%) |
| 65 to 74 Years | 0 (0.0%) | 11 (35.5%) |
| 75 Years and over | 0 (0.0%) | 0 (0.0%) |
Disability Class: Ambulatory Difficulty
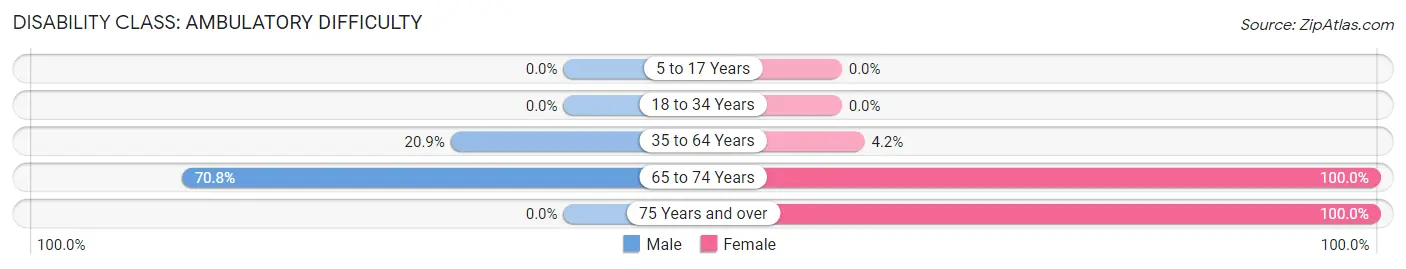
| Age Bracket | Male | Female |
| 5 to 17 Years | 0 (0.0%) | 0 (0.0%) |
| 18 to 34 Years | 0 (0.0%) | 0 (0.0%) |
| 35 to 64 Years | 18 (20.9%) | 7 (4.2%) |
| 65 to 74 Years | 34 (70.8%) | 31 (100.0%) |
| 75 Years and over | 0 (0.0%) | 14 (100.0%) |
Disability Class: Self-Care Difficulty
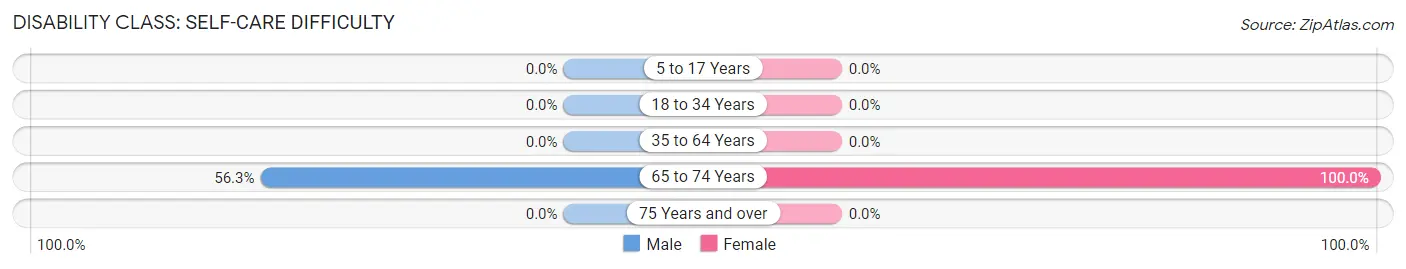
| Age Bracket | Male | Female |
| 5 to 17 Years | 0 (0.0%) | 0 (0.0%) |
| 18 to 34 Years | 0 (0.0%) | 0 (0.0%) |
| 35 to 64 Years | 0 (0.0%) | 0 (0.0%) |
| 65 to 74 Years | 27 (56.2%) | 31 (100.0%) |
| 75 Years and over | 0 (0.0%) | 0 (0.0%) |
Technology Access in Santa Rosa
Computing Device Access in Santa Rosa
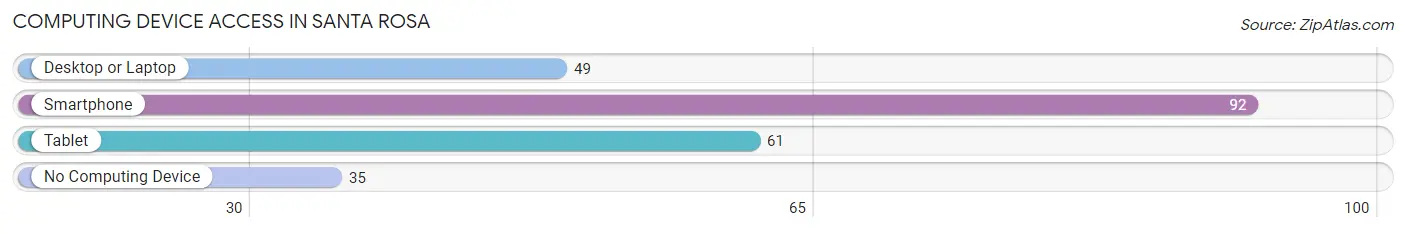
| Device Type | # Households | % Households |
| Desktop or Laptop | 49 | 31.8% |
| Smartphone | 92 | 59.7% |
| Tablet | 61 | 39.6% |
| No Computing Device | 35 | 22.7% |
| Total | 154 | 100.0% |
Internet Access in Santa Rosa
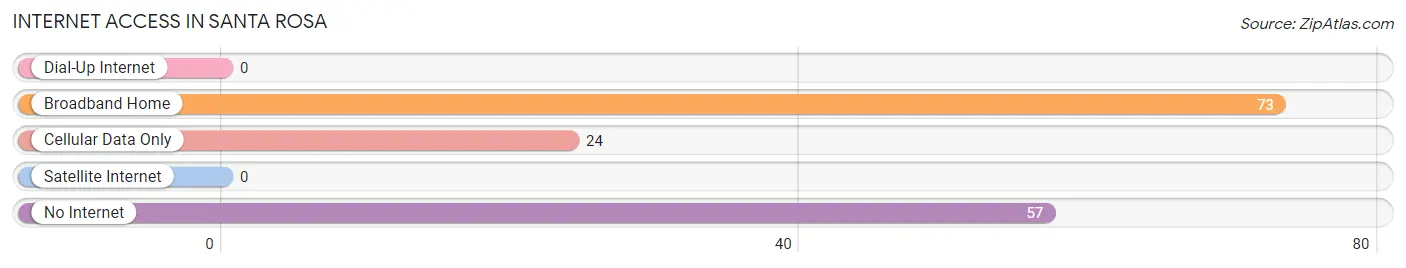
| Internet Type | # Households | % Households |
| Dial-Up Internet | 0 | 0.0% |
| Broadband Home | 73 | 47.4% |
| Cellular Data Only | 24 | 15.6% |
| Satellite Internet | 0 | 0.0% |
| No Internet | 57 | 37.0% |
| Total | 154 | 100.0% |
Santa Rosa Summary
Introduction
Santa Rosa is a small town located in the state of Arizona, in the United States. It is situated in the northern part of the state, in Yavapai County. The town has a population of around 1,500 people and is known for its rural atmosphere and its proximity to the Grand Canyon. Santa Rosa is a popular tourist destination, with many visitors coming to explore the area’s natural beauty and to take part in outdoor activities such as hiking, camping, and fishing.
History
Santa Rosa was founded in 1876 by a group of settlers from the nearby town of Prescott. The settlers were looking for a place to settle and start a new life, and they chose the area around Santa Rosa because of its natural beauty and its proximity to the Grand Canyon. The town was originally called “Rosa”, but the name was changed to Santa Rosa in 1882.
The town grew slowly over the years, and by the early 1900s it had become a popular tourist destination. The town was known for its hot springs, which were believed to have healing properties. In the 1920s, the town was connected to the rest of the state by a railroad line, which helped to further increase its popularity.
Geography
Santa Rosa is located in the northern part of Arizona, in Yavapai County. The town is situated in the Verde Valley, which is a region of the state known for its natural beauty. The town is surrounded by mountains and is close to the Grand Canyon. The town is located at an elevation of 4,500 feet, and the climate is generally mild and dry.
Economy
The economy of Santa Rosa is largely based on tourism. The town is a popular destination for visitors who come to explore the area’s natural beauty and to take part in outdoor activities such as hiking, camping, and fishing. The town also has a number of small businesses, including restaurants, shops, and hotels.
Demographics
As of the 2010 census, the population of Santa Rosa was 1,500. The town is predominantly white, with around 90% of the population being of European descent. The town also has a small Hispanic population, with around 5% of the population being of Hispanic or Latino origin. The median household income in Santa Rosa is around $35,000, and the median age is around 40 years old.
Conclusion
Santa Rosa is a small town located in the northern part of Arizona, in Yavapai County. The town has a population of around 1,500 people and is known for its rural atmosphere and its proximity to the Grand Canyon. The town’s economy is largely based on tourism, and it is a popular destination for visitors who come to explore the area’s natural beauty and to take part in outdoor activities. The town is predominantly white, with around 90% of the population being of European descent. The median household income in Santa Rosa is around $35,000, and the median age is around 40 years old.
Common Questions
What is Per Capita Income in Santa Rosa?
Per Capita income in Santa Rosa is $14,178.
What is the Median Family Income in Santa Rosa?
Median Family Income in Santa Rosa is $51,500.
What is the Median Household income in Santa Rosa?
Median Household Income in Santa Rosa is $50,500.
What is Income or Wage Gap in Santa Rosa?
Income or Wage Gap in Santa Rosa is 53.6%.
Women in Santa Rosa earn 46.4 cents for every dollar earned by a man.
What is Inequality or Gini Index in Santa Rosa?
Inequality or Gini Index in Santa Rosa is 0.47.
What is the Total Population of Santa Rosa?
Total Population of Santa Rosa is 749.
What is the Total Male Population of Santa Rosa?
Total Male Population of Santa Rosa is 341.
What is the Total Female Population of Santa Rosa?
Total Female Population of Santa Rosa is 408.
What is the Ratio of Males per 100 Females in Santa Rosa?
There are 83.58 Males per 100 Females in Santa Rosa.
What is the Ratio of Females per 100 Males in Santa Rosa?
There are 119.65 Females per 100 Males in Santa Rosa.
What is the Median Population Age in Santa Rosa?
Median Population Age in Santa Rosa is 33.2 Years.
What is the Average Family Size in Santa Rosa
Average Family Size in Santa Rosa is 5.0 People.
What is the Average Household Size in Santa Rosa
Average Household Size in Santa Rosa is 4.9 People.
How Large is the Labor Force in Santa Rosa?
There are 215 People in the Labor Forcein in Santa Rosa.
What is the Percentage of People in the Labor Force in Santa Rosa?
37.3% of People are in the Labor Force in Santa Rosa.
What is the Unemployment Rate in Santa Rosa?
Unemployment Rate in Santa Rosa is 12.1%.