La Fayette, AL Map & Demographics
La Fayette Map
La Fayette Overview
$22,150
PER CAPITA INCOME
$43,958
AVG FAMILY INCOME
$32,031
AVG HOUSEHOLD INCOME
40.1%
WAGE / INCOME GAP [ % ]
59.9¢/ $1
WAGE / INCOME GAP [ $ ]
$11,871
FAMILY INCOME DEFICIT
0.45
INEQUALITY / GINI INDEX
2,700
TOTAL POPULATION
1,454
MALE POPULATION
1,246
FEMALE POPULATION
116.69
MALES / 100 FEMALES
85.69
FEMALES / 100 MALES
48.4
MEDIAN AGE
2.8
AVG FAMILY SIZE
2.3
AVG HOUSEHOLD SIZE
925
LABOR FORCE [ PEOPLE ]
39.6%
PERCENT IN LABOR FORCE
3.7%
UNEMPLOYMENT RATE
Income in La Fayette
Income Overview in La Fayette
Per Capita Income in La Fayette is $22,150, while median incomes of families and households are $43,958 and $32,031 respectively.
| Characteristic | Number | Measure |
| Per Capita Income | 2,700 | $22,150 |
| Median Family Income | 708 | $43,958 |
| Mean Family Income | 708 | $61,864 |
| Median Household Income | 1,070 | $32,031 |
| Mean Household Income | 1,070 | $50,506 |
| Income Deficit | 708 | $11,871 |
| Wage / Income Gap (%) | 2,700 | 40.08% |
| Wage / Income Gap ($) | 2,700 | 59.92¢ per $1 |
| Gini / Inequality Index | 2,700 | 0.45 |
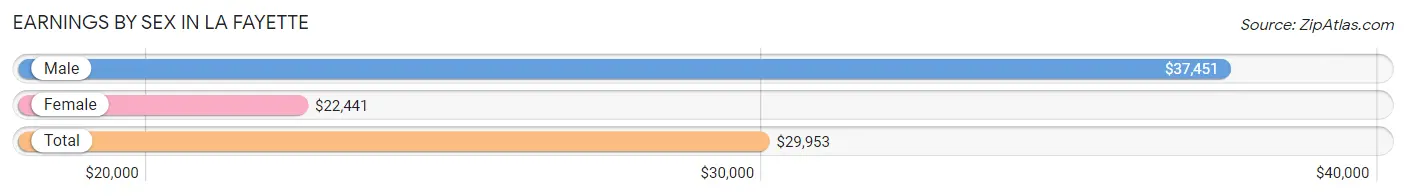
Earnings by Sex in La Fayette
Average Earnings in La Fayette are $29,953, $37,451 for men and $22,441 for women, a difference of 40.1%.
| Sex | Number | Average Earnings |
| Male | 548 (49.7%) | $37,451 |
| Female | 554 (50.3%) | $22,441 |
| Total | 1,102 (100.0%) | $29,953 |
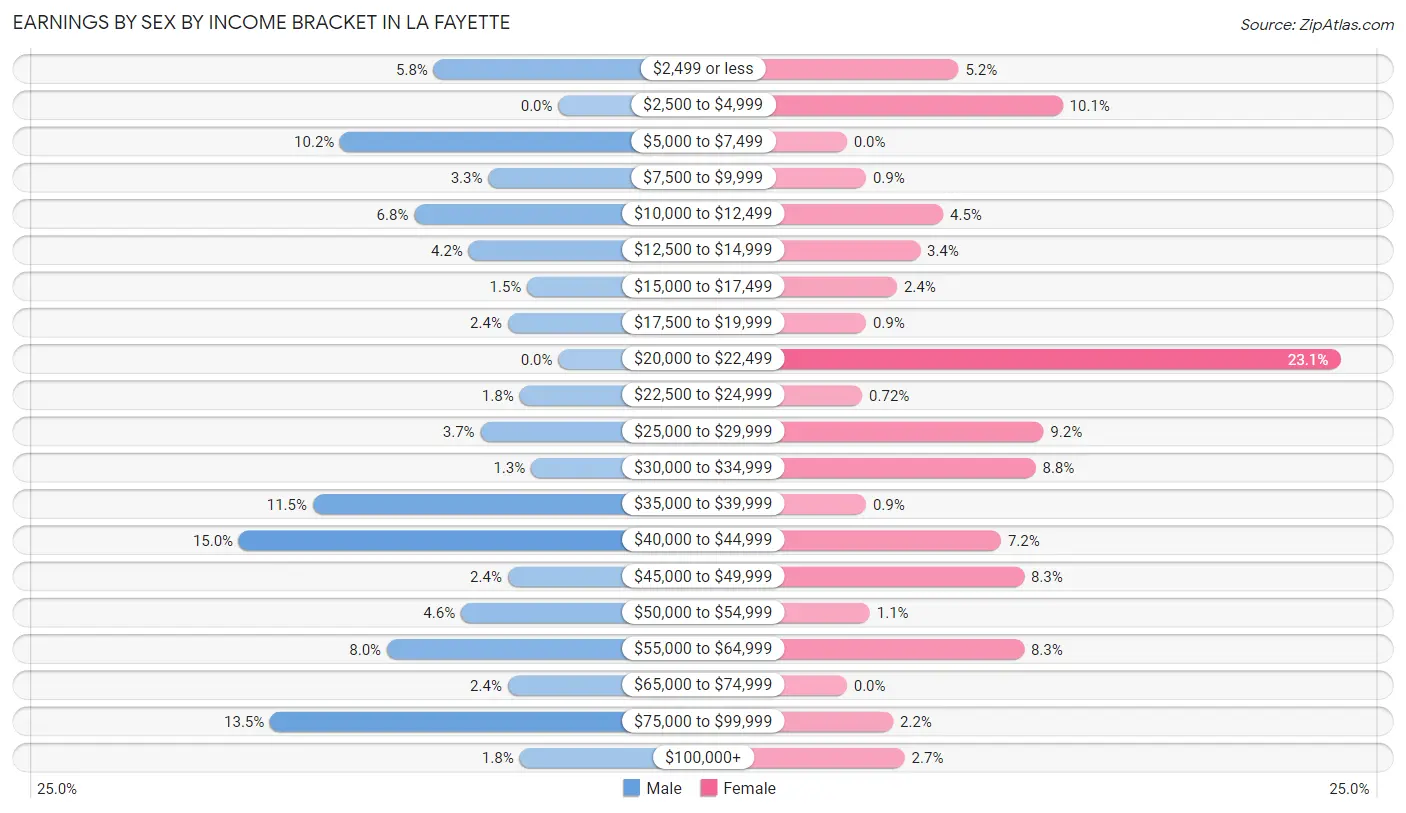
Earnings by Sex by Income Bracket in La Fayette
The most common earnings brackets in La Fayette are $40,000 to $44,999 for men (82 | 15.0%) and $20,000 to $22,499 for women (128 | 23.1%).
| Income | Male | Female |
| $2,499 or less | 32 (5.8%) | 29 (5.2%) |
| $2,500 to $4,999 | 0 (0.0%) | 56 (10.1%) |
| $5,000 to $7,499 | 56 (10.2%) | 0 (0.0%) |
| $7,500 to $9,999 | 18 (3.3%) | 5 (0.9%) |
| $10,000 to $12,499 | 37 (6.8%) | 25 (4.5%) |
| $12,500 to $14,999 | 23 (4.2%) | 19 (3.4%) |
| $15,000 to $17,499 | 8 (1.5%) | 13 (2.4%) |
| $17,500 to $19,999 | 13 (2.4%) | 5 (0.9%) |
| $20,000 to $22,499 | 0 (0.0%) | 128 (23.1%) |
| $22,500 to $24,999 | 10 (1.8%) | 4 (0.7%) |
| $25,000 to $29,999 | 20 (3.6%) | 51 (9.2%) |
| $30,000 to $34,999 | 7 (1.3%) | 49 (8.8%) |
| $35,000 to $39,999 | 63 (11.5%) | 5 (0.9%) |
| $40,000 to $44,999 | 82 (15.0%) | 40 (7.2%) |
| $45,000 to $49,999 | 13 (2.4%) | 46 (8.3%) |
| $50,000 to $54,999 | 25 (4.6%) | 6 (1.1%) |
| $55,000 to $64,999 | 44 (8.0%) | 46 (8.3%) |
| $65,000 to $74,999 | 13 (2.4%) | 0 (0.0%) |
| $75,000 to $99,999 | 74 (13.5%) | 12 (2.2%) |
| $100,000+ | 10 (1.8%) | 15 (2.7%) |
| Total | 548 (100.0%) | 554 (100.0%) |
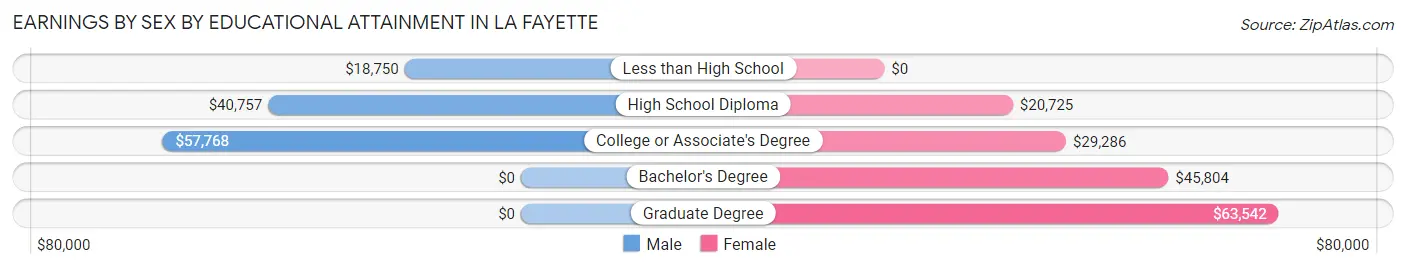
Earnings by Sex by Educational Attainment in La Fayette
Average earnings in La Fayette are $42,813 for men and $25,139 for women, a difference of 41.3%. Men with an educational attainment of college or associate's degree enjoy the highest average annual earnings of $57,768, while those with less than high school education earn the least with $18,750. Women with an educational attainment of graduate degree earn the most with the average annual earnings of $63,542, while those with high school diploma education have the smallest earnings of $20,725.
| Educational Attainment | Male Income | Female Income |
| Less than High School | $18,750 | $0 |
| High School Diploma | $40,757 | $20,725 |
| College or Associate's Degree | $57,768 | $29,286 |
| Bachelor's Degree | - | - |
| Graduate Degree | - | - |
| Total | $42,813 | $25,139 |
Family Income in La Fayette
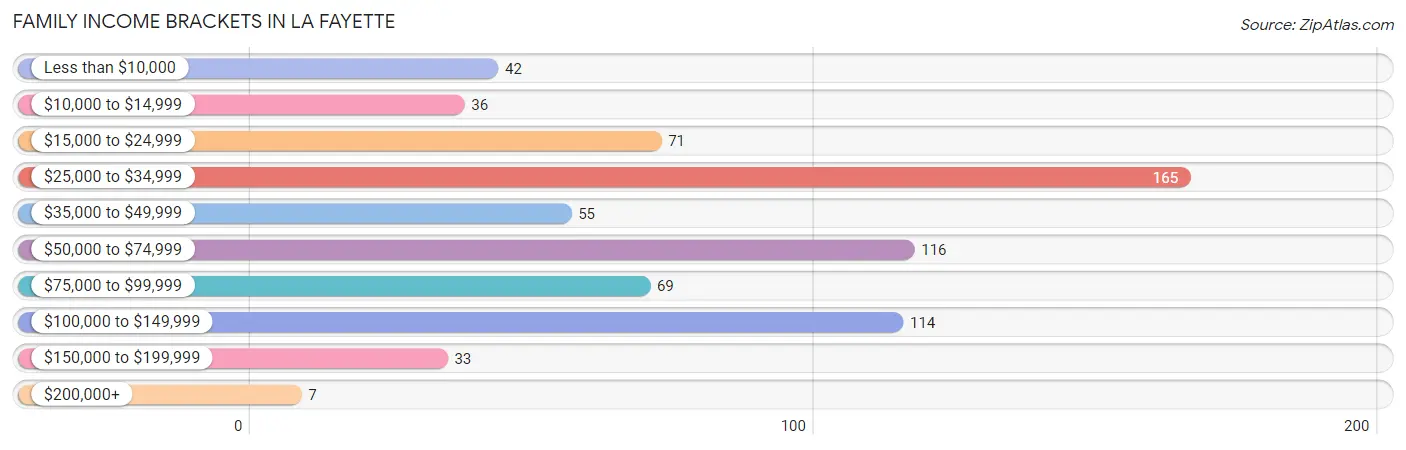
Family Income Brackets in La Fayette
According to the La Fayette family income data, there are 165 families falling into the $25,000 to $34,999 income range, which is the most common income bracket and makes up 23.3% of all families. Conversely, the $200,000+ income bracket is the least frequent group with only 7 families (1.0%) belonging to this category.
| Income Bracket | # Families | % Families |
| Less than $10,000 | 42 | 5.9% |
| $10,000 to $14,999 | 36 | 5.1% |
| $15,000 to $24,999 | 71 | 10.0% |
| $25,000 to $34,999 | 165 | 23.3% |
| $35,000 to $49,999 | 55 | 7.8% |
| $50,000 to $74,999 | 116 | 16.4% |
| $75,000 to $99,999 | 69 | 9.7% |
| $100,000 to $149,999 | 114 | 16.1% |
| $150,000 to $199,999 | 33 | 4.7% |
| $200,000+ | 7 | 1.0% |
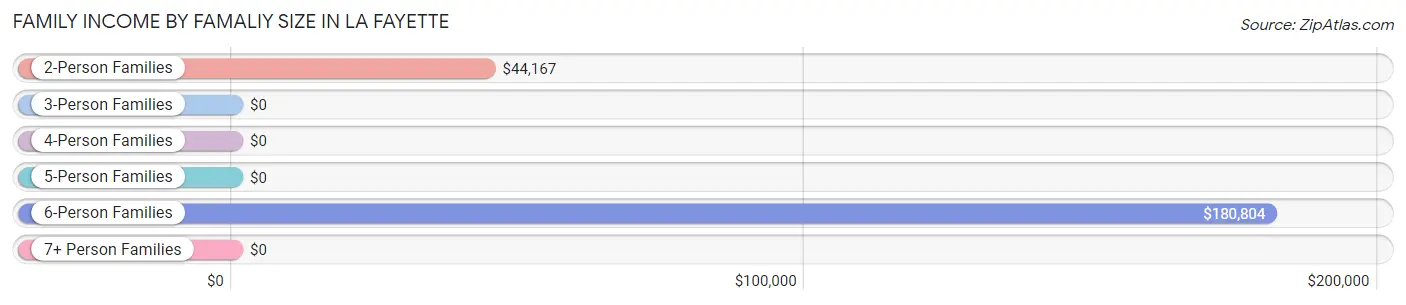
Family Income by Famaliy Size in La Fayette
6-person families (38 | 5.4%) account for the highest median family income in La Fayette with $180,804 per family, while 6-person families (38 | 5.4%) have the highest median income of $30,134 per family member.
| Income Bracket | # Families | Median Income |
| 2-Person Families | 416 (58.8%) | $44,167 |
| 3-Person Families | 179 (25.3%) | $0 |
| 4-Person Families | 65 (9.2%) | $0 |
| 5-Person Families | 10 (1.4%) | $0 |
| 6-Person Families | 38 (5.4%) | $180,804 |
| 7+ Person Families | 0 (0.0%) | $0 |
| Total | 708 (100.0%) | $43,958 |
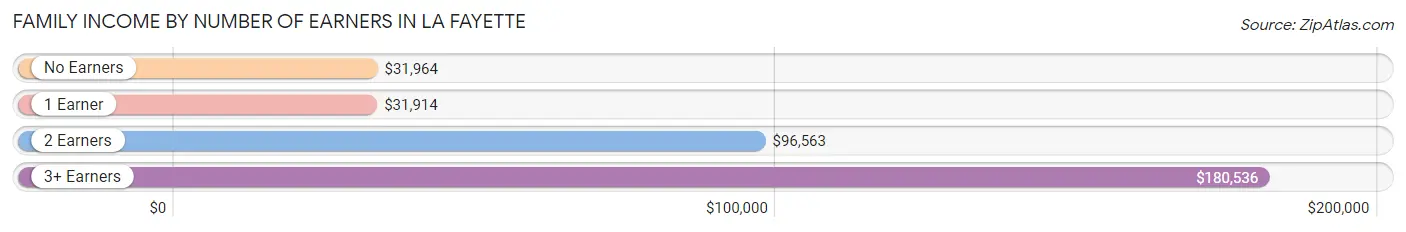
Family Income by Number of Earners in La Fayette
The median family income in La Fayette is $43,958, with families comprising 3+ earners (58) having the highest median family income of $180,536, while families with 1 earner (285) have the lowest median family income of $31,914, accounting for 8.2% and 40.3% of families, respectively.
| Number of Earners | # Families | Median Income |
| No Earners | 234 (33.1%) | $31,964 |
| 1 Earner | 285 (40.3%) | $31,914 |
| 2 Earners | 131 (18.5%) | $96,563 |
| 3+ Earners | 58 (8.2%) | $180,536 |
| Total | 708 (100.0%) | $43,958 |
Household Income in La Fayette
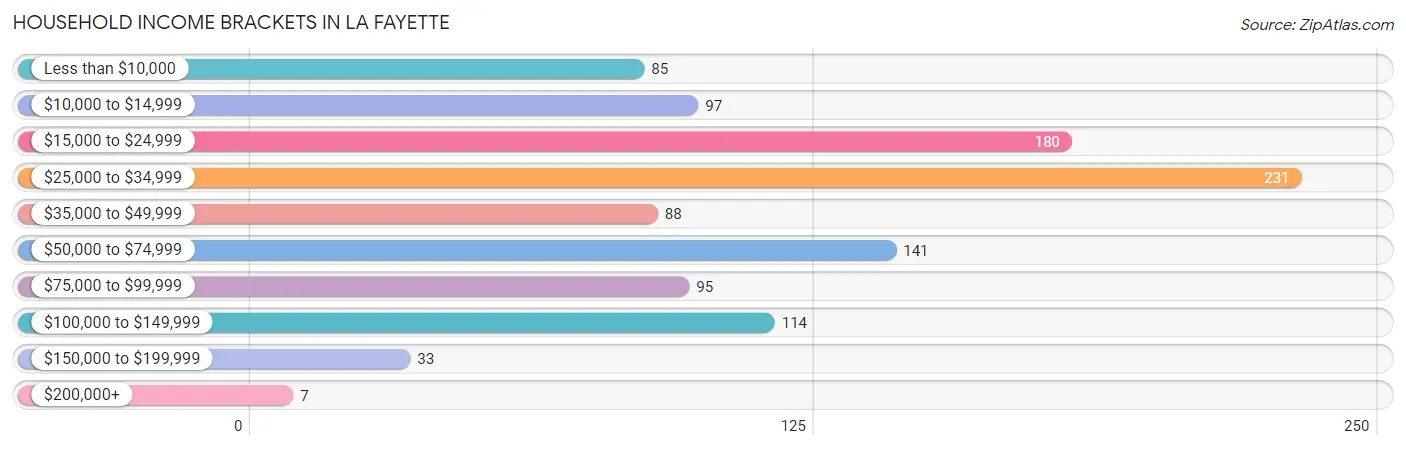
Household Income Brackets in La Fayette
With 231 households falling in the category, the $25,000 to $34,999 income range is the most frequent in La Fayette, accounting for 21.6% of all households. In contrast, only 7 households (0.6%) fall into the $200,000+ income bracket, making it the least populous group.
| Income Bracket | # Households | % Households |
| Less than $10,000 | 85 | 7.9% |
| $10,000 to $14,999 | 97 | 9.1% |
| $15,000 to $24,999 | 180 | 16.8% |
| $25,000 to $34,999 | 231 | 21.6% |
| $35,000 to $49,999 | 88 | 8.2% |
| $50,000 to $74,999 | 141 | 13.2% |
| $75,000 to $99,999 | 95 | 8.9% |
| $100,000 to $149,999 | 114 | 10.7% |
| $150,000 to $199,999 | 33 | 3.1% |
| $200,000+ | 7 | 0.7% |
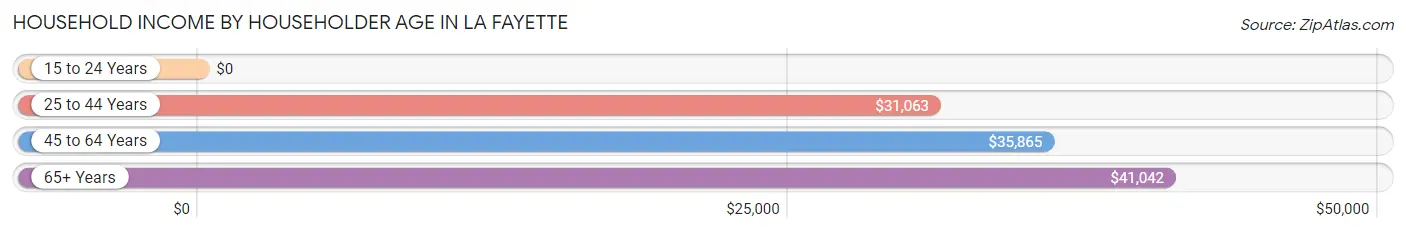
Household Income by Householder Age in La Fayette
The median household income in La Fayette is $32,031, with the highest median household income of $41,042 found in the 65+ years age bracket for the primary householder. A total of 335 households (31.3%) fall into this category. Meanwhile, the 15 to 24 years age bracket for the primary householder has the lowest median household income of $0, with 5 households (0.5%) in this group.
| Income Bracket | # Households | Median Income |
| 15 to 24 Years | 5 (0.5%) | $0 |
| 25 to 44 Years | 291 (27.2%) | $31,063 |
| 45 to 64 Years | 439 (41.0%) | $35,865 |
| 65+ Years | 335 (31.3%) | $41,042 |
| Total | 1,070 (100.0%) | $32,031 |
Poverty in La Fayette
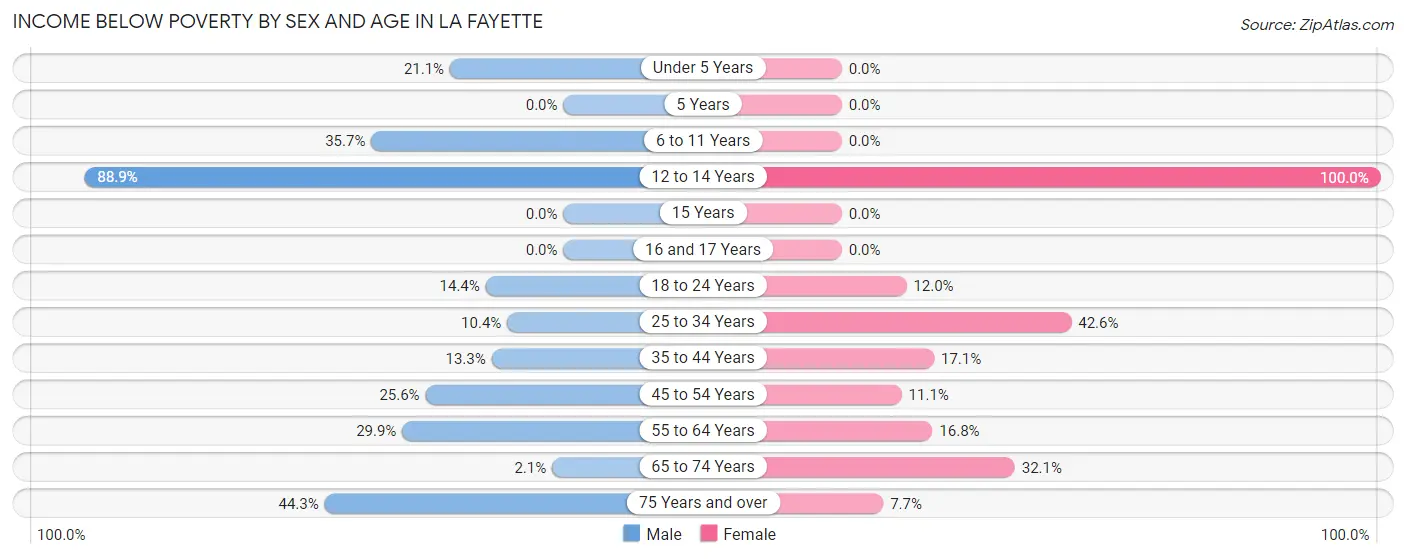
Income Below Poverty by Sex and Age in La Fayette
With 23.7% poverty level for males and 23.8% for females among the residents of La Fayette, 12 to 14 year old males and 12 to 14 year old females are the most vulnerable to poverty, with 32 males (88.9%) and 38 females (100.0%) in their respective age groups living below the poverty level.
| Age Bracket | Male | Female |
| Under 5 Years | 20 (21.0%) | 0 (0.0%) |
| 5 Years | 0 (0.0%) | 0 (0.0%) |
| 6 to 11 Years | 46 (35.7%) | 0 (0.0%) |
| 12 to 14 Years | 32 (88.9%) | 38 (100.0%) |
| 15 Years | 0 (0.0%) | 0 (0.0%) |
| 16 and 17 Years | 0 (0.0%) | 0 (0.0%) |
| 18 to 24 Years | 14 (14.4%) | 6 (12.0%) |
| 25 to 34 Years | 17 (10.4%) | 72 (42.6%) |
| 35 to 44 Years | 6 (13.3%) | 38 (17.1%) |
| 45 to 54 Years | 53 (25.6%) | 19 (11.1%) |
| 55 to 64 Years | 64 (29.9%) | 36 (16.8%) |
| 65 to 74 Years | 3 (2.1%) | 53 (32.1%) |
| 75 Years and over | 39 (44.3%) | 6 (7.7%) |
| Total | 294 (23.7%) | 268 (23.8%) |
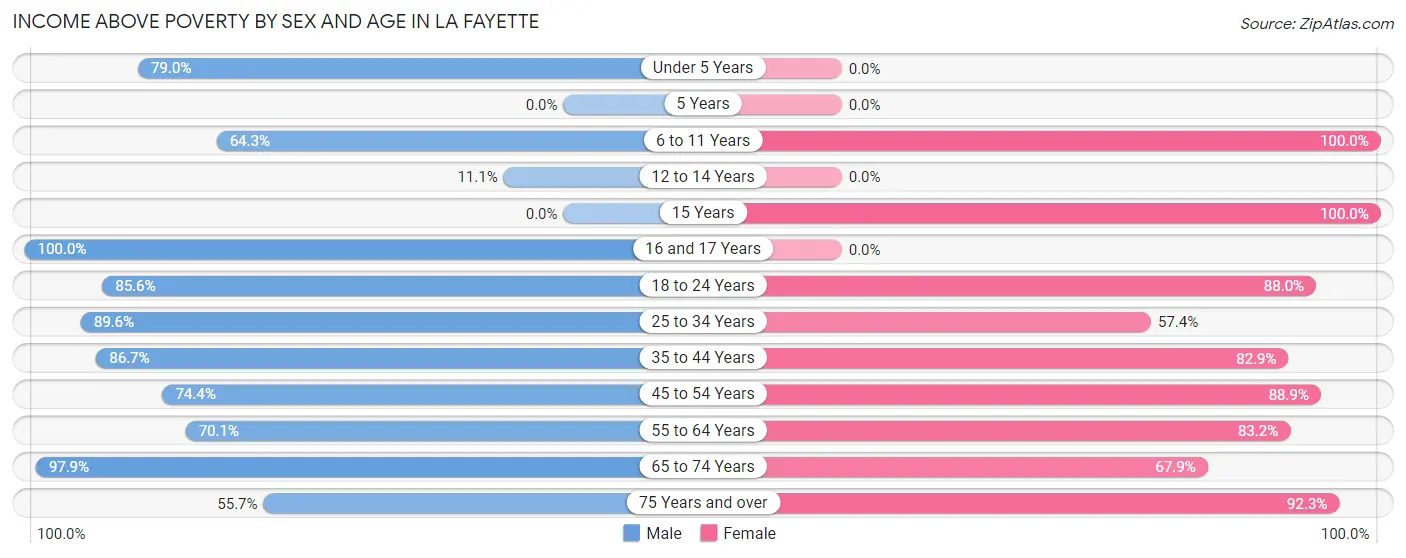
Income Above Poverty by Sex and Age in La Fayette
According to the poverty statistics in La Fayette, males aged 16 and 17 years and females aged 6 to 11 years are the age groups that are most secure financially, with 100.0% of males and 100.0% of females in these age groups living above the poverty line.
| Age Bracket | Male | Female |
| Under 5 Years | 75 (78.9%) | 0 (0.0%) |
| 5 Years | 0 (0.0%) | 0 (0.0%) |
| 6 to 11 Years | 83 (64.3%) | 11 (100.0%) |
| 12 to 14 Years | 4 (11.1%) | 0 (0.0%) |
| 15 Years | 0 (0.0%) | 9 (100.0%) |
| 16 and 17 Years | 25 (100.0%) | 0 (0.0%) |
| 18 to 24 Years | 83 (85.6%) | 44 (88.0%) |
| 25 to 34 Years | 146 (89.6%) | 97 (57.4%) |
| 35 to 44 Years | 39 (86.7%) | 184 (82.9%) |
| 45 to 54 Years | 154 (74.4%) | 152 (88.9%) |
| 55 to 64 Years | 150 (70.1%) | 178 (83.2%) |
| 65 to 74 Years | 140 (97.9%) | 112 (67.9%) |
| 75 Years and over | 49 (55.7%) | 72 (92.3%) |
| Total | 948 (76.3%) | 859 (76.2%) |
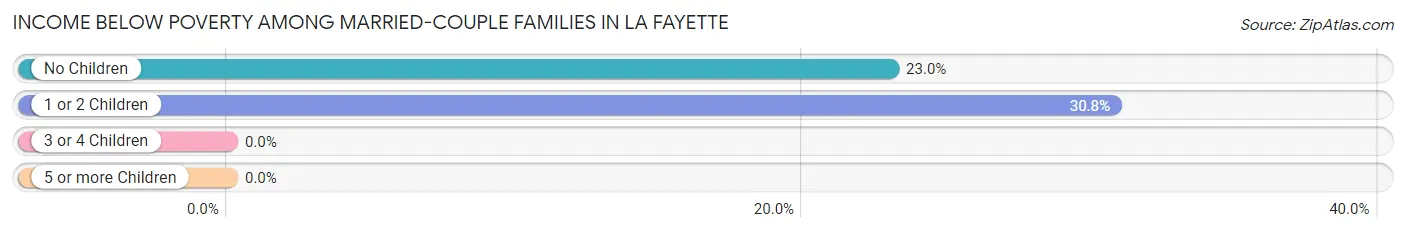
Income Below Poverty Among Married-Couple Families in La Fayette
The poverty statistics for married-couple families in La Fayette show that 25.5% or 94 of the total 369 families live below the poverty line. Families with 1 or 2 children have the highest poverty rate of 30.8%, comprising of 36 families. On the other hand, families with no children have the lowest poverty rate of 23.0%, which includes 58 families.
| Children | Above Poverty | Below Poverty |
| No Children | 194 (77.0%) | 58 (23.0%) |
| 1 or 2 Children | 81 (69.2%) | 36 (30.8%) |
| 3 or 4 Children | 0 (0.0%) | 0 (0.0%) |
| 5 or more Children | 0 (0.0%) | 0 (0.0%) |
| Total | 275 (74.5%) | 94 (25.5%) |
Income Below Poverty Among Single-Parent Households in La Fayette
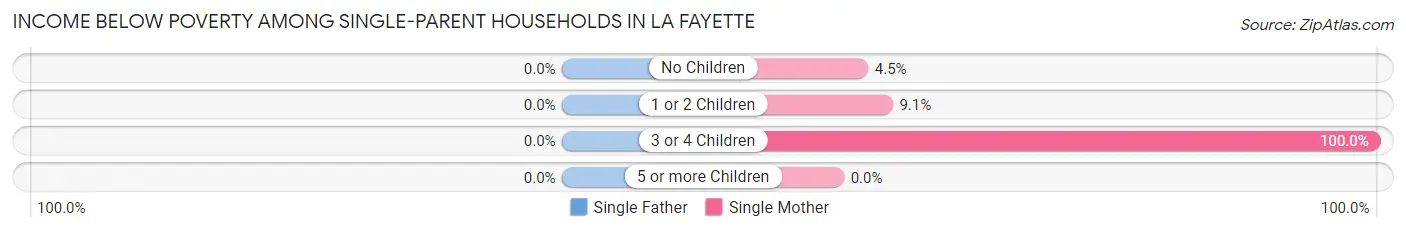
| Children | Single Father | Single Mother |
| No Children | 0 (0.0%) | 5 (4.5%) |
| 1 or 2 Children | 0 (0.0%) | 10 (9.1%) |
| 3 or 4 Children | 0 (0.0%) | 13 (100.0%) |
| 5 or more Children | 0 (0.0%) | 0 (0.0%) |
| Total | 0 (0.0%) | 28 (12.0%) |
Income Below Poverty Among Married-Couple vs Single-Parent Households in La Fayette
The poverty data for La Fayette shows that 94 of the married-couple family households (25.5%) and 28 of the single-parent households (8.3%) are living below the poverty level. Within the married-couple family households, those with 1 or 2 children have the highest poverty rate, with 36 households (30.8%) falling below the poverty line. Among the single-parent households, those with 3 or 4 children have the highest poverty rate, with 13 household (100.0%) living below poverty.
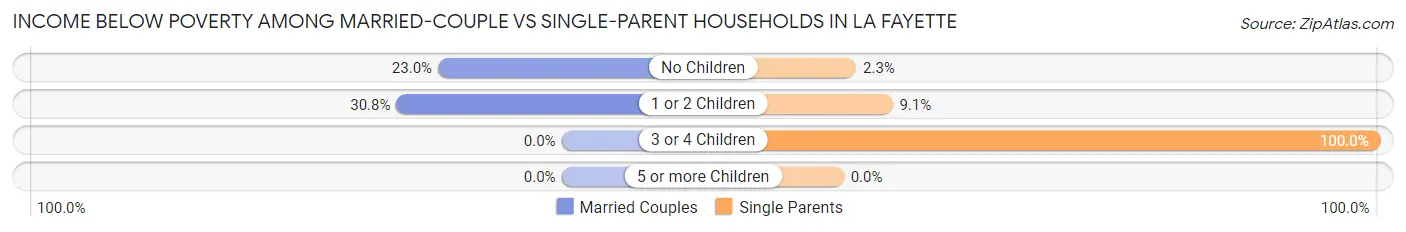
| Children | Married-Couple Families | Single-Parent Households |
| No Children | 58 (23.0%) | 5 (2.3%) |
| 1 or 2 Children | 36 (30.8%) | 10 (9.1%) |
| 3 or 4 Children | 0 (0.0%) | 13 (100.0%) |
| 5 or more Children | 0 (0.0%) | 0 (0.0%) |
| Total | 94 (25.5%) | 28 (8.3%) |
Race in La Fayette
The most populous races in La Fayette are Black / African American (1,783 | 66.0%), White / Caucasian (887 | 32.9%), and Two or more Races (21 | 0.8%).
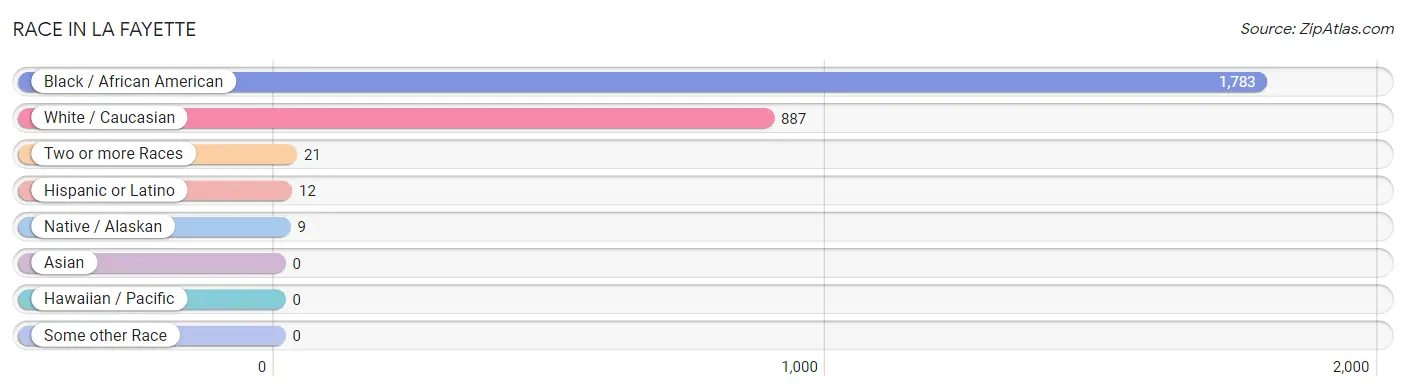
| Race | # Population | % Population |
| Asian | 0 | 0.0% |
| Black / African American | 1,783 | 66.0% |
| Hawaiian / Pacific | 0 | 0.0% |
| Hispanic or Latino | 12 | 0.4% |
| Native / Alaskan | 9 | 0.3% |
| White / Caucasian | 887 | 32.9% |
| Two or more Races | 21 | 0.8% |
| Some other Race | 0 | 0.0% |
| Total | 2,700 | 100.0% |
Ancestry in La Fayette
The most populous ancestries reported in La Fayette are American (462 | 17.1%), English (122 | 4.5%), Irish (67 | 2.5%), Scottish (49 | 1.8%), and European (31 | 1.1%), together accounting for 27.1% of all La Fayette residents.
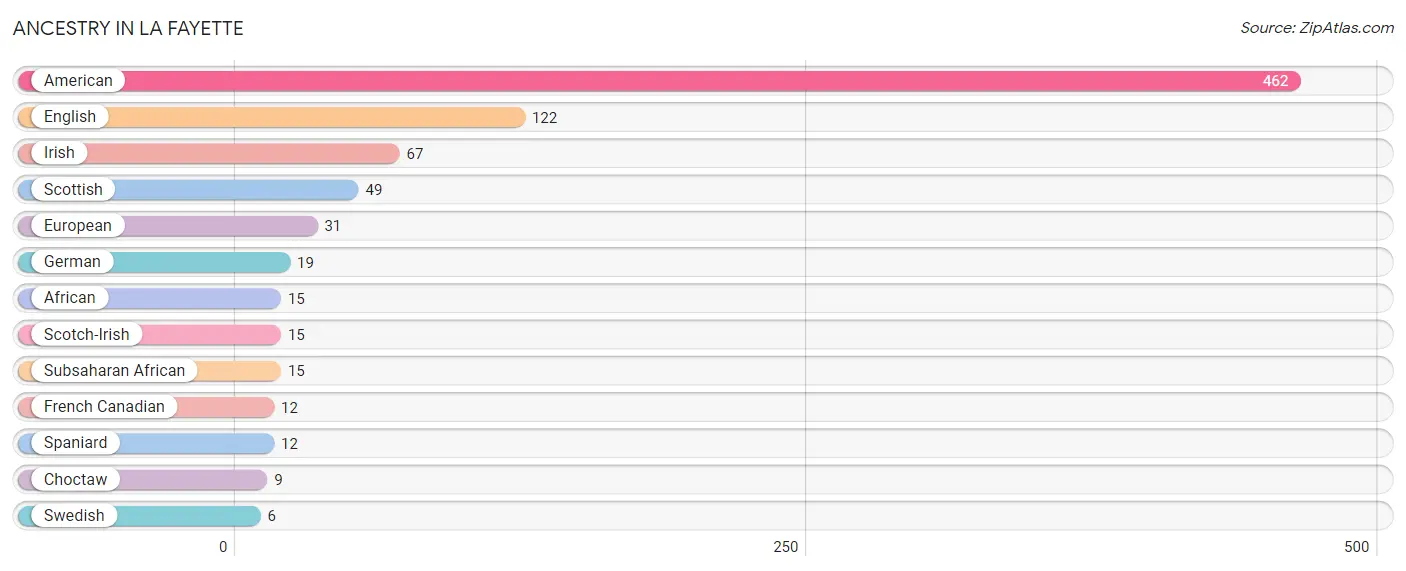
| Ancestry | # Population | % Population |
| African | 15 | 0.6% |
| American | 462 | 17.1% |
| Choctaw | 9 | 0.3% |
| English | 122 | 4.5% |
| European | 31 | 1.1% |
| French Canadian | 12 | 0.4% |
| German | 19 | 0.7% |
| Irish | 67 | 2.5% |
| Scotch-Irish | 15 | 0.6% |
| Scottish | 49 | 1.8% |
| Spaniard | 12 | 0.4% |
| Subsaharan African | 15 | 0.6% |
| Swedish | 6 | 0.2% | View All 13 Rows |
Immigrants in La Fayette
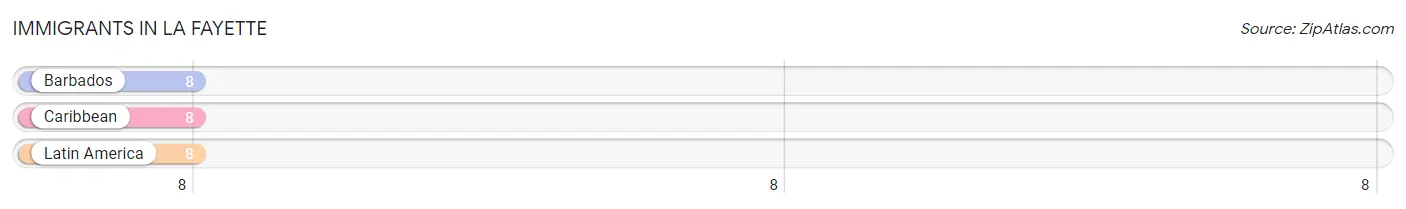
The most numerous immigrant groups reported in La Fayette came from Barbados (8 | 0.3%), Caribbean (8 | 0.3%), and Latin America (8 | 0.3%), together accounting for 0.9% of all La Fayette residents.
| Immigration Origin | # Population | % Population |
| Barbados | 8 | 0.3% |
| Caribbean | 8 | 0.3% |
| Latin America | 8 | 0.3% | View All 3 Rows |
Sex and Age in La Fayette
Sex and Age in La Fayette
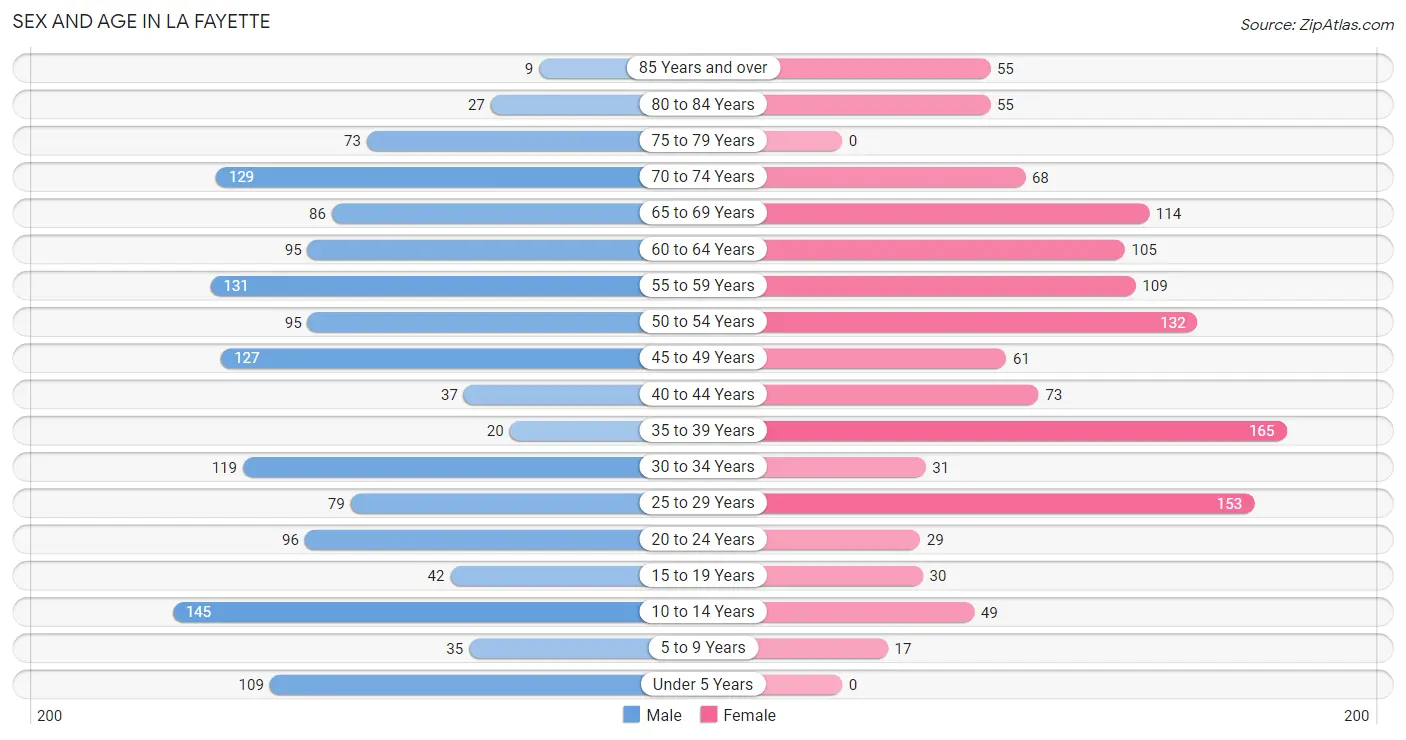
The most populous age groups in La Fayette are 10 to 14 Years (145 | 10.0%) for men and 35 to 39 Years (165 | 13.2%) for women.
| Age Bracket | Male | Female |
| Under 5 Years | 109 (7.5%) | 0 (0.0%) |
| 5 to 9 Years | 35 (2.4%) | 17 (1.4%) |
| 10 to 14 Years | 145 (10.0%) | 49 (3.9%) |
| 15 to 19 Years | 42 (2.9%) | 30 (2.4%) |
| 20 to 24 Years | 96 (6.6%) | 29 (2.3%) |
| 25 to 29 Years | 79 (5.4%) | 153 (12.3%) |
| 30 to 34 Years | 119 (8.2%) | 31 (2.5%) |
| 35 to 39 Years | 20 (1.4%) | 165 (13.2%) |
| 40 to 44 Years | 37 (2.5%) | 73 (5.9%) |
| 45 to 49 Years | 127 (8.7%) | 61 (4.9%) |
| 50 to 54 Years | 95 (6.5%) | 132 (10.6%) |
| 55 to 59 Years | 131 (9.0%) | 109 (8.7%) |
| 60 to 64 Years | 95 (6.5%) | 105 (8.4%) |
| 65 to 69 Years | 86 (5.9%) | 114 (9.1%) |
| 70 to 74 Years | 129 (8.9%) | 68 (5.5%) |
| 75 to 79 Years | 73 (5.0%) | 0 (0.0%) |
| 80 to 84 Years | 27 (1.9%) | 55 (4.4%) |
| 85 Years and over | 9 (0.6%) | 55 (4.4%) |
| Total | 1,454 (100.0%) | 1,246 (100.0%) |
Families and Households in La Fayette
Median Family Size in La Fayette
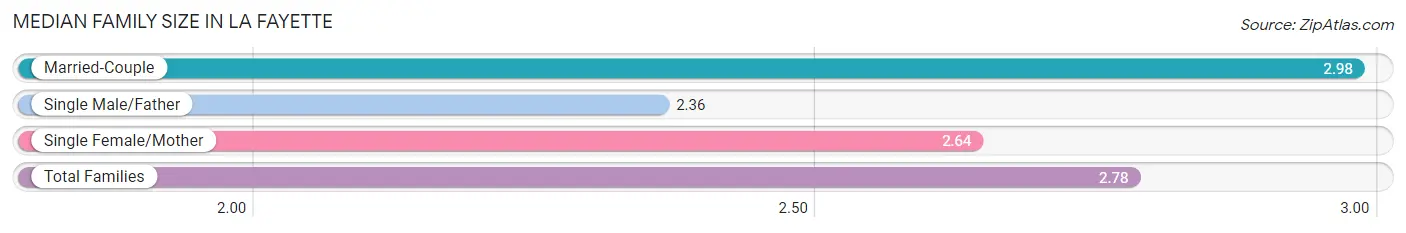
The median family size in La Fayette is 2.78 persons per family, with married-couple families (369 | 52.1%) accounting for the largest median family size of 2.98 persons per family. On the other hand, single male/father families (105 | 14.8%) represent the smallest median family size with 2.36 persons per family.
| Family Type | # Families | Family Size |
| Married-Couple | 369 (52.1%) | 2.98 |
| Single Male/Father | 105 (14.8%) | 2.36 |
| Single Female/Mother | 234 (33.1%) | 2.64 |
| Total Families | 708 (100.0%) | 2.78 |
Median Household Size in La Fayette
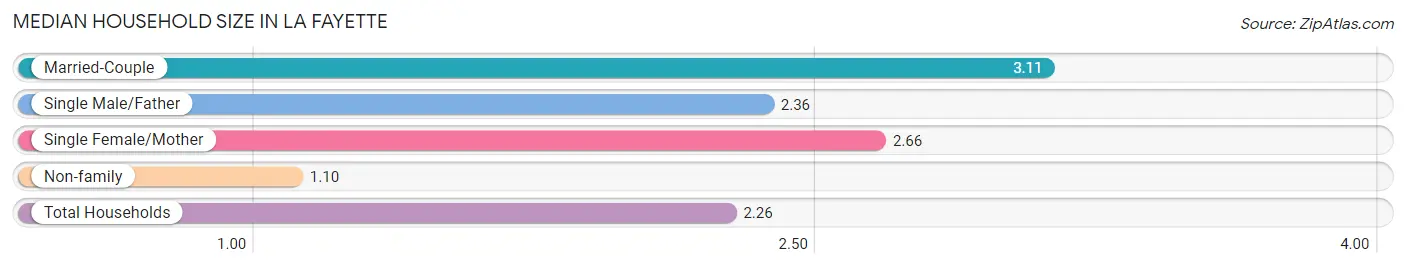
The median household size in La Fayette is 2.26 persons per household, with married-couple households (369 | 34.5%) accounting for the largest median household size of 3.11 persons per household. non-family households (362 | 33.8%) represent the smallest median household size with 1.10 persons per household.
| Household Type | # Households | Household Size |
| Married-Couple | 369 (34.5%) | 3.11 |
| Single Male/Father | 105 (9.8%) | 2.36 |
| Single Female/Mother | 234 (21.9%) | 2.66 |
| Non-family | 362 (33.8%) | 1.10 |
| Total Households | 1,070 (100.0%) | 2.26 |
Household Size by Marriage Status in La Fayette
Out of a total of 1,070 households in La Fayette, 708 (66.2%) are family households, while 362 (33.8%) are nonfamily households. The most numerous type of family households are 2-person households, comprising 409, and the most common type of nonfamily households are 1-person households, comprising 333.
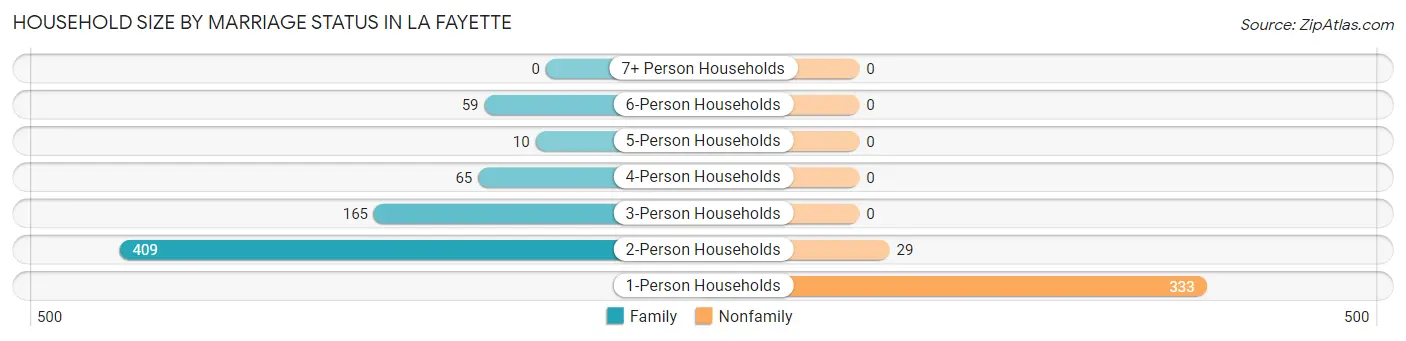
| Household Size | Family Households | Nonfamily Households |
| 1-Person Households | - | 333 (31.1%) |
| 2-Person Households | 409 (38.2%) | 29 (2.7%) |
| 3-Person Households | 165 (15.4%) | 0 (0.0%) |
| 4-Person Households | 65 (6.1%) | 0 (0.0%) |
| 5-Person Households | 10 (0.9%) | 0 (0.0%) |
| 6-Person Households | 59 (5.5%) | 0 (0.0%) |
| 7+ Person Households | 0 (0.0%) | 0 (0.0%) |
| Total | 708 (66.2%) | 362 (33.8%) |
Female Fertility in La Fayette
Fertility by Age in La Fayette
Average fertility rate in La Fayette is 74.0 births per 1,000 women. Women in the age bracket of 20 to 34 years have the highest fertility rate with 192.0 births per 1,000 women. Women in the age bracket of 20 to 34 years acount for 100.0% of all women with births.
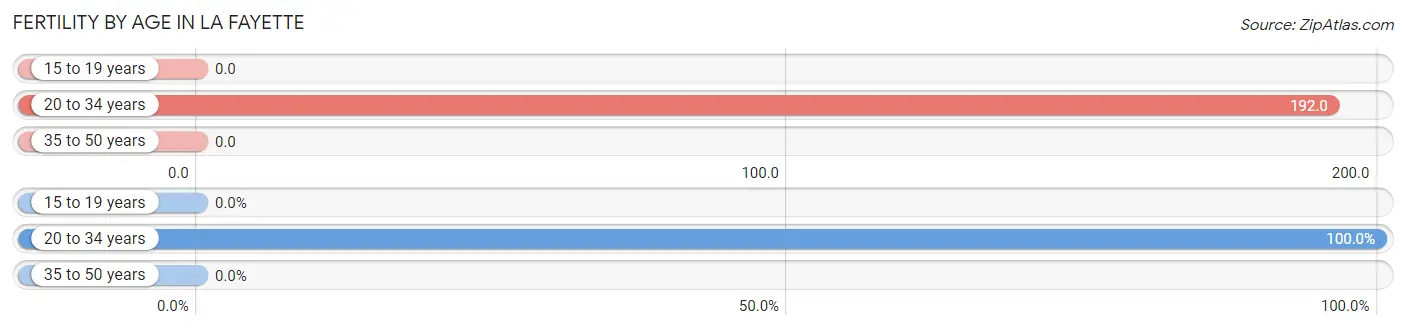
| Age Bracket | Women with Births | Births / 1,000 Women |
| 15 to 19 years | 0 (0.0%) | 0.0 |
| 20 to 34 years | 41 (100.0%) | 192.0 |
| 35 to 50 years | 0 (0.0%) | 0.0 |
| Total | 41 (100.0%) | 74.0 |
Fertility by Age by Marriage Status in La Fayette
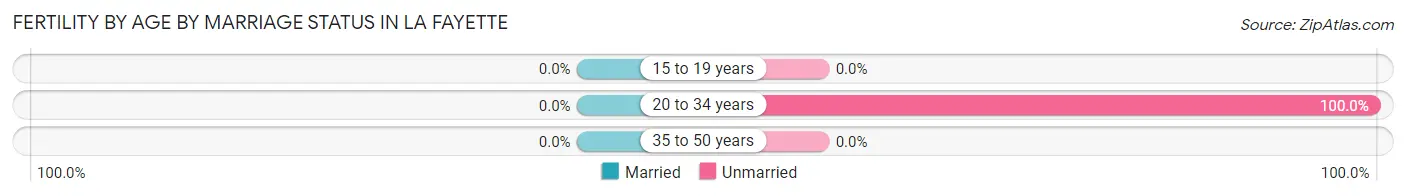
| Age Bracket | Married | Unmarried |
| 15 to 19 years | 0 (0.0%) | 0 (0.0%) |
| 20 to 34 years | 0 (0.0%) | 41 (100.0%) |
| 35 to 50 years | 0 (0.0%) | 0 (0.0%) |
| Total | 0 (0.0%) | 41 (100.0%) |
Fertility by Education in La Fayette
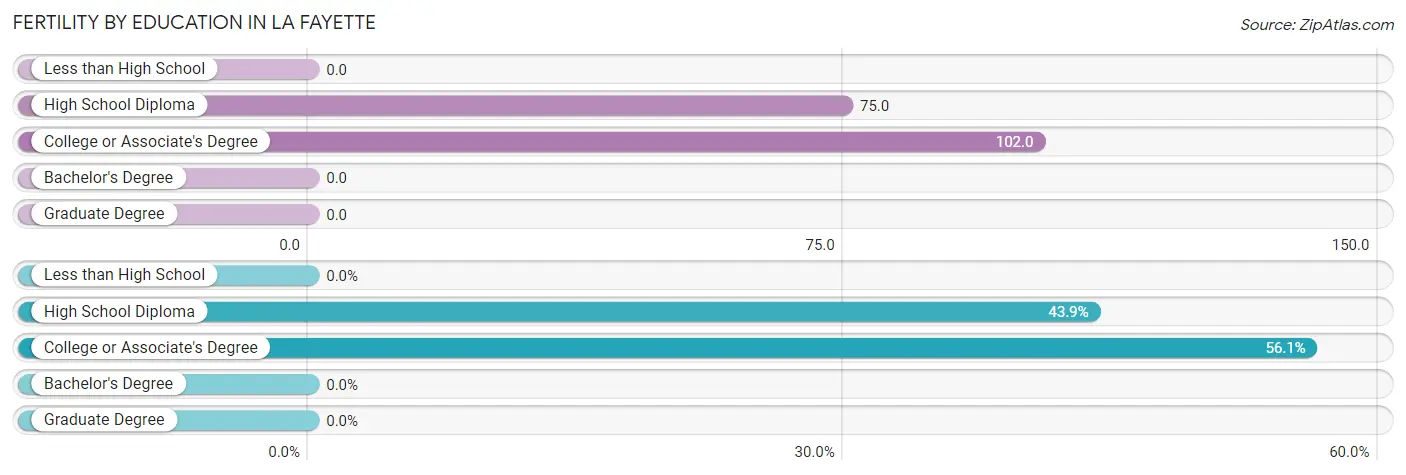
| Educational Attainment | Women with Births | Births / 1,000 Women |
| Less than High School | 0 (0.0%) | 0.0 |
| High School Diploma | 18 (43.9%) | 75.0 |
| College or Associate's Degree | 23 (56.1%) | 102.0 |
| Bachelor's Degree | 0 (0.0%) | 0.0 |
| Graduate Degree | 0 (0.0%) | 0.0 |
| Total | 41 (100.0%) | 74.0 |
Fertility by Education by Marriage Status in La Fayette
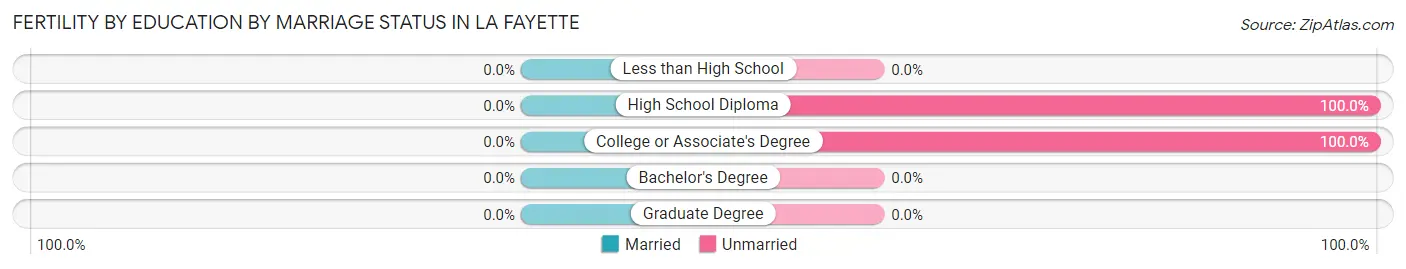
| Educational Attainment | Married | Unmarried |
| Less than High School | 0 (0.0%) | 0 (0.0%) |
| High School Diploma | 0 (0.0%) | 18 (100.0%) |
| College or Associate's Degree | 0 (0.0%) | 23 (100.0%) |
| Bachelor's Degree | 0 (0.0%) | 0 (0.0%) |
| Graduate Degree | 0 (0.0%) | 0 (0.0%) |
| Total | 0 (0.0%) | 41 (100.0%) |
Employment Characteristics in La Fayette
Employment by Class of Employer in La Fayette
Among the 868 employed individuals in La Fayette, private company employees (682 | 78.6%), local government employees (69 | 8.0%), and state government employees (39 | 4.5%) make up the most common classes of employment.
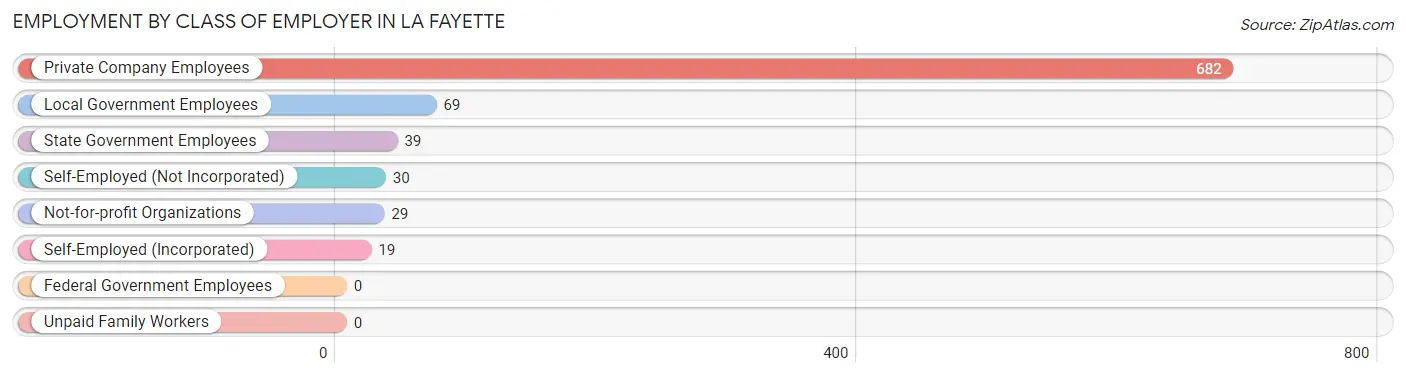
| Employer Class | # Employees | % Employees |
| Private Company Employees | 682 | 78.6% |
| Self-Employed (Incorporated) | 19 | 2.2% |
| Self-Employed (Not Incorporated) | 30 | 3.5% |
| Not-for-profit Organizations | 29 | 3.3% |
| Local Government Employees | 69 | 8.0% |
| State Government Employees | 39 | 4.5% |
| Federal Government Employees | 0 | 0.0% |
| Unpaid Family Workers | 0 | 0.0% |
| Total | 868 | 100.0% |
Employment Status by Age in La Fayette
According to the labor force statistics for La Fayette, out of the total population over 16 years of age (2,336), 39.6% or 925 individuals are in the labor force, with 3.7% or 34 of them unemployed. The age group with the highest labor force participation rate is 25 to 29 years, with 83.2% or 193 individuals in the labor force. Within the labor force, the 16 to 19 years age range has the highest percentage of unemployed individuals, with 62.5% or 10 of them being unemployed.
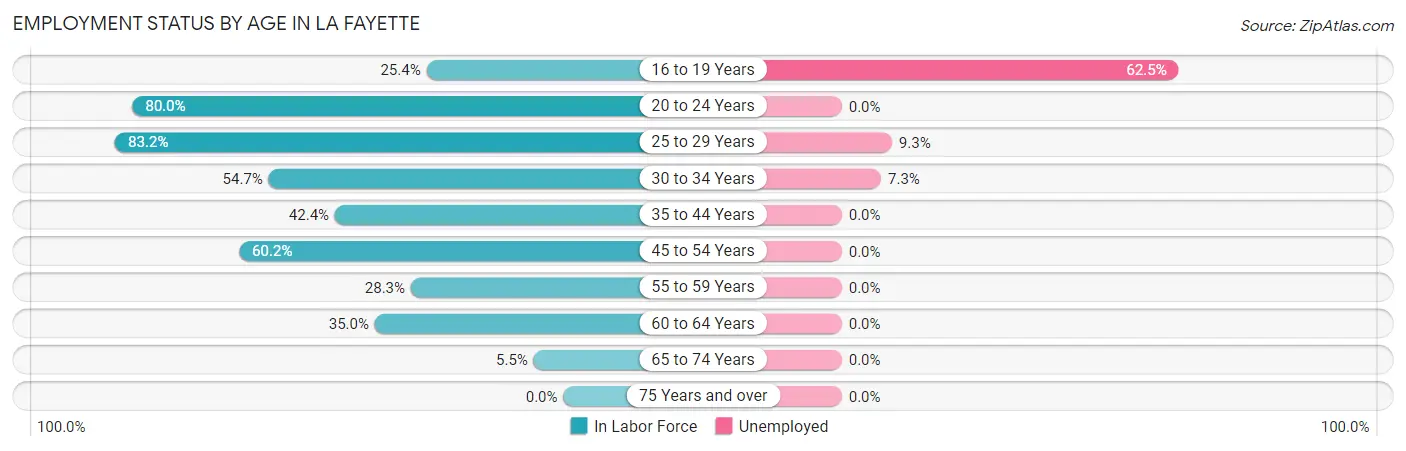
| Age Bracket | In Labor Force | Unemployed |
| 16 to 19 Years | 16 (25.4%) | 10 (62.5%) |
| 20 to 24 Years | 100 (80.0%) | 0 (0.0%) |
| 25 to 29 Years | 193 (83.2%) | 18 (9.3%) |
| 30 to 34 Years | 82 (54.7%) | 6 (7.3%) |
| 35 to 44 Years | 125 (42.4%) | 0 (0.0%) |
| 45 to 54 Years | 250 (60.2%) | 0 (0.0%) |
| 55 to 59 Years | 68 (28.3%) | 0 (0.0%) |
| 60 to 64 Years | 70 (35.0%) | 0 (0.0%) |
| 65 to 74 Years | 22 (5.5%) | 0 (0.0%) |
| 75 Years and over | 0 (0.0%) | 0 (0.0%) |
| Total | 925 (39.6%) | 34 (3.7%) |
Employment Status by Educational Attainment in La Fayette
According to labor force statistics for La Fayette, 51.4% of individuals (787) out of the total population between 25 and 64 years of age (1,532) are in the labor force, with 3.0% or 24 of them being unemployed. The group with the highest labor force participation rate are those with the educational attainment of bachelor's degree or higher, with 83.5% or 116 individuals in the labor force. Within the labor force, individuals with high school diploma education have the highest percentage of unemployment, with 6.3% or 18 of them being unemployed.
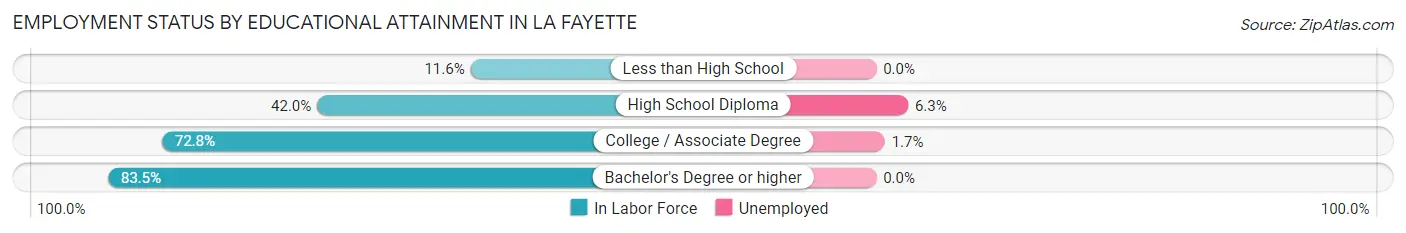
| Educational Attainment | In Labor Force | Unemployed |
| Less than High School | 25 (11.6%) | 0 (0.0%) |
| High School Diploma | 286 (42.0%) | 43 (6.3%) |
| College / Associate Degree | 361 (72.8%) | 8 (1.7%) |
| Bachelor's Degree or higher | 116 (83.5%) | 0 (0.0%) |
| Total | 787 (51.4%) | 46 (3.0%) |
Employment Occupations by Sex in La Fayette
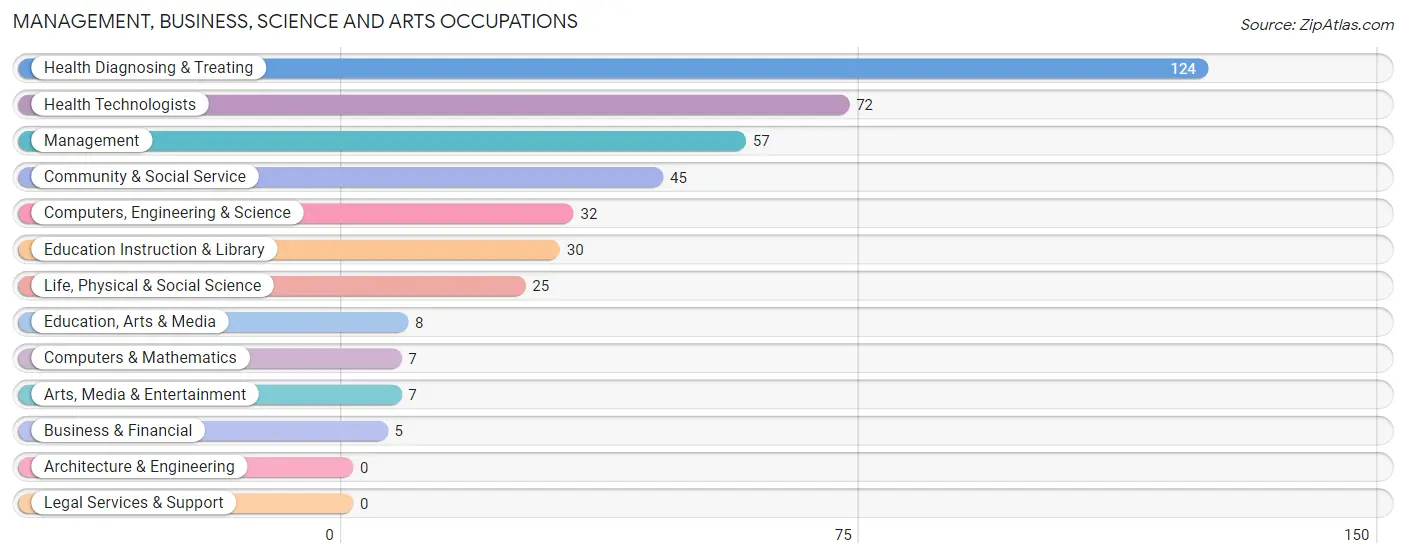
Management, Business, Science and Arts Occupations
The most common Management, Business, Science and Arts occupations in La Fayette are Health Diagnosing & Treating (124 | 13.9%), Health Technologists (72 | 8.1%), Management (57 | 6.4%), Community & Social Service (45 | 5.0%), and Computers, Engineering & Science (32 | 3.6%).
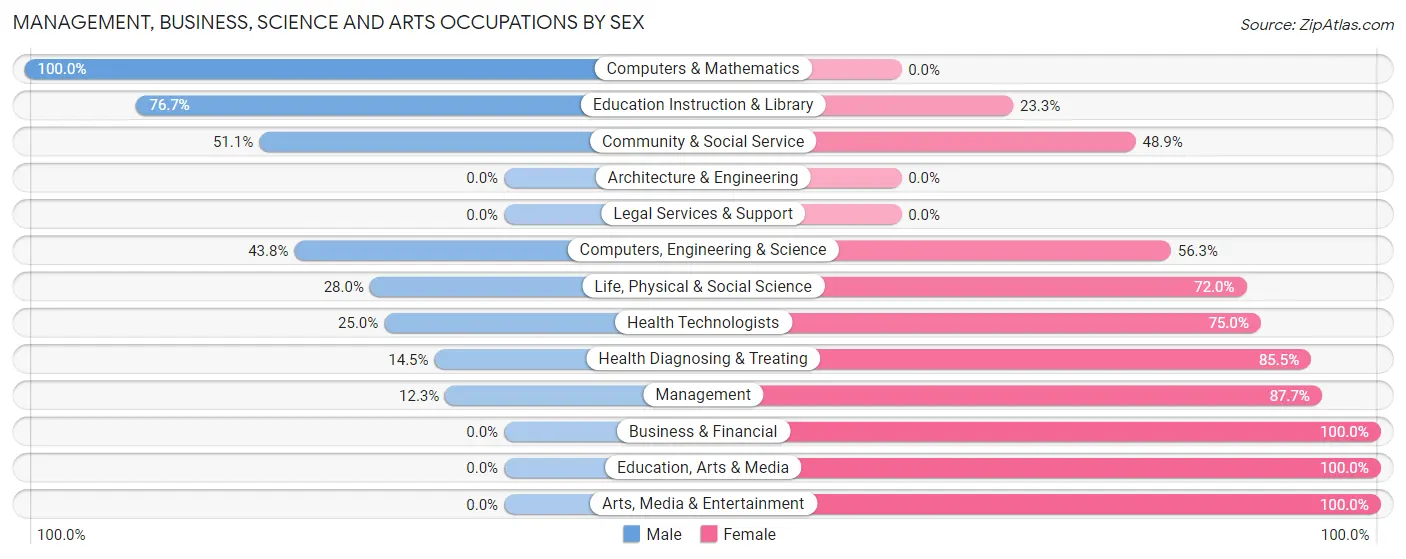
Management, Business, Science and Arts Occupations by Sex
Within the Management, Business, Science and Arts occupations in La Fayette, the most male-oriented occupations are Computers & Mathematics (100.0%), Education Instruction & Library (76.7%), and Community & Social Service (51.1%), while the most female-oriented occupations are Business & Financial (100.0%), Education, Arts & Media (100.0%), and Arts, Media & Entertainment (100.0%).
| Occupation | Male | Female |
| Management | 7 (12.3%) | 50 (87.7%) |
| Business & Financial | 0 (0.0%) | 5 (100.0%) |
| Computers, Engineering & Science | 14 (43.8%) | 18 (56.2%) |
| Computers & Mathematics | 7 (100.0%) | 0 (0.0%) |
| Architecture & Engineering | 0 (0.0%) | 0 (0.0%) |
| Life, Physical & Social Science | 7 (28.0%) | 18 (72.0%) |
| Community & Social Service | 23 (51.1%) | 22 (48.9%) |
| Education, Arts & Media | 0 (0.0%) | 8 (100.0%) |
| Legal Services & Support | 0 (0.0%) | 0 (0.0%) |
| Education Instruction & Library | 23 (76.7%) | 7 (23.3%) |
| Arts, Media & Entertainment | 0 (0.0%) | 7 (100.0%) |
| Health Diagnosing & Treating | 18 (14.5%) | 106 (85.5%) |
| Health Technologists | 18 (25.0%) | 54 (75.0%) |
| Total (Category) | 62 (23.6%) | 201 (76.4%) |
| Total (Overall) | 481 (53.9%) | 411 (46.1%) |
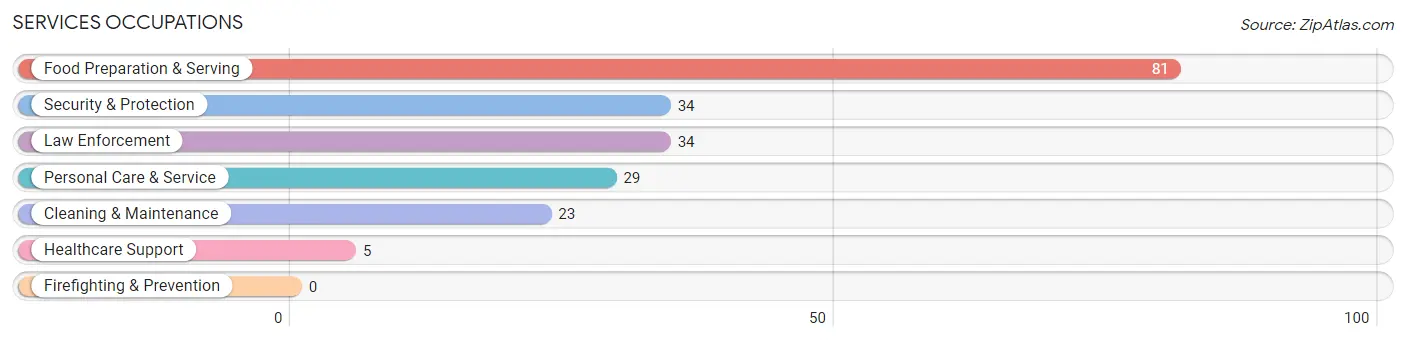
Services Occupations
The most common Services occupations in La Fayette are Food Preparation & Serving (81 | 9.1%), Security & Protection (34 | 3.8%), Law Enforcement (34 | 3.8%), Personal Care & Service (29 | 3.3%), and Cleaning & Maintenance (23 | 2.6%).
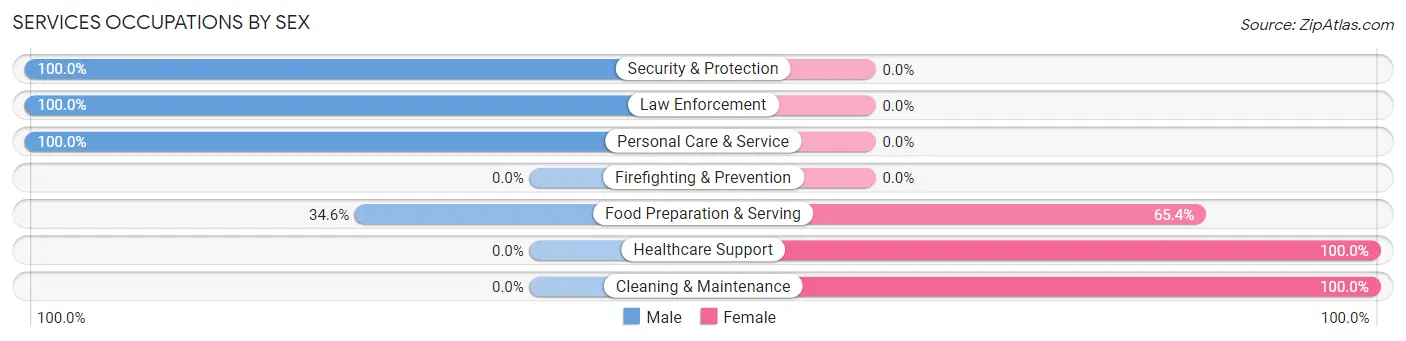
Services Occupations by Sex
Within the Services occupations in La Fayette, the most male-oriented occupations are Security & Protection (100.0%), Law Enforcement (100.0%), and Personal Care & Service (100.0%), while the most female-oriented occupations are Healthcare Support (100.0%), Cleaning & Maintenance (100.0%), and Food Preparation & Serving (65.4%).
| Occupation | Male | Female |
| Healthcare Support | 0 (0.0%) | 5 (100.0%) |
| Security & Protection | 34 (100.0%) | 0 (0.0%) |
| Firefighting & Prevention | 0 (0.0%) | 0 (0.0%) |
| Law Enforcement | 34 (100.0%) | 0 (0.0%) |
| Food Preparation & Serving | 28 (34.6%) | 53 (65.4%) |
| Cleaning & Maintenance | 0 (0.0%) | 23 (100.0%) |
| Personal Care & Service | 29 (100.0%) | 0 (0.0%) |
| Total (Category) | 91 (52.9%) | 81 (47.1%) |
| Total (Overall) | 481 (53.9%) | 411 (46.1%) |
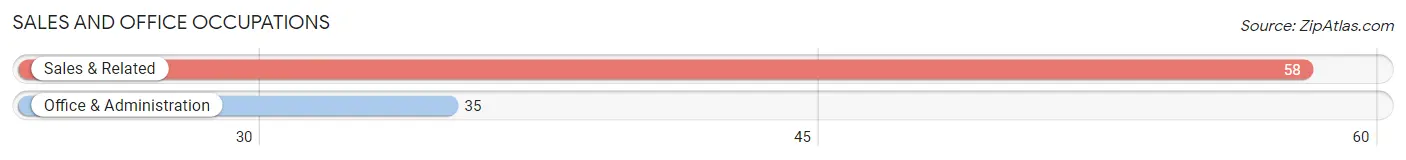
Sales and Office Occupations
The most common Sales and Office occupations in La Fayette are Sales & Related (58 | 6.5%), and Office & Administration (35 | 3.9%).
Sales and Office Occupations by Sex
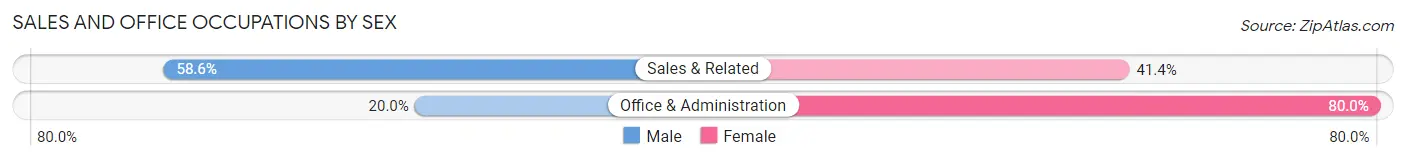
| Occupation | Male | Female |
| Sales & Related | 34 (58.6%) | 24 (41.4%) |
| Office & Administration | 7 (20.0%) | 28 (80.0%) |
| Total (Category) | 41 (44.1%) | 52 (55.9%) |
| Total (Overall) | 481 (53.9%) | 411 (46.1%) |
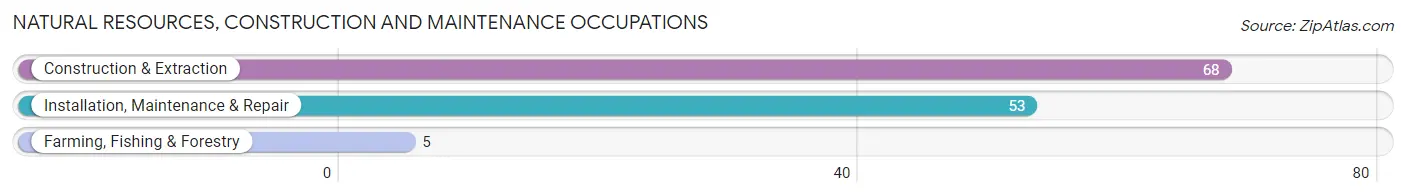
Natural Resources, Construction and Maintenance Occupations
The most common Natural Resources, Construction and Maintenance occupations in La Fayette are Construction & Extraction (68 | 7.6%), Installation, Maintenance & Repair (53 | 5.9%), and Farming, Fishing & Forestry (5 | 0.6%).
Natural Resources, Construction and Maintenance Occupations by Sex
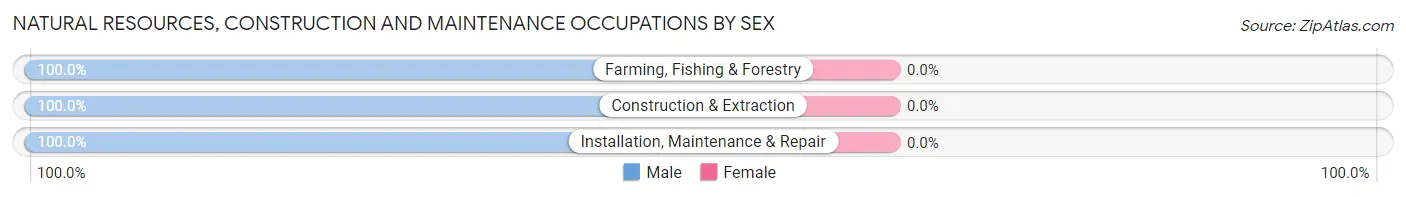
| Occupation | Male | Female |
| Farming, Fishing & Forestry | 5 (100.0%) | 0 (0.0%) |
| Construction & Extraction | 68 (100.0%) | 0 (0.0%) |
| Installation, Maintenance & Repair | 53 (100.0%) | 0 (0.0%) |
| Total (Category) | 126 (100.0%) | 0 (0.0%) |
| Total (Overall) | 481 (53.9%) | 411 (46.1%) |
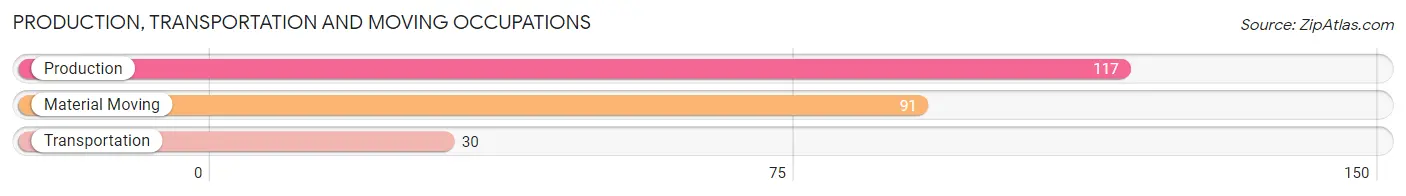
Production, Transportation and Moving Occupations
The most common Production, Transportation and Moving occupations in La Fayette are Production (117 | 13.1%), Material Moving (91 | 10.2%), and Transportation (30 | 3.4%).
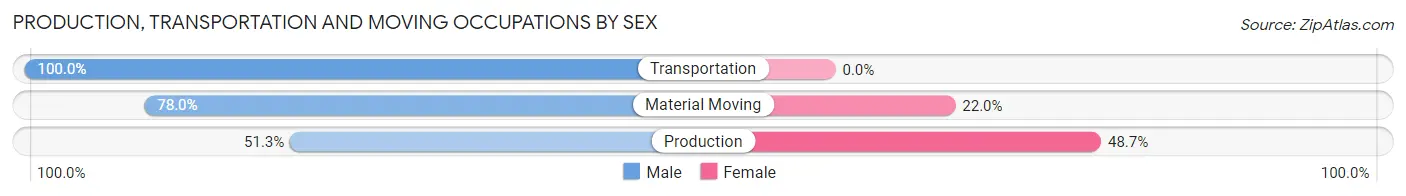
Production, Transportation and Moving Occupations by Sex
| Occupation | Male | Female |
| Production | 60 (51.3%) | 57 (48.7%) |
| Transportation | 30 (100.0%) | 0 (0.0%) |
| Material Moving | 71 (78.0%) | 20 (22.0%) |
| Total (Category) | 161 (67.6%) | 77 (32.4%) |
| Total (Overall) | 481 (53.9%) | 411 (46.1%) |
Employment Industries by Sex in La Fayette
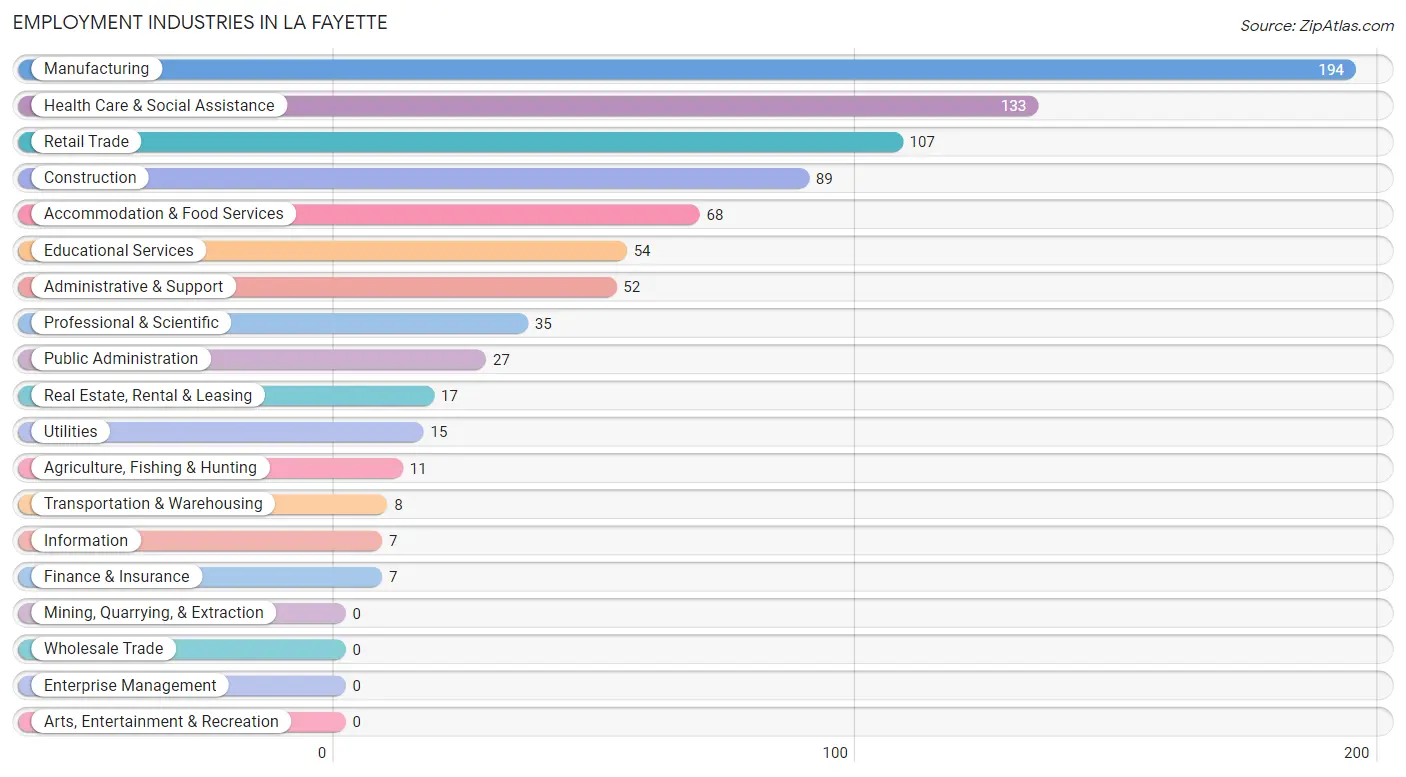
Employment Industries in La Fayette
The major employment industries in La Fayette include Manufacturing (194 | 21.7%), Health Care & Social Assistance (133 | 14.9%), Retail Trade (107 | 12.0%), Construction (89 | 10.0%), and Accommodation & Food Services (68 | 7.6%).
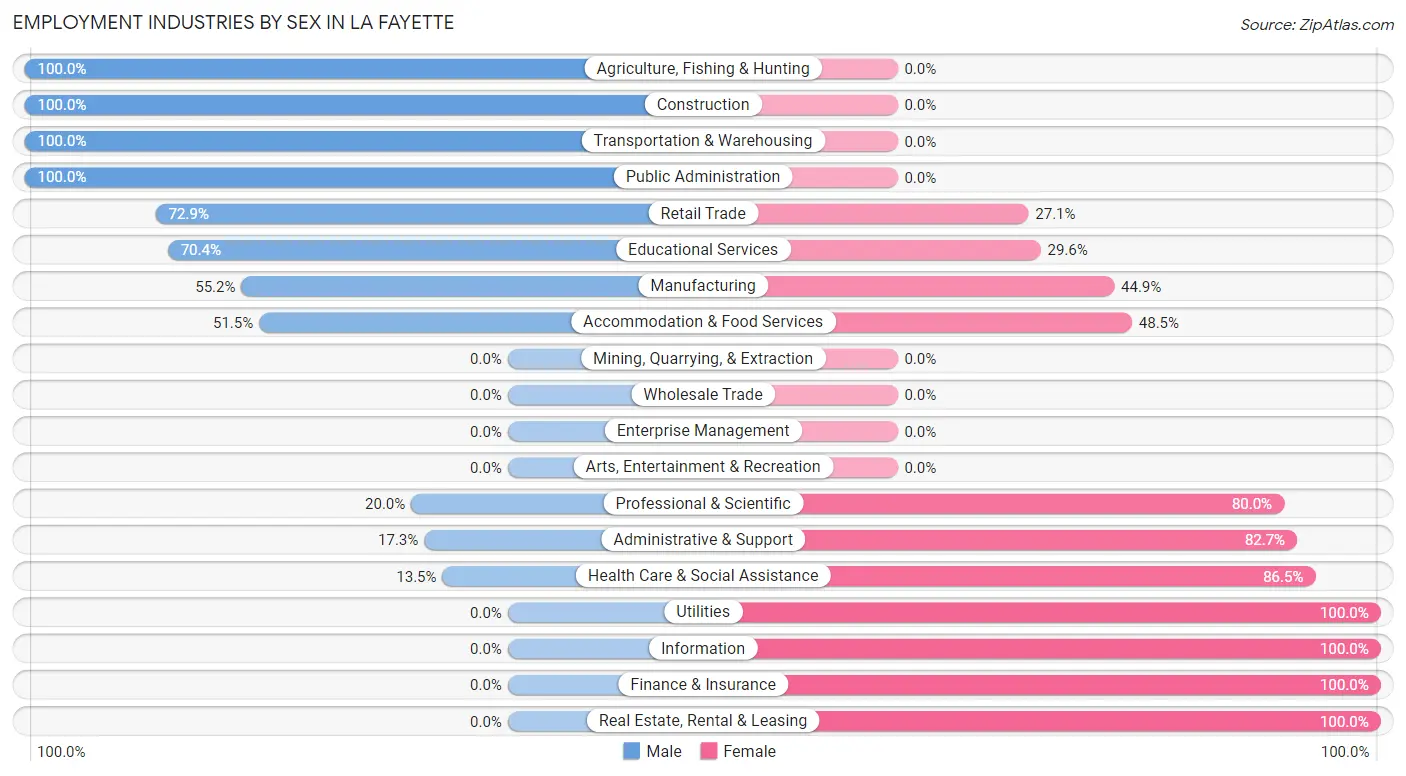
Employment Industries by Sex in La Fayette
The La Fayette industries that see more men than women are Agriculture, Fishing & Hunting (100.0%), Construction (100.0%), and Transportation & Warehousing (100.0%), whereas the industries that tend to have a higher number of women are Utilities (100.0%), Information (100.0%), and Finance & Insurance (100.0%).
| Industry | Male | Female |
| Agriculture, Fishing & Hunting | 11 (100.0%) | 0 (0.0%) |
| Mining, Quarrying, & Extraction | 0 (0.0%) | 0 (0.0%) |
| Construction | 89 (100.0%) | 0 (0.0%) |
| Manufacturing | 107 (55.1%) | 87 (44.9%) |
| Wholesale Trade | 0 (0.0%) | 0 (0.0%) |
| Retail Trade | 78 (72.9%) | 29 (27.1%) |
| Transportation & Warehousing | 8 (100.0%) | 0 (0.0%) |
| Utilities | 0 (0.0%) | 15 (100.0%) |
| Information | 0 (0.0%) | 7 (100.0%) |
| Finance & Insurance | 0 (0.0%) | 7 (100.0%) |
| Real Estate, Rental & Leasing | 0 (0.0%) | 17 (100.0%) |
| Professional & Scientific | 7 (20.0%) | 28 (80.0%) |
| Enterprise Management | 0 (0.0%) | 0 (0.0%) |
| Administrative & Support | 9 (17.3%) | 43 (82.7%) |
| Educational Services | 38 (70.4%) | 16 (29.6%) |
| Health Care & Social Assistance | 18 (13.5%) | 115 (86.5%) |
| Arts, Entertainment & Recreation | 0 (0.0%) | 0 (0.0%) |
| Accommodation & Food Services | 35 (51.5%) | 33 (48.5%) |
| Public Administration | 27 (100.0%) | 0 (0.0%) |
| Total | 481 (53.9%) | 411 (46.1%) |
Education in La Fayette
School Enrollment in La Fayette
The most common levels of schooling among the 480 students in La Fayette are middle school (165 | 34.4%), college / undergraduate (146 | 30.4%), and elementary school (45 | 9.4%).
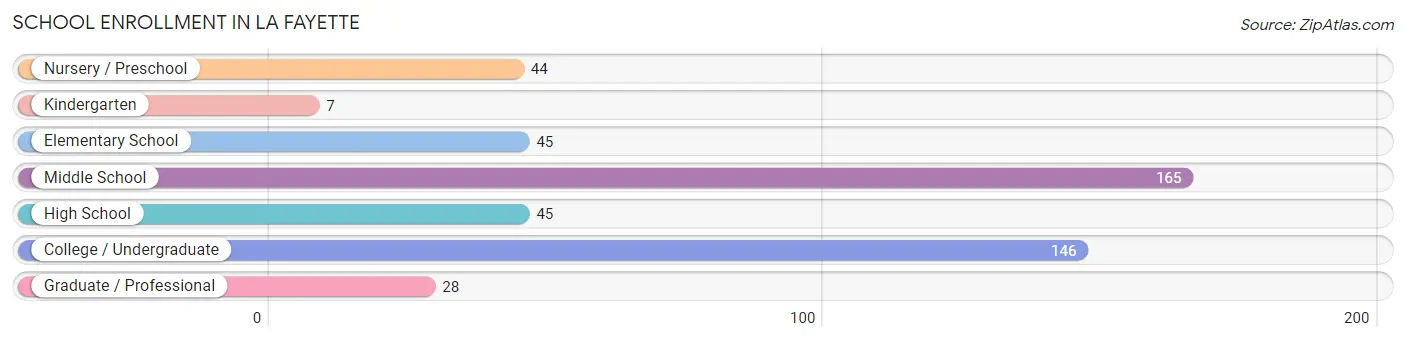
| School Level | # Students | % Students |
| Nursery / Preschool | 44 | 9.2% |
| Kindergarten | 7 | 1.5% |
| Elementary School | 45 | 9.4% |
| Middle School | 165 | 34.4% |
| High School | 45 | 9.4% |
| College / Undergraduate | 146 | 30.4% |
| Graduate / Professional | 28 | 5.8% |
| Total | 480 | 100.0% |
School Enrollment by Age by Funding Source in La Fayette
Out of a total of 480 students who are enrolled in schools in La Fayette, 56 (11.7%) attend a private institution, while the remaining 424 (88.3%) are enrolled in public schools. The age group of 18 to 19 year olds has the highest likelihood of being enrolled in private schools, with 6 (40.0% in the age bracket) enrolled. Conversely, the age group of 3 to 4 year olds has the lowest likelihood of being enrolled in a private school, with 44 (100.0% in the age bracket) attending a public institution.
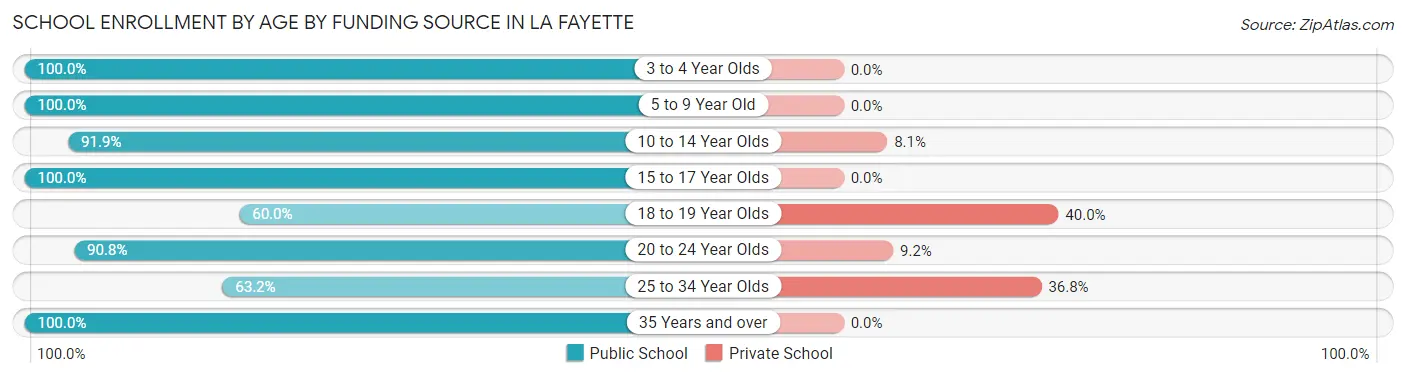
| Age Bracket | Public School | Private School |
| 3 to 4 Year Olds | 44 (100.0%) | 0 (0.0%) |
| 5 to 9 Year Old | 52 (100.0%) | 0 (0.0%) |
| 10 to 14 Year Olds | 170 (91.9%) | 15 (8.1%) |
| 15 to 17 Year Olds | 25 (100.0%) | 0 (0.0%) |
| 18 to 19 Year Olds | 9 (60.0%) | 6 (40.0%) |
| 20 to 24 Year Olds | 69 (90.8%) | 7 (9.2%) |
| 25 to 34 Year Olds | 48 (63.2%) | 28 (36.8%) |
| 35 Years and over | 7 (100.0%) | 0 (0.0%) |
| Total | 424 (88.3%) | 56 (11.7%) |
Educational Attainment by Field of Study in La Fayette
Business (80 | 28.1%), science & technology (63 | 22.1%), education (58 | 20.3%), arts & humanities (50 | 17.5%), and social sciences (7 | 2.5%) are the most common fields of study among 285 individuals in La Fayette who have obtained a bachelor's degree or higher.
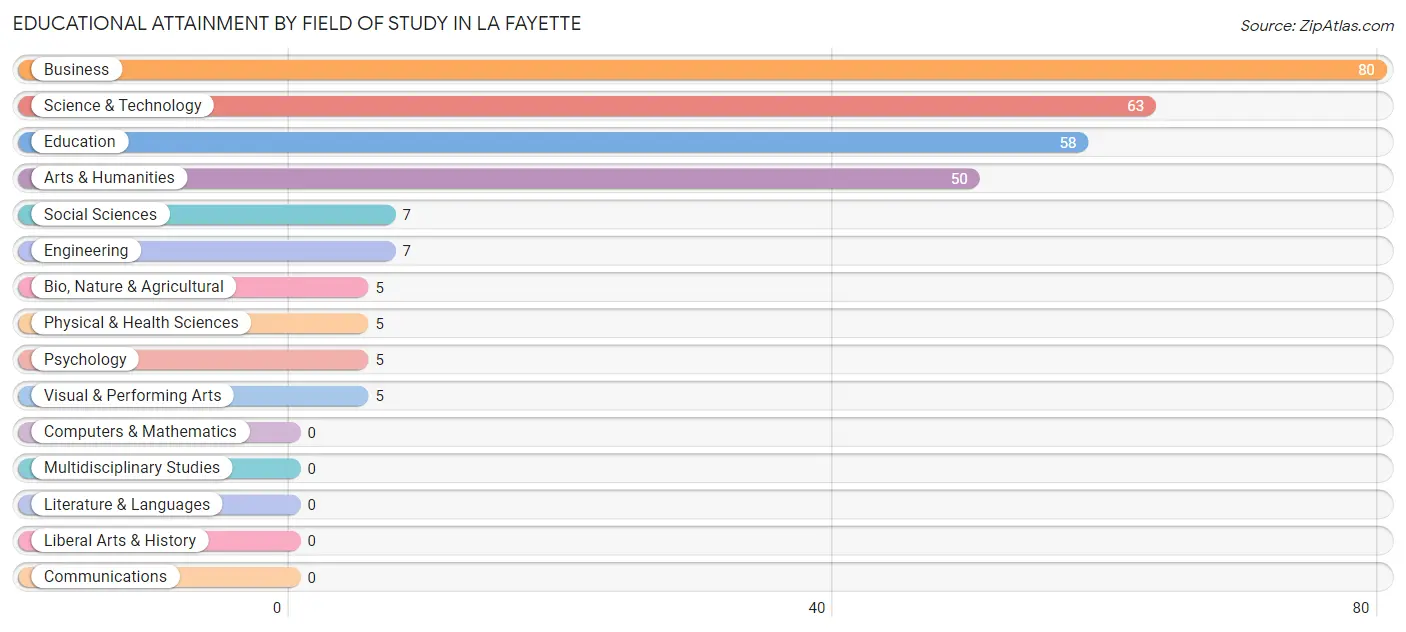
| Field of Study | # Graduates | % Graduates |
| Computers & Mathematics | 0 | 0.0% |
| Bio, Nature & Agricultural | 5 | 1.8% |
| Physical & Health Sciences | 5 | 1.8% |
| Psychology | 5 | 1.8% |
| Social Sciences | 7 | 2.5% |
| Engineering | 7 | 2.5% |
| Multidisciplinary Studies | 0 | 0.0% |
| Science & Technology | 63 | 22.1% |
| Business | 80 | 28.1% |
| Education | 58 | 20.3% |
| Literature & Languages | 0 | 0.0% |
| Liberal Arts & History | 0 | 0.0% |
| Visual & Performing Arts | 5 | 1.8% |
| Communications | 0 | 0.0% |
| Arts & Humanities | 50 | 17.5% |
| Total | 285 | 100.0% |
Transportation & Commute in La Fayette
Vehicle Availability by Sex in La Fayette
The most prevalent vehicle ownership categories in La Fayette are males with 2 vehicles (181, accounting for 39.2%) and females with 2 vehicles (103, making up 44.6%).
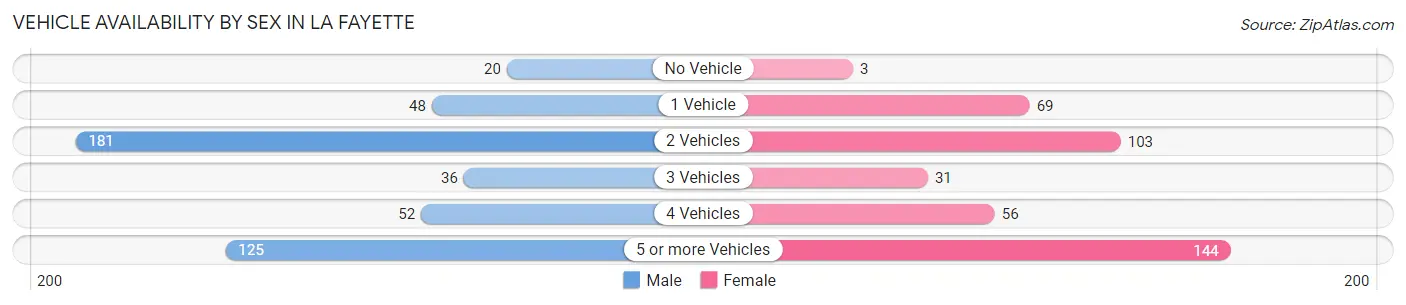
| Vehicles Available | Male | Female |
| No Vehicle | 20 (4.3%) | 3 (0.7%) |
| 1 Vehicle | 48 (10.4%) | 69 (17.0%) |
| 2 Vehicles | 181 (39.2%) | 103 (25.4%) |
| 3 Vehicles | 36 (7.8%) | 31 (7.6%) |
| 4 Vehicles | 52 (11.3%) | 56 (13.8%) |
| 5 or more Vehicles | 125 (27.1%) | 144 (35.5%) |
| Total | 462 (100.0%) | 406 (100.0%) |
Commute Time in La Fayette
The most frequently occuring commute durations in La Fayette are 45 to 59 minutes (149 commuters, 17.8%), 30 to 34 minutes (139 commuters, 16.6%), and 25 to 29 minutes (112 commuters, 13.4%).
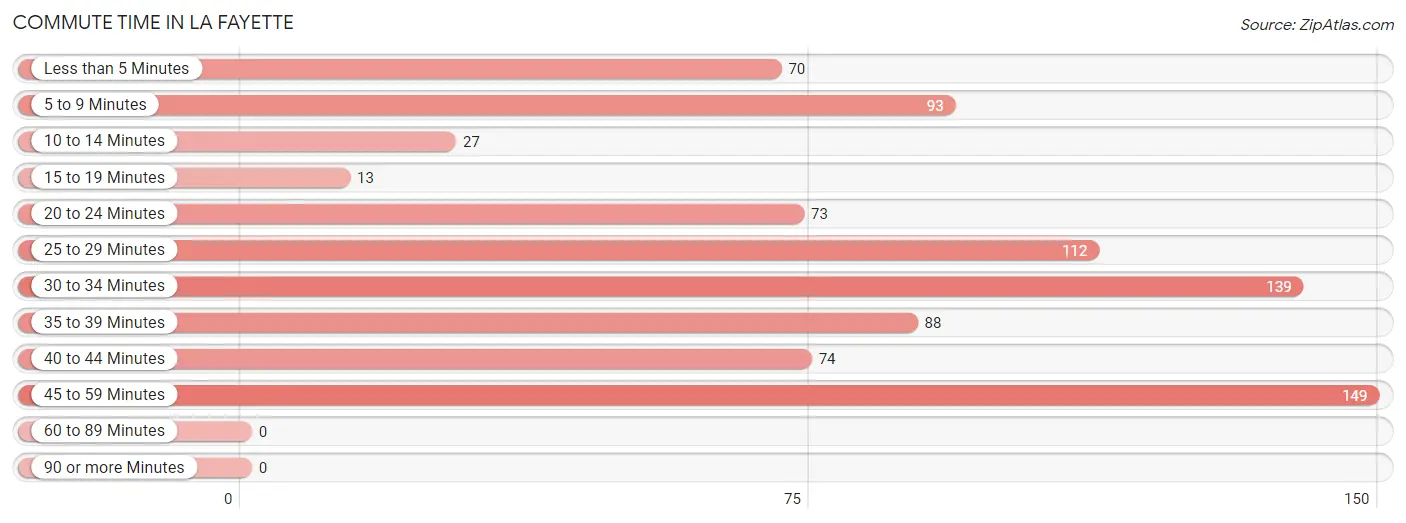
| Commute Time | # Commuters | % Commuters |
| Less than 5 Minutes | 70 | 8.4% |
| 5 to 9 Minutes | 93 | 11.1% |
| 10 to 14 Minutes | 27 | 3.2% |
| 15 to 19 Minutes | 13 | 1.5% |
| 20 to 24 Minutes | 73 | 8.7% |
| 25 to 29 Minutes | 112 | 13.4% |
| 30 to 34 Minutes | 139 | 16.6% |
| 35 to 39 Minutes | 88 | 10.5% |
| 40 to 44 Minutes | 74 | 8.8% |
| 45 to 59 Minutes | 149 | 17.8% |
| 60 to 89 Minutes | 0 | 0.0% |
| 90 or more Minutes | 0 | 0.0% |
Commute Time by Sex in La Fayette
The most common commute times in La Fayette are 45 to 59 minutes (91 commuters, 20.0%) for males and 35 to 39 minutes (71 commuters, 18.5%) for females.
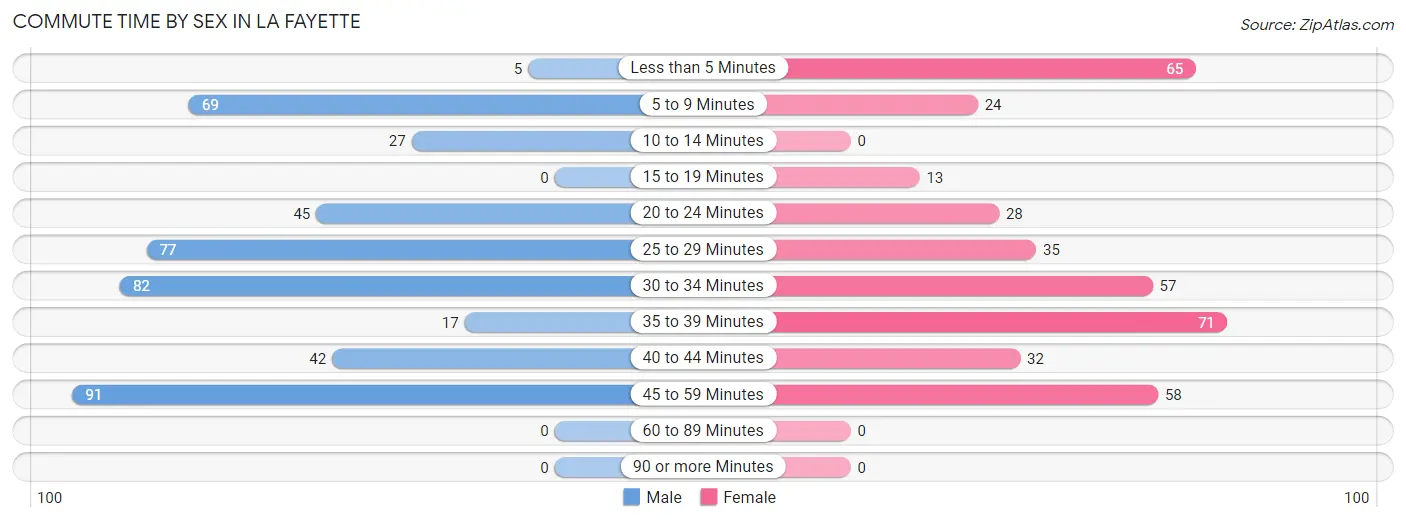
| Commute Time | Male | Female |
| Less than 5 Minutes | 5 (1.1%) | 65 (17.0%) |
| 5 to 9 Minutes | 69 (15.2%) | 24 (6.3%) |
| 10 to 14 Minutes | 27 (5.9%) | 0 (0.0%) |
| 15 to 19 Minutes | 0 (0.0%) | 13 (3.4%) |
| 20 to 24 Minutes | 45 (9.9%) | 28 (7.3%) |
| 25 to 29 Minutes | 77 (16.9%) | 35 (9.1%) |
| 30 to 34 Minutes | 82 (18.0%) | 57 (14.9%) |
| 35 to 39 Minutes | 17 (3.7%) | 71 (18.5%) |
| 40 to 44 Minutes | 42 (9.2%) | 32 (8.4%) |
| 45 to 59 Minutes | 91 (20.0%) | 58 (15.1%) |
| 60 to 89 Minutes | 0 (0.0%) | 0 (0.0%) |
| 90 or more Minutes | 0 (0.0%) | 0 (0.0%) |
Time of Departure to Work by Sex in La Fayette
The most frequent times of departure to work in La Fayette are 6:00 AM to 6:29 AM (121, 26.6%) for males and 7:00 AM to 7:29 AM (85, 22.2%) for females.
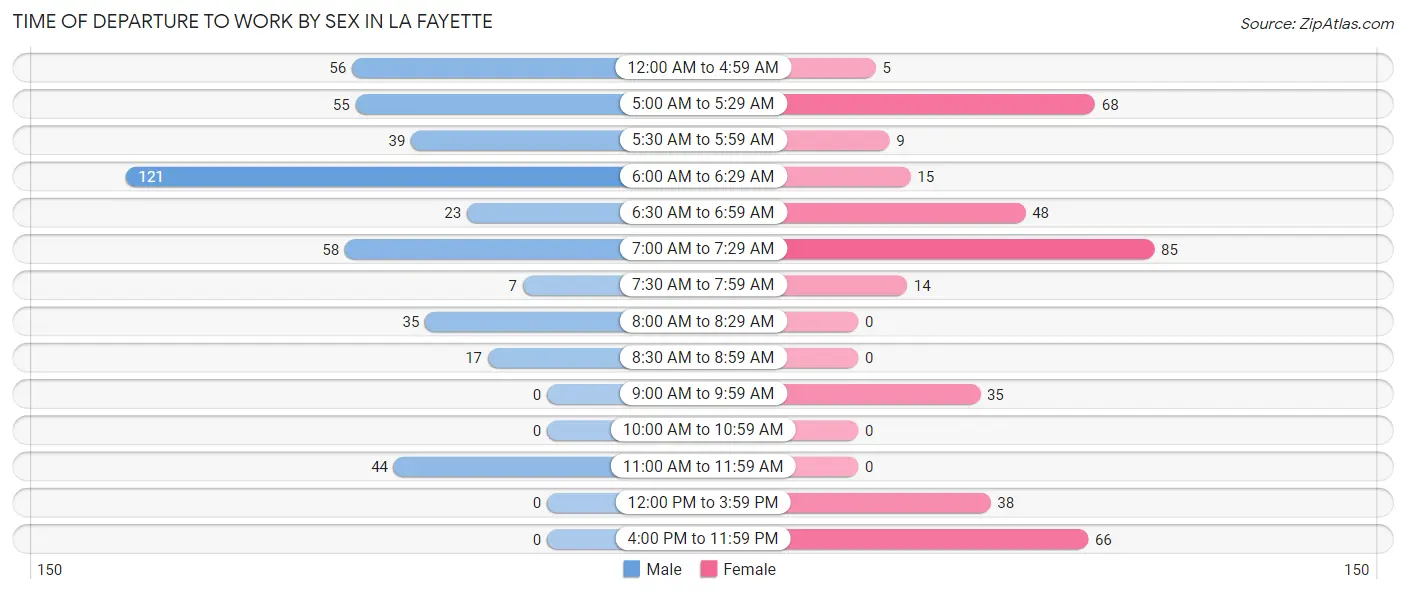
| Time of Departure | Male | Female |
| 12:00 AM to 4:59 AM | 56 (12.3%) | 5 (1.3%) |
| 5:00 AM to 5:29 AM | 55 (12.1%) | 68 (17.7%) |
| 5:30 AM to 5:59 AM | 39 (8.6%) | 9 (2.4%) |
| 6:00 AM to 6:29 AM | 121 (26.6%) | 15 (3.9%) |
| 6:30 AM to 6:59 AM | 23 (5.1%) | 48 (12.5%) |
| 7:00 AM to 7:29 AM | 58 (12.8%) | 85 (22.2%) |
| 7:30 AM to 7:59 AM | 7 (1.5%) | 14 (3.7%) |
| 8:00 AM to 8:29 AM | 35 (7.7%) | 0 (0.0%) |
| 8:30 AM to 8:59 AM | 17 (3.7%) | 0 (0.0%) |
| 9:00 AM to 9:59 AM | 0 (0.0%) | 35 (9.1%) |
| 10:00 AM to 10:59 AM | 0 (0.0%) | 0 (0.0%) |
| 11:00 AM to 11:59 AM | 44 (9.7%) | 0 (0.0%) |
| 12:00 PM to 3:59 PM | 0 (0.0%) | 38 (9.9%) |
| 4:00 PM to 11:59 PM | 0 (0.0%) | 66 (17.2%) |
| Total | 455 (100.0%) | 383 (100.0%) |
Housing Occupancy in La Fayette
Occupancy by Ownership in La Fayette
Of the total 1,070 dwellings in La Fayette, owner-occupied units account for 738 (69.0%), while renter-occupied units make up 332 (31.0%).
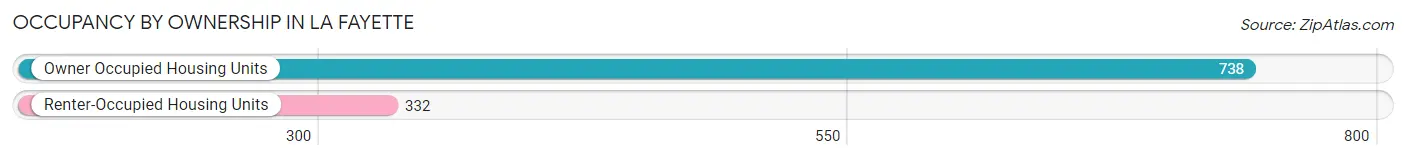
| Occupancy | # Housing Units | % Housing Units |
| Owner Occupied Housing Units | 738 | 69.0% |
| Renter-Occupied Housing Units | 332 | 31.0% |
| Total Occupied Housing Units | 1,070 | 100.0% |
Occupancy by Household Size in La Fayette
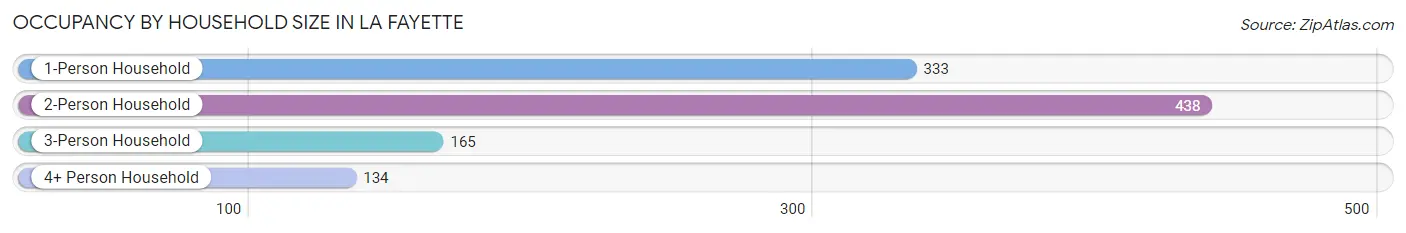
| Household Size | # Housing Units | % Housing Units |
| 1-Person Household | 333 | 31.1% |
| 2-Person Household | 438 | 40.9% |
| 3-Person Household | 165 | 15.4% |
| 4+ Person Household | 134 | 12.5% |
| Total Housing Units | 1,070 | 100.0% |
Occupancy by Ownership by Household Size in La Fayette
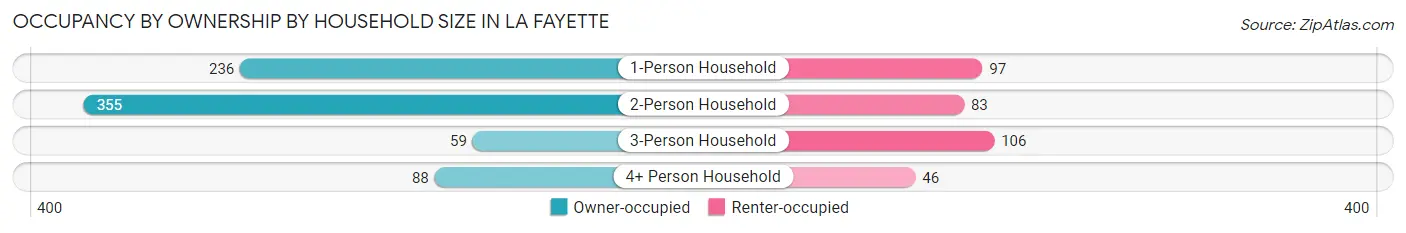
| Household Size | Owner-occupied | Renter-occupied |
| 1-Person Household | 236 (70.9%) | 97 (29.1%) |
| 2-Person Household | 355 (81.0%) | 83 (19.0%) |
| 3-Person Household | 59 (35.8%) | 106 (64.2%) |
| 4+ Person Household | 88 (65.7%) | 46 (34.3%) |
| Total Housing Units | 738 (69.0%) | 332 (31.0%) |
Occupancy by Educational Attainment in La Fayette
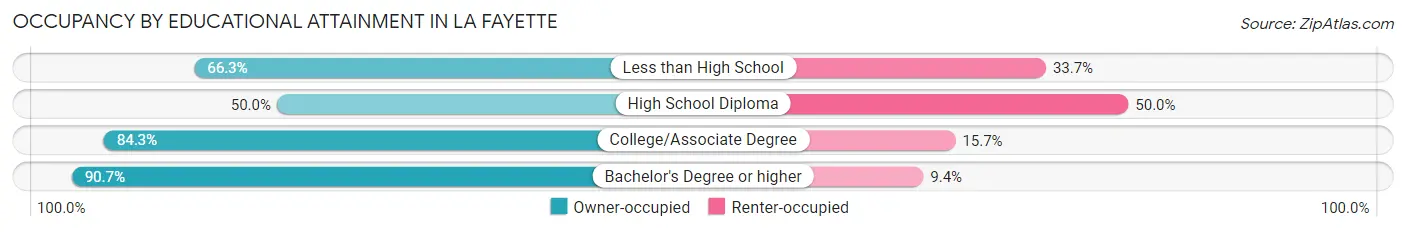
| Household Size | Owner-occupied | Renter-occupied |
| Less than High School | 134 (66.3%) | 68 (33.7%) |
| High School Diploma | 196 (50.0%) | 196 (50.0%) |
| College/Associate Degree | 311 (84.3%) | 58 (15.7%) |
| Bachelor's Degree or higher | 97 (90.6%) | 10 (9.3%) |
Occupancy by Age of Householder in La Fayette
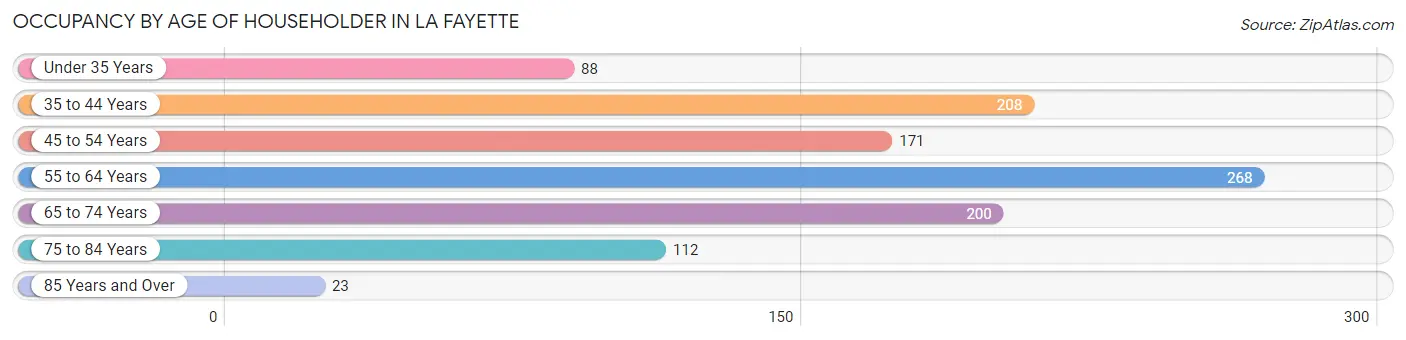
| Age Bracket | # Households | % Households |
| Under 35 Years | 88 | 8.2% |
| 35 to 44 Years | 208 | 19.4% |
| 45 to 54 Years | 171 | 16.0% |
| 55 to 64 Years | 268 | 25.1% |
| 65 to 74 Years | 200 | 18.7% |
| 75 to 84 Years | 112 | 10.5% |
| 85 Years and Over | 23 | 2.1% |
| Total | 1,070 | 100.0% |
Housing Finances in La Fayette
Median Income by Occupancy in La Fayette
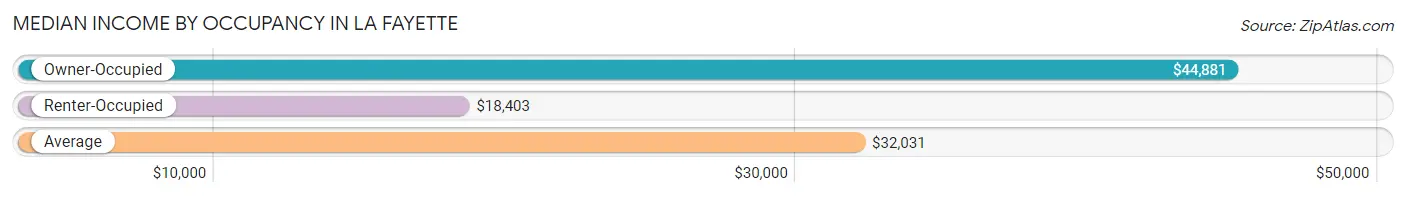
| Occupancy Type | # Households | Median Income |
| Owner-Occupied | 738 (69.0%) | $44,881 |
| Renter-Occupied | 332 (31.0%) | $18,403 |
| Average | 1,070 (100.0%) | $32,031 |
Occupancy by Householder Income Bracket in La Fayette
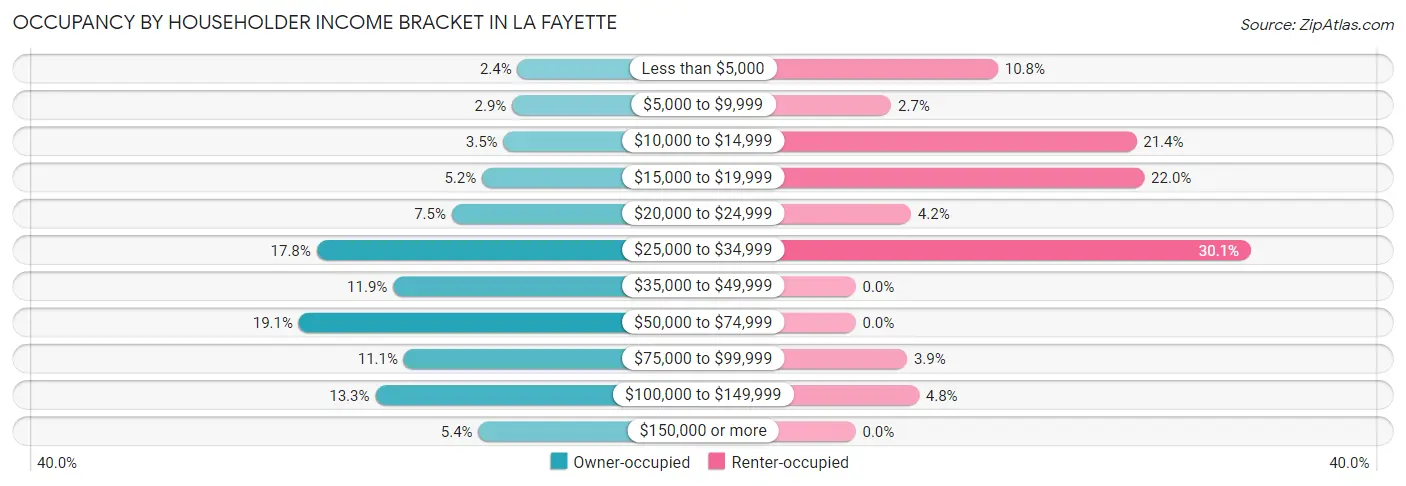
| Income Bracket | Owner-occupied | Renter-occupied |
| Less than $5,000 | 18 (2.4%) | 36 (10.8%) |
| $5,000 to $9,999 | 21 (2.9%) | 9 (2.7%) |
| $10,000 to $14,999 | 26 (3.5%) | 71 (21.4%) |
| $15,000 to $19,999 | 38 (5.1%) | 73 (22.0%) |
| $20,000 to $24,999 | 55 (7.4%) | 14 (4.2%) |
| $25,000 to $34,999 | 131 (17.7%) | 100 (30.1%) |
| $35,000 to $49,999 | 88 (11.9%) | 0 (0.0%) |
| $50,000 to $74,999 | 141 (19.1%) | 0 (0.0%) |
| $75,000 to $99,999 | 82 (11.1%) | 13 (3.9%) |
| $100,000 to $149,999 | 98 (13.3%) | 16 (4.8%) |
| $150,000 or more | 40 (5.4%) | 0 (0.0%) |
| Total | 738 (100.0%) | 332 (100.0%) |
Monthly Housing Cost Tiers in La Fayette
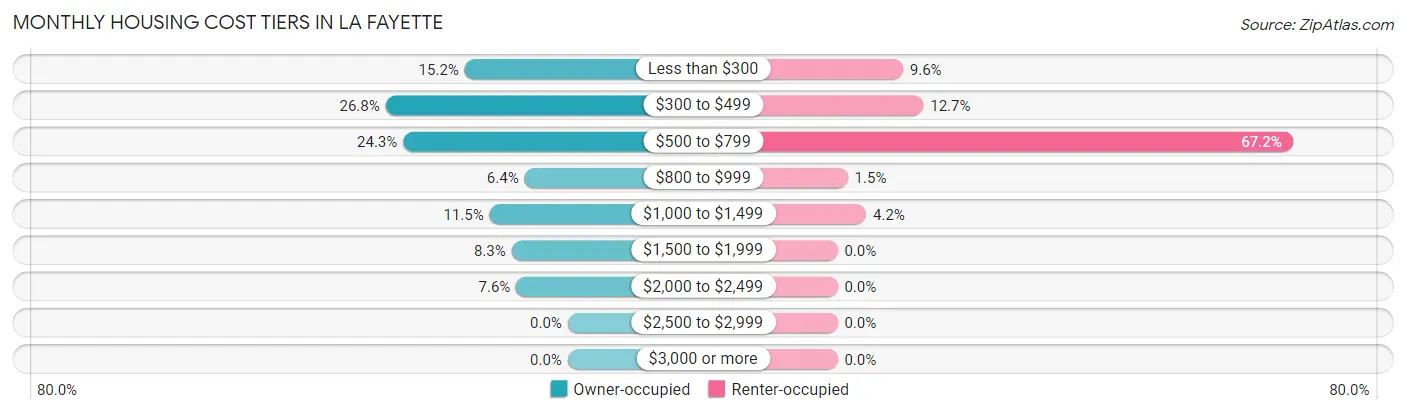
| Monthly Cost | Owner-occupied | Renter-occupied |
| Less than $300 | 112 (15.2%) | 32 (9.6%) |
| $300 to $499 | 198 (26.8%) | 42 (12.7%) |
| $500 to $799 | 179 (24.2%) | 223 (67.2%) |
| $800 to $999 | 47 (6.4%) | 5 (1.5%) |
| $1,000 to $1,499 | 85 (11.5%) | 14 (4.2%) |
| $1,500 to $1,999 | 61 (8.3%) | 0 (0.0%) |
| $2,000 to $2,499 | 56 (7.6%) | 0 (0.0%) |
| $2,500 to $2,999 | 0 (0.0%) | 0 (0.0%) |
| $3,000 or more | 0 (0.0%) | 0 (0.0%) |
| Total | 738 (100.0%) | 332 (100.0%) |
Physical Housing Characteristics in La Fayette
Housing Structures in La Fayette
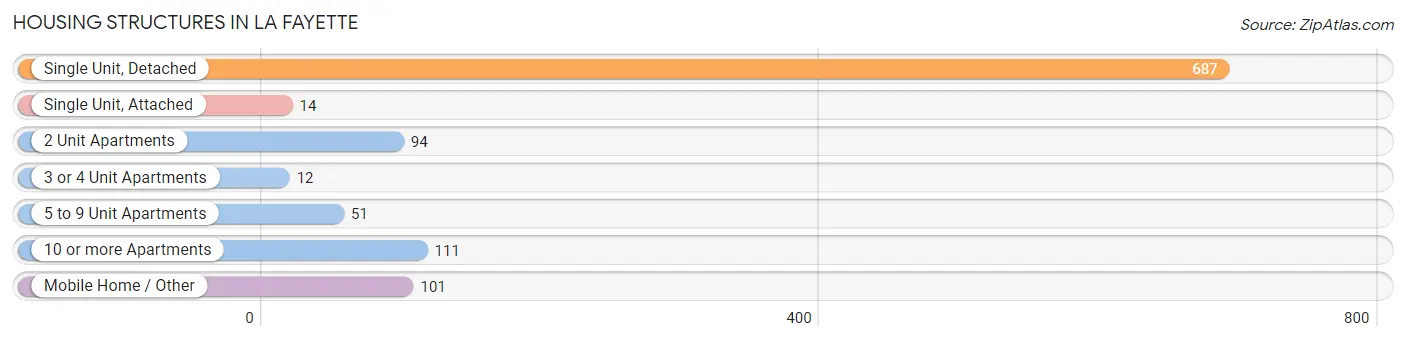
| Structure Type | # Housing Units | % Housing Units |
| Single Unit, Detached | 687 | 64.2% |
| Single Unit, Attached | 14 | 1.3% |
| 2 Unit Apartments | 94 | 8.8% |
| 3 or 4 Unit Apartments | 12 | 1.1% |
| 5 to 9 Unit Apartments | 51 | 4.8% |
| 10 or more Apartments | 111 | 10.4% |
| Mobile Home / Other | 101 | 9.4% |
| Total | 1,070 | 100.0% |
Housing Structures by Occupancy in La Fayette
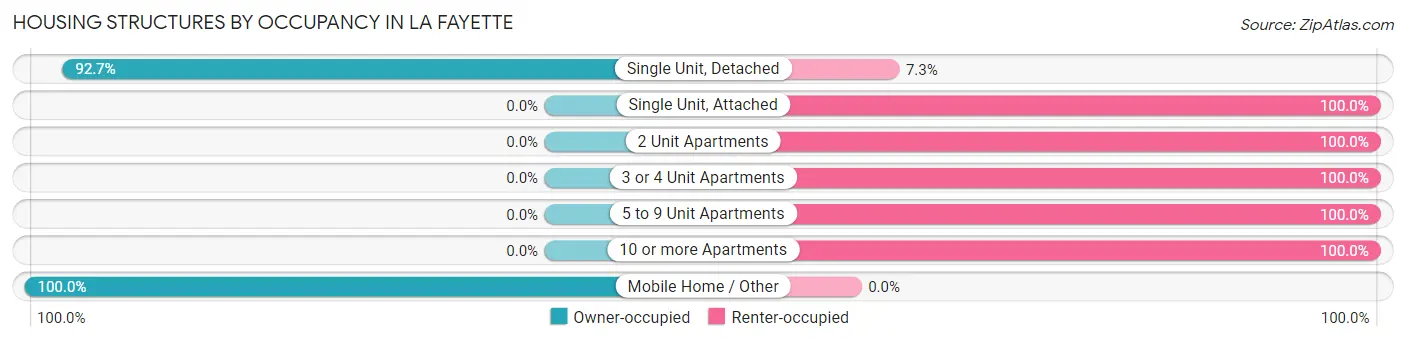
| Structure Type | Owner-occupied | Renter-occupied |
| Single Unit, Detached | 637 (92.7%) | 50 (7.3%) |
| Single Unit, Attached | 0 (0.0%) | 14 (100.0%) |
| 2 Unit Apartments | 0 (0.0%) | 94 (100.0%) |
| 3 or 4 Unit Apartments | 0 (0.0%) | 12 (100.0%) |
| 5 to 9 Unit Apartments | 0 (0.0%) | 51 (100.0%) |
| 10 or more Apartments | 0 (0.0%) | 111 (100.0%) |
| Mobile Home / Other | 101 (100.0%) | 0 (0.0%) |
| Total | 738 (69.0%) | 332 (31.0%) |
Housing Structures by Number of Rooms in La Fayette
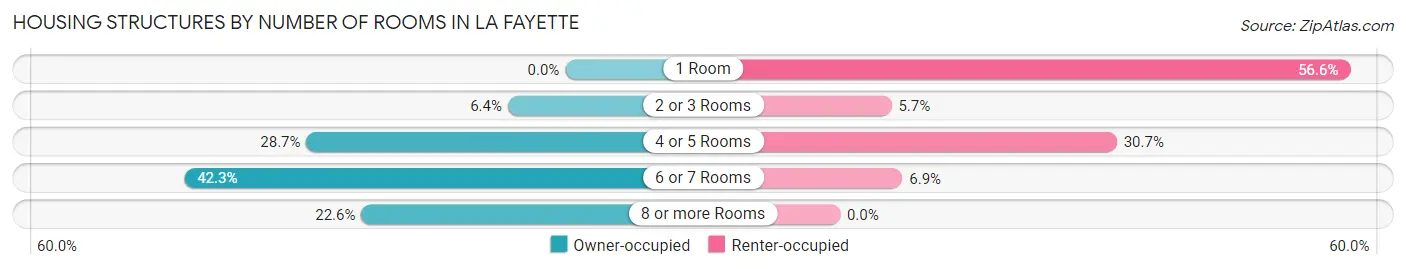
| Number of Rooms | Owner-occupied | Renter-occupied |
| 1 Room | 0 (0.0%) | 188 (56.6%) |
| 2 or 3 Rooms | 47 (6.4%) | 19 (5.7%) |
| 4 or 5 Rooms | 212 (28.7%) | 102 (30.7%) |
| 6 or 7 Rooms | 312 (42.3%) | 23 (6.9%) |
| 8 or more Rooms | 167 (22.6%) | 0 (0.0%) |
| Total | 738 (100.0%) | 332 (100.0%) |
Housing Structure by Heating Type in La Fayette
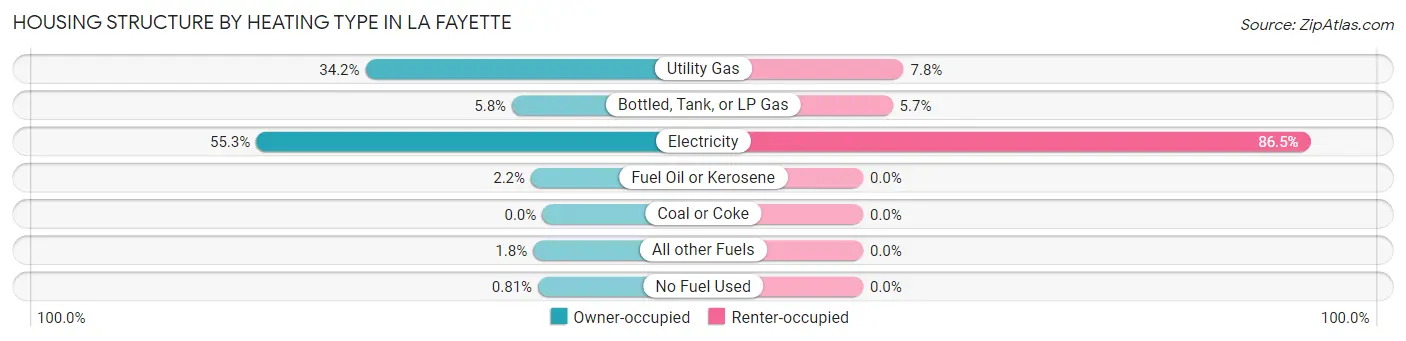
| Heating Type | Owner-occupied | Renter-occupied |
| Utility Gas | 252 (34.2%) | 26 (7.8%) |
| Bottled, Tank, or LP Gas | 43 (5.8%) | 19 (5.7%) |
| Electricity | 408 (55.3%) | 287 (86.5%) |
| Fuel Oil or Kerosene | 16 (2.2%) | 0 (0.0%) |
| Coal or Coke | 0 (0.0%) | 0 (0.0%) |
| All other Fuels | 13 (1.8%) | 0 (0.0%) |
| No Fuel Used | 6 (0.8%) | 0 (0.0%) |
| Total | 738 (100.0%) | 332 (100.0%) |
Household Vehicle Usage in La Fayette
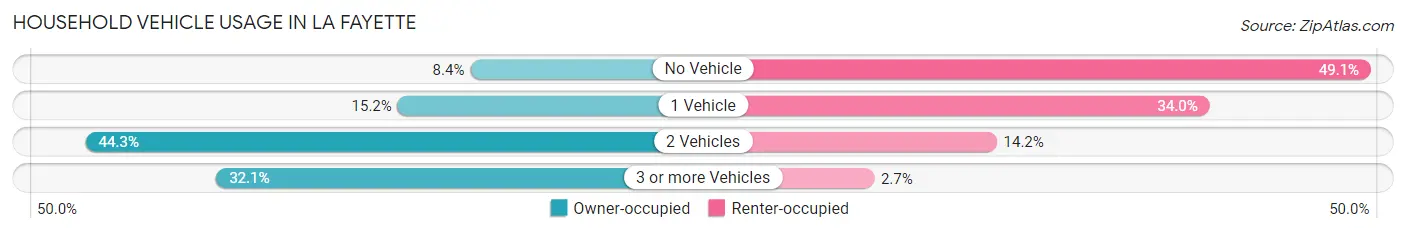
| Vehicles per Household | Owner-occupied | Renter-occupied |
| No Vehicle | 62 (8.4%) | 163 (49.1%) |
| 1 Vehicle | 112 (15.2%) | 113 (34.0%) |
| 2 Vehicles | 327 (44.3%) | 47 (14.2%) |
| 3 or more Vehicles | 237 (32.1%) | 9 (2.7%) |
| Total | 738 (100.0%) | 332 (100.0%) |
Real Estate & Mortgages in La Fayette
Real Estate and Mortgage Overview in La Fayette
| Characteristic | Without Mortgage | With Mortgage |
| Housing Units | 472 | 266 |
| Median Property Value | $113,500 | $166,100 |
| Median Household Income | $43,289 | $35 |
| Monthly Housing Costs | $452 | $0 |
| Real Estate Taxes | $450 | $52 |
Property Value by Mortgage Status in La Fayette
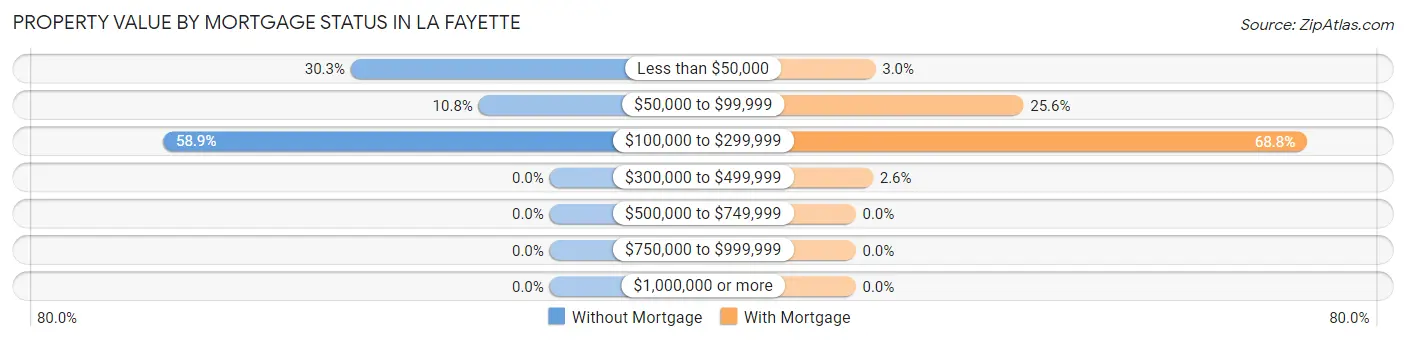
| Property Value | Without Mortgage | With Mortgage |
| Less than $50,000 | 143 (30.3%) | 8 (3.0%) |
| $50,000 to $99,999 | 51 (10.8%) | 68 (25.6%) |
| $100,000 to $299,999 | 278 (58.9%) | 183 (68.8%) |
| $300,000 to $499,999 | 0 (0.0%) | 7 (2.6%) |
| $500,000 to $749,999 | 0 (0.0%) | 0 (0.0%) |
| $750,000 to $999,999 | 0 (0.0%) | 0 (0.0%) |
| $1,000,000 or more | 0 (0.0%) | 0 (0.0%) |
| Total | 472 (100.0%) | 266 (100.0%) |
Household Income by Mortgage Status in La Fayette
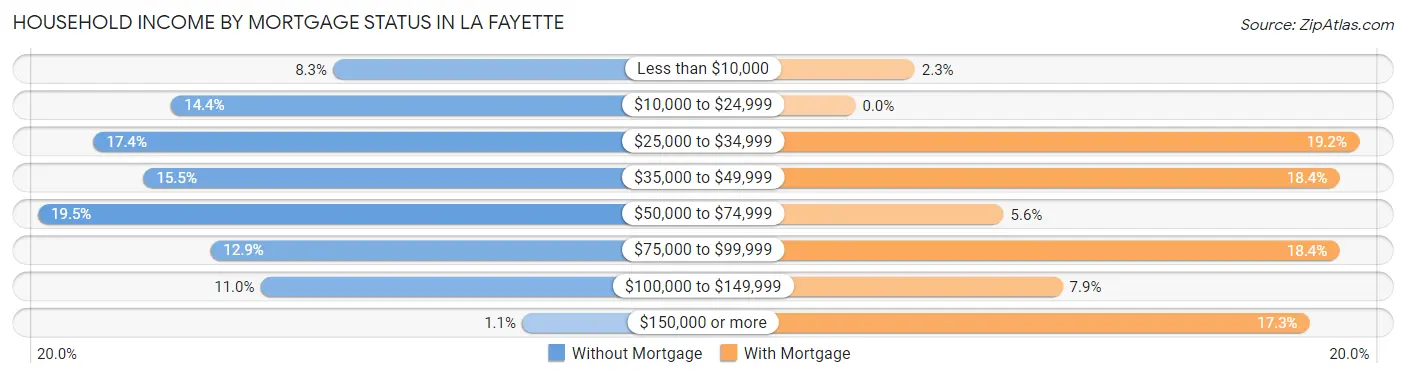
| Household Income | Without Mortgage | With Mortgage |
| Less than $10,000 | 39 (8.3%) | 6 (2.3%) |
| $10,000 to $24,999 | 68 (14.4%) | 0 (0.0%) |
| $25,000 to $34,999 | 82 (17.4%) | 51 (19.2%) |
| $35,000 to $49,999 | 73 (15.5%) | 49 (18.4%) |
| $50,000 to $74,999 | 92 (19.5%) | 15 (5.6%) |
| $75,000 to $99,999 | 61 (12.9%) | 49 (18.4%) |
| $100,000 to $149,999 | 52 (11.0%) | 21 (7.9%) |
| $150,000 or more | 5 (1.1%) | 46 (17.3%) |
| Total | 472 (100.0%) | 266 (100.0%) |
Property Value to Household Income Ratio in La Fayette
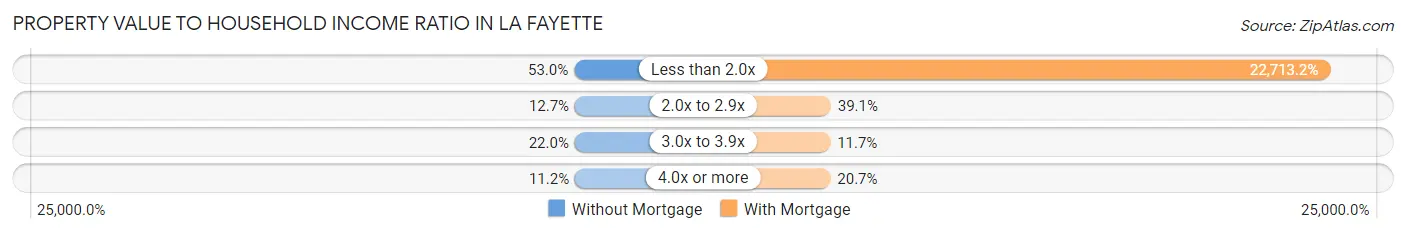
| Value-to-Income Ratio | Without Mortgage | With Mortgage |
| Less than 2.0x | 250 (53.0%) | 60,417 (22,713.2%) |
| 2.0x to 2.9x | 60 (12.7%) | 104 (39.1%) |
| 3.0x to 3.9x | 104 (22.0%) | 31 (11.7%) |
| 4.0x or more | 53 (11.2%) | 55 (20.7%) |
| Total | 472 (100.0%) | 266 (100.0%) |
Real Estate Taxes by Mortgage Status in La Fayette
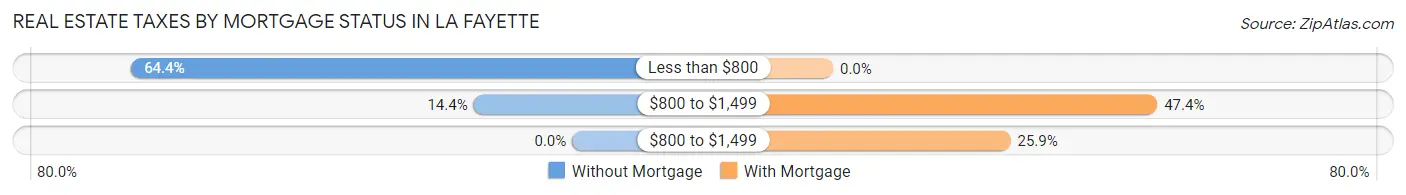
| Property Taxes | Without Mortgage | With Mortgage |
| Less than $800 | 304 (64.4%) | 0 (0.0%) |
| $800 to $1,499 | 68 (14.4%) | 126 (47.4%) |
| $800 to $1,499 | 0 (0.0%) | 69 (25.9%) |
| Total | 472 (100.0%) | 266 (100.0%) |
Health & Disability in La Fayette
Health Insurance Coverage by Age in La Fayette
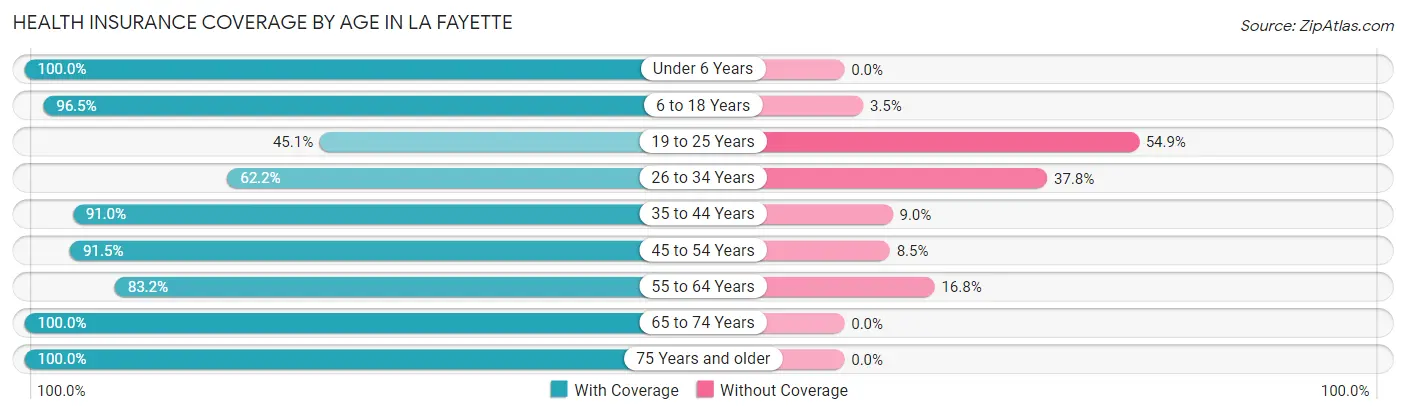
| Age Bracket | With Coverage | Without Coverage |
| Under 6 Years | 109 (100.0%) | 0 (0.0%) |
| 6 to 18 Years | 276 (96.5%) | 10 (3.5%) |
| 19 to 25 Years | 69 (45.1%) | 84 (54.9%) |
| 26 to 34 Years | 199 (62.2%) | 121 (37.8%) |
| 35 to 44 Years | 243 (91.0%) | 24 (9.0%) |
| 45 to 54 Years | 346 (91.5%) | 32 (8.5%) |
| 55 to 64 Years | 356 (83.2%) | 72 (16.8%) |
| 65 to 74 Years | 308 (100.0%) | 0 (0.0%) |
| 75 Years and older | 166 (100.0%) | 0 (0.0%) |
| Total | 2,072 (85.8%) | 343 (14.2%) |
Health Insurance Coverage by Citizenship Status in La Fayette
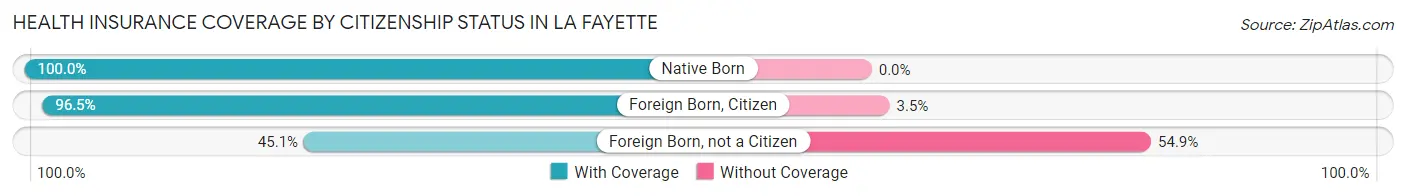
| Citizenship Status | With Coverage | Without Coverage |
| Native Born | 109 (100.0%) | 0 (0.0%) |
| Foreign Born, Citizen | 276 (96.5%) | 10 (3.5%) |
| Foreign Born, not a Citizen | 69 (45.1%) | 84 (54.9%) |
Health Insurance Coverage by Household Income in La Fayette
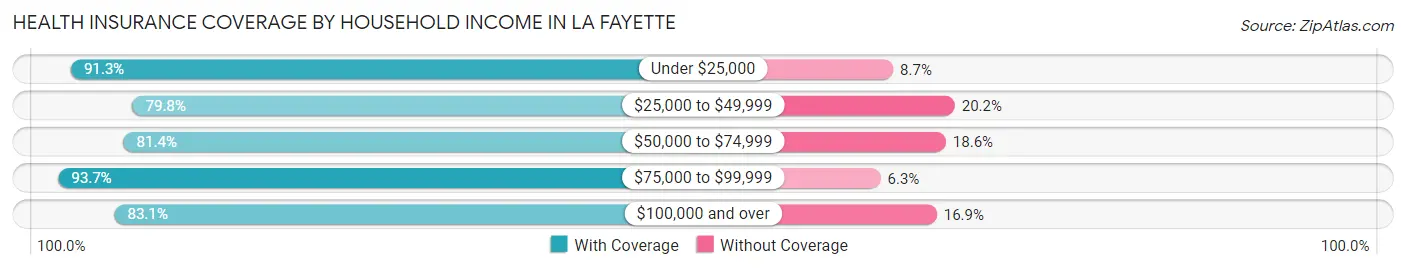
| Household Income | With Coverage | Without Coverage |
| Under $25,000 | 662 (91.3%) | 63 (8.7%) |
| $25,000 to $49,999 | 465 (79.8%) | 118 (20.2%) |
| $50,000 to $74,999 | 250 (81.4%) | 57 (18.6%) |
| $75,000 to $99,999 | 266 (93.7%) | 18 (6.3%) |
| $100,000 and over | 429 (83.1%) | 87 (16.9%) |
Public vs Private Health Insurance Coverage by Age in La Fayette
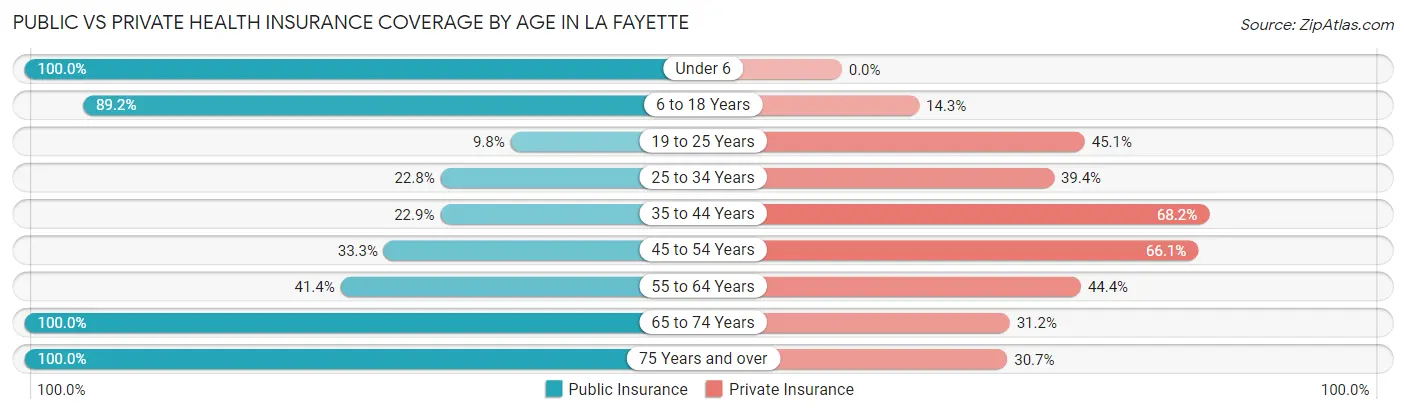
| Age Bracket | Public Insurance | Private Insurance |
| Under 6 | 109 (100.0%) | 0 (0.0%) |
| 6 to 18 Years | 255 (89.2%) | 41 (14.3%) |
| 19 to 25 Years | 15 (9.8%) | 69 (45.1%) |
| 25 to 34 Years | 73 (22.8%) | 126 (39.4%) |
| 35 to 44 Years | 61 (22.9%) | 182 (68.2%) |
| 45 to 54 Years | 126 (33.3%) | 250 (66.1%) |
| 55 to 64 Years | 177 (41.4%) | 190 (44.4%) |
| 65 to 74 Years | 308 (100.0%) | 96 (31.2%) |
| 75 Years and over | 166 (100.0%) | 51 (30.7%) |
| Total | 1,290 (53.4%) | 1,005 (41.6%) |
Disability Status by Sex by Age in La Fayette
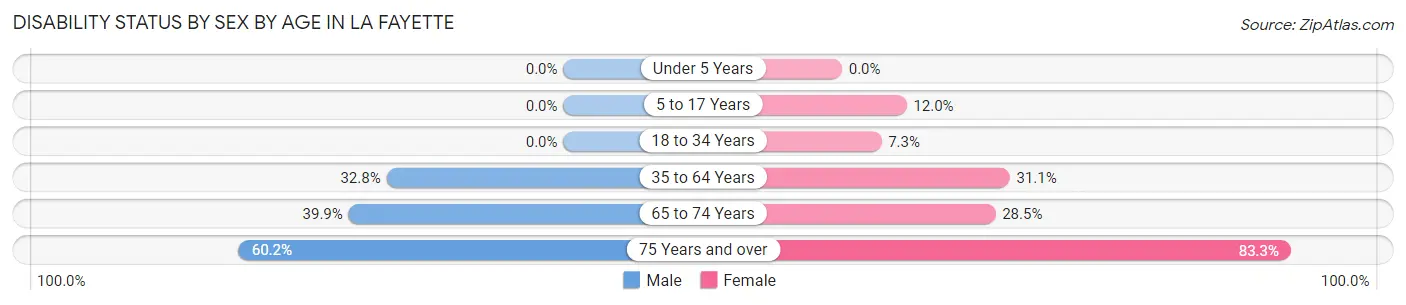
| Age Bracket | Male | Female |
| Under 5 Years | 0 (0.0%) | 0 (0.0%) |
| 5 to 17 Years | 0 (0.0%) | 9 (12.0%) |
| 18 to 34 Years | 0 (0.0%) | 16 (7.3%) |
| 35 to 64 Years | 153 (32.8%) | 189 (31.1%) |
| 65 to 74 Years | 57 (39.9%) | 47 (28.5%) |
| 75 Years and over | 53 (60.2%) | 65 (83.3%) |
Disability Class by Sex by Age in La Fayette
Disability Class: Hearing Difficulty
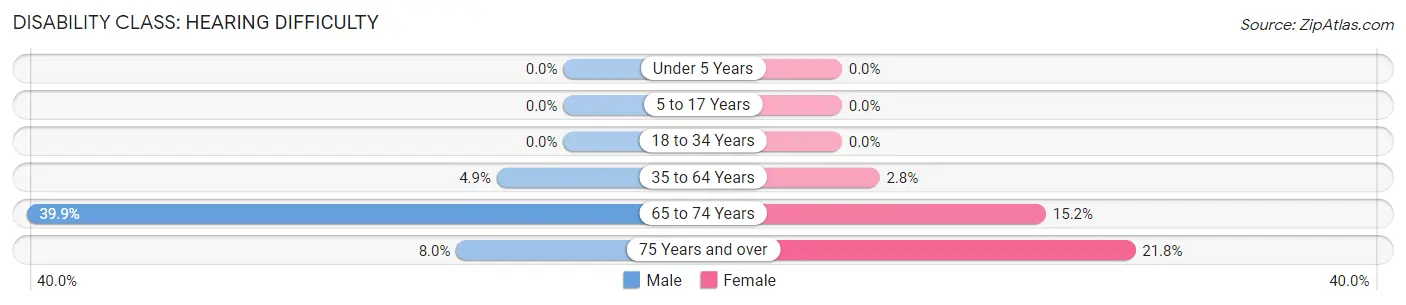
| Age Bracket | Male | Female |
| Under 5 Years | 0 (0.0%) | 0 (0.0%) |
| 5 to 17 Years | 0 (0.0%) | 0 (0.0%) |
| 18 to 34 Years | 0 (0.0%) | 0 (0.0%) |
| 35 to 64 Years | 23 (4.9%) | 17 (2.8%) |
| 65 to 74 Years | 57 (39.9%) | 25 (15.1%) |
| 75 Years and over | 7 (8.0%) | 17 (21.8%) |
Disability Class: Vision Difficulty
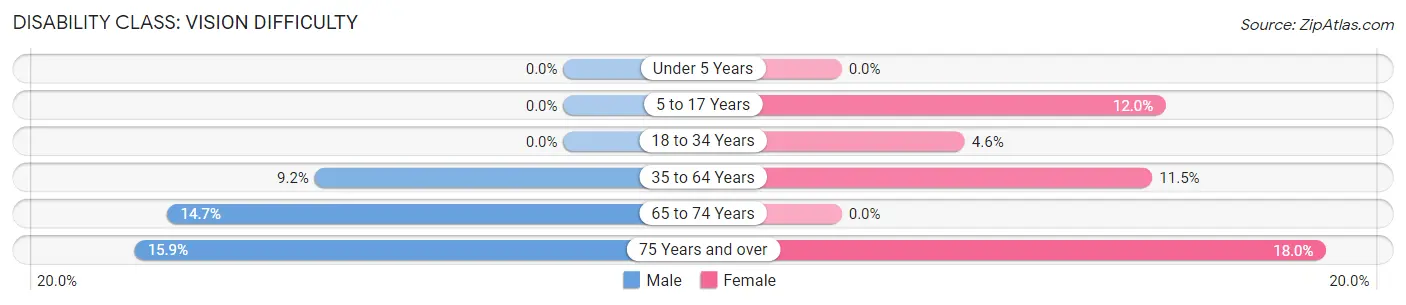
| Age Bracket | Male | Female |
| Under 5 Years | 0 (0.0%) | 0 (0.0%) |
| 5 to 17 Years | 0 (0.0%) | 9 (12.0%) |
| 18 to 34 Years | 0 (0.0%) | 10 (4.6%) |
| 35 to 64 Years | 43 (9.2%) | 70 (11.5%) |
| 65 to 74 Years | 21 (14.7%) | 0 (0.0%) |
| 75 Years and over | 14 (15.9%) | 14 (17.9%) |
Disability Class: Cognitive Difficulty
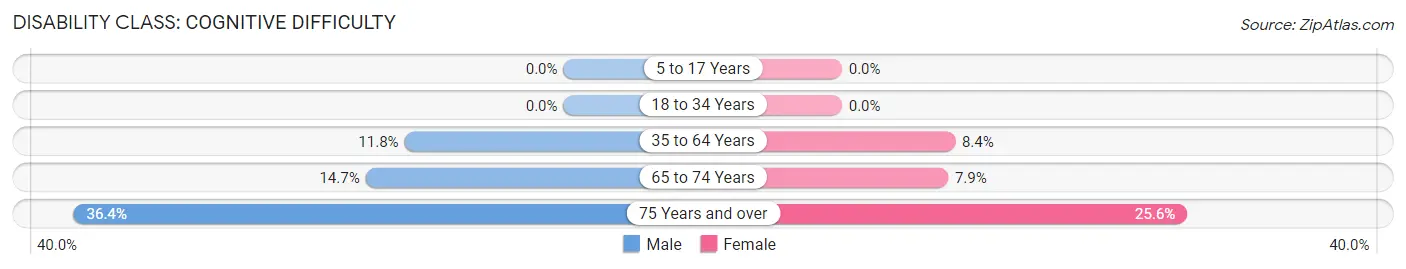
| Age Bracket | Male | Female |
| 5 to 17 Years | 0 (0.0%) | 0 (0.0%) |
| 18 to 34 Years | 0 (0.0%) | 0 (0.0%) |
| 35 to 64 Years | 55 (11.8%) | 51 (8.4%) |
| 65 to 74 Years | 21 (14.7%) | 13 (7.9%) |
| 75 Years and over | 32 (36.4%) | 20 (25.6%) |
Disability Class: Ambulatory Difficulty
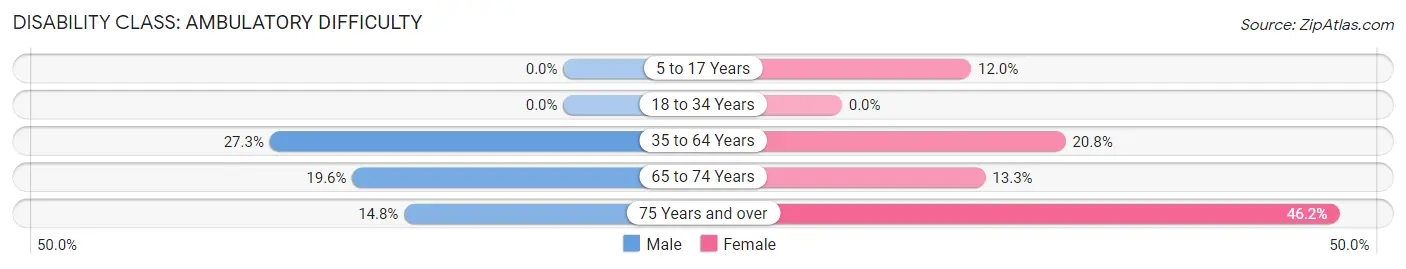
| Age Bracket | Male | Female |
| 5 to 17 Years | 0 (0.0%) | 9 (12.0%) |
| 18 to 34 Years | 0 (0.0%) | 0 (0.0%) |
| 35 to 64 Years | 127 (27.3%) | 126 (20.8%) |
| 65 to 74 Years | 28 (19.6%) | 22 (13.3%) |
| 75 Years and over | 13 (14.8%) | 36 (46.2%) |
Disability Class: Self-Care Difficulty
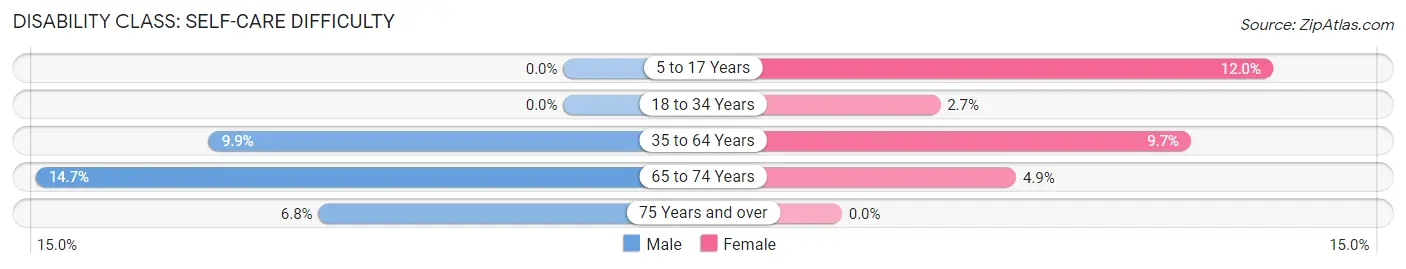
| Age Bracket | Male | Female |
| 5 to 17 Years | 0 (0.0%) | 9 (12.0%) |
| 18 to 34 Years | 0 (0.0%) | 6 (2.7%) |
| 35 to 64 Years | 46 (9.9%) | 59 (9.7%) |
| 65 to 74 Years | 21 (14.7%) | 8 (4.9%) |
| 75 Years and over | 6 (6.8%) | 0 (0.0%) |
Technology Access in La Fayette
Computing Device Access in La Fayette
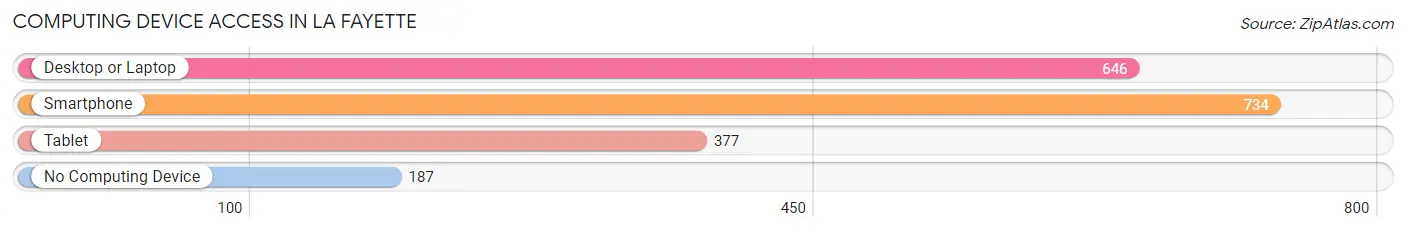
| Device Type | # Households | % Households |
| Desktop or Laptop | 646 | 60.4% |
| Smartphone | 734 | 68.6% |
| Tablet | 377 | 35.2% |
| No Computing Device | 187 | 17.5% |
| Total | 1,070 | 100.0% |
Internet Access in La Fayette
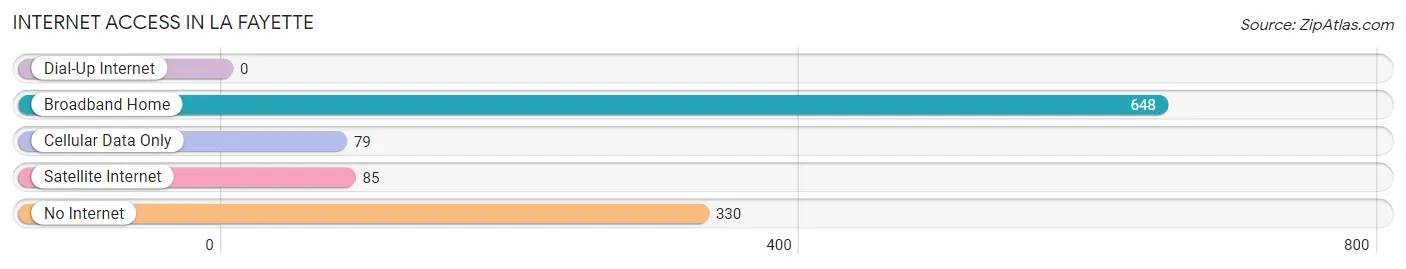
| Internet Type | # Households | % Households |
| Dial-Up Internet | 0 | 0.0% |
| Broadband Home | 648 | 60.6% |
| Cellular Data Only | 79 | 7.4% |
| Satellite Internet | 85 | 7.9% |
| No Internet | 330 | 30.8% |
| Total | 1,070 | 100.0% |
La Fayette Summary
La Fayette, Alabama is a small town located in Chambers County, Alabama. It is situated on the banks of the Chattahoochee River, and is part of the greater metropolitan area of Auburn-Opelika. The town has a population of approximately 2,000 people, and is known for its rural charm and friendly atmosphere.
History
La Fayette was founded in 1832 by a group of settlers from Georgia. The town was named after the Marquis de La Fayette, a French military officer who fought in the American Revolutionary War. The town was originally a trading post, and the settlers built a grist mill and a cotton gin. The town grew slowly, and by the late 19th century, it had become a thriving agricultural center.
In the early 20th century, La Fayette began to experience a period of growth and development. The town was incorporated in 1909, and the first mayor was elected in 1910. The town was connected to the railroad in 1911, and the first bank was established in 1912. The town continued to grow, and by the mid-20th century, it had become a popular tourist destination.
Geography
La Fayette is located in Chambers County, Alabama, and is situated on the banks of the Chattahoochee River. The town is located approximately 30 miles south of Auburn, and is part of the greater metropolitan area of Auburn-Opelika. The town is surrounded by rolling hills and lush forests, and is home to several parks and recreational areas.
Economy
The economy of La Fayette is largely based on agriculture and tourism. The town is home to several farms, and the surrounding area is known for its production of cotton, corn, soybeans, and other crops. The town is also home to several small businesses, including restaurants, shops, and other services. Tourism is also an important part of the local economy, and the town is home to several popular attractions, including the La Fayette Museum and the La Fayette Country Club.
Demographics
As of the 2010 census, La Fayette had a population of 2,000 people. The racial makeup of the town was 79.2% White, 17.2% African American, 0.7% Native American, 0.3% Asian, and 2.6% from other races. The median household income was $31,250, and the median family income was $37,500. The per capita income was $17,845.
La Fayette is a small town with a rich history and a friendly atmosphere. The town is home to several farms and businesses, and is a popular tourist destination. The town is also home to a diverse population, and is a great place to live and work.
Common Questions
What is Per Capita Income in La Fayette?
Per Capita income in La Fayette is $22,150.
What is the Median Family Income in La Fayette?
Median Family Income in La Fayette is $43,958.
What is the Median Household income in La Fayette?
Median Household Income in La Fayette is $32,031.
What is Income or Wage Gap in La Fayette?
Income or Wage Gap in La Fayette is 40.1%.
Women in La Fayette earn 59.9 cents for every dollar earned by a man.
What is Family Income Deficit in La Fayette?
Family Income Deficit in La Fayette is $11,871.
Families that are below poverty line in La Fayette earn $11,871 less on average than the poverty threshold level.
What is Inequality or Gini Index in La Fayette?
Inequality or Gini Index in La Fayette is 0.45.
What is the Total Population of La Fayette?
Total Population of La Fayette is 2,700.
What is the Total Male Population of La Fayette?
Total Male Population of La Fayette is 1,454.
What is the Total Female Population of La Fayette?
Total Female Population of La Fayette is 1,246.
What is the Ratio of Males per 100 Females in La Fayette?
There are 116.69 Males per 100 Females in La Fayette.
What is the Ratio of Females per 100 Males in La Fayette?
There are 85.69 Females per 100 Males in La Fayette.
What is the Median Population Age in La Fayette?
Median Population Age in La Fayette is 48.4 Years.
What is the Average Family Size in La Fayette
Average Family Size in La Fayette is 2.8 People.
What is the Average Household Size in La Fayette
Average Household Size in La Fayette is 2.3 People.
How Large is the Labor Force in La Fayette?
There are 925 People in the Labor Forcein in La Fayette.
What is the Percentage of People in the Labor Force in La Fayette?
39.6% of People are in the Labor Force in La Fayette.
What is the Unemployment Rate in La Fayette?
Unemployment Rate in La Fayette is 3.7%.