Waverly, AL Map & Demographics
Waverly Map
Waverly Overview
$37,219
PER CAPITA INCOME
$58,750
AVG FAMILY INCOME
$65,417
AVG HOUSEHOLD INCOME
49.5%
WAGE / INCOME GAP [ % ]
50.5¢/ $1
WAGE / INCOME GAP [ $ ]
0.40
INEQUALITY / GINI INDEX
248
TOTAL POPULATION
134
MALE POPULATION
114
FEMALE POPULATION
117.54
MALES / 100 FEMALES
85.07
FEMALES / 100 MALES
57.2
MEDIAN AGE
2.6
AVG FAMILY SIZE
2.4
AVG HOUSEHOLD SIZE
119
LABOR FORCE [ PEOPLE ]
54.6%
PERCENT IN LABOR FORCE
1.7%
UNEMPLOYMENT RATE
Waverly Zip Codes
Waverly Area Codes
Income in Waverly
Income Overview in Waverly
Per Capita Income in Waverly is $37,219, while median incomes of families and households are $58,750 and $65,417 respectively.
| Characteristic | Number | Measure |
| Per Capita Income | 248 | $37,219 |
| Median Family Income | 78 | $58,750 |
| Mean Family Income | 78 | $71,838 |
| Median Household Income | 102 | $65,417 |
| Mean Household Income | 102 | $80,230 |
| Income Deficit | 78 | $0 |
| Wage / Income Gap (%) | 248 | 49.46% |
| Wage / Income Gap ($) | 248 | 50.54¢ per $1 |
| Gini / Inequality Index | 248 | 0.40 |
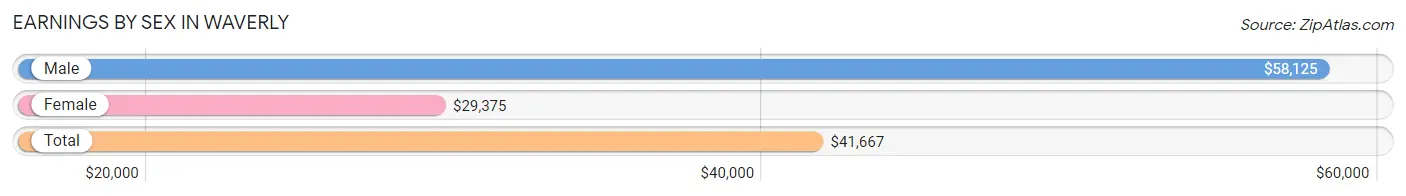
Earnings by Sex in Waverly
Average Earnings in Waverly are $41,667, $58,125 for men and $29,375 for women, a difference of 49.5%.
| Sex | Number | Average Earnings |
| Male | 75 (60.5%) | $58,125 |
| Female | 49 (39.5%) | $29,375 |
| Total | 124 (100.0%) | $41,667 |
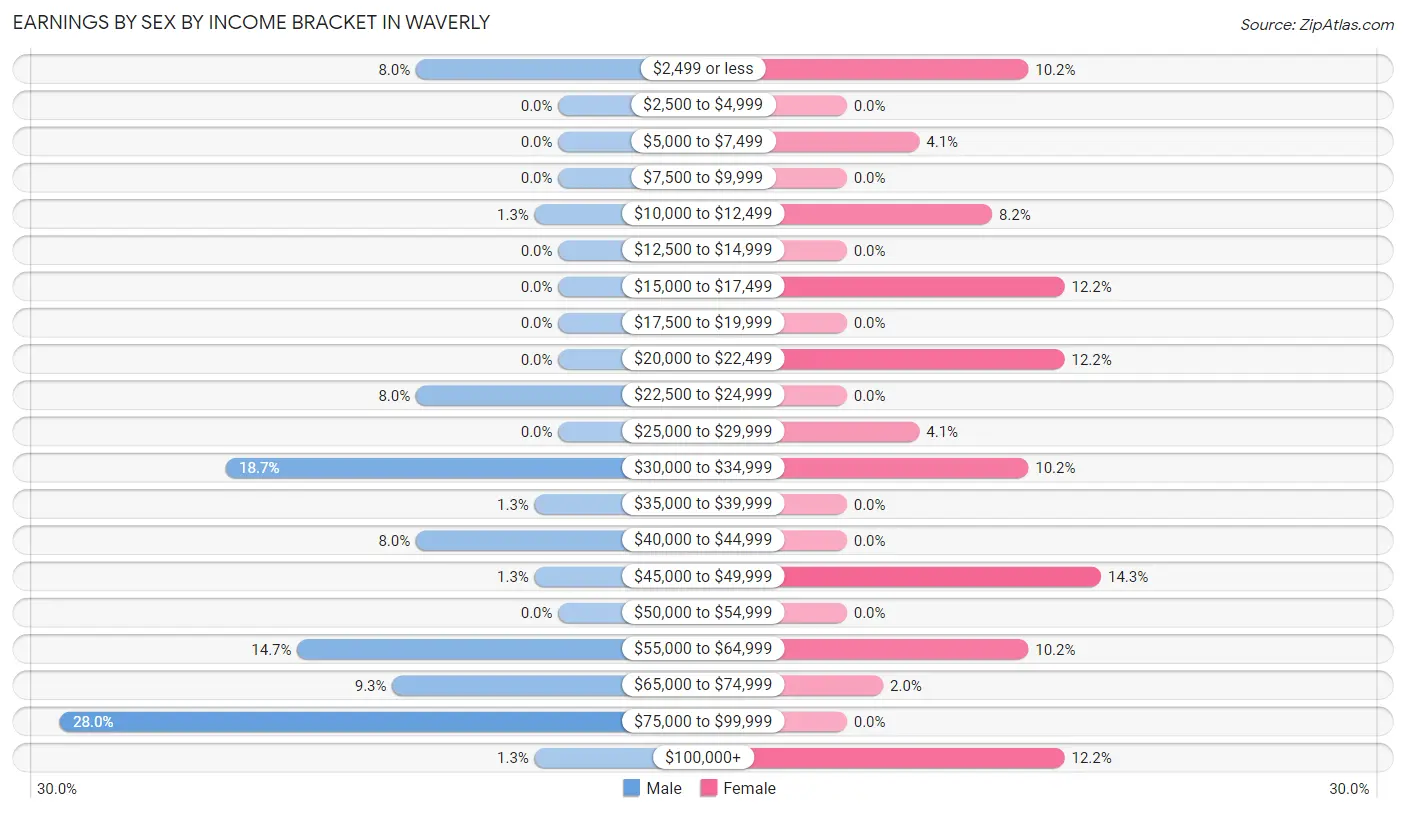
Earnings by Sex by Income Bracket in Waverly
The most common earnings brackets in Waverly are $75,000 to $99,999 for men (21 | 28.0%) and $45,000 to $49,999 for women (7 | 14.3%).
| Income | Male | Female |
| $2,499 or less | 6 (8.0%) | 5 (10.2%) |
| $2,500 to $4,999 | 0 (0.0%) | 0 (0.0%) |
| $5,000 to $7,499 | 0 (0.0%) | 2 (4.1%) |
| $7,500 to $9,999 | 0 (0.0%) | 0 (0.0%) |
| $10,000 to $12,499 | 1 (1.3%) | 4 (8.2%) |
| $12,500 to $14,999 | 0 (0.0%) | 0 (0.0%) |
| $15,000 to $17,499 | 0 (0.0%) | 6 (12.2%) |
| $17,500 to $19,999 | 0 (0.0%) | 0 (0.0%) |
| $20,000 to $22,499 | 0 (0.0%) | 6 (12.2%) |
| $22,500 to $24,999 | 6 (8.0%) | 0 (0.0%) |
| $25,000 to $29,999 | 0 (0.0%) | 2 (4.1%) |
| $30,000 to $34,999 | 14 (18.7%) | 5 (10.2%) |
| $35,000 to $39,999 | 1 (1.3%) | 0 (0.0%) |
| $40,000 to $44,999 | 6 (8.0%) | 0 (0.0%) |
| $45,000 to $49,999 | 1 (1.3%) | 7 (14.3%) |
| $50,000 to $54,999 | 0 (0.0%) | 0 (0.0%) |
| $55,000 to $64,999 | 11 (14.7%) | 5 (10.2%) |
| $65,000 to $74,999 | 7 (9.3%) | 1 (2.0%) |
| $75,000 to $99,999 | 21 (28.0%) | 0 (0.0%) |
| $100,000+ | 1 (1.3%) | 6 (12.2%) |
| Total | 75 (100.0%) | 49 (100.0%) |
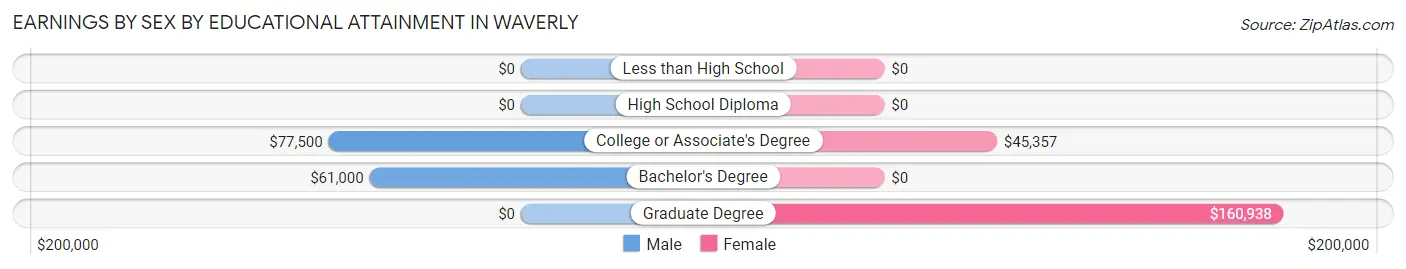
Earnings by Sex by Educational Attainment in Waverly
Average earnings in Waverly are $61,429 for men and $45,357 for women, a difference of 26.2%. Men with an educational attainment of college or associate's degree enjoy the highest average annual earnings of $77,500, while those with bachelor's degree education earn the least with $61,000. Women with an educational attainment of graduate degree earn the most with the average annual earnings of $160,938, while those with college or associate's degree education have the smallest earnings of $45,357.
| Educational Attainment | Male Income | Female Income |
| Less than High School | - | - |
| High School Diploma | - | - |
| College or Associate's Degree | $77,500 | $45,357 |
| Bachelor's Degree | $61,000 | $0 |
| Graduate Degree | - | - |
| Total | $61,429 | $45,357 |
Family Income in Waverly
Family Income Brackets in Waverly
According to the Waverly family income data, there are 21 families falling into the $100,000 to $149,999 income range, which is the most common income bracket and makes up 26.9% of all families.
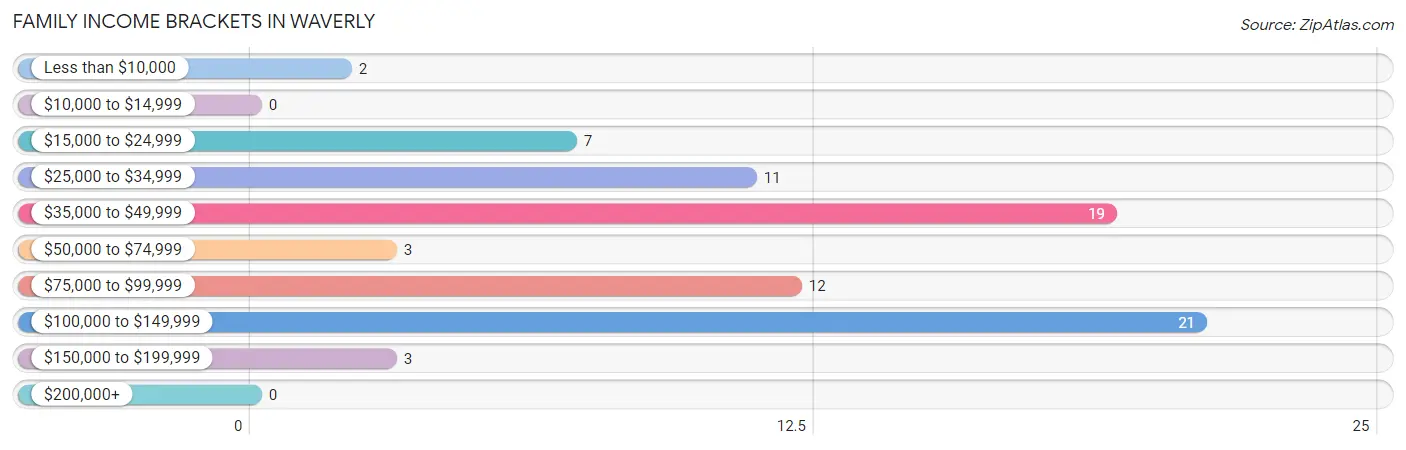
| Income Bracket | # Families | % Families |
| Less than $10,000 | 2 | 2.6% |
| $10,000 to $14,999 | 0 | 0.0% |
| $15,000 to $24,999 | 7 | 9.0% |
| $25,000 to $34,999 | 11 | 14.1% |
| $35,000 to $49,999 | 19 | 24.4% |
| $50,000 to $74,999 | 3 | 3.8% |
| $75,000 to $99,999 | 12 | 15.4% |
| $100,000 to $149,999 | 21 | 26.9% |
| $150,000 to $199,999 | 3 | 3.8% |
| $200,000+ | 0 | 0.0% |
Family Income by Famaliy Size in Waverly
3-person families (9 | 11.5%) account for the highest median family income in Waverly with $102,083 per family, while 3-person families (9 | 11.5%) have the highest median income of $34,028 per family member.
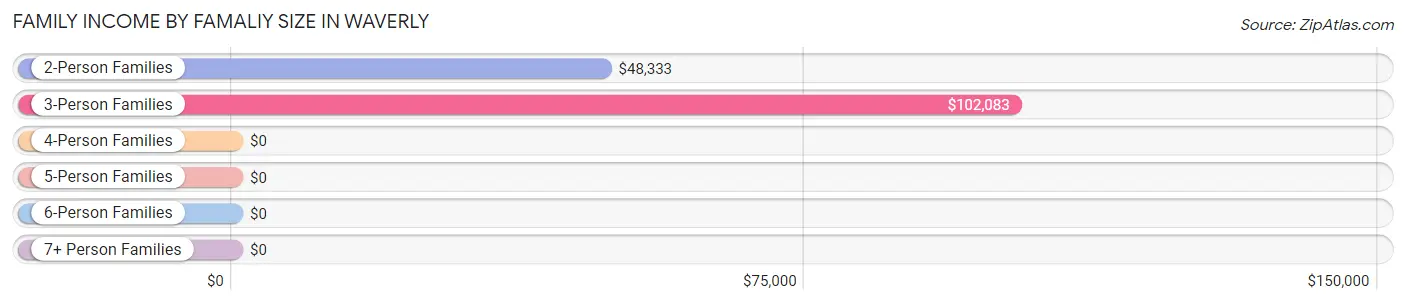
| Income Bracket | # Families | Median Income |
| 2-Person Families | 58 (74.4%) | $48,333 |
| 3-Person Families | 9 (11.5%) | $102,083 |
| 4-Person Families | 5 (6.4%) | $0 |
| 5-Person Families | 6 (7.7%) | $0 |
| 6-Person Families | 0 (0.0%) | $0 |
| 7+ Person Families | 0 (0.0%) | $0 |
| Total | 78 (100.0%) | $58,750 |
Family Income by Number of Earners in Waverly
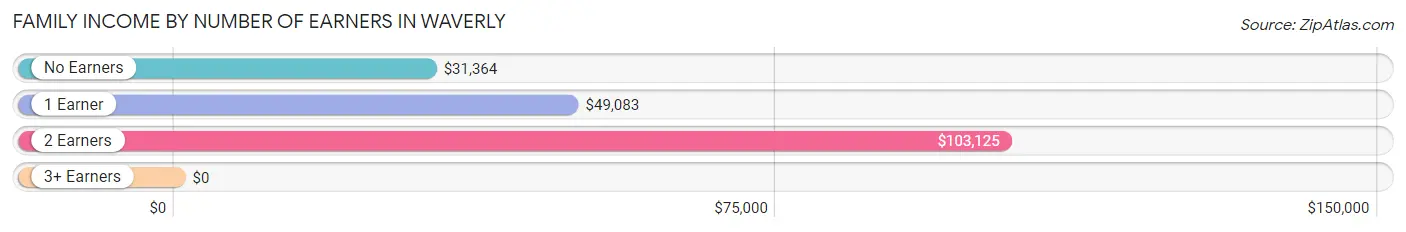
| Number of Earners | # Families | Median Income |
| No Earners | 26 (33.3%) | $31,364 |
| 1 Earner | 23 (29.5%) | $49,083 |
| 2 Earners | 25 (32.1%) | $103,125 |
| 3+ Earners | 4 (5.1%) | $0 |
| Total | 78 (100.0%) | $58,750 |
Household Income in Waverly
Household Income Brackets in Waverly
With 21 households falling in the category, the $100,000 to $149,999 income range is the most frequent in Waverly, accounting for 20.6% of all households. In contrast, only 1 households (1.0%) fall into the $10,000 to $14,999 income bracket, making it the least populous group.
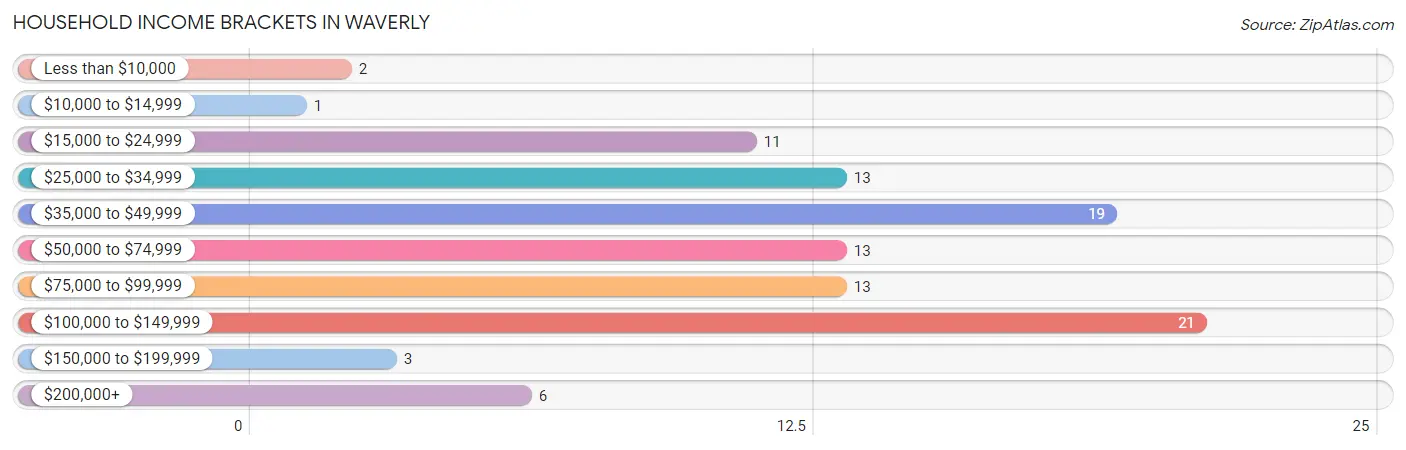
| Income Bracket | # Households | % Households |
| Less than $10,000 | 2 | 2.0% |
| $10,000 to $14,999 | 1 | 1.0% |
| $15,000 to $24,999 | 11 | 10.8% |
| $25,000 to $34,999 | 13 | 12.7% |
| $35,000 to $49,999 | 19 | 18.6% |
| $50,000 to $74,999 | 13 | 12.7% |
| $75,000 to $99,999 | 13 | 12.7% |
| $100,000 to $149,999 | 21 | 20.6% |
| $150,000 to $199,999 | 3 | 2.9% |
| $200,000+ | 6 | 5.9% |
Household Income by Householder Age in Waverly
The median household income in Waverly is $65,417, with the highest median household income of $128,250 found in the 45 to 64 years age bracket for the primary householder. A total of 31 households (30.4%) fall into this category. Meanwhile, the 15 to 24 years age bracket for the primary householder has the lowest median household income of $0, with 4 households (3.9%) in this group.
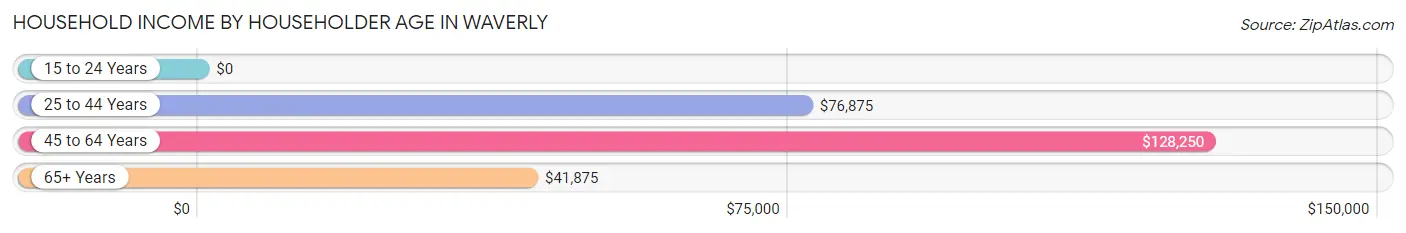
| Income Bracket | # Households | Median Income |
| 15 to 24 Years | 4 (3.9%) | $0 |
| 25 to 44 Years | 15 (14.7%) | $76,875 |
| 45 to 64 Years | 31 (30.4%) | $128,250 |
| 65+ Years | 52 (51.0%) | $41,875 |
| Total | 102 (100.0%) | $65,417 |
Poverty in Waverly
Income Below Poverty by Sex and Age in Waverly
With 0.7% poverty level for males and 5.3% for females among the residents of Waverly, 45 to 54 year old males and under 5 year old females are the most vulnerable to poverty, with 1 males (4.5%) and 2 females (100.0%) in their respective age groups living below the poverty level.
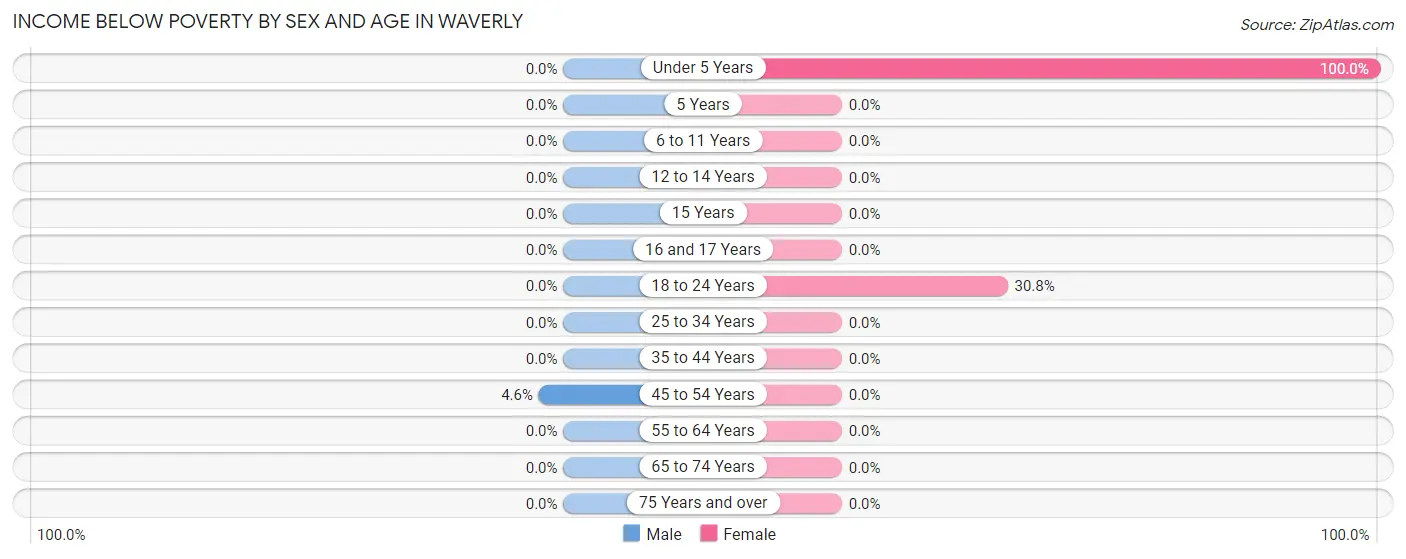
| Age Bracket | Male | Female |
| Under 5 Years | 0 (0.0%) | 2 (100.0%) |
| 5 Years | 0 (0.0%) | 0 (0.0%) |
| 6 to 11 Years | 0 (0.0%) | 0 (0.0%) |
| 12 to 14 Years | 0 (0.0%) | 0 (0.0%) |
| 15 Years | 0 (0.0%) | 0 (0.0%) |
| 16 and 17 Years | 0 (0.0%) | 0 (0.0%) |
| 18 to 24 Years | 0 (0.0%) | 4 (30.8%) |
| 25 to 34 Years | 0 (0.0%) | 0 (0.0%) |
| 35 to 44 Years | 0 (0.0%) | 0 (0.0%) |
| 45 to 54 Years | 1 (4.5%) | 0 (0.0%) |
| 55 to 64 Years | 0 (0.0%) | 0 (0.0%) |
| 65 to 74 Years | 0 (0.0%) | 0 (0.0%) |
| 75 Years and over | 0 (0.0%) | 0 (0.0%) |
| Total | 1 (0.7%) | 6 (5.3%) |
Income Above Poverty by Sex and Age in Waverly
According to the poverty statistics in Waverly, males aged under 5 years and females aged 6 to 11 years are the age groups that are most secure financially, with 100.0% of males and 100.0% of females in these age groups living above the poverty line.
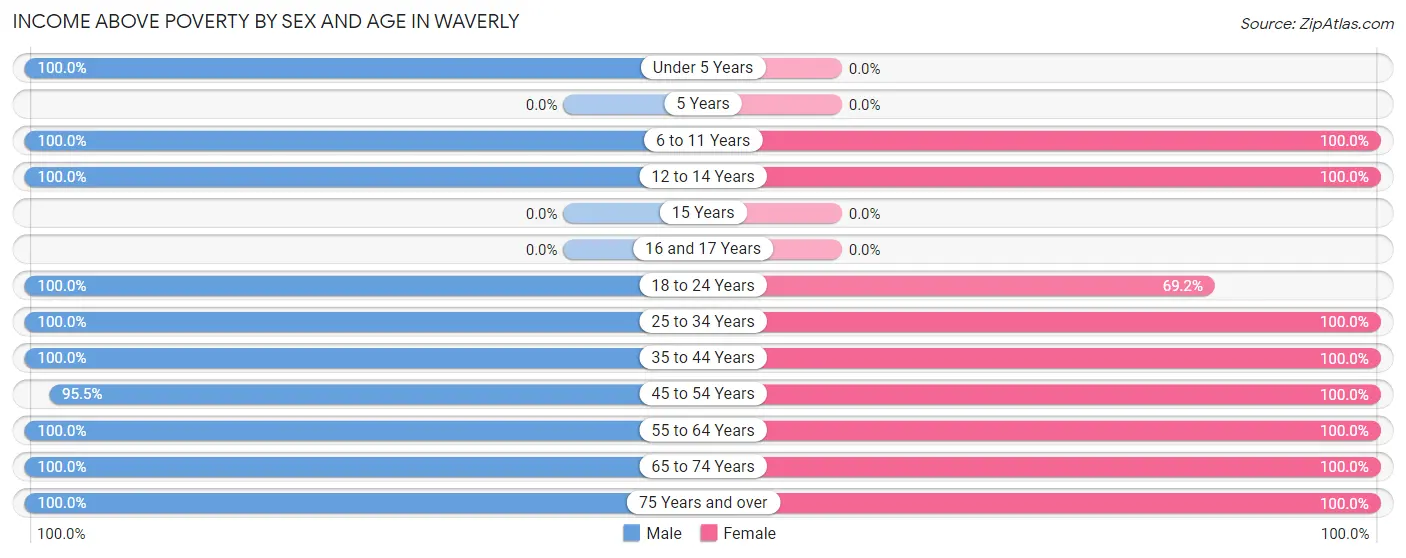
| Age Bracket | Male | Female |
| Under 5 Years | 3 (100.0%) | 0 (0.0%) |
| 5 Years | 0 (0.0%) | 0 (0.0%) |
| 6 to 11 Years | 18 (100.0%) | 2 (100.0%) |
| 12 to 14 Years | 1 (100.0%) | 4 (100.0%) |
| 15 Years | 0 (0.0%) | 0 (0.0%) |
| 16 and 17 Years | 0 (0.0%) | 0 (0.0%) |
| 18 to 24 Years | 11 (100.0%) | 9 (69.2%) |
| 25 to 34 Years | 2 (100.0%) | 5 (100.0%) |
| 35 to 44 Years | 6 (100.0%) | 12 (100.0%) |
| 45 to 54 Years | 21 (95.5%) | 9 (100.0%) |
| 55 to 64 Years | 13 (100.0%) | 22 (100.0%) |
| 65 to 74 Years | 44 (100.0%) | 34 (100.0%) |
| 75 Years and over | 14 (100.0%) | 11 (100.0%) |
| Total | 133 (99.3%) | 108 (94.7%) |
Income Below Poverty Among Married-Couple Families in Waverly
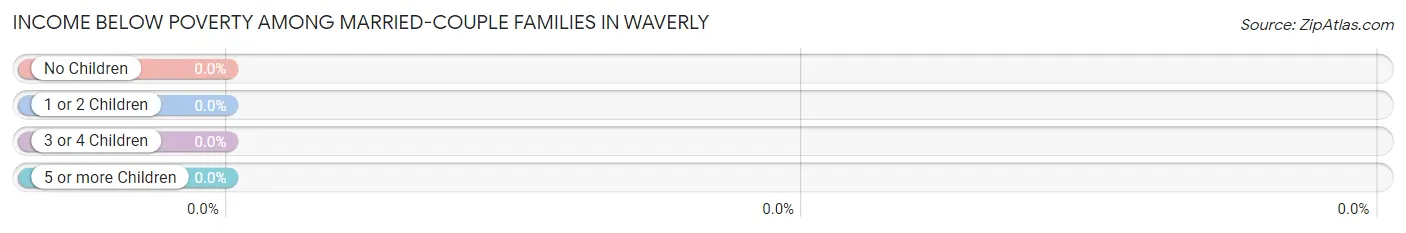
| Children | Above Poverty | Below Poverty |
| No Children | 60 (100.0%) | 0 (0.0%) |
| 1 or 2 Children | 9 (100.0%) | 0 (0.0%) |
| 3 or 4 Children | 6 (100.0%) | 0 (0.0%) |
| 5 or more Children | 0 (0.0%) | 0 (0.0%) |
| Total | 75 (100.0%) | 0 (0.0%) |
Income Below Poverty Among Single-Parent Households in Waverly
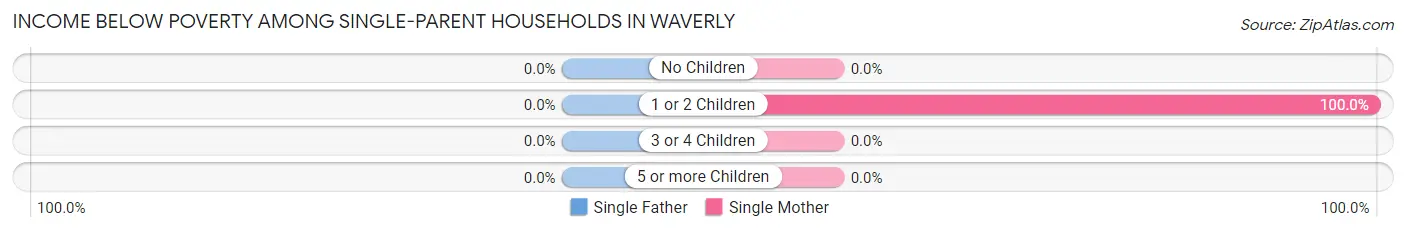
| Children | Single Father | Single Mother |
| No Children | 0 (0.0%) | 0 (0.0%) |
| 1 or 2 Children | 0 (0.0%) | 2 (100.0%) |
| 3 or 4 Children | 0 (0.0%) | 0 (0.0%) |
| 5 or more Children | 0 (0.0%) | 0 (0.0%) |
| Total | 0 (0.0%) | 2 (100.0%) |
Income Below Poverty Among Married-Couple vs Single-Parent Households in Waverly
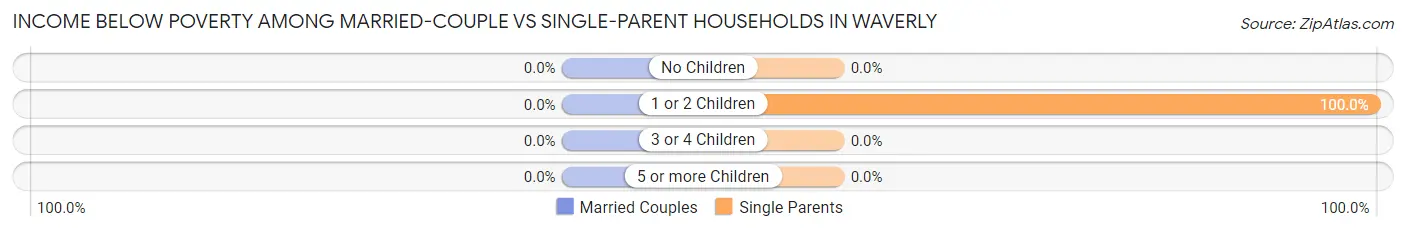
| Children | Married-Couple Families | Single-Parent Households |
| No Children | 0 (0.0%) | 0 (0.0%) |
| 1 or 2 Children | 0 (0.0%) | 2 (100.0%) |
| 3 or 4 Children | 0 (0.0%) | 0 (0.0%) |
| 5 or more Children | 0 (0.0%) | 0 (0.0%) |
| Total | 0 (0.0%) | 2 (66.7%) |
Race in Waverly
The most populous races in Waverly are White / Caucasian (244 | 98.4%), and Two or more Races (4 | 1.6%).
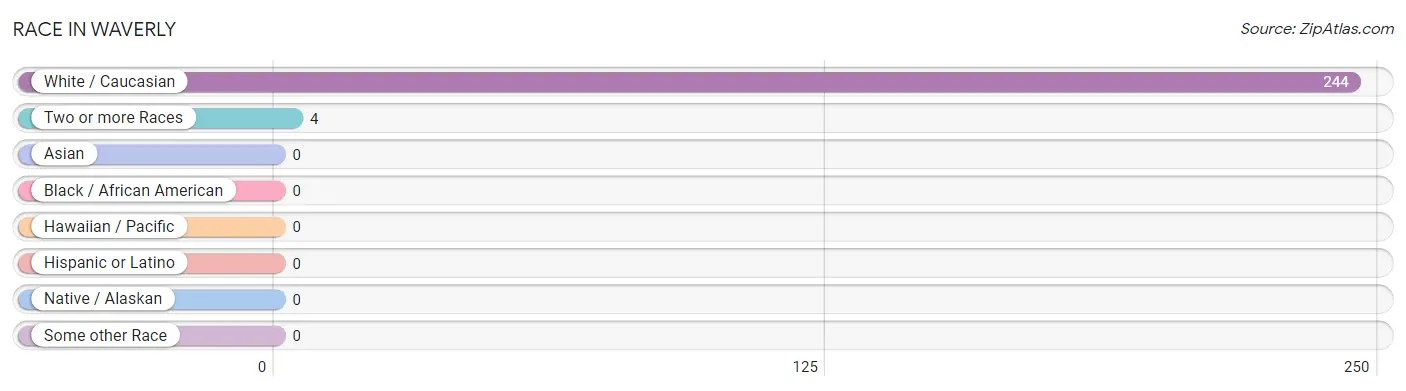
| Race | # Population | % Population |
| Asian | 0 | 0.0% |
| Black / African American | 0 | 0.0% |
| Hawaiian / Pacific | 0 | 0.0% |
| Hispanic or Latino | 0 | 0.0% |
| Native / Alaskan | 0 | 0.0% |
| White / Caucasian | 244 | 98.4% |
| Two or more Races | 4 | 1.6% |
| Some other Race | 0 | 0.0% |
| Total | 248 | 100.0% |
Ancestry in Waverly
The most populous ancestries reported in Waverly are English (49 | 19.8%), American (38 | 15.3%), European (22 | 8.9%), Irish (20 | 8.1%), and German (16 | 6.5%), together accounting for 58.5% of all Waverly residents.
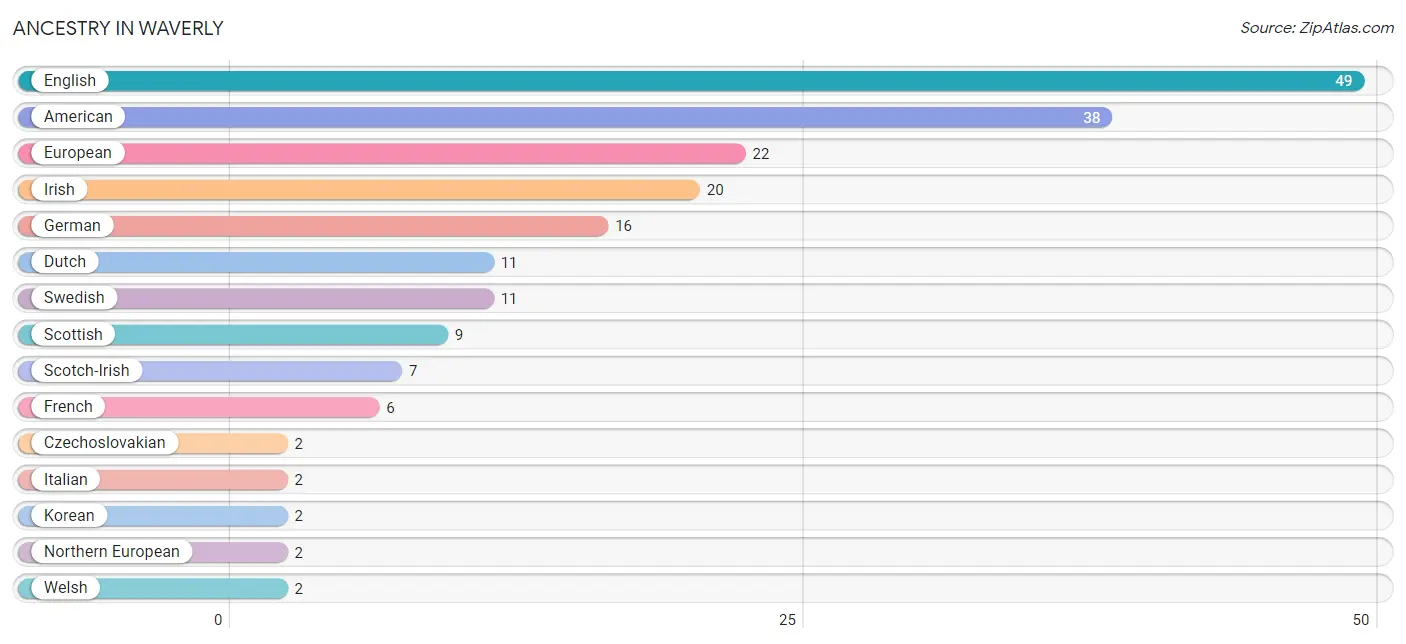
| Ancestry | # Population | % Population |
| American | 38 | 15.3% |
| Czechoslovakian | 2 | 0.8% |
| Dutch | 11 | 4.4% |
| English | 49 | 19.8% |
| European | 22 | 8.9% |
| French | 6 | 2.4% |
| German | 16 | 6.5% |
| Irish | 20 | 8.1% |
| Italian | 2 | 0.8% |
| Korean | 2 | 0.8% |
| Northern European | 2 | 0.8% |
| Scotch-Irish | 7 | 2.8% |
| Scottish | 9 | 3.6% |
| Swedish | 11 | 4.4% |
| Welsh | 2 | 0.8% | View All 15 Rows |
Immigrants in Waverly

| Immigration Origin | # Population | % Population | View All 0 Rows |
Sex and Age in Waverly
Sex and Age in Waverly
The most populous age groups in Waverly are 65 to 69 Years (25 | 18.7%) for men and 65 to 69 Years (22 | 19.3%) for women.
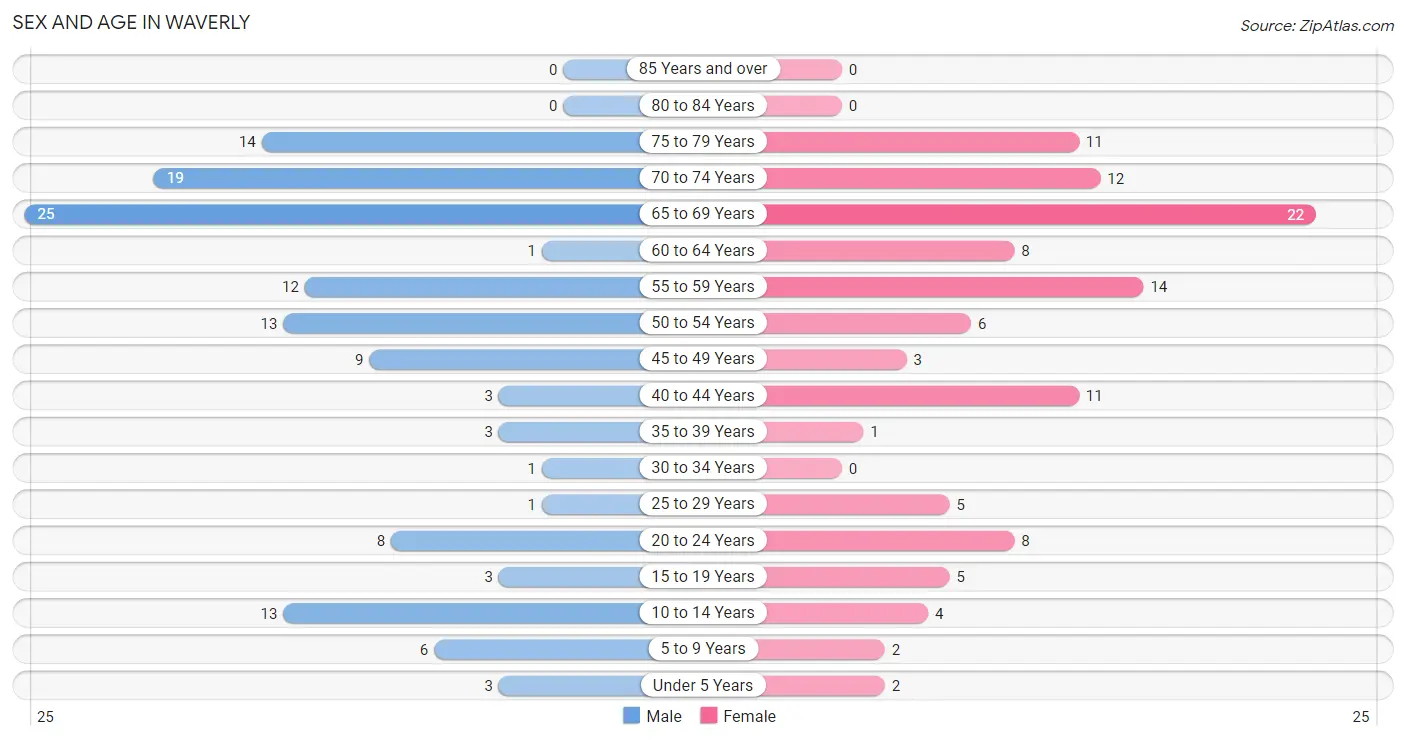
| Age Bracket | Male | Female |
| Under 5 Years | 3 (2.2%) | 2 (1.8%) |
| 5 to 9 Years | 6 (4.5%) | 2 (1.8%) |
| 10 to 14 Years | 13 (9.7%) | 4 (3.5%) |
| 15 to 19 Years | 3 (2.2%) | 5 (4.4%) |
| 20 to 24 Years | 8 (6.0%) | 8 (7.0%) |
| 25 to 29 Years | 1 (0.7%) | 5 (4.4%) |
| 30 to 34 Years | 1 (0.7%) | 0 (0.0%) |
| 35 to 39 Years | 3 (2.2%) | 1 (0.9%) |
| 40 to 44 Years | 3 (2.2%) | 11 (9.7%) |
| 45 to 49 Years | 9 (6.7%) | 3 (2.6%) |
| 50 to 54 Years | 13 (9.7%) | 6 (5.3%) |
| 55 to 59 Years | 12 (9.0%) | 14 (12.3%) |
| 60 to 64 Years | 1 (0.7%) | 8 (7.0%) |
| 65 to 69 Years | 25 (18.7%) | 22 (19.3%) |
| 70 to 74 Years | 19 (14.2%) | 12 (10.5%) |
| 75 to 79 Years | 14 (10.4%) | 11 (9.7%) |
| 80 to 84 Years | 0 (0.0%) | 0 (0.0%) |
| 85 Years and over | 0 (0.0%) | 0 (0.0%) |
| Total | 134 (100.0%) | 114 (100.0%) |
Families and Households in Waverly
Median Family Size in Waverly
The median family size in Waverly is 2.64 persons per family, with married-couple families (75 | 96.2%) accounting for the largest median family size of 2.67 persons per family. On the other hand, single male/father families (1 | 1.3%) represent the smallest median family size with 2.00 persons per family.
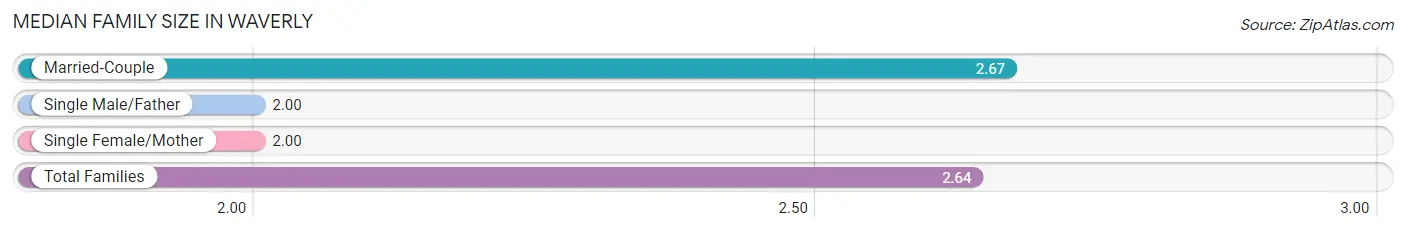
| Family Type | # Families | Family Size |
| Married-Couple | 75 (96.2%) | 2.67 |
| Single Male/Father | 1 (1.3%) | 2.00 |
| Single Female/Mother | 2 (2.6%) | 2.00 |
| Total Families | 78 (100.0%) | 2.64 |
Median Household Size in Waverly
The median household size in Waverly is 2.43 persons per household, with married-couple households (75 | 73.5%) accounting for the largest median household size of 2.77 persons per household. non-family households (24 | 23.5%) represent the smallest median household size with 1.42 persons per household.
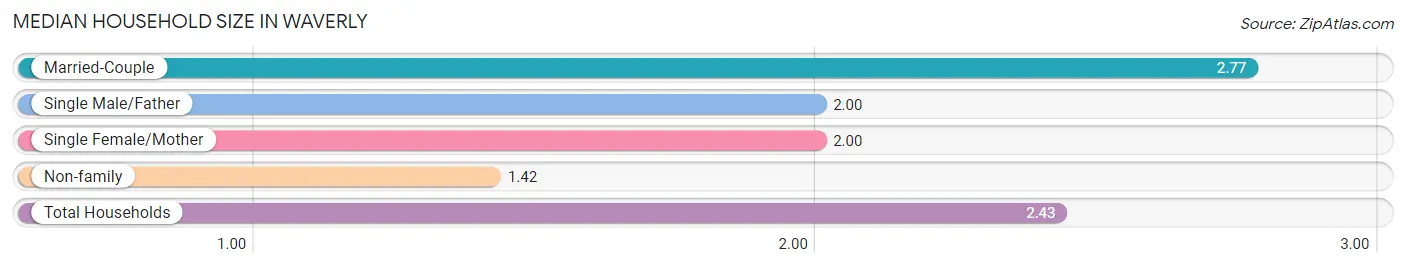
| Household Type | # Households | Household Size |
| Married-Couple | 75 (73.5%) | 2.77 |
| Single Male/Father | 1 (1.0%) | 2.00 |
| Single Female/Mother | 2 (2.0%) | 2.00 |
| Non-family | 24 (23.5%) | 1.42 |
| Total Households | 102 (100.0%) | 2.43 |
Household Size by Marriage Status in Waverly
Out of a total of 102 households in Waverly, 78 (76.5%) are family households, while 24 (23.5%) are nonfamily households. The most numerous type of family households are 2-person households, comprising 56, and the most common type of nonfamily households are 1-person households, comprising 16.
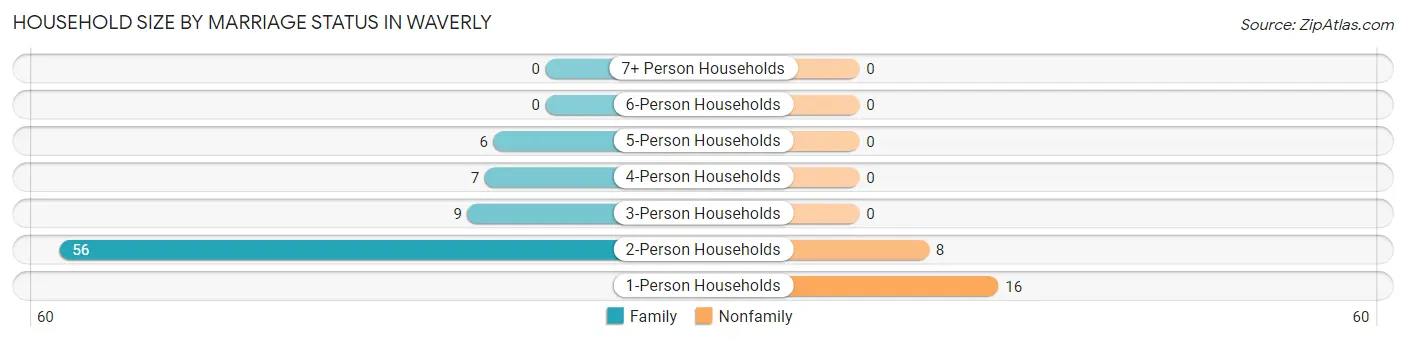
| Household Size | Family Households | Nonfamily Households |
| 1-Person Households | - | 16 (15.7%) |
| 2-Person Households | 56 (54.9%) | 8 (7.8%) |
| 3-Person Households | 9 (8.8%) | 0 (0.0%) |
| 4-Person Households | 7 (6.9%) | 0 (0.0%) |
| 5-Person Households | 6 (5.9%) | 0 (0.0%) |
| 6-Person Households | 0 (0.0%) | 0 (0.0%) |
| 7+ Person Households | 0 (0.0%) | 0 (0.0%) |
| Total | 78 (76.5%) | 24 (23.5%) |
Female Fertility in Waverly
Fertility by Age in Waverly
Average fertility rate in Waverly is 30.0 births per 1,000 women. Women in the age bracket of 20 to 34 years have the highest fertility rate with 77.0 births per 1,000 women. Women in the age bracket of 20 to 34 years acount for 100.0% of all women with births.
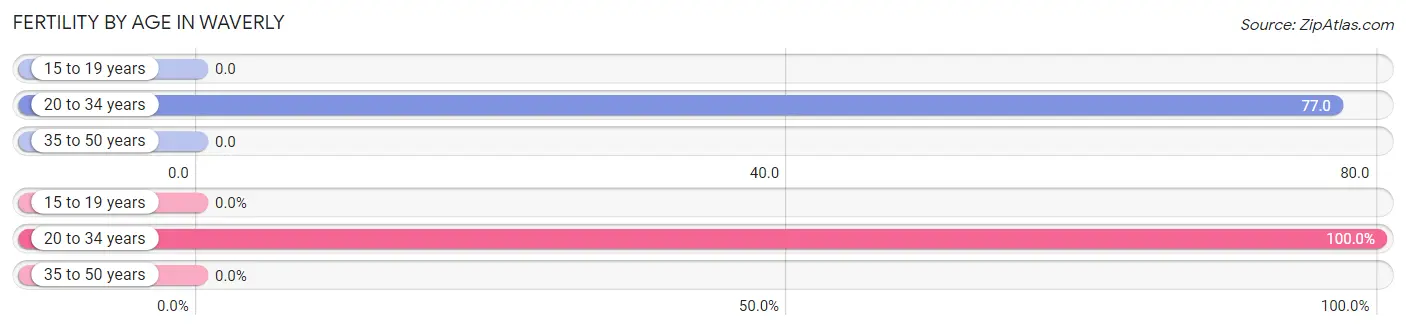
| Age Bracket | Women with Births | Births / 1,000 Women |
| 15 to 19 years | 0 (0.0%) | 0.0 |
| 20 to 34 years | 1 (100.0%) | 77.0 |
| 35 to 50 years | 0 (0.0%) | 0.0 |
| Total | 1 (100.0%) | 30.0 |
Fertility by Age by Marriage Status in Waverly
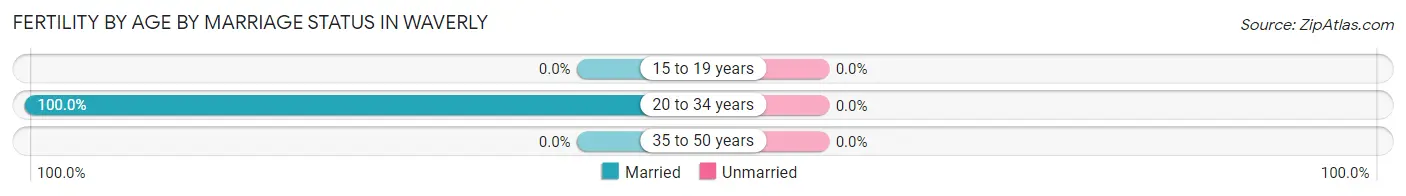
| Age Bracket | Married | Unmarried |
| 15 to 19 years | 0 (0.0%) | 0 (0.0%) |
| 20 to 34 years | 1 (100.0%) | 0 (0.0%) |
| 35 to 50 years | 0 (0.0%) | 0 (0.0%) |
| Total | 1 (100.0%) | 0 (0.0%) |
Fertility by Education in Waverly
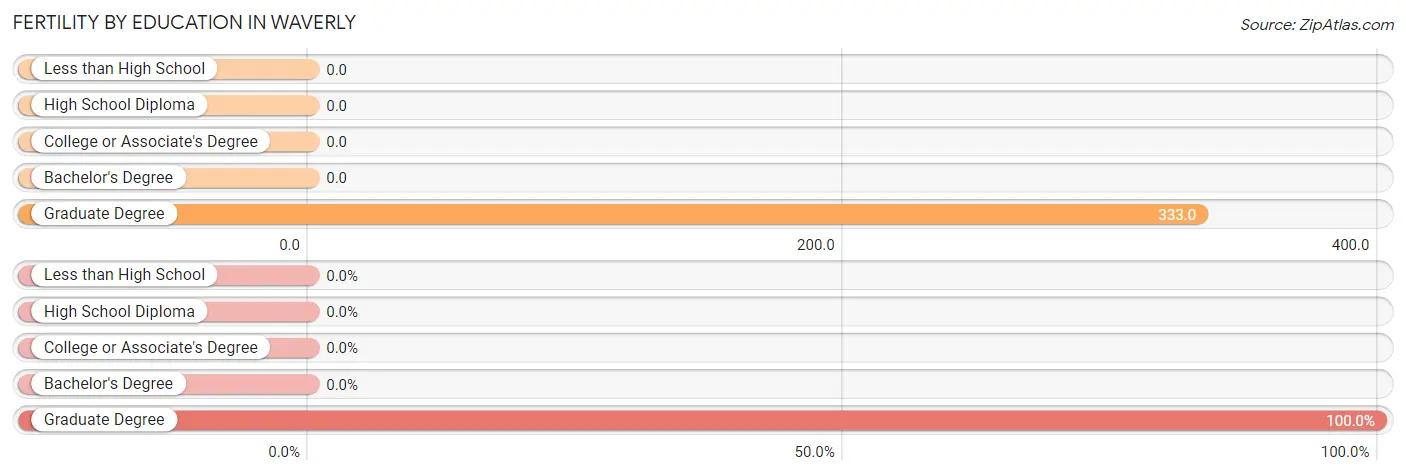
| Educational Attainment | Women with Births | Births / 1,000 Women |
| Less than High School | 0 (0.0%) | 0.0 |
| High School Diploma | 0 (0.0%) | 0.0 |
| College or Associate's Degree | 0 (0.0%) | 0.0 |
| Bachelor's Degree | 0 (0.0%) | 0.0 |
| Graduate Degree | 1 (100.0%) | 333.0 |
| Total | 1 (100.0%) | 30.0 |
Fertility by Education by Marriage Status in Waverly
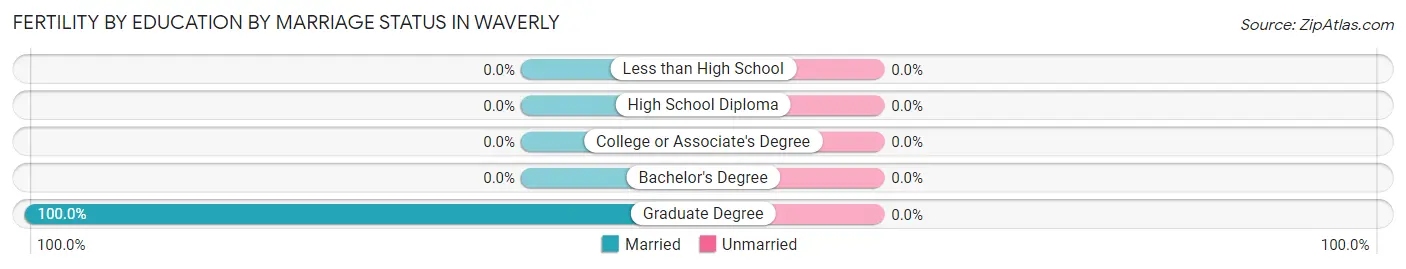
| Educational Attainment | Married | Unmarried |
| Less than High School | 0 (0.0%) | 0 (0.0%) |
| High School Diploma | 0 (0.0%) | 0 (0.0%) |
| College or Associate's Degree | 0 (0.0%) | 0 (0.0%) |
| Bachelor's Degree | 0 (0.0%) | 0 (0.0%) |
| Graduate Degree | 1 (100.0%) | 0 (0.0%) |
| Total | 1 (100.0%) | 0 (0.0%) |
Employment Characteristics in Waverly
Employment by Class of Employer in Waverly
Among the 117 employed individuals in Waverly, private company employees (77 | 65.8%), state government employees (17 | 14.5%), and not-for-profit organizations (10 | 8.6%) make up the most common classes of employment.
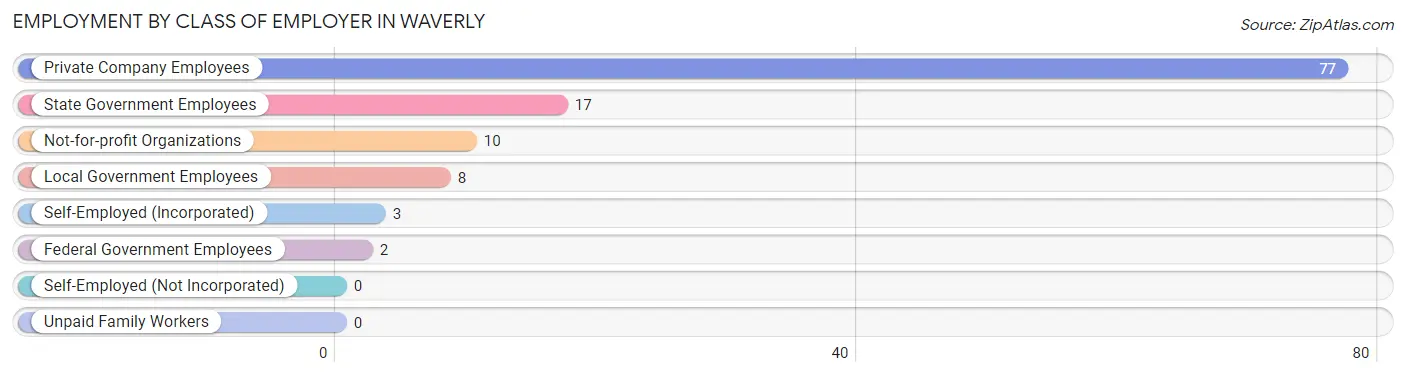
| Employer Class | # Employees | % Employees |
| Private Company Employees | 77 | 65.8% |
| Self-Employed (Incorporated) | 3 | 2.6% |
| Self-Employed (Not Incorporated) | 0 | 0.0% |
| Not-for-profit Organizations | 10 | 8.6% |
| Local Government Employees | 8 | 6.8% |
| State Government Employees | 17 | 14.5% |
| Federal Government Employees | 2 | 1.7% |
| Unpaid Family Workers | 0 | 0.0% |
| Total | 117 | 100.0% |
Employment Status by Age in Waverly
According to the labor force statistics for Waverly, out of the total population over 16 years of age (218), 54.6% or 119 individuals are in the labor force, with 1.7% or 2 of them unemployed. The age group with the highest labor force participation rate is 20 to 24 years, with 100.0% or 16 individuals in the labor force. Within the labor force, the 20 to 24 years age range has the highest percentage of unemployed individuals, with 12.5% or 2 of them being unemployed.
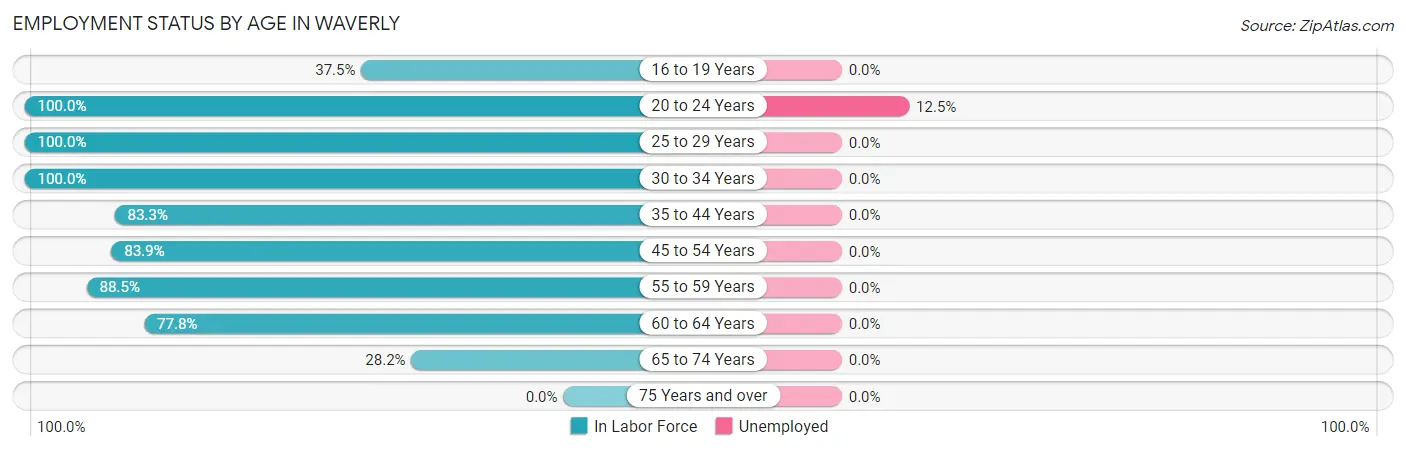
| Age Bracket | In Labor Force | Unemployed |
| 16 to 19 Years | 3 (37.5%) | 0 (0.0%) |
| 20 to 24 Years | 16 (100.0%) | 2 (12.5%) |
| 25 to 29 Years | 6 (100.0%) | 0 (0.0%) |
| 30 to 34 Years | 1 (100.0%) | 0 (0.0%) |
| 35 to 44 Years | 15 (83.3%) | 0 (0.0%) |
| 45 to 54 Years | 26 (83.9%) | 0 (0.0%) |
| 55 to 59 Years | 23 (88.5%) | 0 (0.0%) |
| 60 to 64 Years | 7 (77.8%) | 0 (0.0%) |
| 65 to 74 Years | 22 (28.2%) | 0 (0.0%) |
| 75 Years and over | 0 (0.0%) | 0 (0.0%) |
| Total | 119 (54.6%) | 2 (1.7%) |
Employment Status by Educational Attainment in Waverly
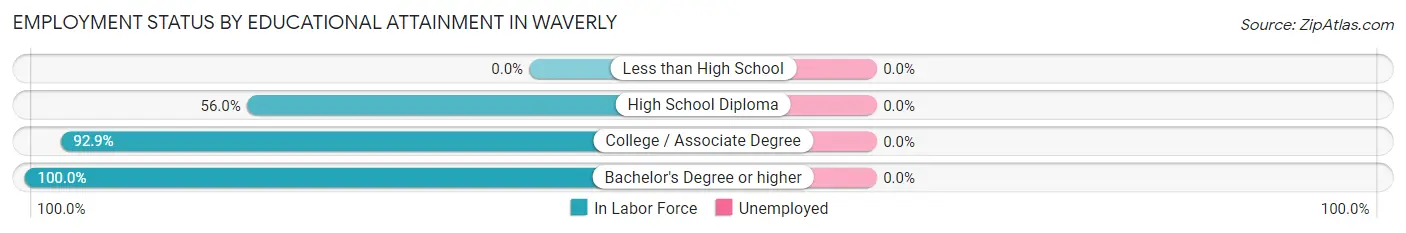
| Educational Attainment | In Labor Force | Unemployed |
| Less than High School | 0 (0.0%) | 0 (0.0%) |
| High School Diploma | 14 (56.0%) | 0 (0.0%) |
| College / Associate Degree | 26 (92.9%) | 0 (0.0%) |
| Bachelor's Degree or higher | 38 (100.0%) | 0 (0.0%) |
| Total | 78 (85.7%) | 0 (0.0%) |
Employment Occupations by Sex in Waverly
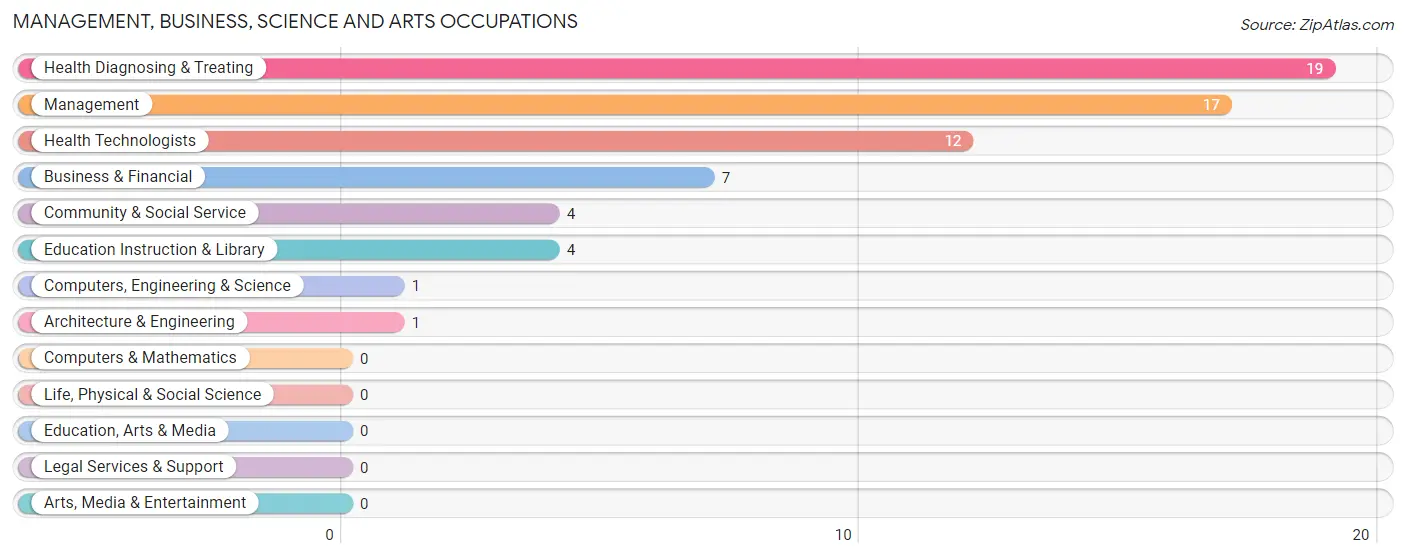
Management, Business, Science and Arts Occupations
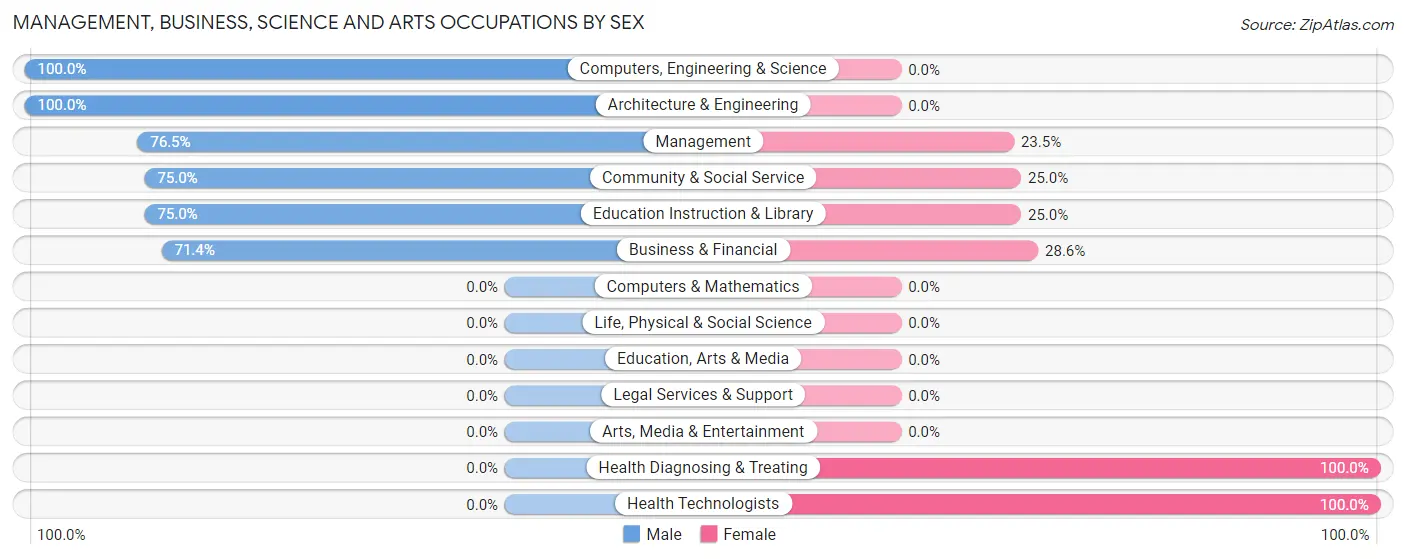
The most common Management, Business, Science and Arts occupations in Waverly are Health Diagnosing & Treating (19 | 16.2%), Management (17 | 14.5%), Health Technologists (12 | 10.3%), Business & Financial (7 | 6.0%), and Community & Social Service (4 | 3.4%).
Management, Business, Science and Arts Occupations by Sex
Within the Management, Business, Science and Arts occupations in Waverly, the most male-oriented occupations are Computers, Engineering & Science (100.0%), Architecture & Engineering (100.0%), and Management (76.5%), while the most female-oriented occupations are Health Diagnosing & Treating (100.0%), Health Technologists (100.0%), and Business & Financial (28.6%).
| Occupation | Male | Female |
| Management | 13 (76.5%) | 4 (23.5%) |
| Business & Financial | 5 (71.4%) | 2 (28.6%) |
| Computers, Engineering & Science | 1 (100.0%) | 0 (0.0%) |
| Computers & Mathematics | 0 (0.0%) | 0 (0.0%) |
| Architecture & Engineering | 1 (100.0%) | 0 (0.0%) |
| Life, Physical & Social Science | 0 (0.0%) | 0 (0.0%) |
| Community & Social Service | 3 (75.0%) | 1 (25.0%) |
| Education, Arts & Media | 0 (0.0%) | 0 (0.0%) |
| Legal Services & Support | 0 (0.0%) | 0 (0.0%) |
| Education Instruction & Library | 3 (75.0%) | 1 (25.0%) |
| Arts, Media & Entertainment | 0 (0.0%) | 0 (0.0%) |
| Health Diagnosing & Treating | 0 (0.0%) | 19 (100.0%) |
| Health Technologists | 0 (0.0%) | 12 (100.0%) |
| Total (Category) | 22 (45.8%) | 26 (54.2%) |
| Total (Overall) | 72 (61.5%) | 45 (38.5%) |
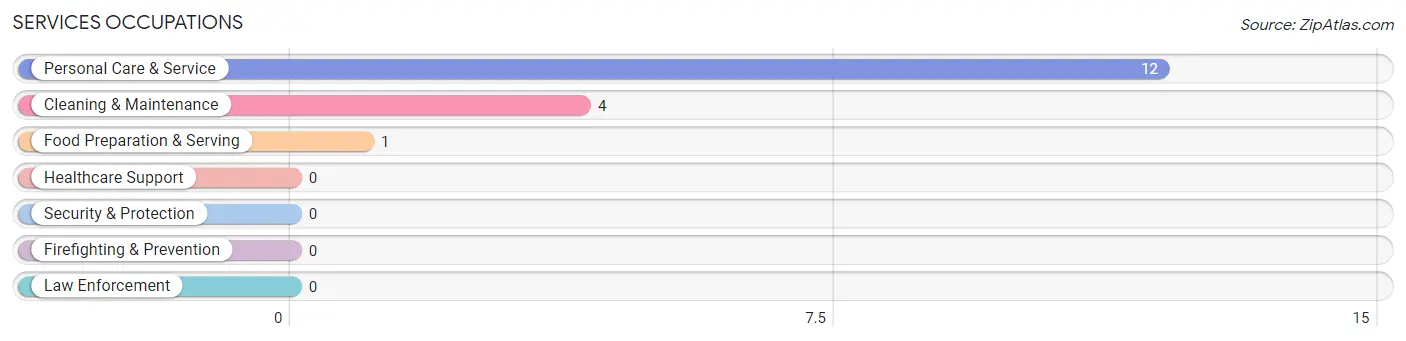
Services Occupations
The most common Services occupations in Waverly are Personal Care & Service (12 | 10.3%), Cleaning & Maintenance (4 | 3.4%), and Food Preparation & Serving (1 | 0.9%).
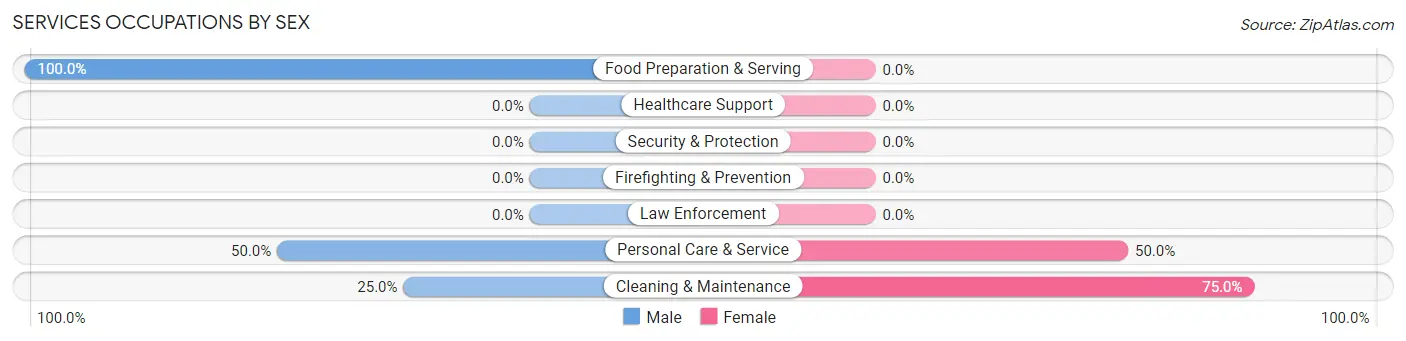
Services Occupations by Sex
Within the Services occupations in Waverly, the most male-oriented occupations are Food Preparation & Serving (100.0%), Personal Care & Service (50.0%), and Cleaning & Maintenance (25.0%), while the most female-oriented occupations are Cleaning & Maintenance (75.0%), and Personal Care & Service (50.0%).
| Occupation | Male | Female |
| Healthcare Support | 0 (0.0%) | 0 (0.0%) |
| Security & Protection | 0 (0.0%) | 0 (0.0%) |
| Firefighting & Prevention | 0 (0.0%) | 0 (0.0%) |
| Law Enforcement | 0 (0.0%) | 0 (0.0%) |
| Food Preparation & Serving | 1 (100.0%) | 0 (0.0%) |
| Cleaning & Maintenance | 1 (25.0%) | 3 (75.0%) |
| Personal Care & Service | 6 (50.0%) | 6 (50.0%) |
| Total (Category) | 8 (47.1%) | 9 (52.9%) |
| Total (Overall) | 72 (61.5%) | 45 (38.5%) |
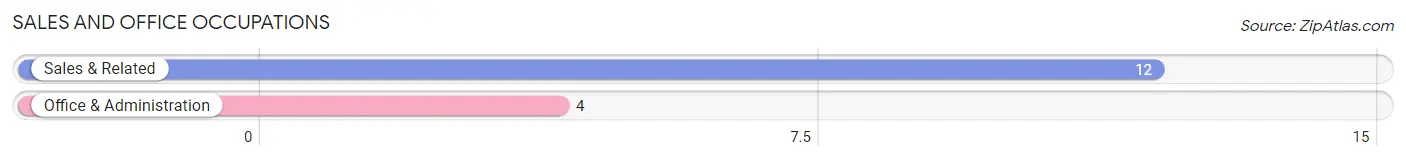
Sales and Office Occupations
The most common Sales and Office occupations in Waverly are Sales & Related (12 | 10.3%), and Office & Administration (4 | 3.4%).
Sales and Office Occupations by Sex
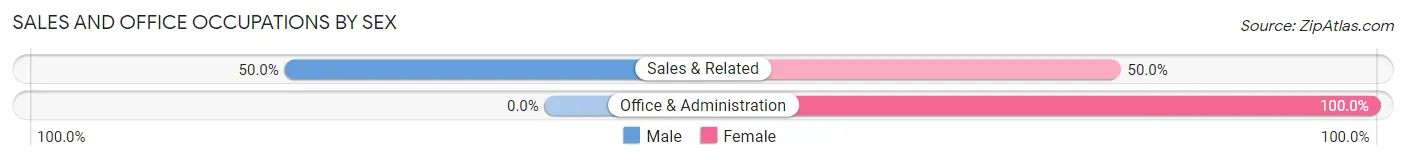
| Occupation | Male | Female |
| Sales & Related | 6 (50.0%) | 6 (50.0%) |
| Office & Administration | 0 (0.0%) | 4 (100.0%) |
| Total (Category) | 6 (37.5%) | 10 (62.5%) |
| Total (Overall) | 72 (61.5%) | 45 (38.5%) |
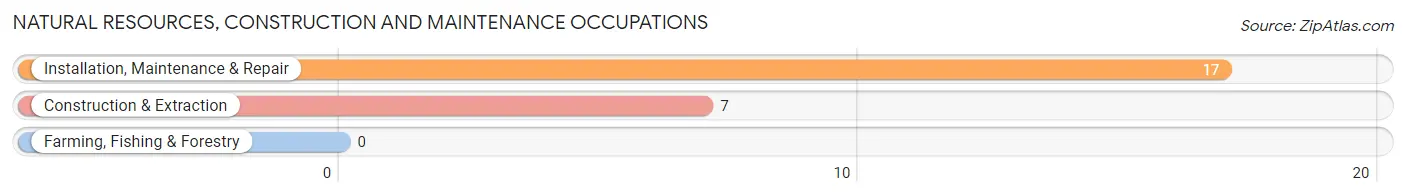
Natural Resources, Construction and Maintenance Occupations
The most common Natural Resources, Construction and Maintenance occupations in Waverly are Installation, Maintenance & Repair (17 | 14.5%), and Construction & Extraction (7 | 6.0%).
Natural Resources, Construction and Maintenance Occupations by Sex
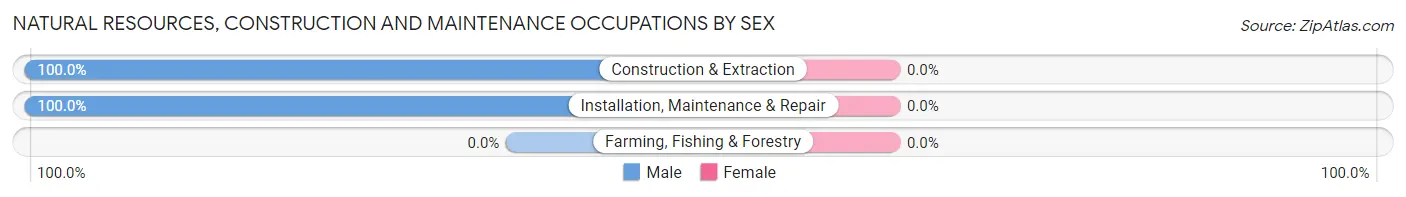
| Occupation | Male | Female |
| Farming, Fishing & Forestry | 0 (0.0%) | 0 (0.0%) |
| Construction & Extraction | 7 (100.0%) | 0 (0.0%) |
| Installation, Maintenance & Repair | 17 (100.0%) | 0 (0.0%) |
| Total (Category) | 24 (100.0%) | 0 (0.0%) |
| Total (Overall) | 72 (61.5%) | 45 (38.5%) |
Production, Transportation and Moving Occupations
The most common Production, Transportation and Moving occupations in Waverly are Transportation (10 | 8.6%), and Production (2 | 1.7%).
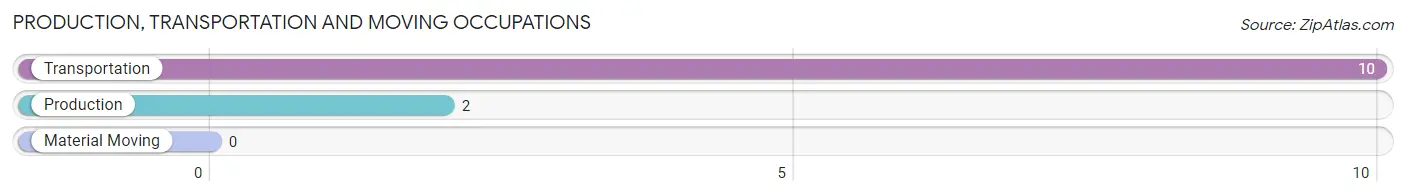
Production, Transportation and Moving Occupations by Sex
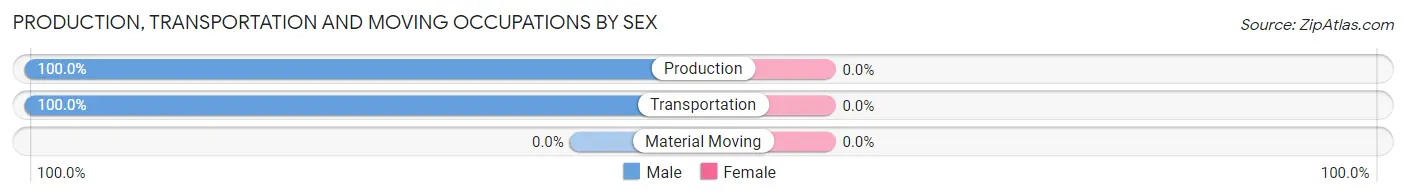
| Occupation | Male | Female |
| Production | 2 (100.0%) | 0 (0.0%) |
| Transportation | 10 (100.0%) | 0 (0.0%) |
| Material Moving | 0 (0.0%) | 0 (0.0%) |
| Total (Category) | 12 (100.0%) | 0 (0.0%) |
| Total (Overall) | 72 (61.5%) | 45 (38.5%) |
Employment Industries by Sex in Waverly
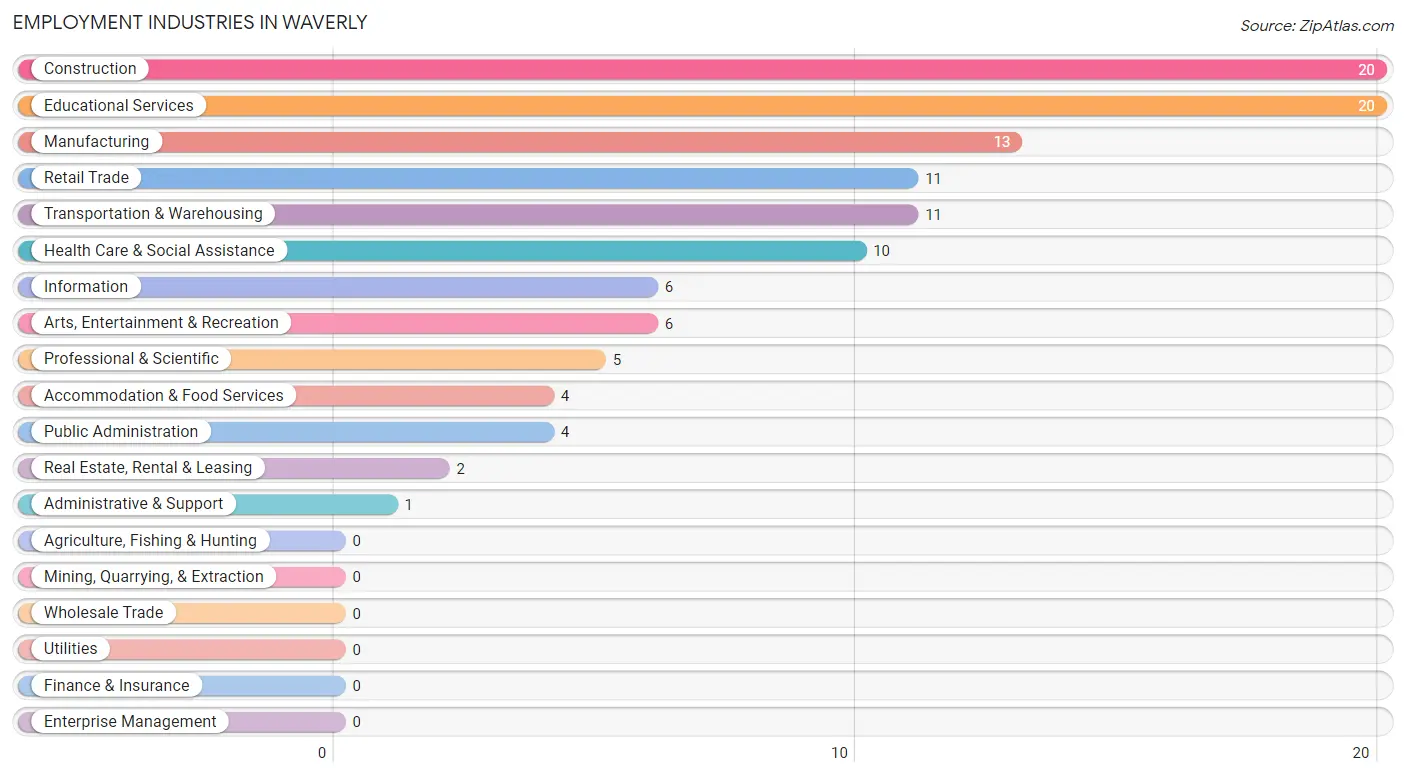
Employment Industries in Waverly
The major employment industries in Waverly include Construction (20 | 17.1%), Educational Services (20 | 17.1%), Manufacturing (13 | 11.1%), Retail Trade (11 | 9.4%), and Transportation & Warehousing (11 | 9.4%).
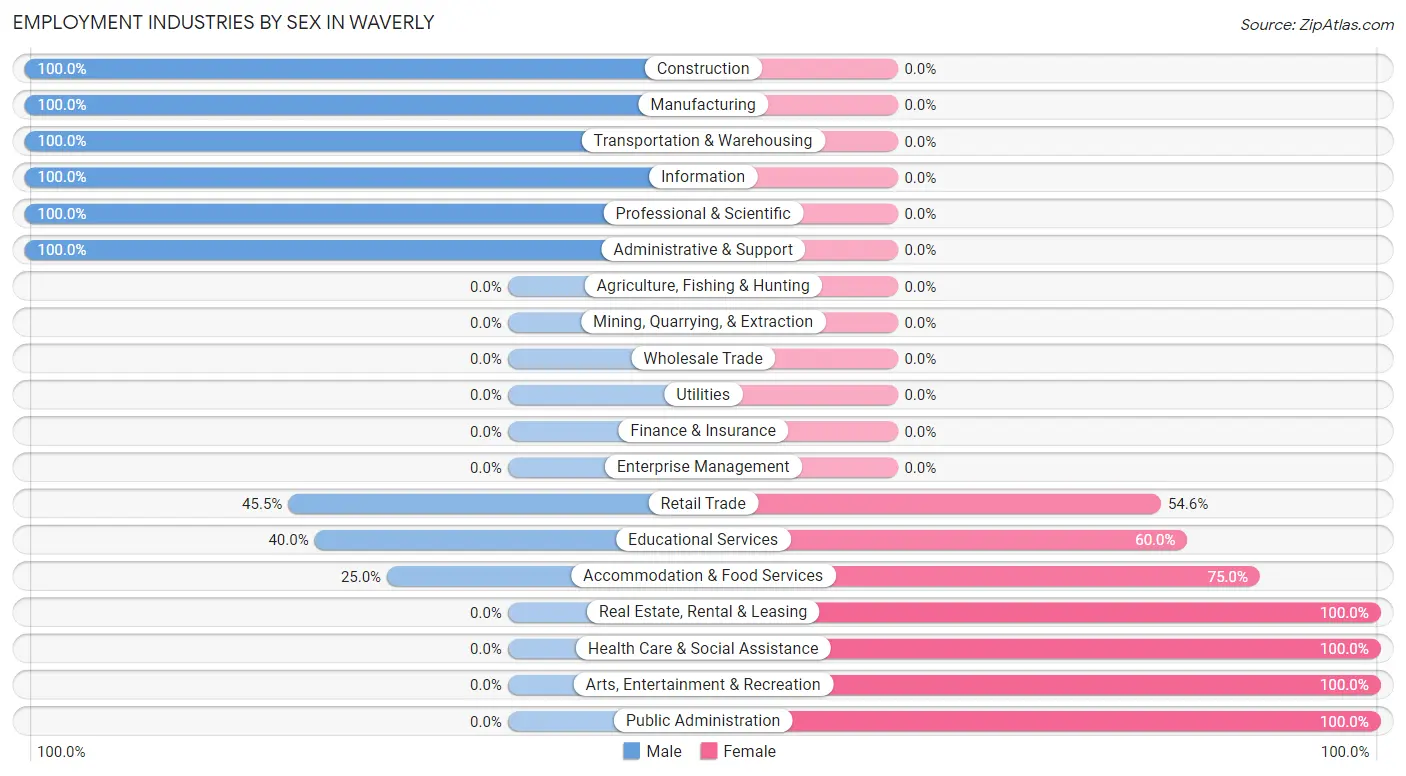
Employment Industries by Sex in Waverly
The Waverly industries that see more men than women are Construction (100.0%), Manufacturing (100.0%), and Transportation & Warehousing (100.0%), whereas the industries that tend to have a higher number of women are Real Estate, Rental & Leasing (100.0%), Health Care & Social Assistance (100.0%), and Arts, Entertainment & Recreation (100.0%).
| Industry | Male | Female |
| Agriculture, Fishing & Hunting | 0 (0.0%) | 0 (0.0%) |
| Mining, Quarrying, & Extraction | 0 (0.0%) | 0 (0.0%) |
| Construction | 20 (100.0%) | 0 (0.0%) |
| Manufacturing | 13 (100.0%) | 0 (0.0%) |
| Wholesale Trade | 0 (0.0%) | 0 (0.0%) |
| Retail Trade | 5 (45.5%) | 6 (54.5%) |
| Transportation & Warehousing | 11 (100.0%) | 0 (0.0%) |
| Utilities | 0 (0.0%) | 0 (0.0%) |
| Information | 6 (100.0%) | 0 (0.0%) |
| Finance & Insurance | 0 (0.0%) | 0 (0.0%) |
| Real Estate, Rental & Leasing | 0 (0.0%) | 2 (100.0%) |
| Professional & Scientific | 5 (100.0%) | 0 (0.0%) |
| Enterprise Management | 0 (0.0%) | 0 (0.0%) |
| Administrative & Support | 1 (100.0%) | 0 (0.0%) |
| Educational Services | 8 (40.0%) | 12 (60.0%) |
| Health Care & Social Assistance | 0 (0.0%) | 10 (100.0%) |
| Arts, Entertainment & Recreation | 0 (0.0%) | 6 (100.0%) |
| Accommodation & Food Services | 1 (25.0%) | 3 (75.0%) |
| Public Administration | 0 (0.0%) | 4 (100.0%) |
| Total | 72 (61.5%) | 45 (38.5%) |
Education in Waverly
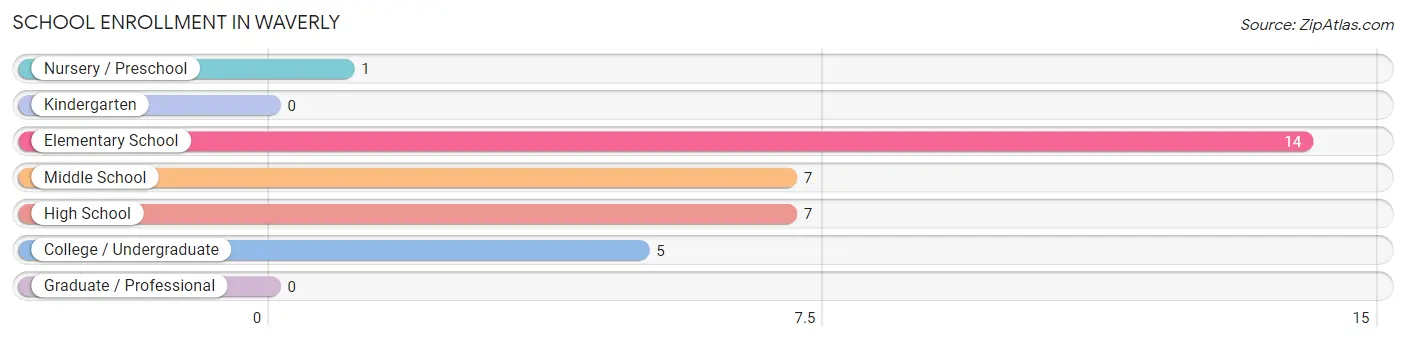
School Enrollment in Waverly
The most common levels of schooling among the 34 students in Waverly are elementary school (14 | 41.2%), middle school (7 | 20.6%), and high school (7 | 20.6%).
| School Level | # Students | % Students |
| Nursery / Preschool | 1 | 2.9% |
| Kindergarten | 0 | 0.0% |
| Elementary School | 14 | 41.2% |
| Middle School | 7 | 20.6% |
| High School | 7 | 20.6% |
| College / Undergraduate | 5 | 14.7% |
| Graduate / Professional | 0 | 0.0% |
| Total | 34 | 100.0% |
School Enrollment by Age by Funding Source in Waverly
Out of a total of 34 students who are enrolled in schools in Waverly, 27 (79.4%) attend a private institution, while the remaining 7 (20.6%) are enrolled in public schools. The age group of 5 to 9 year old has the highest likelihood of being enrolled in private schools, with 8 (100.0% in the age bracket) enrolled. Conversely, the age group of 3 to 4 year olds has the lowest likelihood of being enrolled in a private school, with 1 (100.0% in the age bracket) attending a public institution.
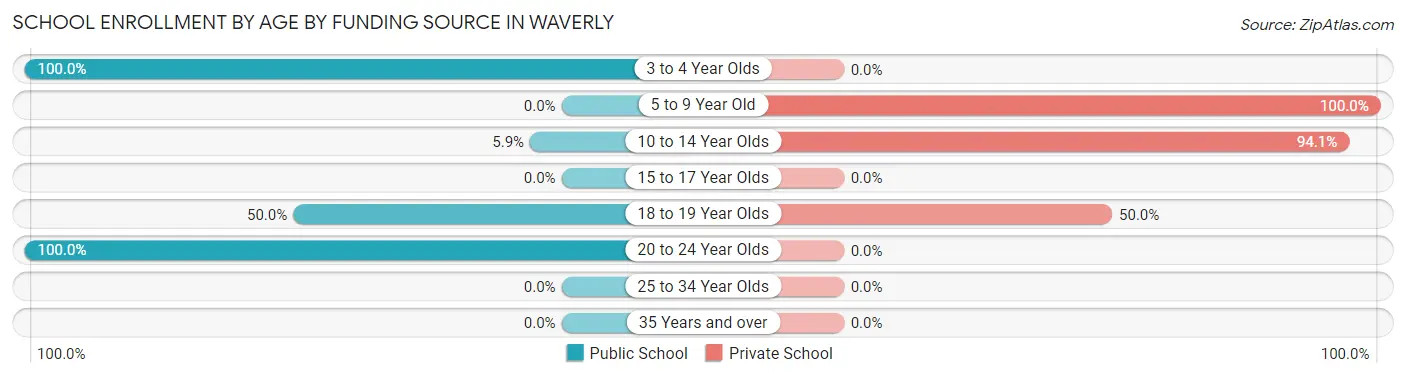
| Age Bracket | Public School | Private School |
| 3 to 4 Year Olds | 1 (100.0%) | 0 (0.0%) |
| 5 to 9 Year Old | 0 (0.0%) | 8 (100.0%) |
| 10 to 14 Year Olds | 1 (5.9%) | 16 (94.1%) |
| 15 to 17 Year Olds | 0 (0.0%) | 0 (0.0%) |
| 18 to 19 Year Olds | 3 (50.0%) | 3 (50.0%) |
| 20 to 24 Year Olds | 2 (100.0%) | 0 (0.0%) |
| 25 to 34 Year Olds | 0 (0.0%) | 0 (0.0%) |
| 35 Years and over | 0 (0.0%) | 0 (0.0%) |
| Total | 7 (20.6%) | 27 (79.4%) |
Educational Attainment by Field of Study in Waverly
Arts & humanities (15 | 20.3%), business (11 | 14.9%), education (11 | 14.9%), science & technology (9 | 12.2%), and social sciences (8 | 10.8%) are the most common fields of study among 74 individuals in Waverly who have obtained a bachelor's degree or higher.
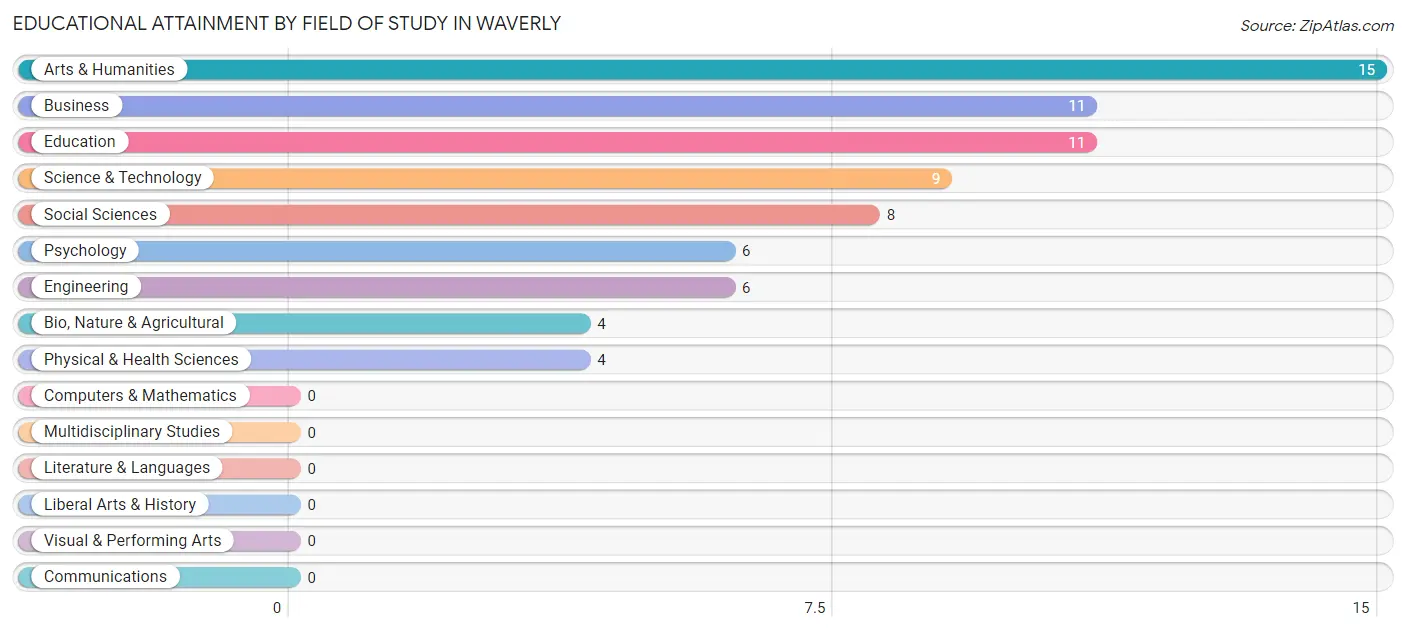
| Field of Study | # Graduates | % Graduates |
| Computers & Mathematics | 0 | 0.0% |
| Bio, Nature & Agricultural | 4 | 5.4% |
| Physical & Health Sciences | 4 | 5.4% |
| Psychology | 6 | 8.1% |
| Social Sciences | 8 | 10.8% |
| Engineering | 6 | 8.1% |
| Multidisciplinary Studies | 0 | 0.0% |
| Science & Technology | 9 | 12.2% |
| Business | 11 | 14.9% |
| Education | 11 | 14.9% |
| Literature & Languages | 0 | 0.0% |
| Liberal Arts & History | 0 | 0.0% |
| Visual & Performing Arts | 0 | 0.0% |
| Communications | 0 | 0.0% |
| Arts & Humanities | 15 | 20.3% |
| Total | 74 | 100.0% |
Transportation & Commute in Waverly
Vehicle Availability by Sex in Waverly
The most prevalent vehicle ownership categories in Waverly are males with 2 vehicles (25, accounting for 34.7%) and females with 2 vehicles (11, making up 55.6%).
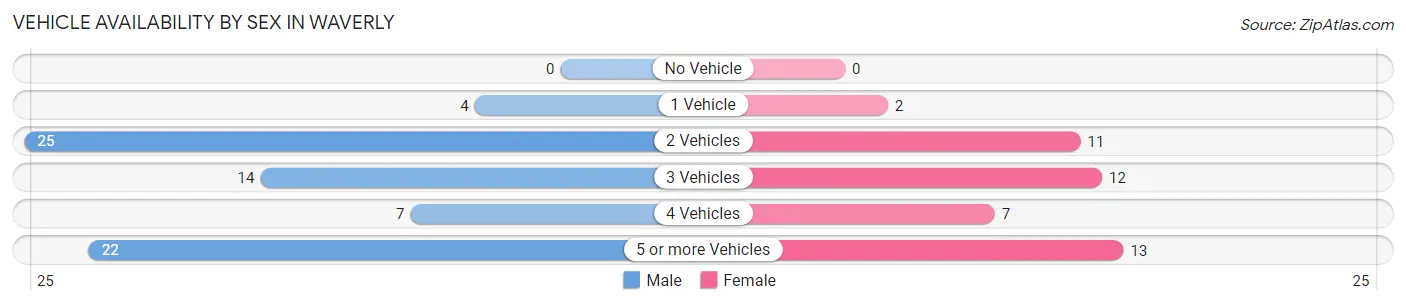
| Vehicles Available | Male | Female |
| No Vehicle | 0 (0.0%) | 0 (0.0%) |
| 1 Vehicle | 4 (5.6%) | 2 (4.4%) |
| 2 Vehicles | 25 (34.7%) | 11 (24.4%) |
| 3 Vehicles | 14 (19.4%) | 12 (26.7%) |
| 4 Vehicles | 7 (9.7%) | 7 (15.6%) |
| 5 or more Vehicles | 22 (30.6%) | 13 (28.9%) |
| Total | 72 (100.0%) | 45 (100.0%) |
Commute Time in Waverly
The most frequently occuring commute durations in Waverly are 15 to 19 minutes (35 commuters, 29.9%), 20 to 24 minutes (29 commuters, 24.8%), and less than 5 minutes (13 commuters, 11.1%).
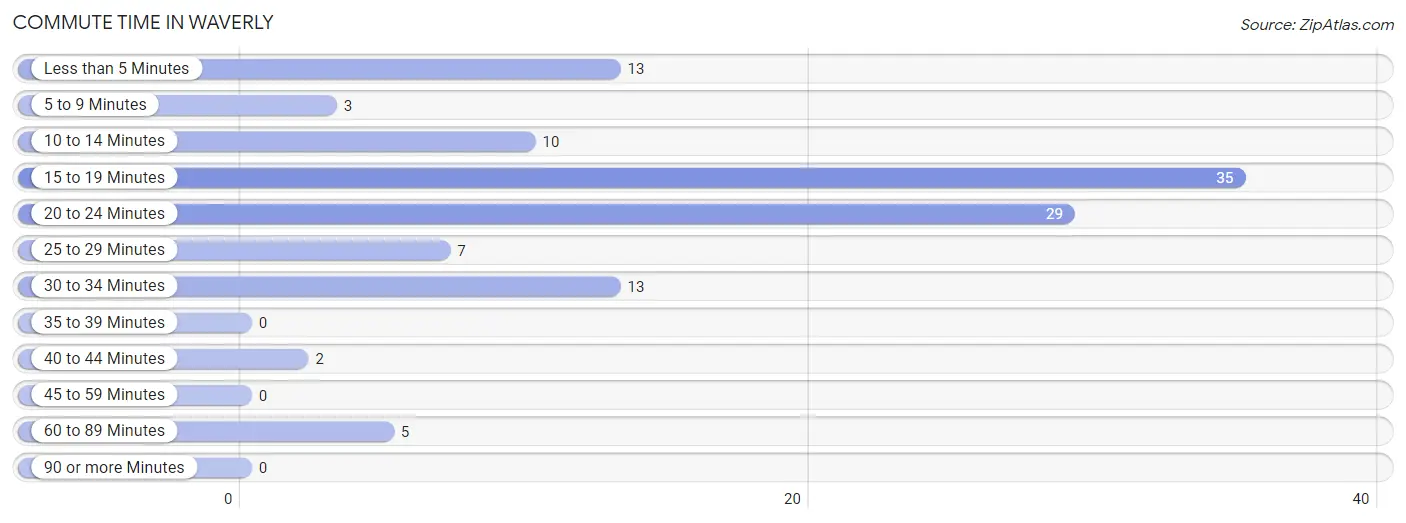
| Commute Time | # Commuters | % Commuters |
| Less than 5 Minutes | 13 | 11.1% |
| 5 to 9 Minutes | 3 | 2.6% |
| 10 to 14 Minutes | 10 | 8.6% |
| 15 to 19 Minutes | 35 | 29.9% |
| 20 to 24 Minutes | 29 | 24.8% |
| 25 to 29 Minutes | 7 | 6.0% |
| 30 to 34 Minutes | 13 | 11.1% |
| 35 to 39 Minutes | 0 | 0.0% |
| 40 to 44 Minutes | 2 | 1.7% |
| 45 to 59 Minutes | 0 | 0.0% |
| 60 to 89 Minutes | 5 | 4.3% |
| 90 or more Minutes | 0 | 0.0% |
Commute Time by Sex in Waverly
The most common commute times in Waverly are 15 to 19 minutes (29 commuters, 40.3%) for males and less than 5 minutes (10 commuters, 22.2%) for females.
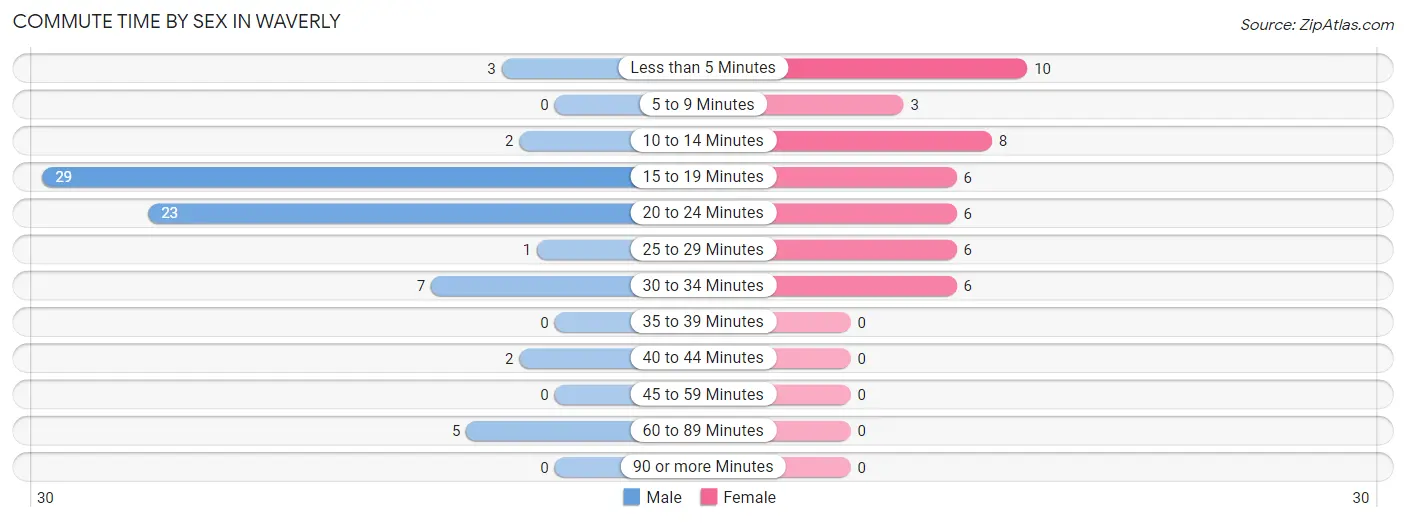
| Commute Time | Male | Female |
| Less than 5 Minutes | 3 (4.2%) | 10 (22.2%) |
| 5 to 9 Minutes | 0 (0.0%) | 3 (6.7%) |
| 10 to 14 Minutes | 2 (2.8%) | 8 (17.8%) |
| 15 to 19 Minutes | 29 (40.3%) | 6 (13.3%) |
| 20 to 24 Minutes | 23 (31.9%) | 6 (13.3%) |
| 25 to 29 Minutes | 1 (1.4%) | 6 (13.3%) |
| 30 to 34 Minutes | 7 (9.7%) | 6 (13.3%) |
| 35 to 39 Minutes | 0 (0.0%) | 0 (0.0%) |
| 40 to 44 Minutes | 2 (2.8%) | 0 (0.0%) |
| 45 to 59 Minutes | 0 (0.0%) | 0 (0.0%) |
| 60 to 89 Minutes | 5 (6.9%) | 0 (0.0%) |
| 90 or more Minutes | 0 (0.0%) | 0 (0.0%) |
Time of Departure to Work by Sex in Waverly
The most frequent times of departure to work in Waverly are 8:00 AM to 8:29 AM (18, 25.0%) for males and 7:00 AM to 7:29 AM (10, 22.2%) for females.
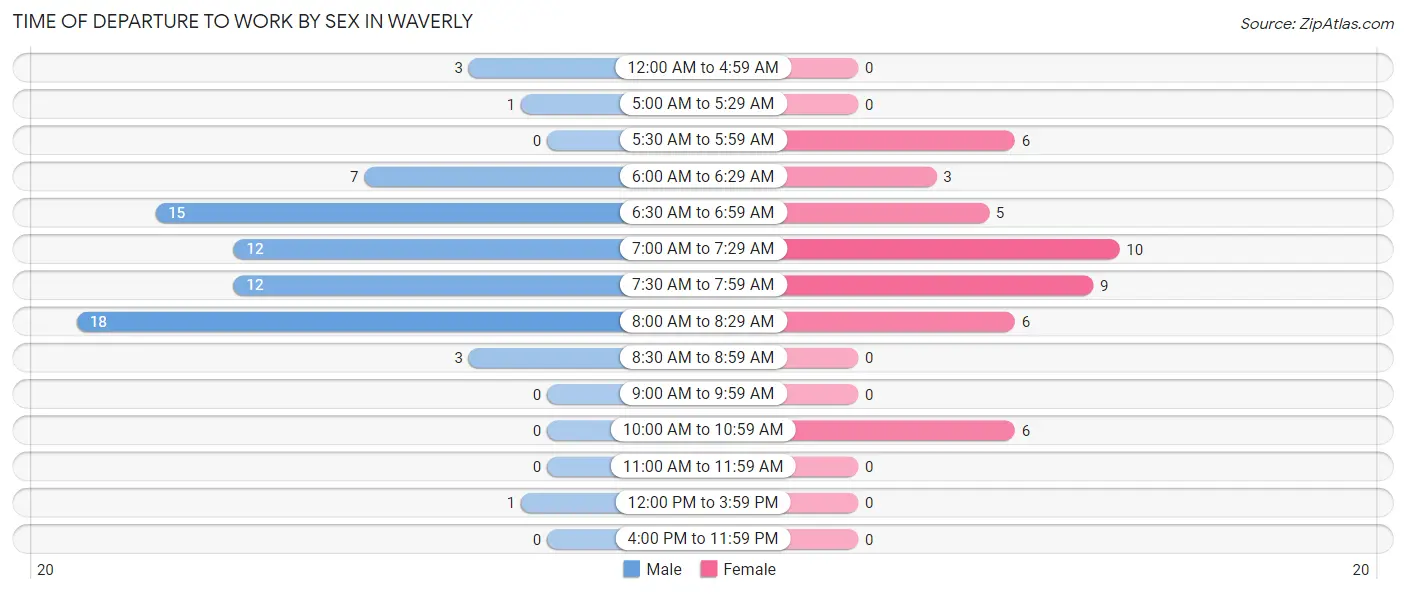
| Time of Departure | Male | Female |
| 12:00 AM to 4:59 AM | 3 (4.2%) | 0 (0.0%) |
| 5:00 AM to 5:29 AM | 1 (1.4%) | 0 (0.0%) |
| 5:30 AM to 5:59 AM | 0 (0.0%) | 6 (13.3%) |
| 6:00 AM to 6:29 AM | 7 (9.7%) | 3 (6.7%) |
| 6:30 AM to 6:59 AM | 15 (20.8%) | 5 (11.1%) |
| 7:00 AM to 7:29 AM | 12 (16.7%) | 10 (22.2%) |
| 7:30 AM to 7:59 AM | 12 (16.7%) | 9 (20.0%) |
| 8:00 AM to 8:29 AM | 18 (25.0%) | 6 (13.3%) |
| 8:30 AM to 8:59 AM | 3 (4.2%) | 0 (0.0%) |
| 9:00 AM to 9:59 AM | 0 (0.0%) | 0 (0.0%) |
| 10:00 AM to 10:59 AM | 0 (0.0%) | 6 (13.3%) |
| 11:00 AM to 11:59 AM | 0 (0.0%) | 0 (0.0%) |
| 12:00 PM to 3:59 PM | 1 (1.4%) | 0 (0.0%) |
| 4:00 PM to 11:59 PM | 0 (0.0%) | 0 (0.0%) |
| Total | 72 (100.0%) | 45 (100.0%) |
Housing Occupancy in Waverly
Occupancy by Ownership in Waverly
Of the total 102 dwellings in Waverly, owner-occupied units account for 94 (92.2%), while renter-occupied units make up 8 (7.8%).
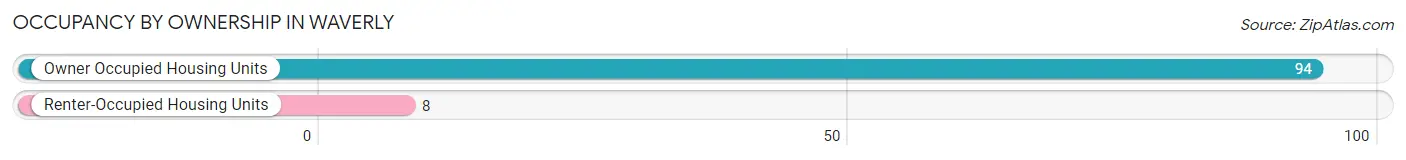
| Occupancy | # Housing Units | % Housing Units |
| Owner Occupied Housing Units | 94 | 92.2% |
| Renter-Occupied Housing Units | 8 | 7.8% |
| Total Occupied Housing Units | 102 | 100.0% |
Occupancy by Household Size in Waverly
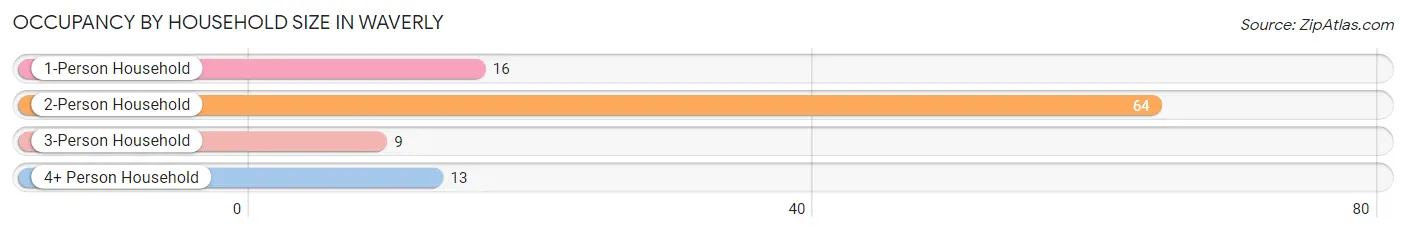
| Household Size | # Housing Units | % Housing Units |
| 1-Person Household | 16 | 15.7% |
| 2-Person Household | 64 | 62.7% |
| 3-Person Household | 9 | 8.8% |
| 4+ Person Household | 13 | 12.8% |
| Total Housing Units | 102 | 100.0% |
Occupancy by Ownership by Household Size in Waverly
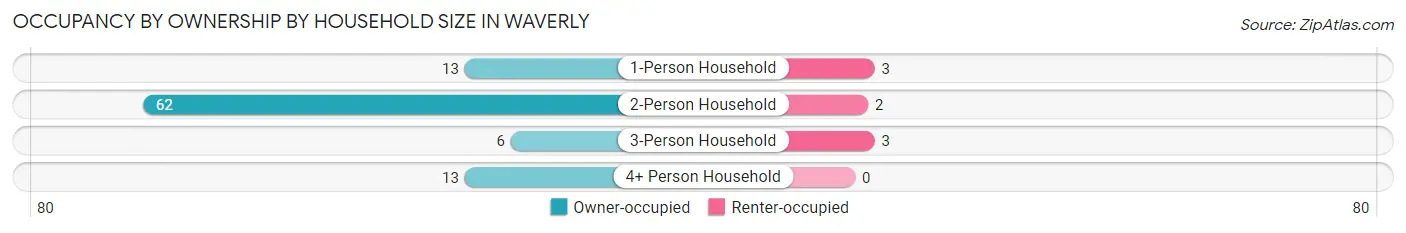
| Household Size | Owner-occupied | Renter-occupied |
| 1-Person Household | 13 (81.2%) | 3 (18.8%) |
| 2-Person Household | 62 (96.9%) | 2 (3.1%) |
| 3-Person Household | 6 (66.7%) | 3 (33.3%) |
| 4+ Person Household | 13 (100.0%) | 0 (0.0%) |
| Total Housing Units | 94 (92.2%) | 8 (7.8%) |
Occupancy by Educational Attainment in Waverly
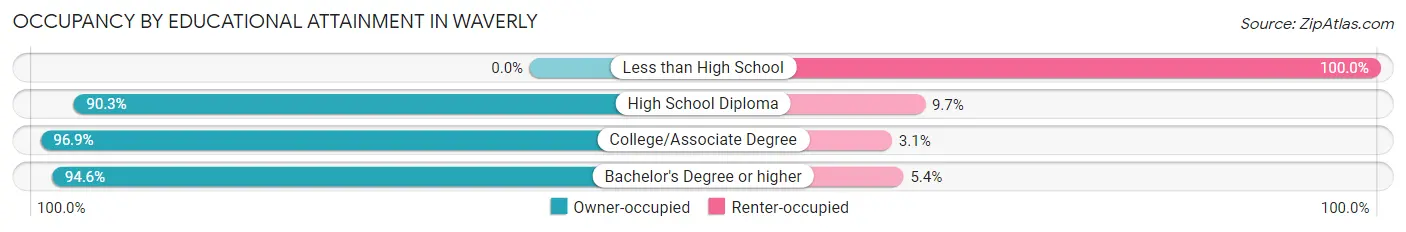
| Household Size | Owner-occupied | Renter-occupied |
| Less than High School | 0 (0.0%) | 2 (100.0%) |
| High School Diploma | 28 (90.3%) | 3 (9.7%) |
| College/Associate Degree | 31 (96.9%) | 1 (3.1%) |
| Bachelor's Degree or higher | 35 (94.6%) | 2 (5.4%) |
Occupancy by Age of Householder in Waverly
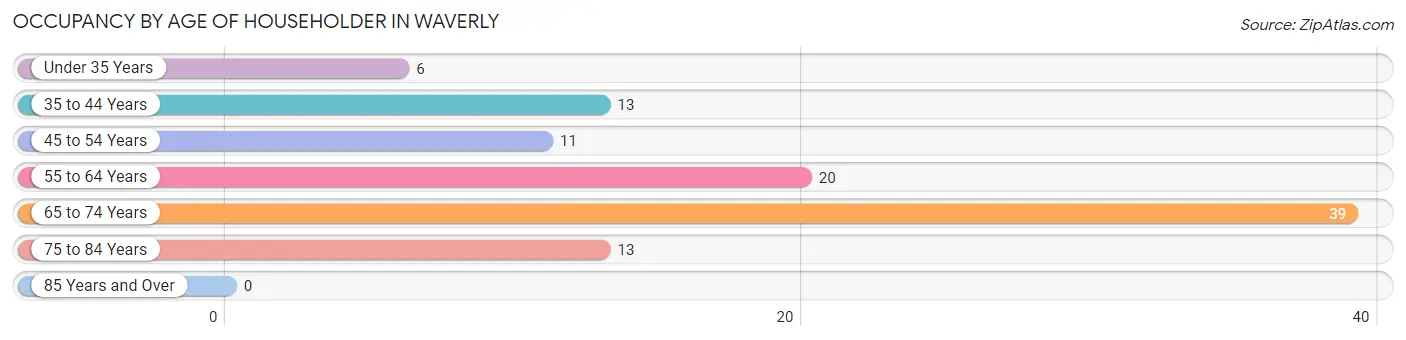
| Age Bracket | # Households | % Households |
| Under 35 Years | 6 | 5.9% |
| 35 to 44 Years | 13 | 12.8% |
| 45 to 54 Years | 11 | 10.8% |
| 55 to 64 Years | 20 | 19.6% |
| 65 to 74 Years | 39 | 38.2% |
| 75 to 84 Years | 13 | 12.8% |
| 85 Years and Over | 0 | 0.0% |
| Total | 102 | 100.0% |
Housing Finances in Waverly
Median Income by Occupancy in Waverly
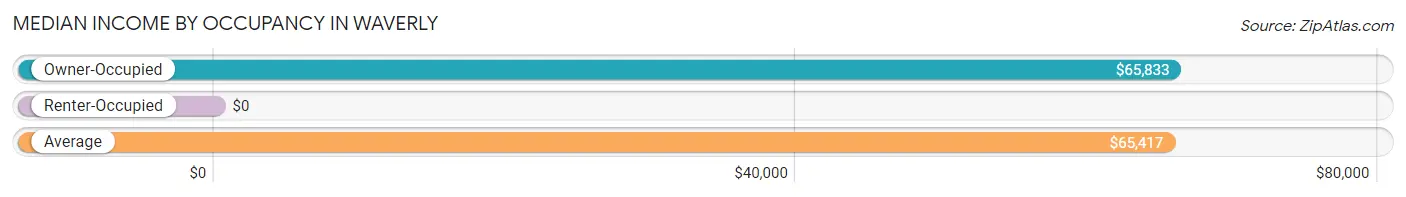
| Occupancy Type | # Households | Median Income |
| Owner-Occupied | 94 (92.2%) | $65,833 |
| Renter-Occupied | 8 (7.8%) | $0 |
| Average | 102 (100.0%) | $65,417 |
Occupancy by Householder Income Bracket in Waverly
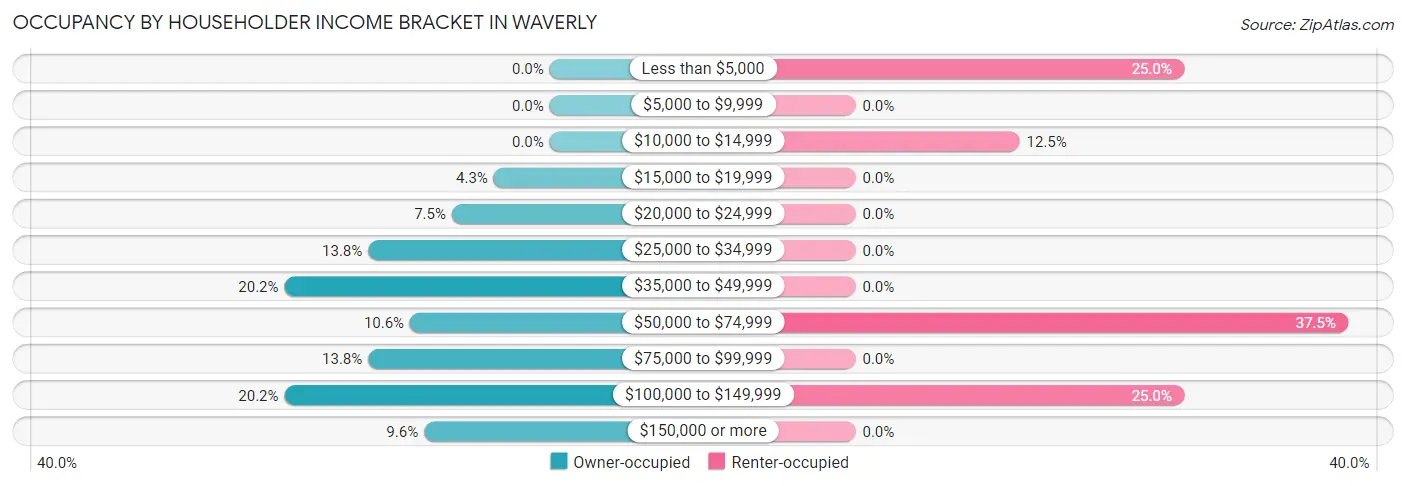
| Income Bracket | Owner-occupied | Renter-occupied |
| Less than $5,000 | 0 (0.0%) | 2 (25.0%) |
| $5,000 to $9,999 | 0 (0.0%) | 0 (0.0%) |
| $10,000 to $14,999 | 0 (0.0%) | 1 (12.5%) |
| $15,000 to $19,999 | 4 (4.3%) | 0 (0.0%) |
| $20,000 to $24,999 | 7 (7.4%) | 0 (0.0%) |
| $25,000 to $34,999 | 13 (13.8%) | 0 (0.0%) |
| $35,000 to $49,999 | 19 (20.2%) | 0 (0.0%) |
| $50,000 to $74,999 | 10 (10.6%) | 3 (37.5%) |
| $75,000 to $99,999 | 13 (13.8%) | 0 (0.0%) |
| $100,000 to $149,999 | 19 (20.2%) | 2 (25.0%) |
| $150,000 or more | 9 (9.6%) | 0 (0.0%) |
| Total | 94 (100.0%) | 8 (100.0%) |
Monthly Housing Cost Tiers in Waverly
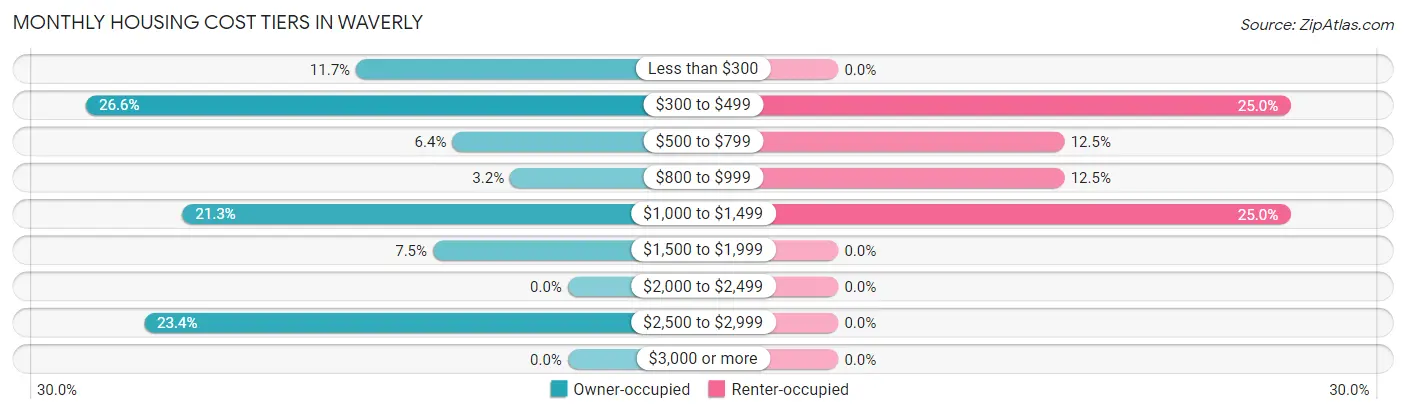
| Monthly Cost | Owner-occupied | Renter-occupied |
| Less than $300 | 11 (11.7%) | 0 (0.0%) |
| $300 to $499 | 25 (26.6%) | 2 (25.0%) |
| $500 to $799 | 6 (6.4%) | 1 (12.5%) |
| $800 to $999 | 3 (3.2%) | 1 (12.5%) |
| $1,000 to $1,499 | 20 (21.3%) | 2 (25.0%) |
| $1,500 to $1,999 | 7 (7.4%) | 0 (0.0%) |
| $2,000 to $2,499 | 0 (0.0%) | 0 (0.0%) |
| $2,500 to $2,999 | 22 (23.4%) | 0 (0.0%) |
| $3,000 or more | 0 (0.0%) | 0 (0.0%) |
| Total | 94 (100.0%) | 8 (100.0%) |
Physical Housing Characteristics in Waverly
Housing Structures in Waverly
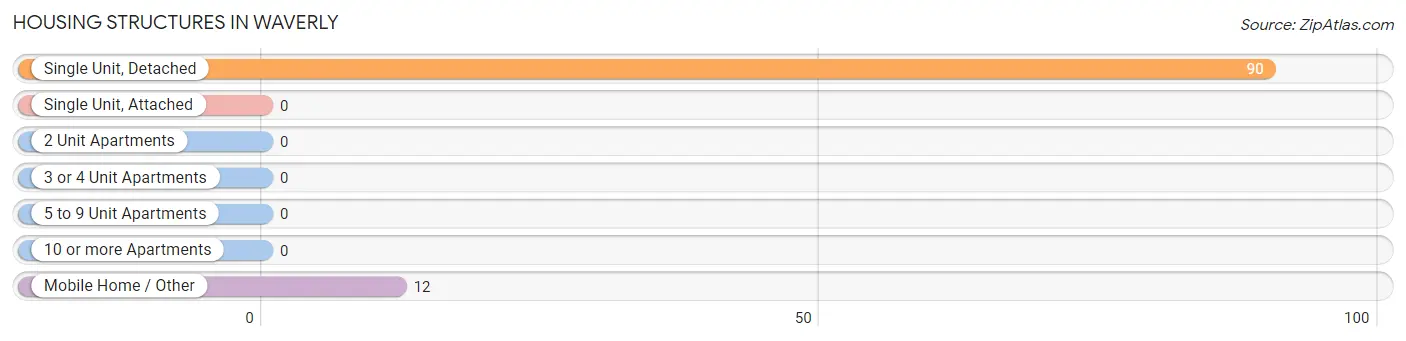
| Structure Type | # Housing Units | % Housing Units |
| Single Unit, Detached | 90 | 88.2% |
| Single Unit, Attached | 0 | 0.0% |
| 2 Unit Apartments | 0 | 0.0% |
| 3 or 4 Unit Apartments | 0 | 0.0% |
| 5 to 9 Unit Apartments | 0 | 0.0% |
| 10 or more Apartments | 0 | 0.0% |
| Mobile Home / Other | 12 | 11.8% |
| Total | 102 | 100.0% |
Housing Structures by Occupancy in Waverly
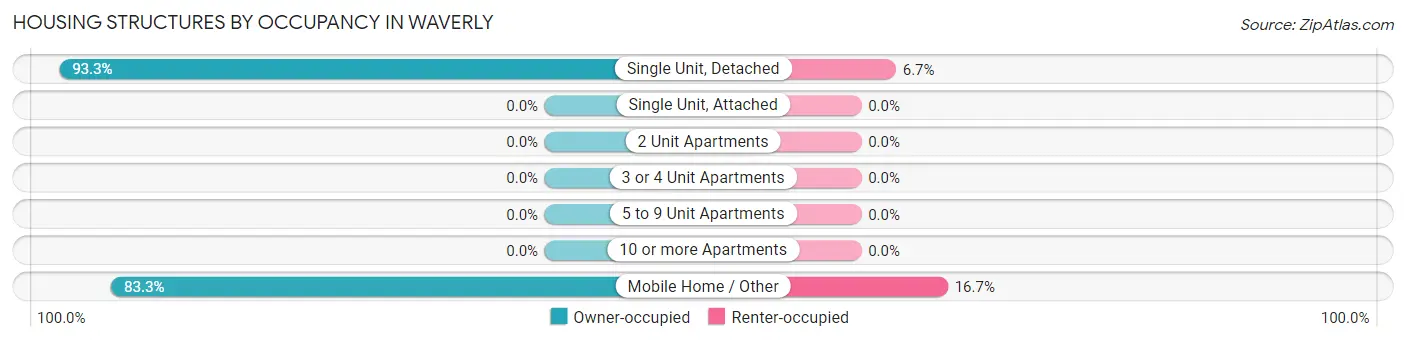
| Structure Type | Owner-occupied | Renter-occupied |
| Single Unit, Detached | 84 (93.3%) | 6 (6.7%) |
| Single Unit, Attached | 0 (0.0%) | 0 (0.0%) |
| 2 Unit Apartments | 0 (0.0%) | 0 (0.0%) |
| 3 or 4 Unit Apartments | 0 (0.0%) | 0 (0.0%) |
| 5 to 9 Unit Apartments | 0 (0.0%) | 0 (0.0%) |
| 10 or more Apartments | 0 (0.0%) | 0 (0.0%) |
| Mobile Home / Other | 10 (83.3%) | 2 (16.7%) |
| Total | 94 (92.2%) | 8 (7.8%) |
Housing Structures by Number of Rooms in Waverly
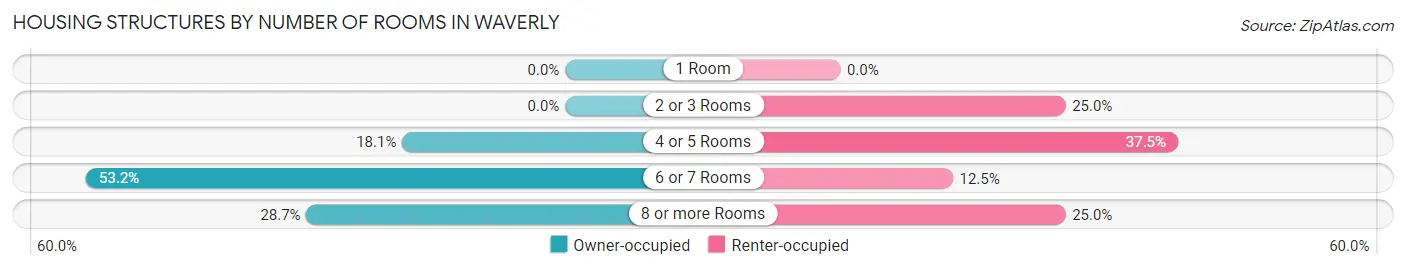
| Number of Rooms | Owner-occupied | Renter-occupied |
| 1 Room | 0 (0.0%) | 0 (0.0%) |
| 2 or 3 Rooms | 0 (0.0%) | 2 (25.0%) |
| 4 or 5 Rooms | 17 (18.1%) | 3 (37.5%) |
| 6 or 7 Rooms | 50 (53.2%) | 1 (12.5%) |
| 8 or more Rooms | 27 (28.7%) | 2 (25.0%) |
| Total | 94 (100.0%) | 8 (100.0%) |
Housing Structure by Heating Type in Waverly
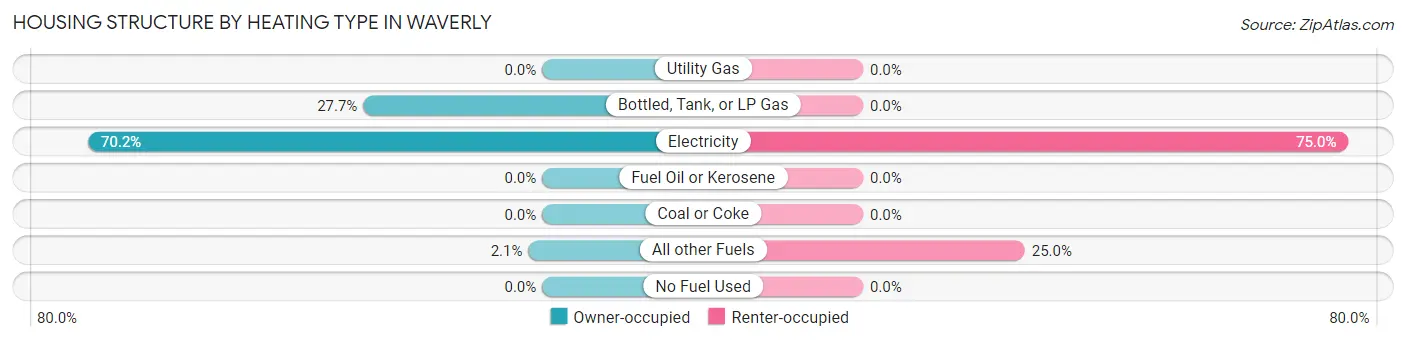
| Heating Type | Owner-occupied | Renter-occupied |
| Utility Gas | 0 (0.0%) | 0 (0.0%) |
| Bottled, Tank, or LP Gas | 26 (27.7%) | 0 (0.0%) |
| Electricity | 66 (70.2%) | 6 (75.0%) |
| Fuel Oil or Kerosene | 0 (0.0%) | 0 (0.0%) |
| Coal or Coke | 0 (0.0%) | 0 (0.0%) |
| All other Fuels | 2 (2.1%) | 2 (25.0%) |
| No Fuel Used | 0 (0.0%) | 0 (0.0%) |
| Total | 94 (100.0%) | 8 (100.0%) |
Household Vehicle Usage in Waverly
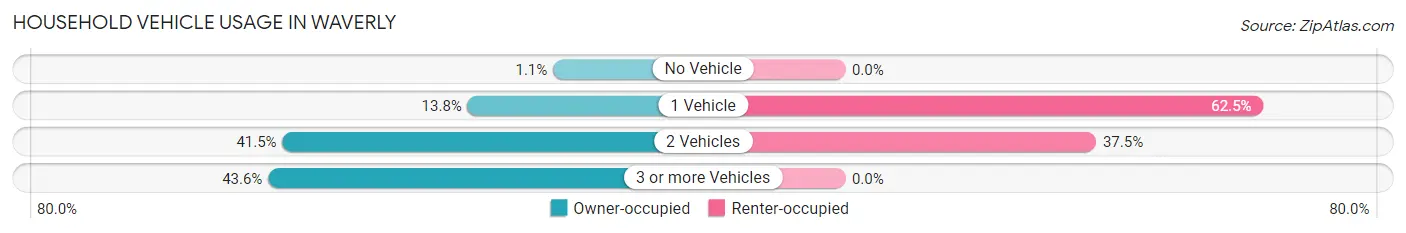
| Vehicles per Household | Owner-occupied | Renter-occupied |
| No Vehicle | 1 (1.1%) | 0 (0.0%) |
| 1 Vehicle | 13 (13.8%) | 5 (62.5%) |
| 2 Vehicles | 39 (41.5%) | 3 (37.5%) |
| 3 or more Vehicles | 41 (43.6%) | 0 (0.0%) |
| Total | 94 (100.0%) | 8 (100.0%) |
Real Estate & Mortgages in Waverly
Real Estate and Mortgage Overview in Waverly
| Characteristic | Without Mortgage | With Mortgage |
| Housing Units | 47 | 47 |
| Median Property Value | $220,700 | $275,000 |
| Median Household Income | $64,375 | $4 |
| Monthly Housing Costs | $348 | $0 |
| Real Estate Taxes | $685 | $3 |
Property Value by Mortgage Status in Waverly
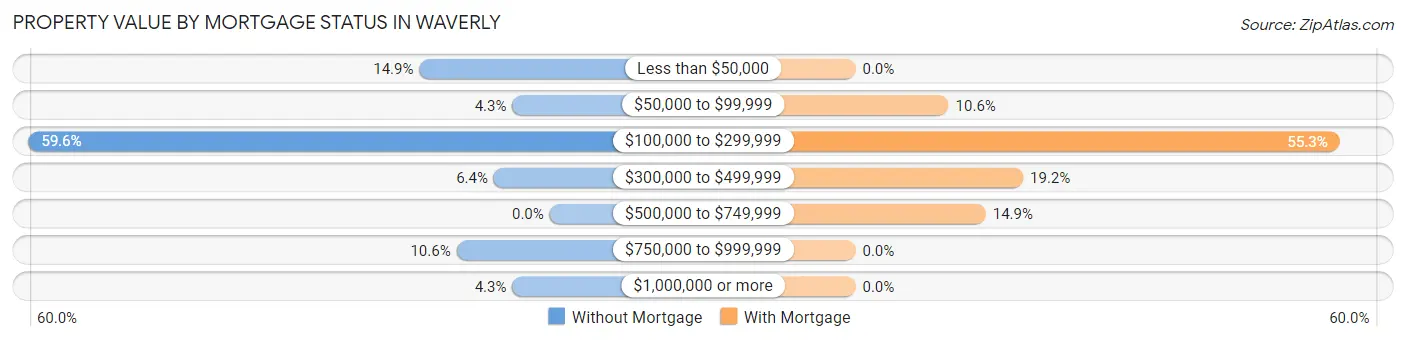
| Property Value | Without Mortgage | With Mortgage |
| Less than $50,000 | 7 (14.9%) | 0 (0.0%) |
| $50,000 to $99,999 | 2 (4.3%) | 5 (10.6%) |
| $100,000 to $299,999 | 28 (59.6%) | 26 (55.3%) |
| $300,000 to $499,999 | 3 (6.4%) | 9 (19.2%) |
| $500,000 to $749,999 | 0 (0.0%) | 7 (14.9%) |
| $750,000 to $999,999 | 5 (10.6%) | 0 (0.0%) |
| $1,000,000 or more | 2 (4.3%) | 0 (0.0%) |
| Total | 47 (100.0%) | 47 (100.0%) |
Household Income by Mortgage Status in Waverly
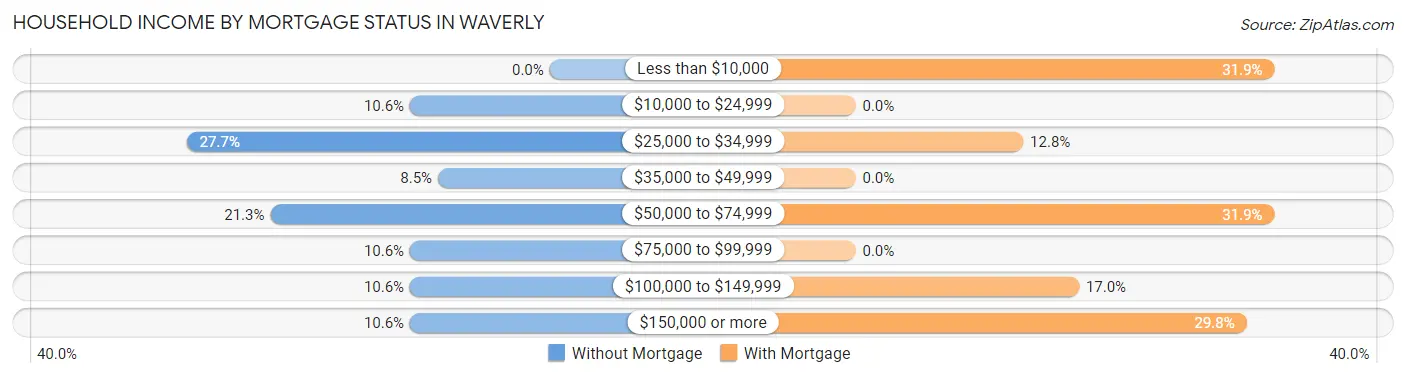
| Household Income | Without Mortgage | With Mortgage |
| Less than $10,000 | 0 (0.0%) | 15 (31.9%) |
| $10,000 to $24,999 | 5 (10.6%) | 0 (0.0%) |
| $25,000 to $34,999 | 13 (27.7%) | 6 (12.8%) |
| $35,000 to $49,999 | 4 (8.5%) | 0 (0.0%) |
| $50,000 to $74,999 | 10 (21.3%) | 15 (31.9%) |
| $75,000 to $99,999 | 5 (10.6%) | 0 (0.0%) |
| $100,000 to $149,999 | 5 (10.6%) | 8 (17.0%) |
| $150,000 or more | 5 (10.6%) | 14 (29.8%) |
| Total | 47 (100.0%) | 47 (100.0%) |
Property Value to Household Income Ratio in Waverly
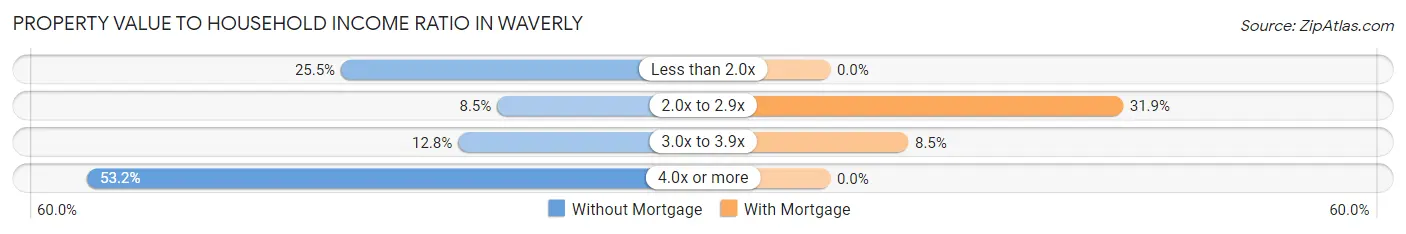
| Value-to-Income Ratio | Without Mortgage | With Mortgage |
| Less than 2.0x | 12 (25.5%) | 0 (0.0%) |
| 2.0x to 2.9x | 4 (8.5%) | 15 (31.9%) |
| 3.0x to 3.9x | 6 (12.8%) | 4 (8.5%) |
| 4.0x or more | 25 (53.2%) | 0 (0.0%) |
| Total | 47 (100.0%) | 47 (100.0%) |
Real Estate Taxes by Mortgage Status in Waverly
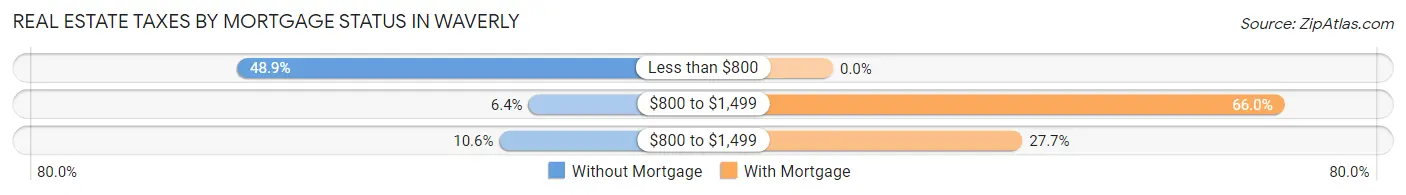
| Property Taxes | Without Mortgage | With Mortgage |
| Less than $800 | 23 (48.9%) | 0 (0.0%) |
| $800 to $1,499 | 3 (6.4%) | 31 (66.0%) |
| $800 to $1,499 | 5 (10.6%) | 13 (27.7%) |
| Total | 47 (100.0%) | 47 (100.0%) |
Health & Disability in Waverly
Health Insurance Coverage by Age in Waverly
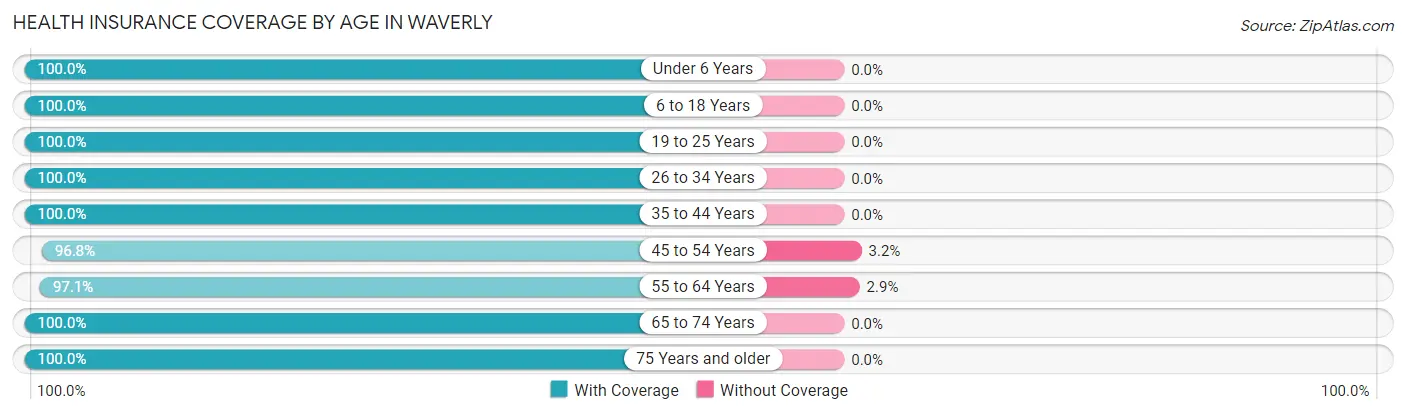
| Age Bracket | With Coverage | Without Coverage |
| Under 6 Years | 5 (100.0%) | 0 (0.0%) |
| 6 to 18 Years | 28 (100.0%) | 0 (0.0%) |
| 19 to 25 Years | 23 (100.0%) | 0 (0.0%) |
| 26 to 34 Years | 5 (100.0%) | 0 (0.0%) |
| 35 to 44 Years | 18 (100.0%) | 0 (0.0%) |
| 45 to 54 Years | 30 (96.8%) | 1 (3.2%) |
| 55 to 64 Years | 34 (97.1%) | 1 (2.9%) |
| 65 to 74 Years | 78 (100.0%) | 0 (0.0%) |
| 75 Years and older | 25 (100.0%) | 0 (0.0%) |
| Total | 246 (99.2%) | 2 (0.8%) |
Health Insurance Coverage by Citizenship Status in Waverly
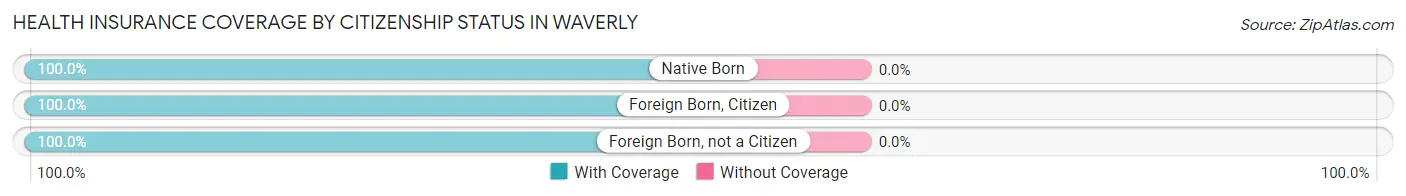
| Citizenship Status | With Coverage | Without Coverage |
| Native Born | 5 (100.0%) | 0 (0.0%) |
| Foreign Born, Citizen | 28 (100.0%) | 0 (0.0%) |
| Foreign Born, not a Citizen | 23 (100.0%) | 0 (0.0%) |
Health Insurance Coverage by Household Income in Waverly
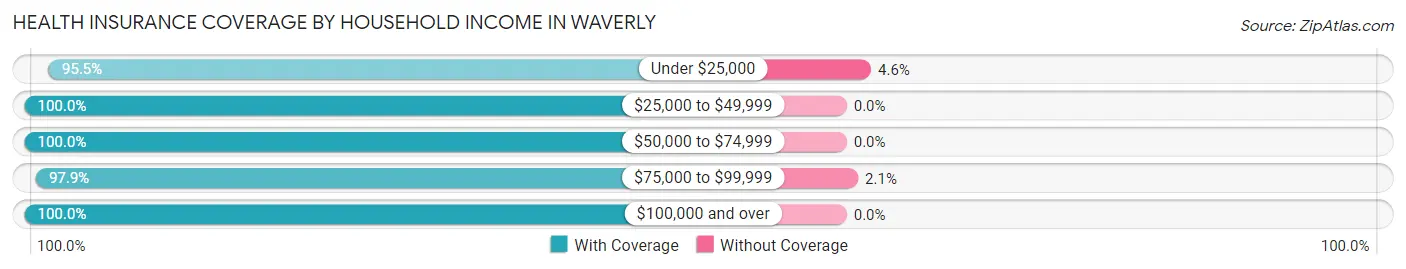
| Household Income | With Coverage | Without Coverage |
| Under $25,000 | 21 (95.5%) | 1 (4.5%) |
| $25,000 to $49,999 | 64 (100.0%) | 0 (0.0%) |
| $50,000 to $74,999 | 21 (100.0%) | 0 (0.0%) |
| $75,000 to $99,999 | 46 (97.9%) | 1 (2.1%) |
| $100,000 and over | 94 (100.0%) | 0 (0.0%) |
Public vs Private Health Insurance Coverage by Age in Waverly
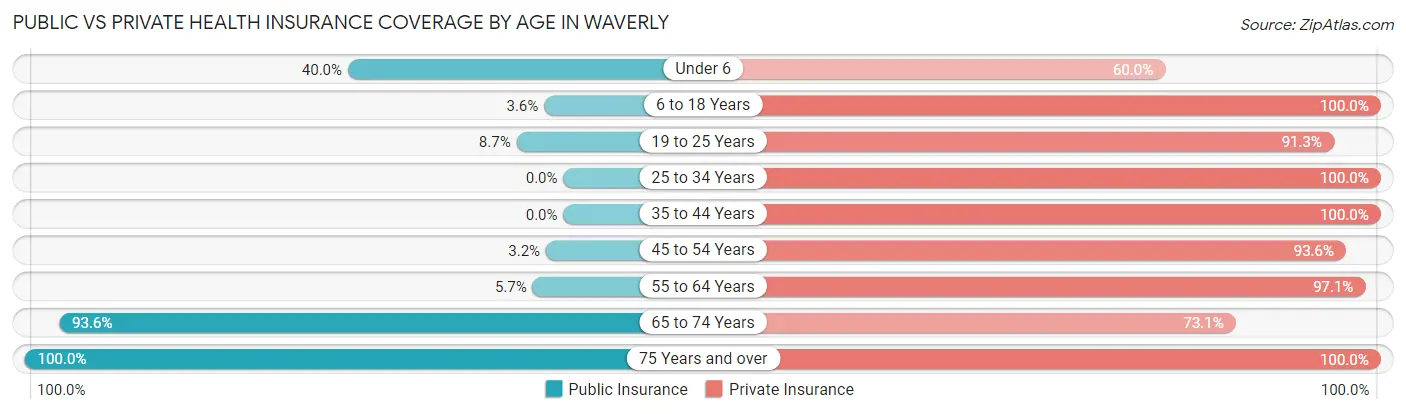
| Age Bracket | Public Insurance | Private Insurance |
| Under 6 | 2 (40.0%) | 3 (60.0%) |
| 6 to 18 Years | 1 (3.6%) | 28 (100.0%) |
| 19 to 25 Years | 2 (8.7%) | 21 (91.3%) |
| 25 to 34 Years | 0 (0.0%) | 5 (100.0%) |
| 35 to 44 Years | 0 (0.0%) | 18 (100.0%) |
| 45 to 54 Years | 1 (3.2%) | 29 (93.5%) |
| 55 to 64 Years | 2 (5.7%) | 34 (97.1%) |
| 65 to 74 Years | 73 (93.6%) | 57 (73.1%) |
| 75 Years and over | 25 (100.0%) | 25 (100.0%) |
| Total | 106 (42.7%) | 220 (88.7%) |
Disability Status by Sex by Age in Waverly
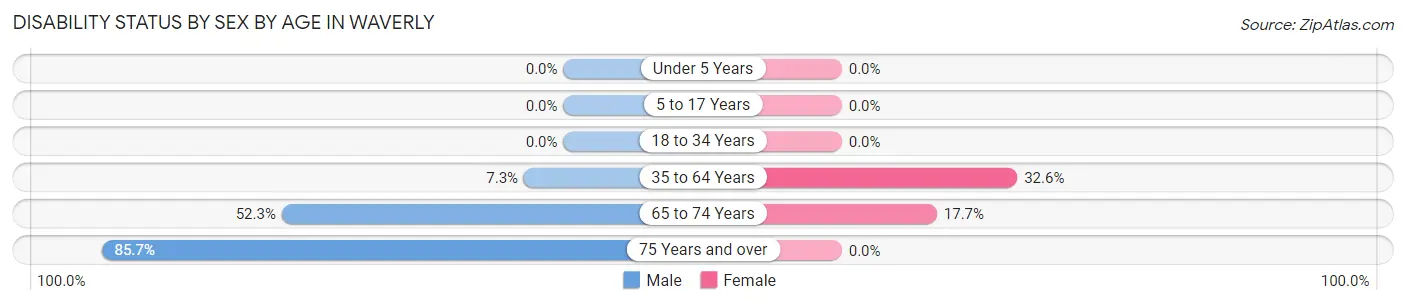
| Age Bracket | Male | Female |
| Under 5 Years | 0 (0.0%) | 0 (0.0%) |
| 5 to 17 Years | 0 (0.0%) | 0 (0.0%) |
| 18 to 34 Years | 0 (0.0%) | 0 (0.0%) |
| 35 to 64 Years | 3 (7.3%) | 14 (32.6%) |
| 65 to 74 Years | 23 (52.3%) | 6 (17.6%) |
| 75 Years and over | 12 (85.7%) | 0 (0.0%) |
Disability Class by Sex by Age in Waverly
Disability Class: Hearing Difficulty
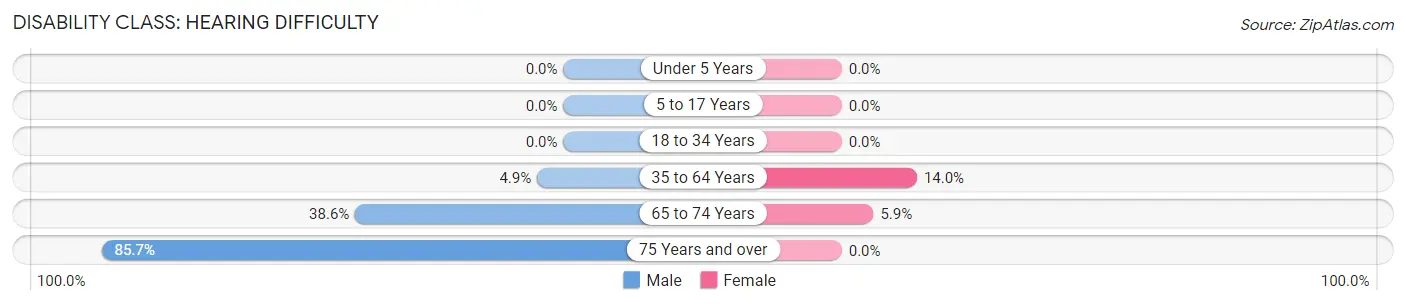
| Age Bracket | Male | Female |
| Under 5 Years | 0 (0.0%) | 0 (0.0%) |
| 5 to 17 Years | 0 (0.0%) | 0 (0.0%) |
| 18 to 34 Years | 0 (0.0%) | 0 (0.0%) |
| 35 to 64 Years | 2 (4.9%) | 6 (14.0%) |
| 65 to 74 Years | 17 (38.6%) | 2 (5.9%) |
| 75 Years and over | 12 (85.7%) | 0 (0.0%) |
Disability Class: Vision Difficulty
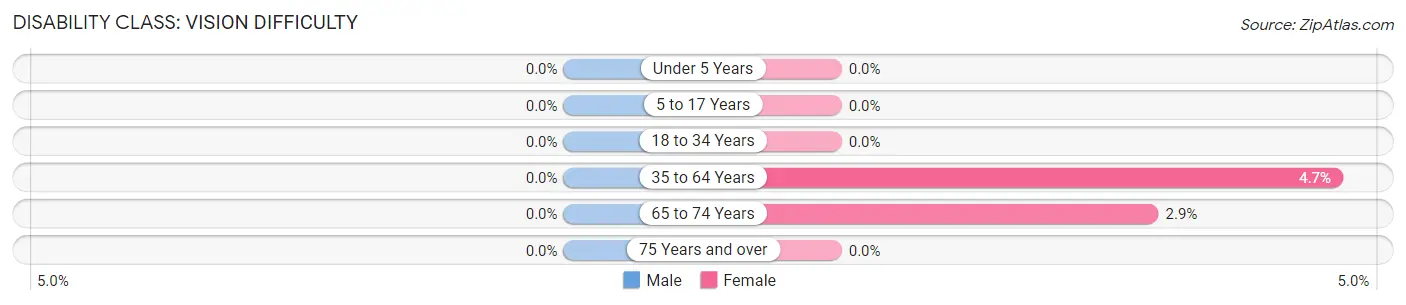
| Age Bracket | Male | Female |
| Under 5 Years | 0 (0.0%) | 0 (0.0%) |
| 5 to 17 Years | 0 (0.0%) | 0 (0.0%) |
| 18 to 34 Years | 0 (0.0%) | 0 (0.0%) |
| 35 to 64 Years | 0 (0.0%) | 2 (4.6%) |
| 65 to 74 Years | 0 (0.0%) | 1 (2.9%) |
| 75 Years and over | 0 (0.0%) | 0 (0.0%) |
Disability Class: Cognitive Difficulty
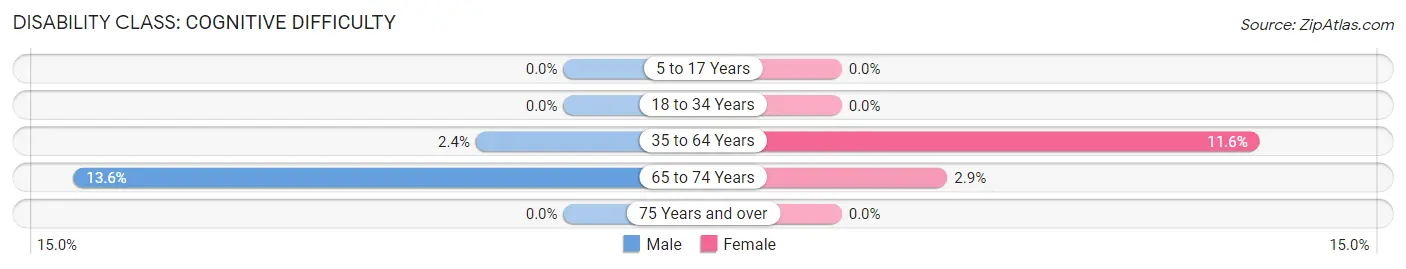
| Age Bracket | Male | Female |
| 5 to 17 Years | 0 (0.0%) | 0 (0.0%) |
| 18 to 34 Years | 0 (0.0%) | 0 (0.0%) |
| 35 to 64 Years | 1 (2.4%) | 5 (11.6%) |
| 65 to 74 Years | 6 (13.6%) | 1 (2.9%) |
| 75 Years and over | 0 (0.0%) | 0 (0.0%) |
Disability Class: Ambulatory Difficulty
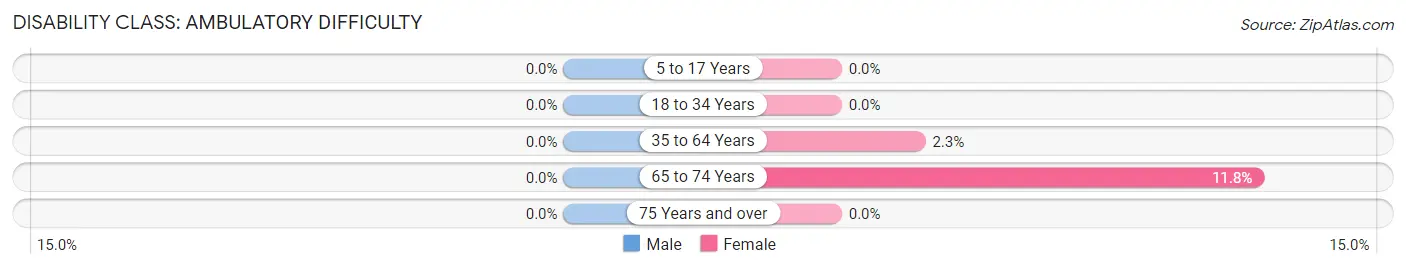
| Age Bracket | Male | Female |
| 5 to 17 Years | 0 (0.0%) | 0 (0.0%) |
| 18 to 34 Years | 0 (0.0%) | 0 (0.0%) |
| 35 to 64 Years | 0 (0.0%) | 1 (2.3%) |
| 65 to 74 Years | 0 (0.0%) | 4 (11.8%) |
| 75 Years and over | 0 (0.0%) | 0 (0.0%) |
Disability Class: Self-Care Difficulty
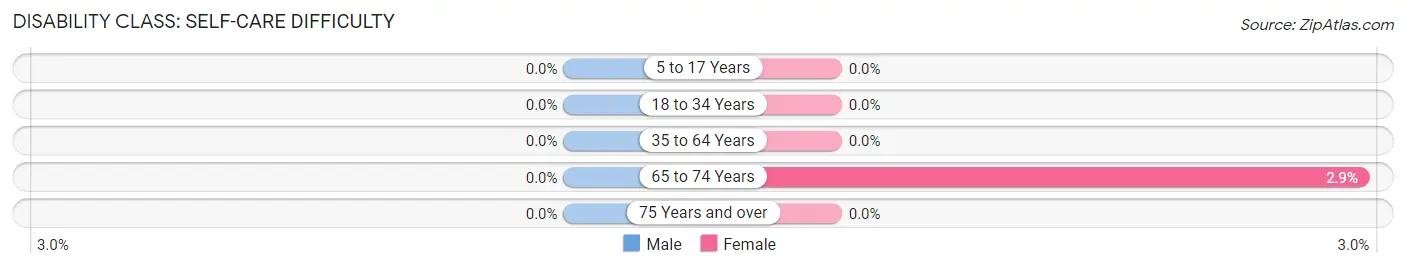
| Age Bracket | Male | Female |
| 5 to 17 Years | 0 (0.0%) | 0 (0.0%) |
| 18 to 34 Years | 0 (0.0%) | 0 (0.0%) |
| 35 to 64 Years | 0 (0.0%) | 0 (0.0%) |
| 65 to 74 Years | 0 (0.0%) | 1 (2.9%) |
| 75 Years and over | 0 (0.0%) | 0 (0.0%) |
Technology Access in Waverly
Computing Device Access in Waverly
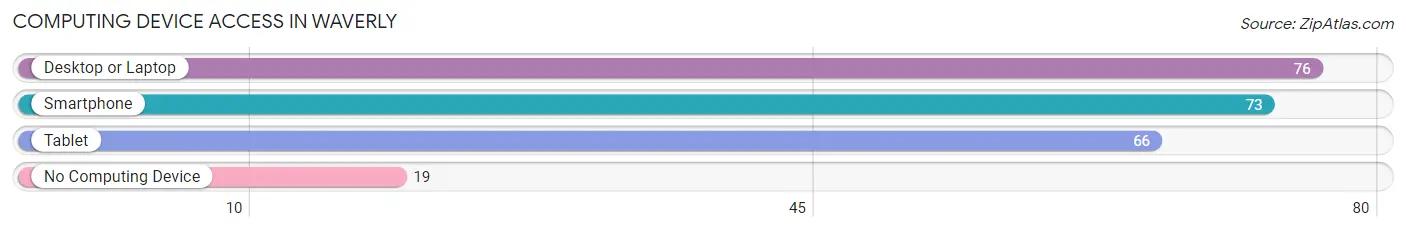
| Device Type | # Households | % Households |
| Desktop or Laptop | 76 | 74.5% |
| Smartphone | 73 | 71.6% |
| Tablet | 66 | 64.7% |
| No Computing Device | 19 | 18.6% |
| Total | 102 | 100.0% |
Internet Access in Waverly
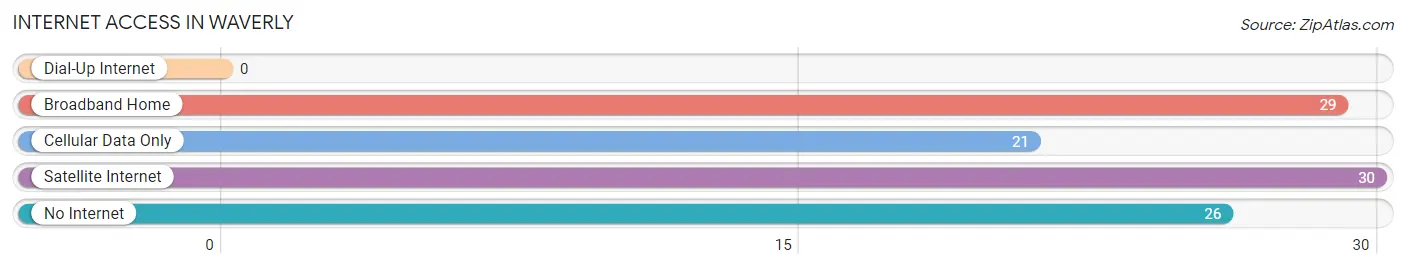
| Internet Type | # Households | % Households |
| Dial-Up Internet | 0 | 0.0% |
| Broadband Home | 29 | 28.4% |
| Cellular Data Only | 21 | 20.6% |
| Satellite Internet | 30 | 29.4% |
| No Internet | 26 | 25.5% |
| Total | 102 | 100.0% |
Waverly Summary
Waverly is a small town located in the northwest corner of Alabama, in the foothills of the Appalachian Mountains. It is situated in the northwest corner of Lauderdale County, and is bordered by the Tennessee River to the north and the Tombigbee River to the south. The town is located approximately 20 miles east of Florence, Alabama, and is part of the Florence-Muscle Shoals Metropolitan Statistical Area.
History
The area that is now Waverly was first settled in the early 1800s by settlers from North Carolina and Virginia. The town was originally known as “Waverly Station”, and was named after the Waverly Plantation, which was owned by the prominent Lauderdale family. The town was officially incorporated in 1887, and the first post office was established in 1888.
In the late 19th century, Waverly was a thriving agricultural community, with cotton, corn, and tobacco being the main crops. The town also had a number of sawmills and gristmills, as well as a number of small businesses.
In the early 20th century, Waverly experienced a period of growth and prosperity. The town was home to a number of factories, including a cotton mill, a furniture factory, and a brickyard. The town also had a number of stores, including a general store, a drug store, and a hardware store.
Geography
Waverly is located in the northwest corner of Lauderdale County, in the foothills of the Appalachian Mountains. The town is situated on the banks of the Tennessee River, and is bordered by the Tombigbee River to the south. The town is located approximately 20 miles east of Florence, Alabama, and is part of the Florence-Muscle Shoals Metropolitan Statistical Area.
The town has a total area of 2.2 square miles, all of which is land. The terrain is mostly flat, with some rolling hills. The climate is humid subtropical, with hot, humid summers and mild winters.
Economy
Waverly’s economy is largely based on agriculture and manufacturing. The town is home to a number of small businesses, including a general store, a drug store, and a hardware store. The town also has a number of factories, including a cotton mill, a furniture factory, and a brickyard.
The town is also home to a number of farms, which produce a variety of crops, including cotton, corn, and tobacco. The town also has a number of sawmills and gristmills.
Demographics
As of the 2010 census, Waverly had a population of 1,845. The racial makeup of the town was 95.3% White, 2.2% African American, 0.2% Native American, 0.2% Asian, 0.1% Pacific Islander, 0.7% from other races, and 1.3% from two or more races. Hispanic or Latino of any race were 1.7% of the population.
The median household income in Waverly was $31,250, and the median family income was $37,500. The per capita income was $17,845. About 17.2% of families and 20.2% of the population were below the poverty line, including 28.3% of those under age 18 and 11.2% of those age 65 or over.
Common Questions
What is Per Capita Income in Waverly?
Per Capita income in Waverly is $37,219.
What is the Median Family Income in Waverly?
Median Family Income in Waverly is $58,750.
What is the Median Household income in Waverly?
Median Household Income in Waverly is $65,417.
What is Income or Wage Gap in Waverly?
Income or Wage Gap in Waverly is 49.5%.
Women in Waverly earn 50.5 cents for every dollar earned by a man.
What is Inequality or Gini Index in Waverly?
Inequality or Gini Index in Waverly is 0.40.
What is the Total Population of Waverly?
Total Population of Waverly is 248.
What is the Total Male Population of Waverly?
Total Male Population of Waverly is 134.
What is the Total Female Population of Waverly?
Total Female Population of Waverly is 114.
What is the Ratio of Males per 100 Females in Waverly?
There are 117.54 Males per 100 Females in Waverly.
What is the Ratio of Females per 100 Males in Waverly?
There are 85.07 Females per 100 Males in Waverly.
What is the Median Population Age in Waverly?
Median Population Age in Waverly is 57.2 Years.
What is the Average Family Size in Waverly
Average Family Size in Waverly is 2.6 People.
What is the Average Household Size in Waverly
Average Household Size in Waverly is 2.4 People.
How Large is the Labor Force in Waverly?
There are 119 People in the Labor Forcein in Waverly.
What is the Percentage of People in the Labor Force in Waverly?
54.6% of People are in the Labor Force in Waverly.
What is the Unemployment Rate in Waverly?
Unemployment Rate in Waverly is 1.7%.