Haleyville, AL Map & Demographics
Haleyville Map
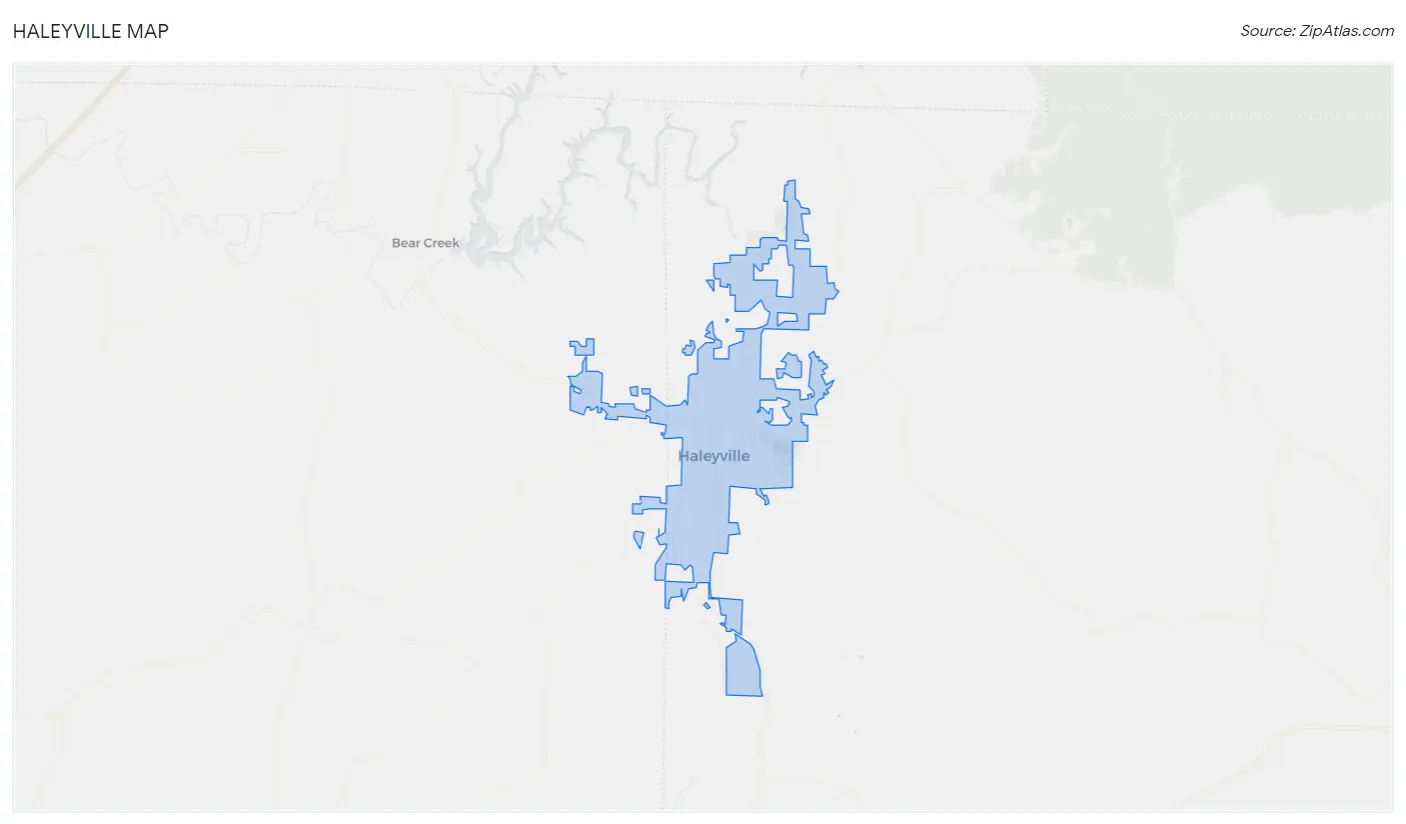
Haleyville Overview
$24,202
PER CAPITA INCOME
$56,734
AVG FAMILY INCOME
$52,656
AVG HOUSEHOLD INCOME
24.8%
WAGE / INCOME GAP [ % ]
75.2¢/ $1
WAGE / INCOME GAP [ $ ]
0.47
INEQUALITY / GINI INDEX
4,339
TOTAL POPULATION
1,836
MALE POPULATION
2,503
FEMALE POPULATION
73.35
MALES / 100 FEMALES
136.33
FEMALES / 100 MALES
35.8
MEDIAN AGE
3.6
AVG FAMILY SIZE
2.9
AVG HOUSEHOLD SIZE
1,932
LABOR FORCE [ PEOPLE ]
55.4%
PERCENT IN LABOR FORCE
5.9%
UNEMPLOYMENT RATE
Haleyville Zip Codes
Haleyville Area Codes
Income in Haleyville
Income Overview in Haleyville
Per Capita Income in Haleyville is $24,202, while median incomes of families and households are $56,734 and $52,656 respectively.
| Characteristic | Number | Measure |
| Per Capita Income | 4,339 | $24,202 |
| Median Family Income | 993 | $56,734 |
| Mean Family Income | 993 | $78,176 |
| Median Household Income | 1,429 | $52,656 |
| Mean Household Income | 1,429 | $65,011 |
| Income Deficit | 993 | $0 |
| Wage / Income Gap (%) | 4,339 | 24.75% |
| Wage / Income Gap ($) | 4,339 | 75.25¢ per $1 |
| Gini / Inequality Index | 4,339 | 0.47 |
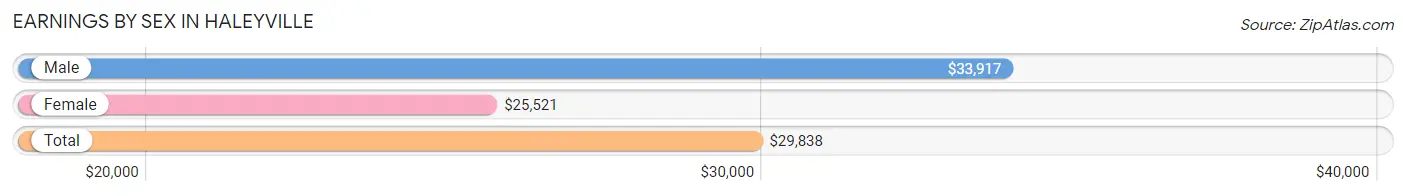
Earnings by Sex in Haleyville
Average Earnings in Haleyville are $29,838, $33,917 for men and $25,521 for women, a difference of 24.7%.
| Sex | Number | Average Earnings |
| Male | 1,074 (51.4%) | $33,917 |
| Female | 1,017 (48.6%) | $25,521 |
| Total | 2,091 (100.0%) | $29,838 |
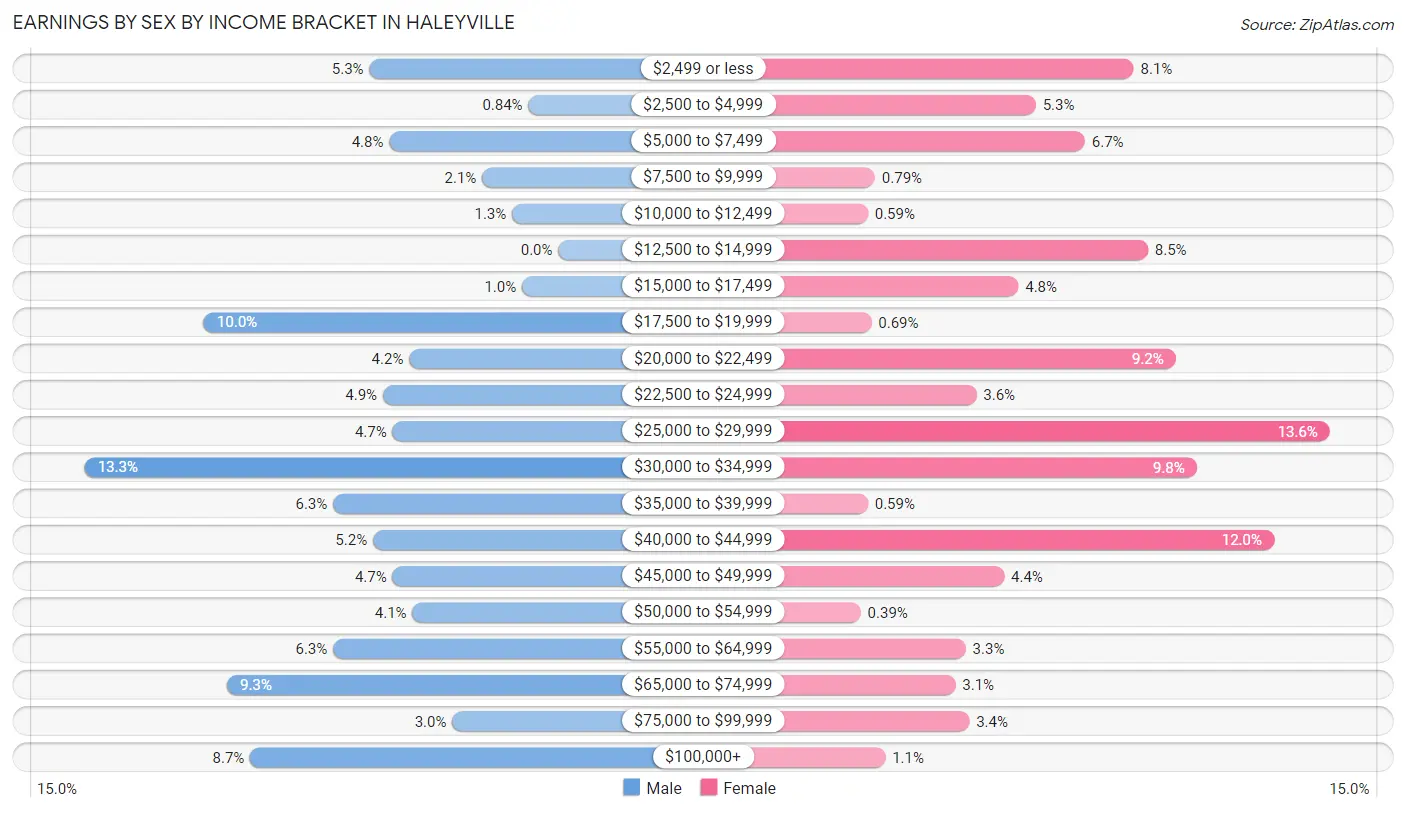
Earnings by Sex by Income Bracket in Haleyville
The most common earnings brackets in Haleyville are $30,000 to $34,999 for men (143 | 13.3%) and $25,000 to $29,999 for women (138 | 13.6%).
| Income | Male | Female |
| $2,499 or less | 57 (5.3%) | 82 (8.1%) |
| $2,500 to $4,999 | 9 (0.8%) | 54 (5.3%) |
| $5,000 to $7,499 | 51 (4.8%) | 68 (6.7%) |
| $7,500 to $9,999 | 23 (2.1%) | 8 (0.8%) |
| $10,000 to $12,499 | 14 (1.3%) | 6 (0.6%) |
| $12,500 to $14,999 | 0 (0.0%) | 86 (8.5%) |
| $15,000 to $17,499 | 11 (1.0%) | 49 (4.8%) |
| $17,500 to $19,999 | 107 (10.0%) | 7 (0.7%) |
| $20,000 to $22,499 | 45 (4.2%) | 94 (9.2%) |
| $22,500 to $24,999 | 53 (4.9%) | 37 (3.6%) |
| $25,000 to $29,999 | 50 (4.7%) | 138 (13.6%) |
| $30,000 to $34,999 | 143 (13.3%) | 100 (9.8%) |
| $35,000 to $39,999 | 68 (6.3%) | 6 (0.6%) |
| $40,000 to $44,999 | 56 (5.2%) | 122 (12.0%) |
| $45,000 to $49,999 | 50 (4.7%) | 45 (4.4%) |
| $50,000 to $54,999 | 44 (4.1%) | 4 (0.4%) |
| $55,000 to $64,999 | 68 (6.3%) | 34 (3.3%) |
| $65,000 to $74,999 | 100 (9.3%) | 31 (3.0%) |
| $75,000 to $99,999 | 32 (3.0%) | 35 (3.4%) |
| $100,000+ | 93 (8.7%) | 11 (1.1%) |
| Total | 1,074 (100.0%) | 1,017 (100.0%) |
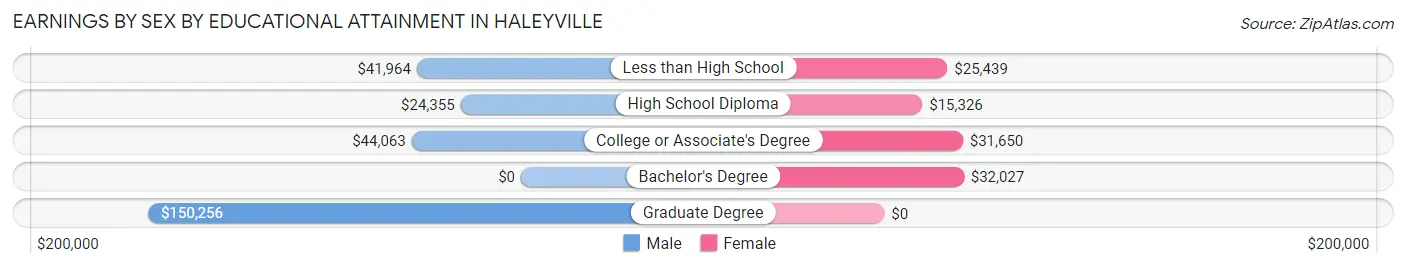
Earnings by Sex by Educational Attainment in Haleyville
Average earnings in Haleyville are $42,350 for men and $27,455 for women, a difference of 35.2%. Men with an educational attainment of graduate degree enjoy the highest average annual earnings of $150,256, while those with high school diploma education earn the least with $24,355. Women with an educational attainment of bachelor's degree earn the most with the average annual earnings of $32,027, while those with high school diploma education have the smallest earnings of $15,326.
| Educational Attainment | Male Income | Female Income |
| Less than High School | $41,964 | $25,439 |
| High School Diploma | $24,355 | $15,326 |
| College or Associate's Degree | $44,063 | $31,650 |
| Bachelor's Degree | - | - |
| Graduate Degree | $150,256 | $0 |
| Total | $42,350 | $27,455 |
Family Income in Haleyville
Family Income Brackets in Haleyville
According to the Haleyville family income data, there are 297 families falling into the $50,000 to $74,999 income range, which is the most common income bracket and makes up 29.9% of all families.
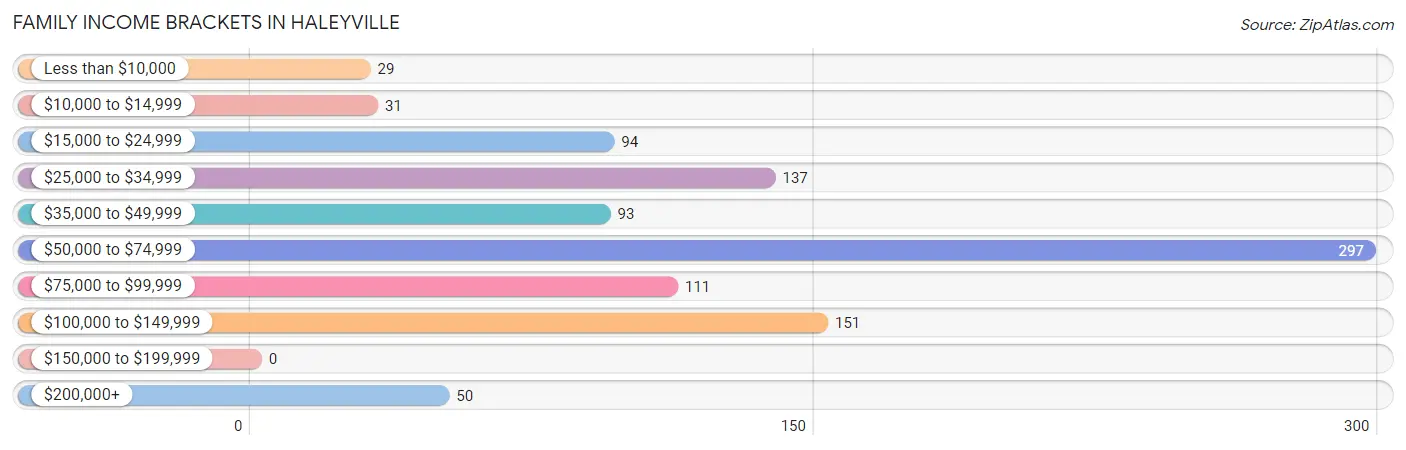
| Income Bracket | # Families | % Families |
| Less than $10,000 | 29 | 2.9% |
| $10,000 to $14,999 | 31 | 3.1% |
| $15,000 to $24,999 | 94 | 9.5% |
| $25,000 to $34,999 | 137 | 13.8% |
| $35,000 to $49,999 | 93 | 9.4% |
| $50,000 to $74,999 | 297 | 29.9% |
| $75,000 to $99,999 | 111 | 11.2% |
| $100,000 to $149,999 | 151 | 15.2% |
| $150,000 to $199,999 | 0 | 0.0% |
| $200,000+ | 50 | 5.0% |
Family Income by Famaliy Size in Haleyville
4-person families (136 | 13.7%) account for the highest median family income in Haleyville with $70,592 per family, while 3-person families (242 | 24.4%) have the highest median income of $21,313 per family member.
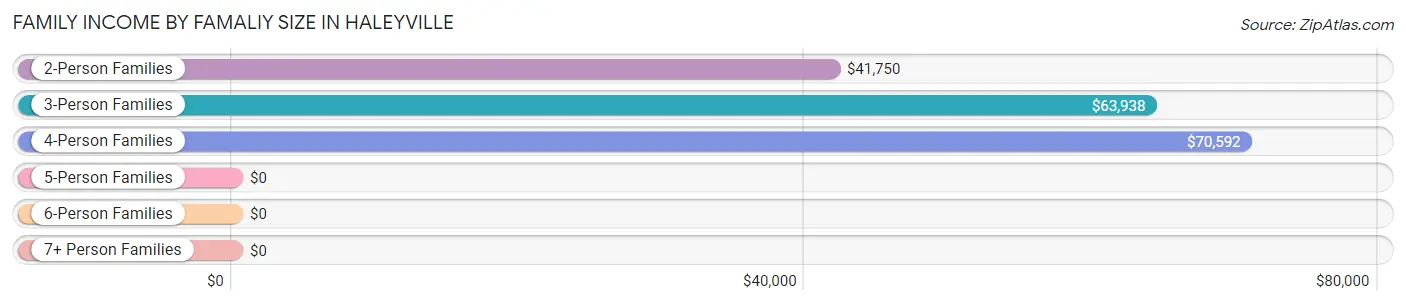
| Income Bracket | # Families | Median Income |
| 2-Person Families | 417 (42.0%) | $41,750 |
| 3-Person Families | 242 (24.4%) | $63,938 |
| 4-Person Families | 136 (13.7%) | $70,592 |
| 5-Person Families | 108 (10.9%) | $0 |
| 6-Person Families | 70 (7.0%) | $0 |
| 7+ Person Families | 20 (2.0%) | $0 |
| Total | 993 (100.0%) | $56,734 |
Family Income by Number of Earners in Haleyville
The median family income in Haleyville is $56,734, with families comprising 3+ earners (158) having the highest median family income of $121,838, while families with no earners (152) have the lowest median family income of $23,571, accounting for 15.9% and 15.3% of families, respectively.
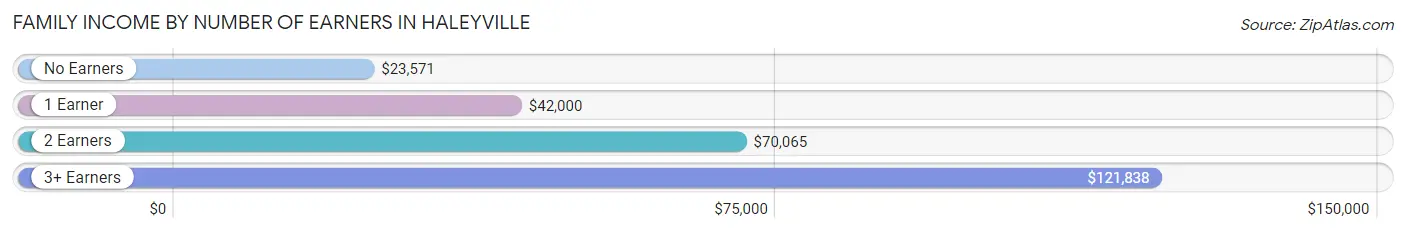
| Number of Earners | # Families | Median Income |
| No Earners | 152 (15.3%) | $23,571 |
| 1 Earner | 324 (32.6%) | $42,000 |
| 2 Earners | 359 (36.1%) | $70,065 |
| 3+ Earners | 158 (15.9%) | $121,838 |
| Total | 993 (100.0%) | $56,734 |
Household Income in Haleyville
Household Income Brackets in Haleyville
With 386 households falling in the category, the $50,000 to $74,999 income range is the most frequent in Haleyville, accounting for 27.0% of all households.
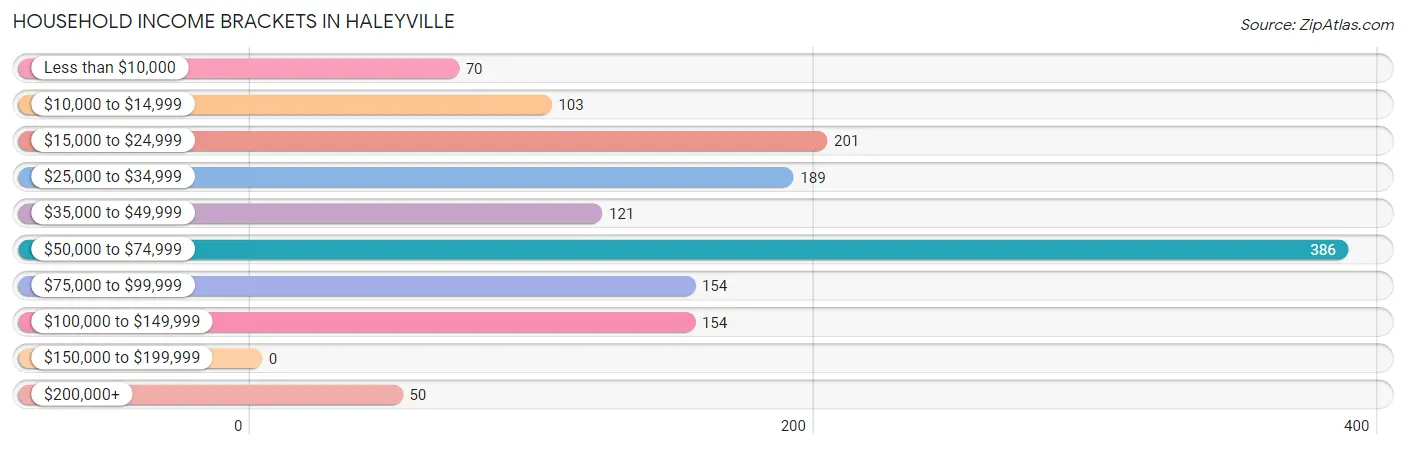
| Income Bracket | # Households | % Households |
| Less than $10,000 | 70 | 4.9% |
| $10,000 to $14,999 | 103 | 7.2% |
| $15,000 to $24,999 | 201 | 14.1% |
| $25,000 to $34,999 | 189 | 13.2% |
| $35,000 to $49,999 | 121 | 8.5% |
| $50,000 to $74,999 | 386 | 27.0% |
| $75,000 to $99,999 | 154 | 10.8% |
| $100,000 to $149,999 | 154 | 10.8% |
| $150,000 to $199,999 | 0 | 0.0% |
| $200,000+ | 50 | 3.5% |
Household Income by Householder Age in Haleyville
The median household income in Haleyville is $52,656, with the highest median household income of $62,594 found in the 25 to 44 years age bracket for the primary householder. A total of 441 households (30.9%) fall into this category. Meanwhile, the 15 to 24 years age bracket for the primary householder has the lowest median household income of $0, with 38 households (2.7%) in this group.
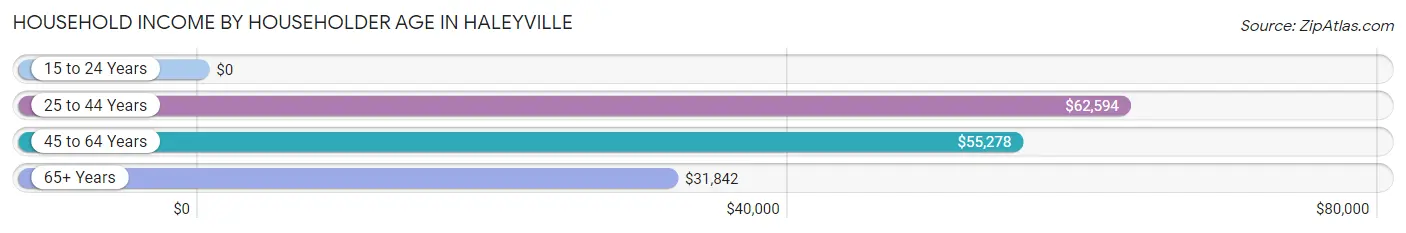
| Income Bracket | # Households | Median Income |
| 15 to 24 Years | 38 (2.7%) | $0 |
| 25 to 44 Years | 441 (30.9%) | $62,594 |
| 45 to 64 Years | 528 (36.9%) | $55,278 |
| 65+ Years | 422 (29.5%) | $31,842 |
| Total | 1,429 (100.0%) | $52,656 |
Poverty in Haleyville
Income Below Poverty by Sex and Age in Haleyville
With 8.9% poverty level for males and 18.6% for females among the residents of Haleyville, 12 to 14 year old males and 16 and 17 year old females are the most vulnerable to poverty, with 35 males (46.1%) and 12 females (36.4%) in their respective age groups living below the poverty level.
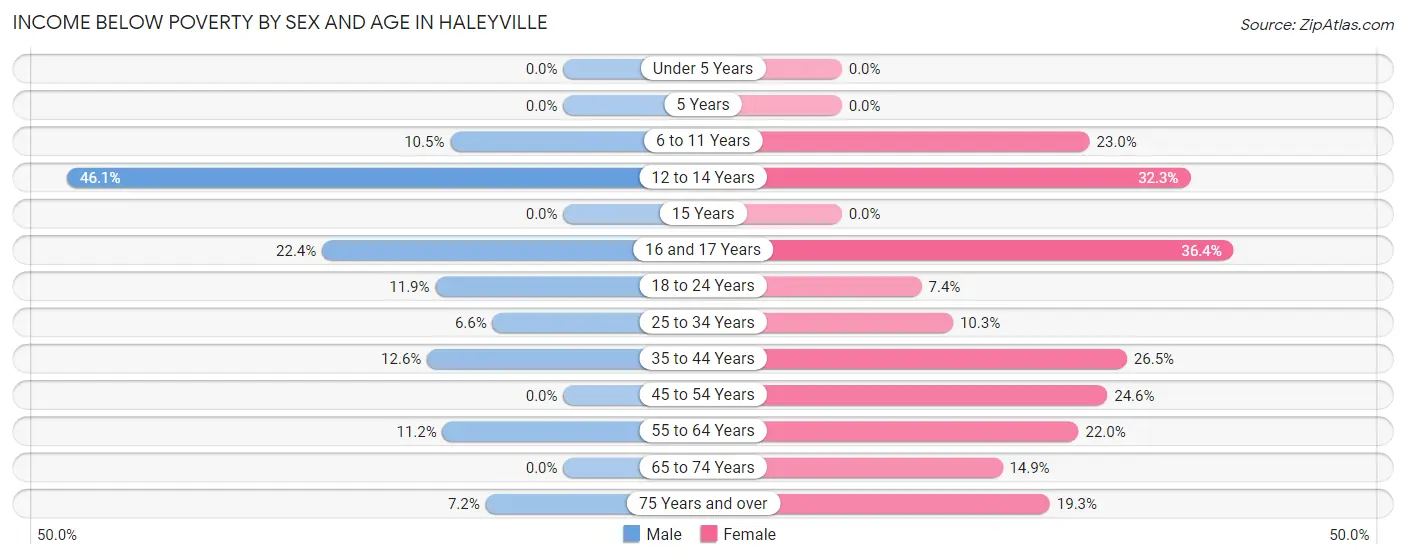
| Age Bracket | Male | Female |
| Under 5 Years | 0 (0.0%) | 0 (0.0%) |
| 5 Years | 0 (0.0%) | 0 (0.0%) |
| 6 to 11 Years | 19 (10.5%) | 46 (23.0%) |
| 12 to 14 Years | 35 (46.1%) | 43 (32.3%) |
| 15 Years | 0 (0.0%) | 0 (0.0%) |
| 16 and 17 Years | 15 (22.4%) | 12 (36.4%) |
| 18 to 24 Years | 24 (11.9%) | 18 (7.4%) |
| 25 to 34 Years | 26 (6.6%) | 35 (10.3%) |
| 35 to 44 Years | 23 (12.6%) | 59 (26.5%) |
| 45 to 54 Years | 0 (0.0%) | 86 (24.6%) |
| 55 to 64 Years | 13 (11.2%) | 69 (22.0%) |
| 65 to 74 Years | 0 (0.0%) | 34 (14.9%) |
| 75 Years and over | 7 (7.2%) | 39 (19.3%) |
| Total | 162 (8.9%) | 441 (18.6%) |
Income Above Poverty by Sex and Age in Haleyville
According to the poverty statistics in Haleyville, males aged under 5 years and females aged under 5 years are the age groups that are most secure financially, with 100.0% of males and 100.0% of females in these age groups living above the poverty line.
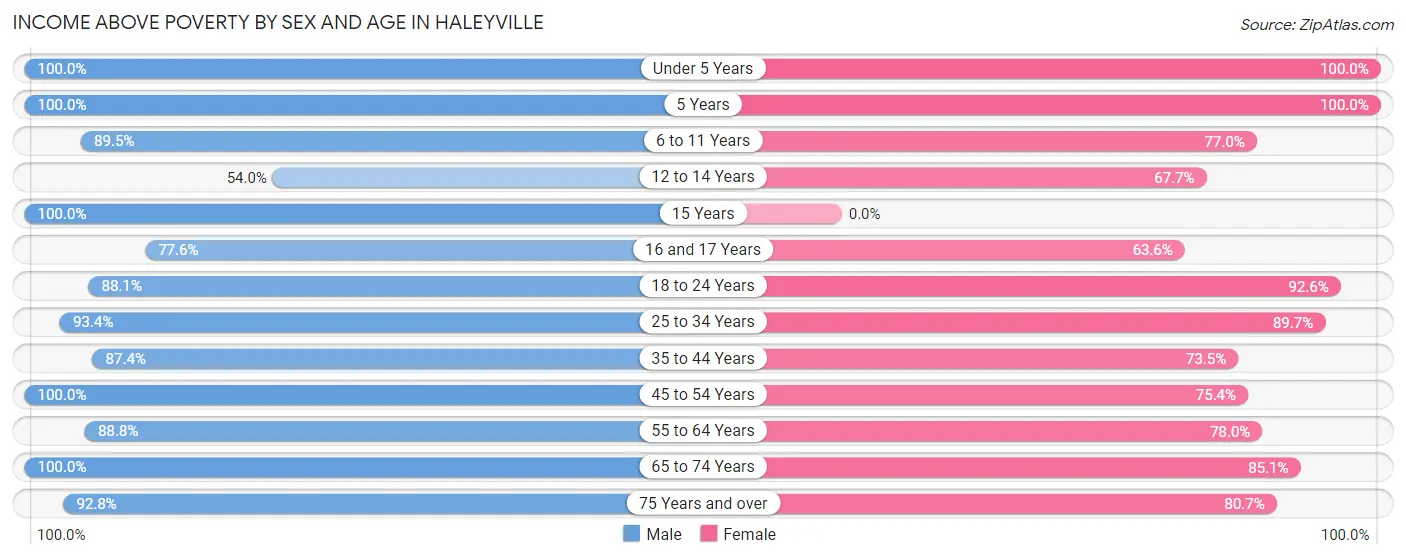
| Age Bracket | Male | Female |
| Under 5 Years | 106 (100.0%) | 85 (100.0%) |
| 5 Years | 21 (100.0%) | 26 (100.0%) |
| 6 to 11 Years | 162 (89.5%) | 154 (77.0%) |
| 12 to 14 Years | 41 (53.9%) | 90 (67.7%) |
| 15 Years | 15 (100.0%) | 0 (0.0%) |
| 16 and 17 Years | 52 (77.6%) | 21 (63.6%) |
| 18 to 24 Years | 178 (88.1%) | 225 (92.6%) |
| 25 to 34 Years | 370 (93.4%) | 304 (89.7%) |
| 35 to 44 Years | 159 (87.4%) | 164 (73.5%) |
| 45 to 54 Years | 189 (100.0%) | 263 (75.4%) |
| 55 to 64 Years | 103 (88.8%) | 245 (78.0%) |
| 65 to 74 Years | 167 (100.0%) | 194 (85.1%) |
| 75 Years and over | 90 (92.8%) | 163 (80.7%) |
| Total | 1,653 (91.1%) | 1,934 (81.4%) |
Income Below Poverty Among Married-Couple Families in Haleyville
The poverty statistics for married-couple families in Haleyville show that 4.9% or 31 of the total 637 families live below the poverty line. Families with 3 or 4 children have the highest poverty rate of 13.4%, comprising of 15 families. On the other hand, families with no children have the lowest poverty rate of 0.0%, which includes 0 families.
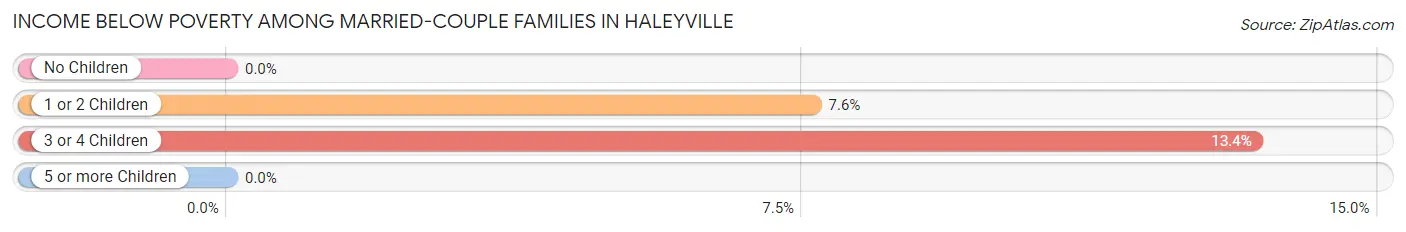
| Children | Above Poverty | Below Poverty |
| No Children | 315 (100.0%) | 0 (0.0%) |
| 1 or 2 Children | 194 (92.4%) | 16 (7.6%) |
| 3 or 4 Children | 97 (86.6%) | 15 (13.4%) |
| 5 or more Children | 0 (0.0%) | 0 (0.0%) |
| Total | 606 (95.1%) | 31 (4.9%) |
Income Below Poverty Among Single-Parent Households in Haleyville
According to the poverty data in Haleyville, 17.2% or 5 single-father households and 22.3% or 73 single-mother households are living below the poverty line. Among single-father households, those with no children have the highest poverty rate, with 5 households (17.2%) experiencing poverty. Likewise, among single-mother households, those with 3 or 4 children have the highest poverty rate, with 11 households (100.0%) falling below the poverty line.
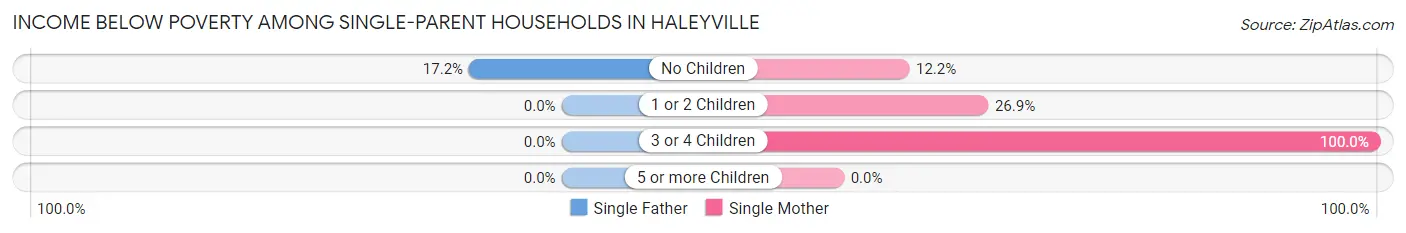
| Children | Single Father | Single Mother |
| No Children | 5 (17.2%) | 19 (12.2%) |
| 1 or 2 Children | 0 (0.0%) | 43 (26.9%) |
| 3 or 4 Children | 0 (0.0%) | 11 (100.0%) |
| 5 or more Children | 0 (0.0%) | 0 (0.0%) |
| Total | 5 (17.2%) | 73 (22.3%) |
Income Below Poverty Among Married-Couple vs Single-Parent Households in Haleyville
The poverty data for Haleyville shows that 31 of the married-couple family households (4.9%) and 78 of the single-parent households (21.9%) are living below the poverty level. Within the married-couple family households, those with 3 or 4 children have the highest poverty rate, with 15 households (13.4%) falling below the poverty line. Among the single-parent households, those with 3 or 4 children have the highest poverty rate, with 11 household (100.0%) living below poverty.
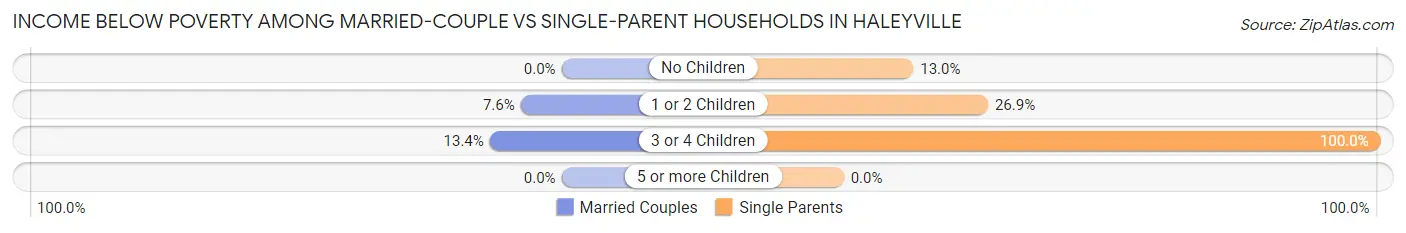
| Children | Married-Couple Families | Single-Parent Households |
| No Children | 0 (0.0%) | 24 (13.0%) |
| 1 or 2 Children | 16 (7.6%) | 43 (26.9%) |
| 3 or 4 Children | 15 (13.4%) | 11 (100.0%) |
| 5 or more Children | 0 (0.0%) | 0 (0.0%) |
| Total | 31 (4.9%) | 78 (21.9%) |
Race in Haleyville
The most populous races in Haleyville are White / Caucasian (3,880 | 89.4%), Hispanic or Latino (462 | 10.6%), and Some other Race (325 | 7.5%).
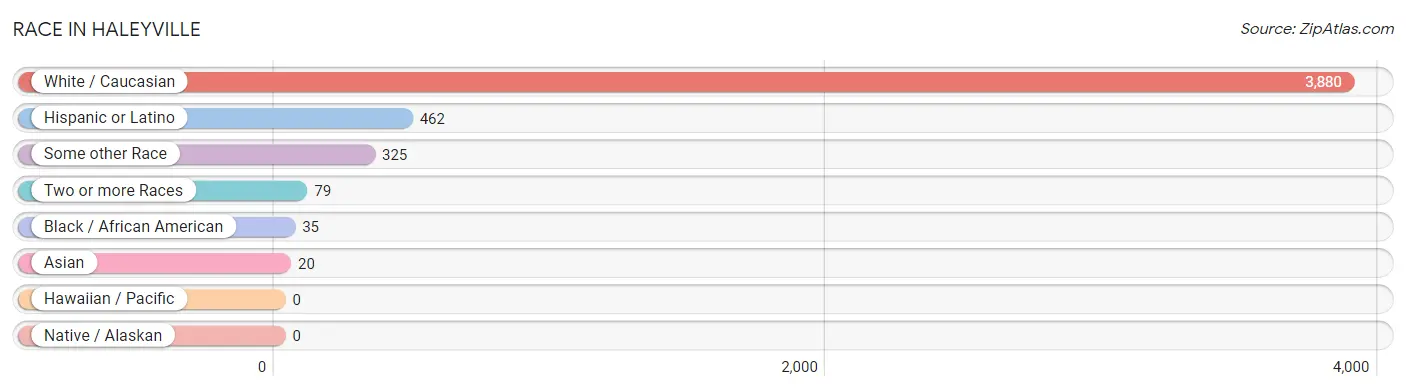
| Race | # Population | % Population |
| Asian | 20 | 0.5% |
| Black / African American | 35 | 0.8% |
| Hawaiian / Pacific | 0 | 0.0% |
| Hispanic or Latino | 462 | 10.6% |
| Native / Alaskan | 0 | 0.0% |
| White / Caucasian | 3,880 | 89.4% |
| Two or more Races | 79 | 1.8% |
| Some other Race | 325 | 7.5% |
| Total | 4,339 | 100.0% |
Ancestry in Haleyville
The most populous ancestries reported in Haleyville are American (1,062 | 24.5%), Irish (453 | 10.4%), English (343 | 7.9%), Central American (310 | 7.1%), and Guatemalan (310 | 7.1%), together accounting for 57.1% of all Haleyville residents.
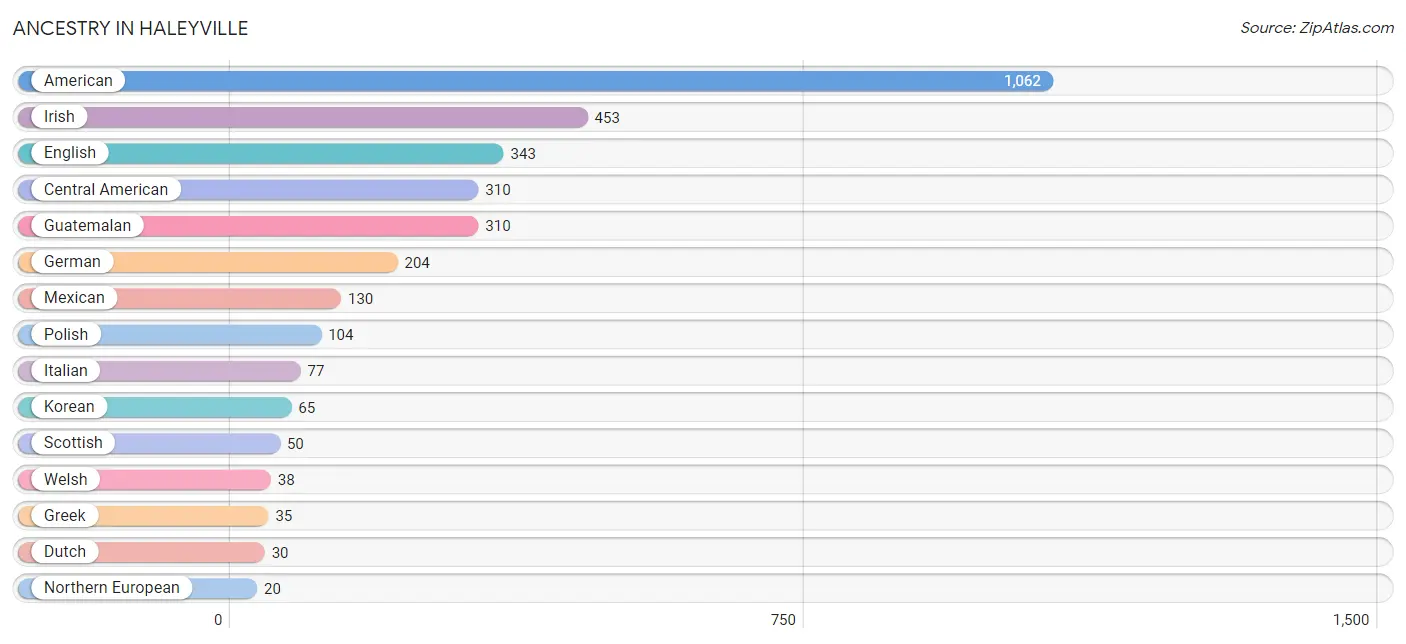
| Ancestry | # Population | % Population |
| American | 1,062 | 24.5% |
| British | 15 | 0.4% |
| Central American | 310 | 7.1% |
| Cherokee | 8 | 0.2% |
| Dutch | 30 | 0.7% |
| English | 343 | 7.9% |
| German | 204 | 4.7% |
| Greek | 35 | 0.8% |
| Guatemalan | 310 | 7.1% |
| Irish | 453 | 10.4% |
| Italian | 77 | 1.8% |
| Korean | 65 | 1.5% |
| Mexican | 130 | 3.0% |
| Northern European | 20 | 0.5% |
| Polish | 104 | 2.4% |
| Scotch-Irish | 9 | 0.2% |
| Scottish | 50 | 1.1% |
| Swedish | 17 | 0.4% |
| Welsh | 38 | 0.9% | View All 19 Rows |
Immigrants in Haleyville
The most numerous immigrant groups reported in Haleyville came from Central America (239 | 5.5%), Latin America (239 | 5.5%), Guatemala (188 | 4.3%), Mexico (51 | 1.2%), and Asia (17 | 0.4%), together accounting for 16.9% of all Haleyville residents.
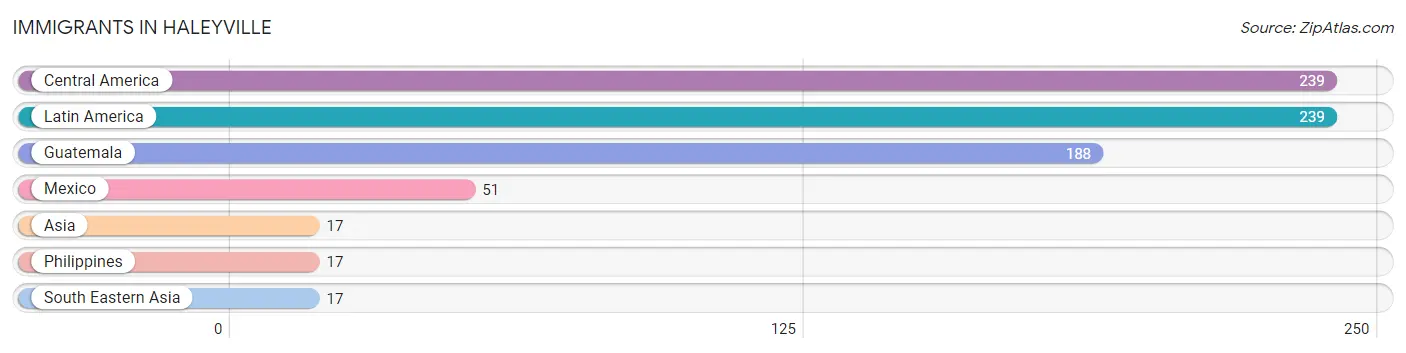
| Immigration Origin | # Population | % Population |
| Asia | 17 | 0.4% |
| Central America | 239 | 5.5% |
| Guatemala | 188 | 4.3% |
| Latin America | 239 | 5.5% |
| Mexico | 51 | 1.2% |
| Philippines | 17 | 0.4% |
| South Eastern Asia | 17 | 0.4% | View All 7 Rows |
Sex and Age in Haleyville
Sex and Age in Haleyville
The most populous age groups in Haleyville are 30 to 34 Years (222 | 12.1%) for men and 10 to 14 Years (248 | 9.9%) for women.
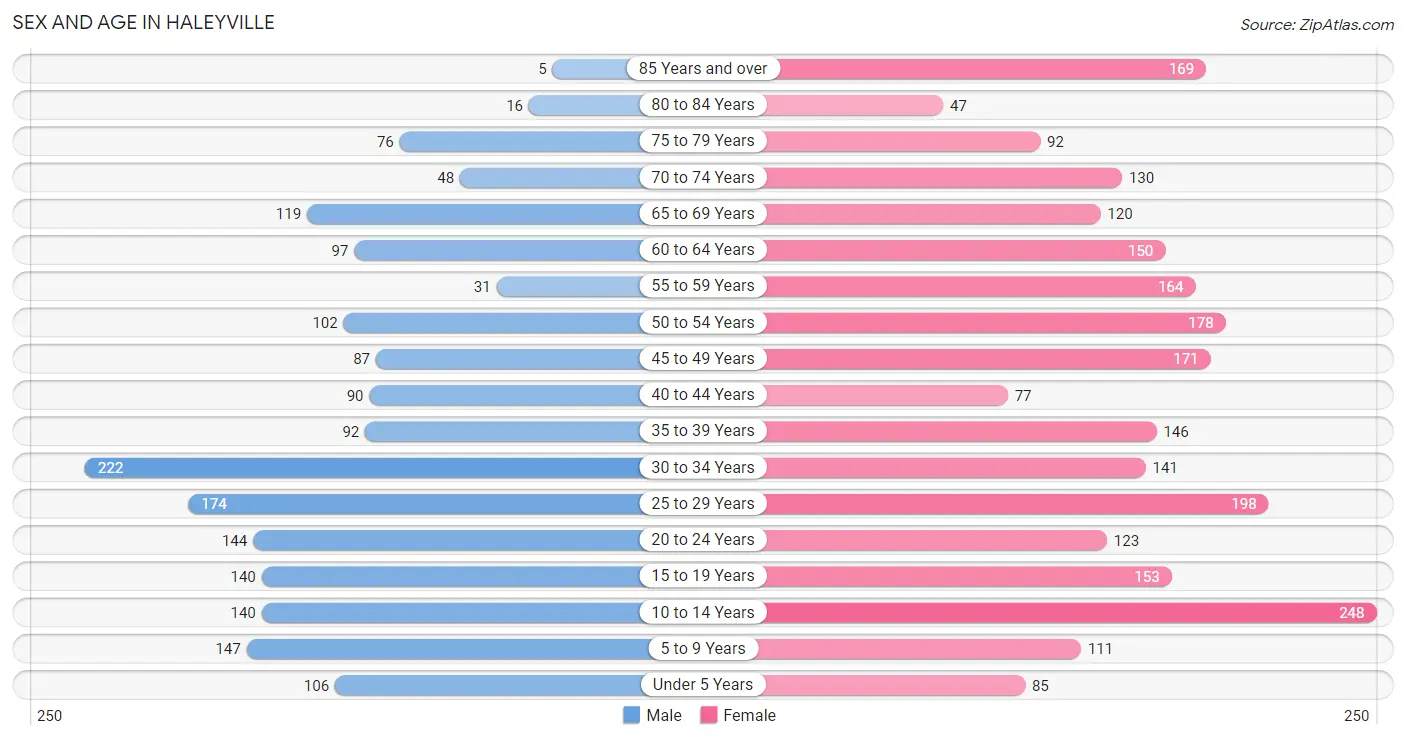
| Age Bracket | Male | Female |
| Under 5 Years | 106 (5.8%) | 85 (3.4%) |
| 5 to 9 Years | 147 (8.0%) | 111 (4.4%) |
| 10 to 14 Years | 140 (7.6%) | 248 (9.9%) |
| 15 to 19 Years | 140 (7.6%) | 153 (6.1%) |
| 20 to 24 Years | 144 (7.8%) | 123 (4.9%) |
| 25 to 29 Years | 174 (9.5%) | 198 (7.9%) |
| 30 to 34 Years | 222 (12.1%) | 141 (5.6%) |
| 35 to 39 Years | 92 (5.0%) | 146 (5.8%) |
| 40 to 44 Years | 90 (4.9%) | 77 (3.1%) |
| 45 to 49 Years | 87 (4.7%) | 171 (6.8%) |
| 50 to 54 Years | 102 (5.6%) | 178 (7.1%) |
| 55 to 59 Years | 31 (1.7%) | 164 (6.6%) |
| 60 to 64 Years | 97 (5.3%) | 150 (6.0%) |
| 65 to 69 Years | 119 (6.5%) | 120 (4.8%) |
| 70 to 74 Years | 48 (2.6%) | 130 (5.2%) |
| 75 to 79 Years | 76 (4.1%) | 92 (3.7%) |
| 80 to 84 Years | 16 (0.9%) | 47 (1.9%) |
| 85 Years and over | 5 (0.3%) | 169 (6.8%) |
| Total | 1,836 (100.0%) | 2,503 (100.0%) |
Families and Households in Haleyville
Median Family Size in Haleyville
The median family size in Haleyville is 3.58 persons per family, with married-couple families (637 | 64.1%) accounting for the largest median family size of 3.91 persons per family. On the other hand, single male/father families (29 | 2.9%) represent the smallest median family size with 2.14 persons per family.
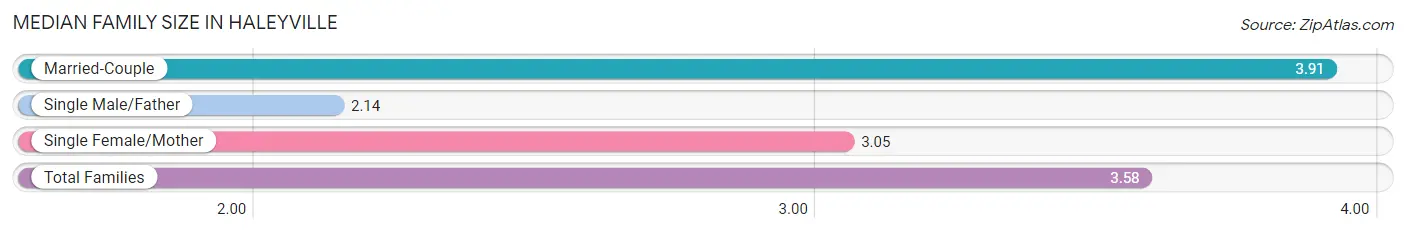
| Family Type | # Families | Family Size |
| Married-Couple | 637 (64.1%) | 3.91 |
| Single Male/Father | 29 (2.9%) | 2.14 |
| Single Female/Mother | 327 (32.9%) | 3.05 |
| Total Families | 993 (100.0%) | 3.58 |
Median Household Size in Haleyville
The median household size in Haleyville is 2.93 persons per household, with married-couple households (637 | 44.6%) accounting for the largest median household size of 3.94 persons per household. non-family households (436 | 30.5%) represent the smallest median household size with 1.24 persons per household.
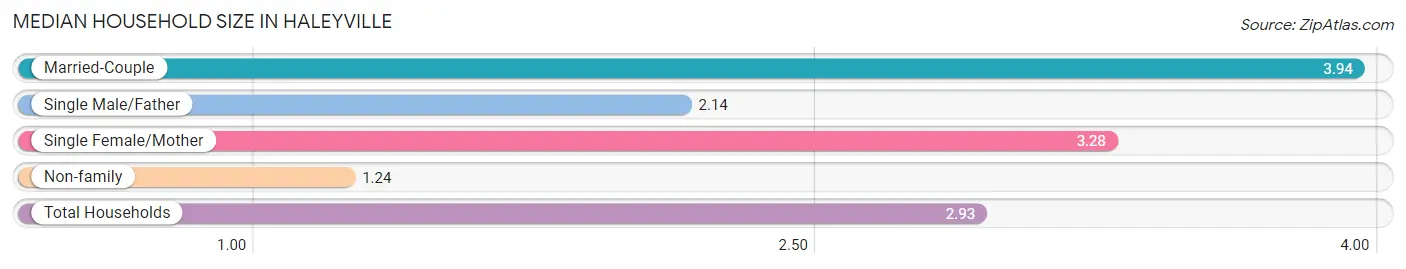
| Household Type | # Households | Household Size |
| Married-Couple | 637 (44.6%) | 3.94 |
| Single Male/Father | 29 (2.0%) | 2.14 |
| Single Female/Mother | 327 (22.9%) | 3.28 |
| Non-family | 436 (30.5%) | 1.24 |
| Total Households | 1,429 (100.0%) | 2.93 |
Household Size by Marriage Status in Haleyville
Out of a total of 1,429 households in Haleyville, 993 (69.5%) are family households, while 436 (30.5%) are nonfamily households. The most numerous type of family households are 2-person households, comprising 395, and the most common type of nonfamily households are 1-person households, comprising 365.
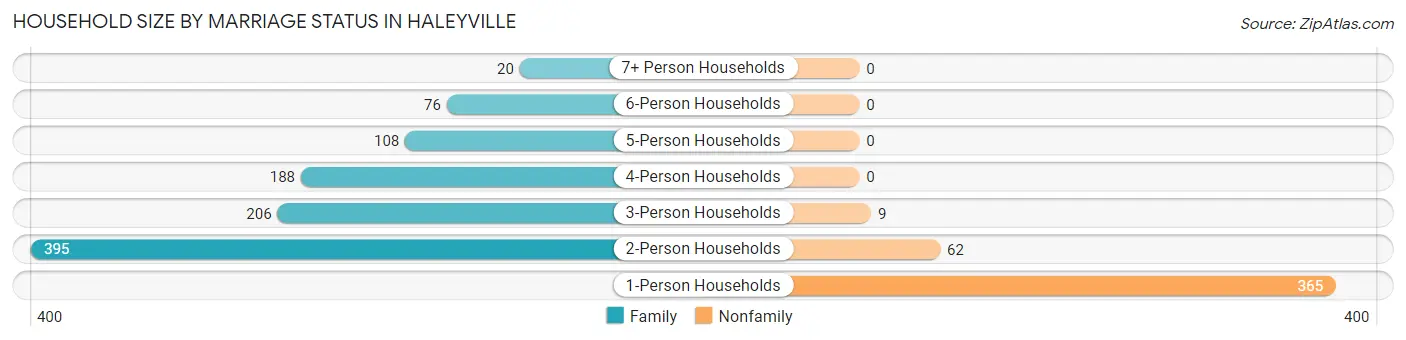
| Household Size | Family Households | Nonfamily Households |
| 1-Person Households | - | 365 (25.5%) |
| 2-Person Households | 395 (27.6%) | 62 (4.3%) |
| 3-Person Households | 206 (14.4%) | 9 (0.6%) |
| 4-Person Households | 188 (13.2%) | 0 (0.0%) |
| 5-Person Households | 108 (7.6%) | 0 (0.0%) |
| 6-Person Households | 76 (5.3%) | 0 (0.0%) |
| 7+ Person Households | 20 (1.4%) | 0 (0.0%) |
| Total | 993 (69.5%) | 436 (30.5%) |
Female Fertility in Haleyville
Fertility by Age in Haleyville
Average fertility rate in Haleyville is 69.0 births per 1,000 women. Women in the age bracket of 20 to 34 years have the highest fertility rate with 152.0 births per 1,000 women. Women in the age bracket of 20 to 34 years acount for 100.0% of all women with births.
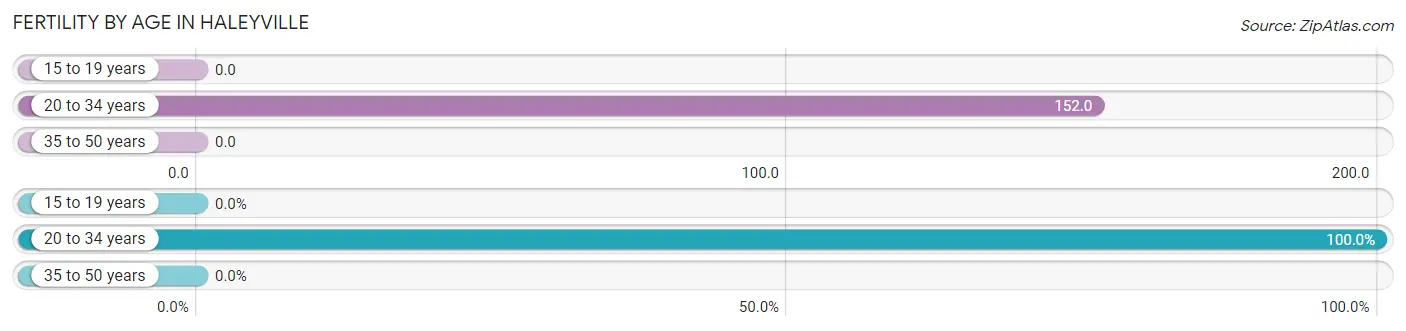
| Age Bracket | Women with Births | Births / 1,000 Women |
| 15 to 19 years | 0 (0.0%) | 0.0 |
| 20 to 34 years | 70 (100.0%) | 152.0 |
| 35 to 50 years | 0 (0.0%) | 0.0 |
| Total | 70 (100.0%) | 69.0 |
Fertility by Age by Marriage Status in Haleyville
52.9% of women with births (70) in Haleyville are married. The highest percentage of unmarried women with births falls into 20 to 34 years age bracket with 47.1% of them unmarried at the time of birth, while the lowest percentage of unmarried women with births belong to 20 to 34 years age bracket with 47.1% of them unmarried.
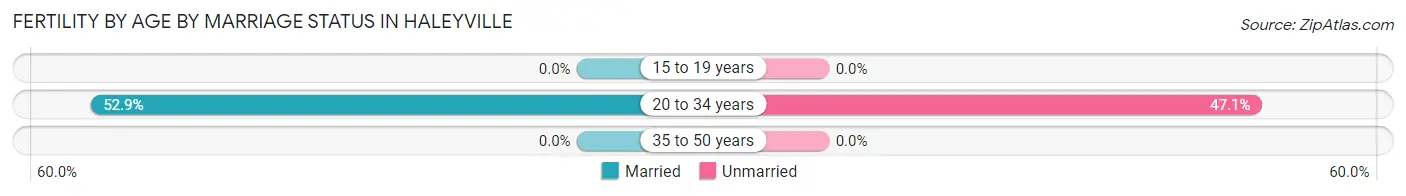
| Age Bracket | Married | Unmarried |
| 15 to 19 years | 0 (0.0%) | 0 (0.0%) |
| 20 to 34 years | 37 (52.9%) | 33 (47.1%) |
| 35 to 50 years | 0 (0.0%) | 0 (0.0%) |
| Total | 37 (52.9%) | 33 (47.1%) |
Fertility by Education in Haleyville
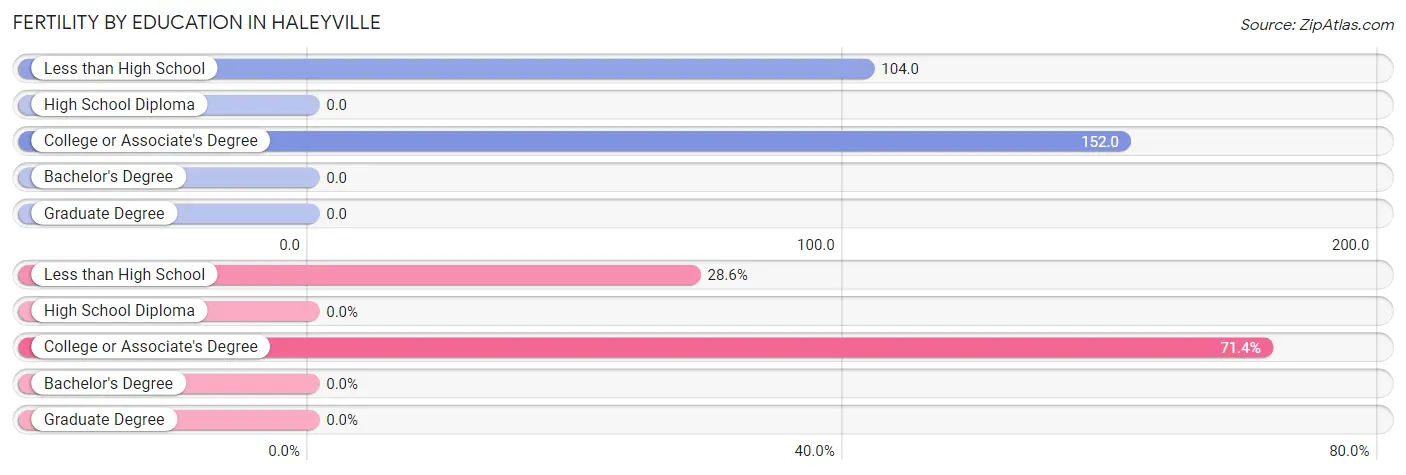
| Educational Attainment | Women with Births | Births / 1,000 Women |
| Less than High School | 20 (28.6%) | 104.0 |
| High School Diploma | 0 (0.0%) | 0.0 |
| College or Associate's Degree | 50 (71.4%) | 152.0 |
| Bachelor's Degree | 0 (0.0%) | 0.0 |
| Graduate Degree | 0 (0.0%) | 0.0 |
| Total | 70 (100.0%) | 69.0 |
Fertility by Education by Marriage Status in Haleyville
47.1% of women with births in Haleyville are unmarried. Women with the educational attainment of less than high school are most likely to be married with 100.0% of them married at childbirth, while women with the educational attainment of college or associate's degree are least likely to be married with 66.0% of them unmarried at childbirth.
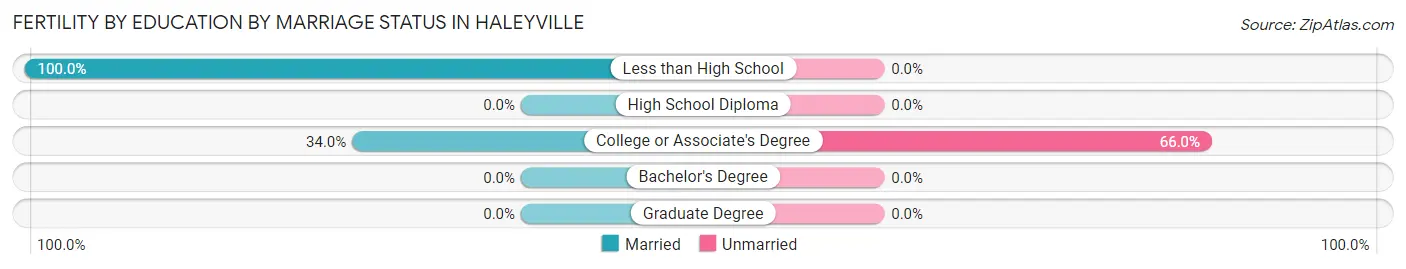
| Educational Attainment | Married | Unmarried |
| Less than High School | 20 (100.0%) | 0 (0.0%) |
| High School Diploma | 0 (0.0%) | 0 (0.0%) |
| College or Associate's Degree | 17 (34.0%) | 33 (66.0%) |
| Bachelor's Degree | 0 (0.0%) | 0 (0.0%) |
| Graduate Degree | 0 (0.0%) | 0 (0.0%) |
| Total | 37 (52.9%) | 33 (47.1%) |
Employment Characteristics in Haleyville
Employment by Class of Employer in Haleyville
Among the 1,796 employed individuals in Haleyville, private company employees (1,455 | 81.0%), self-employed (incorporated) (107 | 6.0%), and not-for-profit organizations (75 | 4.2%) make up the most common classes of employment.
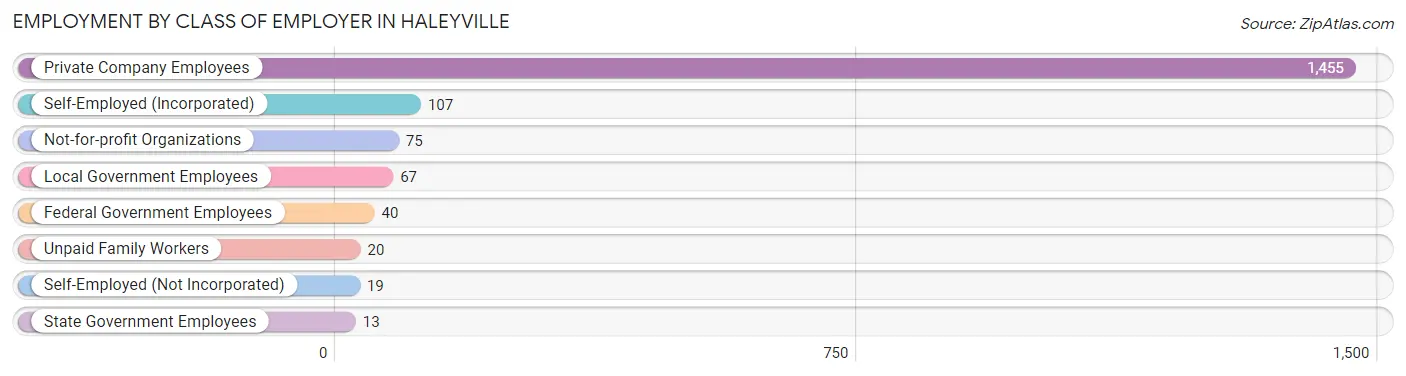
| Employer Class | # Employees | % Employees |
| Private Company Employees | 1,455 | 81.0% |
| Self-Employed (Incorporated) | 107 | 6.0% |
| Self-Employed (Not Incorporated) | 19 | 1.1% |
| Not-for-profit Organizations | 75 | 4.2% |
| Local Government Employees | 67 | 3.7% |
| State Government Employees | 13 | 0.7% |
| Federal Government Employees | 40 | 2.2% |
| Unpaid Family Workers | 20 | 1.1% |
| Total | 1,796 | 100.0% |
Employment Status by Age in Haleyville
According to the labor force statistics for Haleyville, out of the total population over 16 years of age (3,487), 55.4% or 1,932 individuals are in the labor force, with 5.9% or 114 of them unemployed. The age group with the highest labor force participation rate is 20 to 24 years, with 91.0% or 243 individuals in the labor force. Within the labor force, the 16 to 19 years age range has the highest percentage of unemployed individuals, with 24.5% or 25 of them being unemployed.
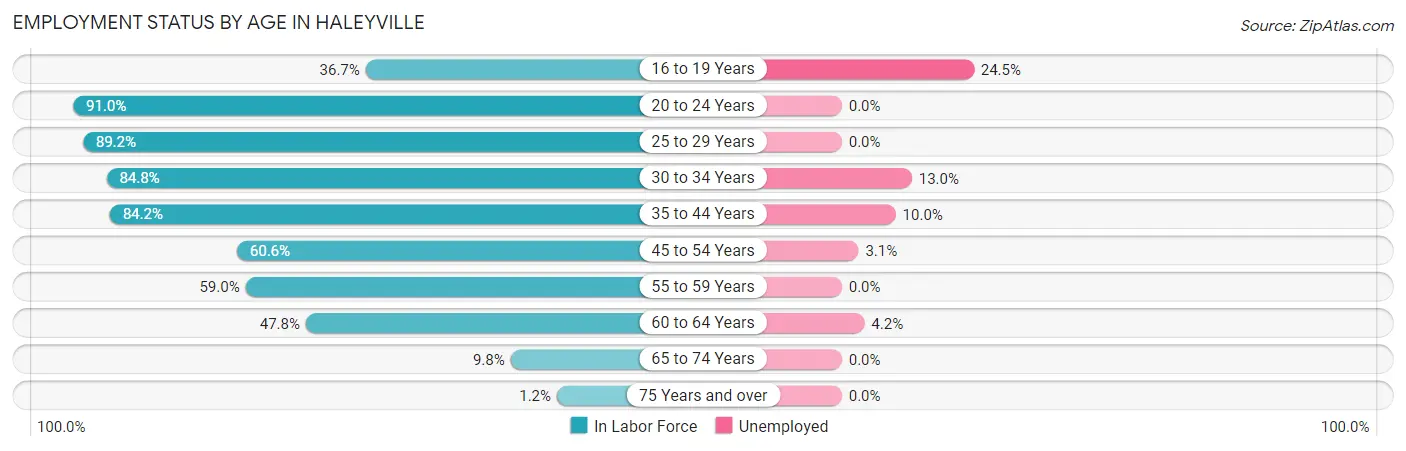
| Age Bracket | In Labor Force | Unemployed |
| 16 to 19 Years | 102 (36.7%) | 25 (24.5%) |
| 20 to 24 Years | 243 (91.0%) | 0 (0.0%) |
| 25 to 29 Years | 332 (89.2%) | 0 (0.0%) |
| 30 to 34 Years | 308 (84.8%) | 40 (13.0%) |
| 35 to 44 Years | 341 (84.2%) | 34 (10.0%) |
| 45 to 54 Years | 326 (60.6%) | 10 (3.1%) |
| 55 to 59 Years | 115 (59.0%) | 0 (0.0%) |
| 60 to 64 Years | 118 (47.8%) | 5 (4.2%) |
| 65 to 74 Years | 41 (9.8%) | 0 (0.0%) |
| 75 Years and over | 5 (1.2%) | 0 (0.0%) |
| Total | 1,932 (55.4%) | 114 (5.9%) |
Employment Status by Educational Attainment in Haleyville
According to labor force statistics for Haleyville, 72.6% of individuals (1,539) out of the total population between 25 and 64 years of age (2,120) are in the labor force, with 5.8% or 89 of them being unemployed. The group with the highest labor force participation rate are those with the educational attainment of bachelor's degree or higher, with 95.1% or 250 individuals in the labor force. Within the labor force, individuals with high school diploma education have the highest percentage of unemployment, with 7.7% or 39 of them being unemployed.
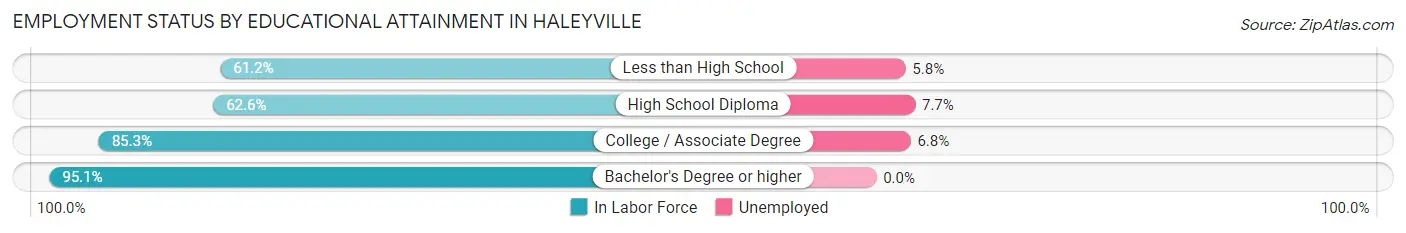
| Educational Attainment | In Labor Force | Unemployed |
| Less than High School | 278 (61.2%) | 26 (5.8%) |
| High School Diploma | 509 (62.6%) | 63 (7.7%) |
| College / Associate Degree | 503 (85.3%) | 40 (6.8%) |
| Bachelor's Degree or higher | 250 (95.1%) | 0 (0.0%) |
| Total | 1,539 (72.6%) | 123 (5.8%) |
Employment Occupations by Sex in Haleyville
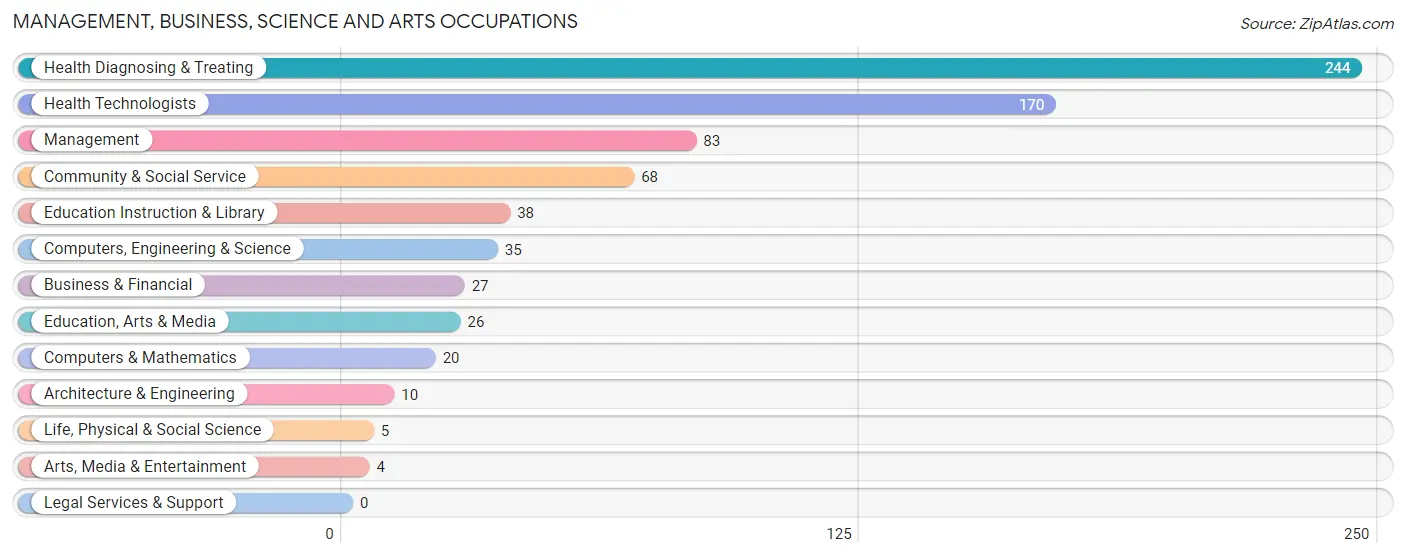
Management, Business, Science and Arts Occupations
The most common Management, Business, Science and Arts occupations in Haleyville are Health Diagnosing & Treating (244 | 13.4%), Health Technologists (170 | 9.4%), Management (83 | 4.6%), Community & Social Service (68 | 3.7%), and Education Instruction & Library (38 | 2.1%).
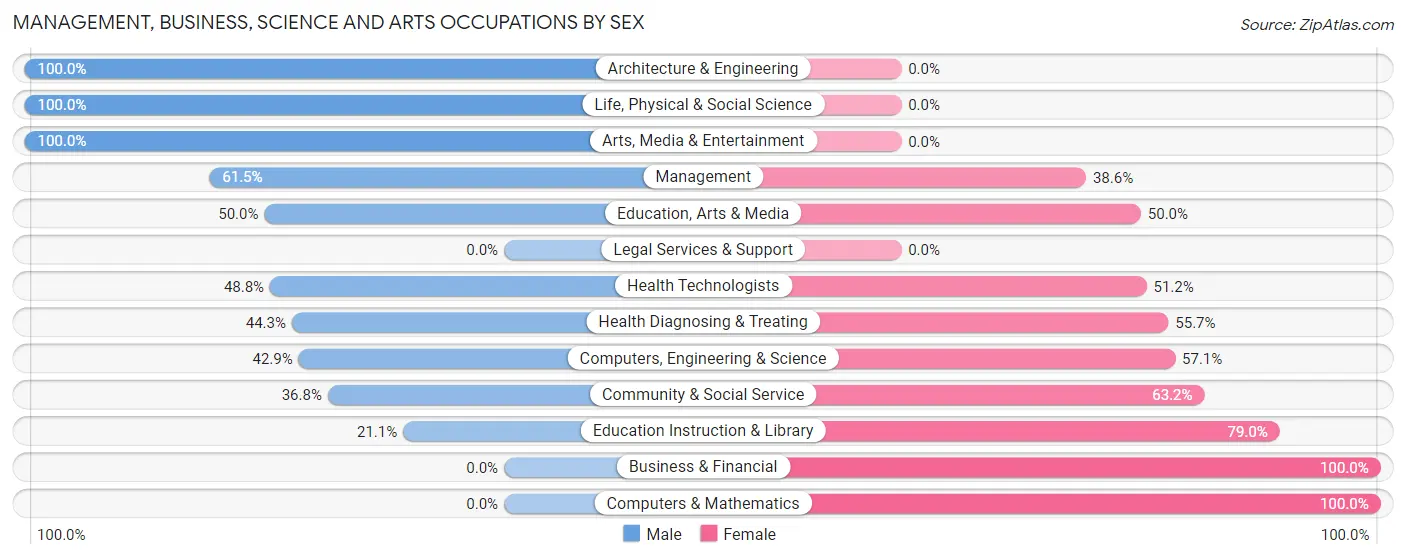
Management, Business, Science and Arts Occupations by Sex
Within the Management, Business, Science and Arts occupations in Haleyville, the most male-oriented occupations are Architecture & Engineering (100.0%), Life, Physical & Social Science (100.0%), and Arts, Media & Entertainment (100.0%), while the most female-oriented occupations are Business & Financial (100.0%), Computers & Mathematics (100.0%), and Education Instruction & Library (78.9%).
| Occupation | Male | Female |
| Management | 51 (61.5%) | 32 (38.6%) |
| Business & Financial | 0 (0.0%) | 27 (100.0%) |
| Computers, Engineering & Science | 15 (42.9%) | 20 (57.1%) |
| Computers & Mathematics | 0 (0.0%) | 20 (100.0%) |
| Architecture & Engineering | 10 (100.0%) | 0 (0.0%) |
| Life, Physical & Social Science | 5 (100.0%) | 0 (0.0%) |
| Community & Social Service | 25 (36.8%) | 43 (63.2%) |
| Education, Arts & Media | 13 (50.0%) | 13 (50.0%) |
| Legal Services & Support | 0 (0.0%) | 0 (0.0%) |
| Education Instruction & Library | 8 (21.0%) | 30 (78.9%) |
| Arts, Media & Entertainment | 4 (100.0%) | 0 (0.0%) |
| Health Diagnosing & Treating | 108 (44.3%) | 136 (55.7%) |
| Health Technologists | 83 (48.8%) | 87 (51.2%) |
| Total (Category) | 199 (43.5%) | 258 (56.5%) |
| Total (Overall) | 982 (54.0%) | 835 (46.0%) |
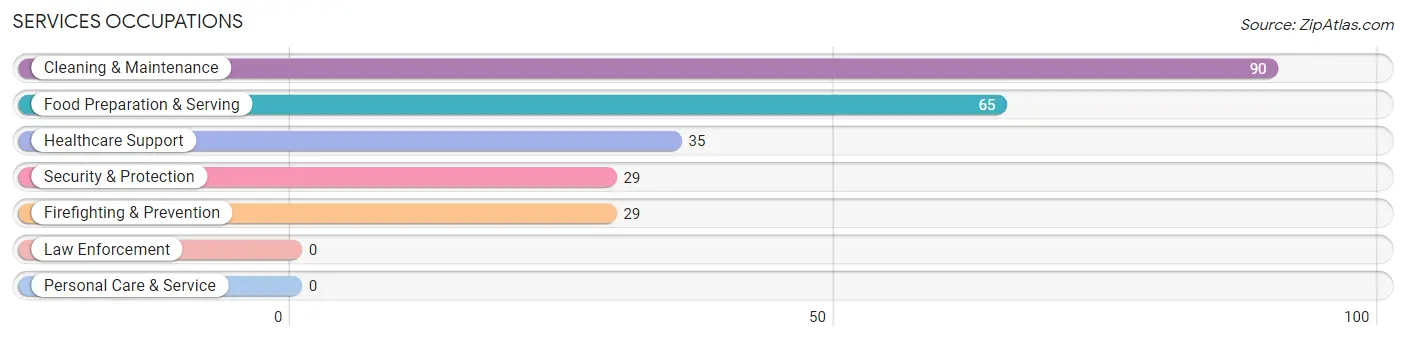
Services Occupations
The most common Services occupations in Haleyville are Cleaning & Maintenance (90 | 5.0%), Food Preparation & Serving (65 | 3.6%), Healthcare Support (35 | 1.9%), Security & Protection (29 | 1.6%), and Firefighting & Prevention (29 | 1.6%).
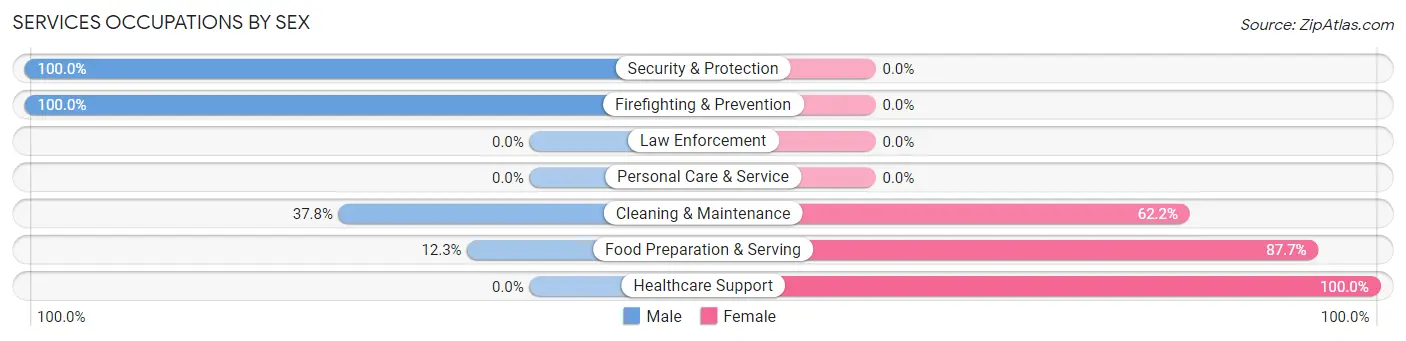
Services Occupations by Sex
Within the Services occupations in Haleyville, the most male-oriented occupations are Security & Protection (100.0%), Firefighting & Prevention (100.0%), and Cleaning & Maintenance (37.8%), while the most female-oriented occupations are Healthcare Support (100.0%), Food Preparation & Serving (87.7%), and Cleaning & Maintenance (62.2%).
| Occupation | Male | Female |
| Healthcare Support | 0 (0.0%) | 35 (100.0%) |
| Security & Protection | 29 (100.0%) | 0 (0.0%) |
| Firefighting & Prevention | 29 (100.0%) | 0 (0.0%) |
| Law Enforcement | 0 (0.0%) | 0 (0.0%) |
| Food Preparation & Serving | 8 (12.3%) | 57 (87.7%) |
| Cleaning & Maintenance | 34 (37.8%) | 56 (62.2%) |
| Personal Care & Service | 0 (0.0%) | 0 (0.0%) |
| Total (Category) | 71 (32.4%) | 148 (67.6%) |
| Total (Overall) | 982 (54.0%) | 835 (46.0%) |
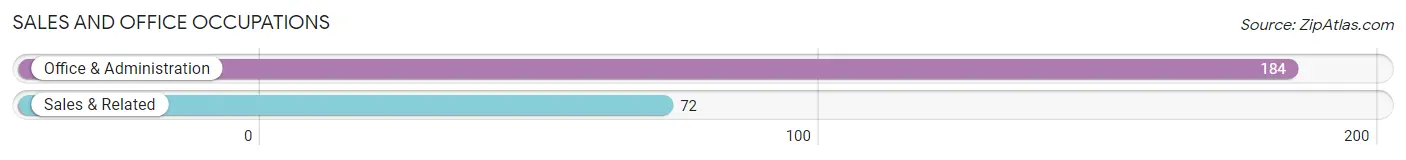
Sales and Office Occupations
The most common Sales and Office occupations in Haleyville are Office & Administration (184 | 10.1%), and Sales & Related (72 | 4.0%).
Sales and Office Occupations by Sex
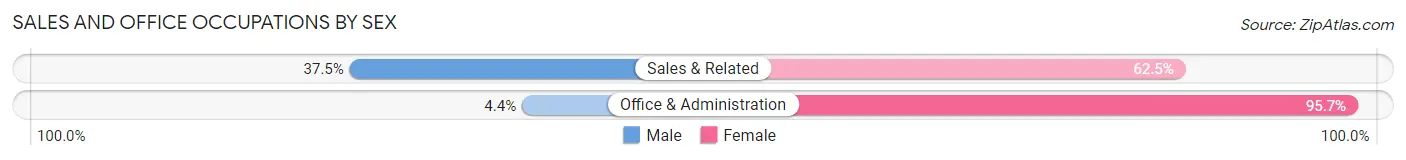
| Occupation | Male | Female |
| Sales & Related | 27 (37.5%) | 45 (62.5%) |
| Office & Administration | 8 (4.3%) | 176 (95.7%) |
| Total (Category) | 35 (13.7%) | 221 (86.3%) |
| Total (Overall) | 982 (54.0%) | 835 (46.0%) |
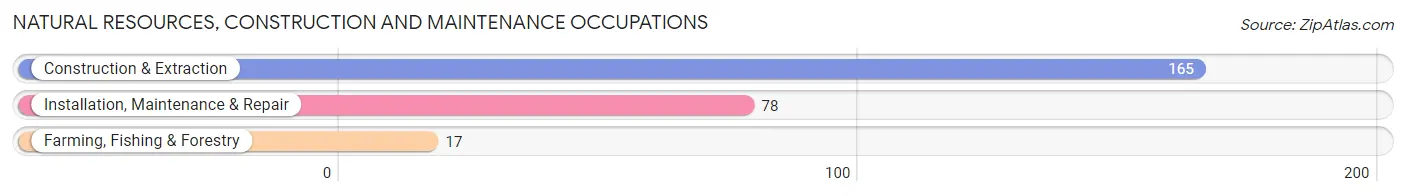
Natural Resources, Construction and Maintenance Occupations
The most common Natural Resources, Construction and Maintenance occupations in Haleyville are Construction & Extraction (165 | 9.1%), Installation, Maintenance & Repair (78 | 4.3%), and Farming, Fishing & Forestry (17 | 0.9%).
Natural Resources, Construction and Maintenance Occupations by Sex
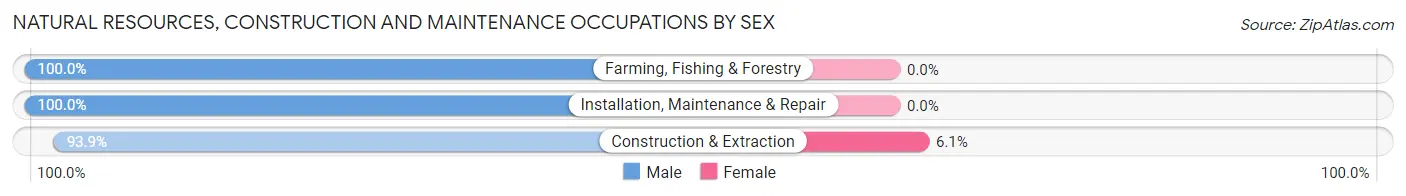
| Occupation | Male | Female |
| Farming, Fishing & Forestry | 17 (100.0%) | 0 (0.0%) |
| Construction & Extraction | 155 (93.9%) | 10 (6.1%) |
| Installation, Maintenance & Repair | 78 (100.0%) | 0 (0.0%) |
| Total (Category) | 250 (96.2%) | 10 (3.8%) |
| Total (Overall) | 982 (54.0%) | 835 (46.0%) |
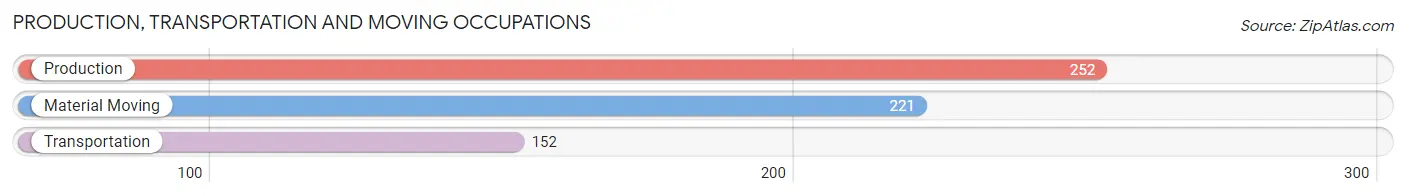
Production, Transportation and Moving Occupations
The most common Production, Transportation and Moving occupations in Haleyville are Production (252 | 13.9%), Material Moving (221 | 12.2%), and Transportation (152 | 8.4%).
Production, Transportation and Moving Occupations by Sex
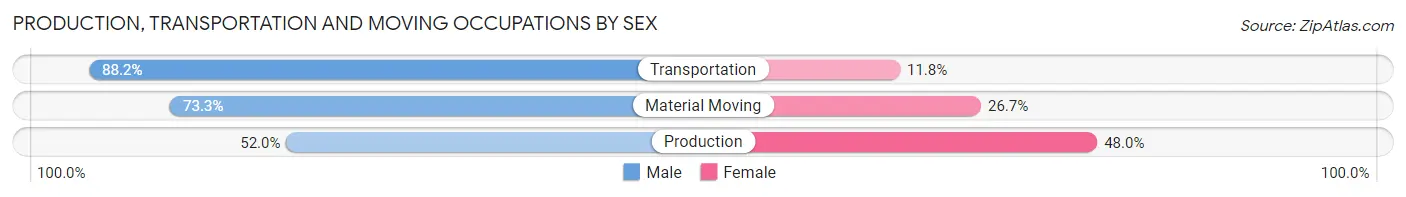
| Occupation | Male | Female |
| Production | 131 (52.0%) | 121 (48.0%) |
| Transportation | 134 (88.2%) | 18 (11.8%) |
| Material Moving | 162 (73.3%) | 59 (26.7%) |
| Total (Category) | 427 (68.3%) | 198 (31.7%) |
| Total (Overall) | 982 (54.0%) | 835 (46.0%) |
Employment Industries by Sex in Haleyville
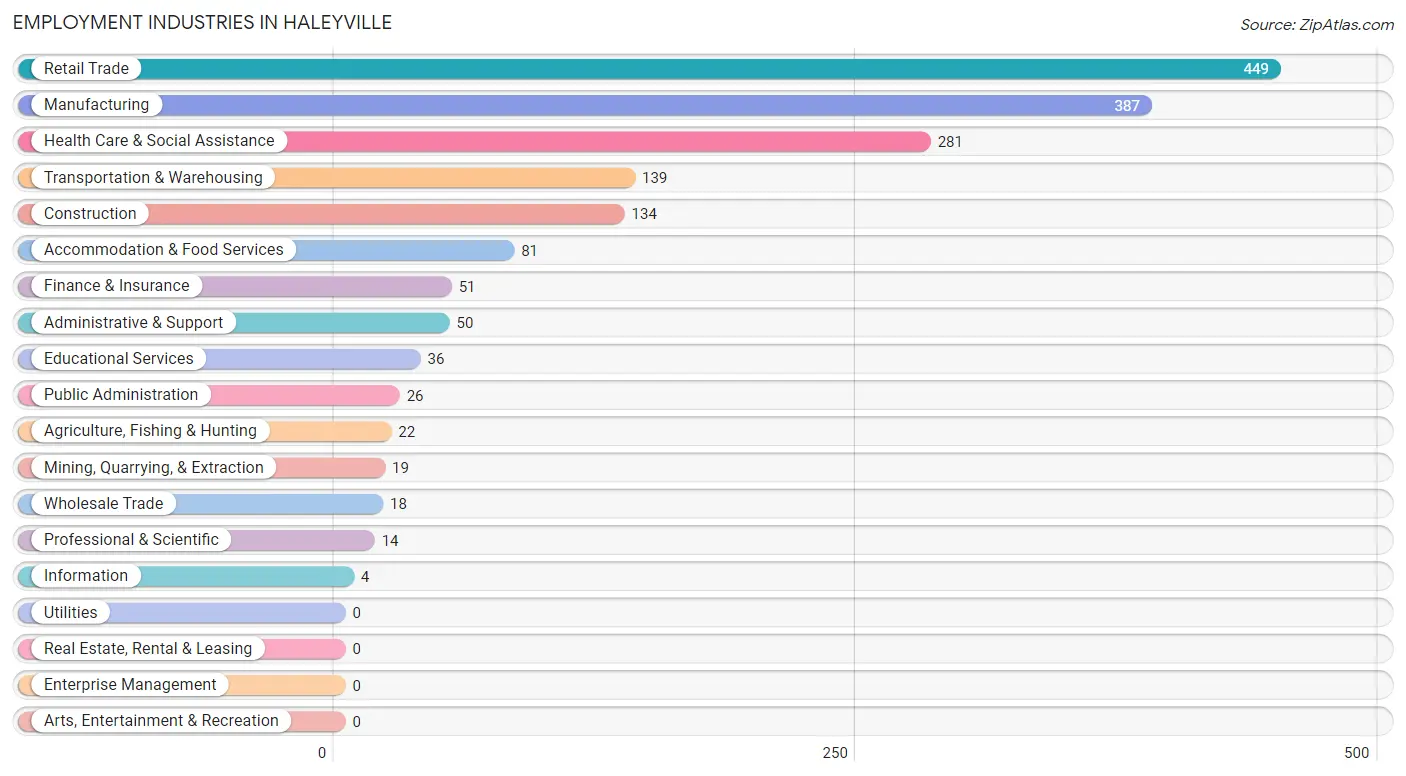
Employment Industries in Haleyville
The major employment industries in Haleyville include Retail Trade (449 | 24.7%), Manufacturing (387 | 21.3%), Health Care & Social Assistance (281 | 15.5%), Transportation & Warehousing (139 | 7.6%), and Construction (134 | 7.4%).
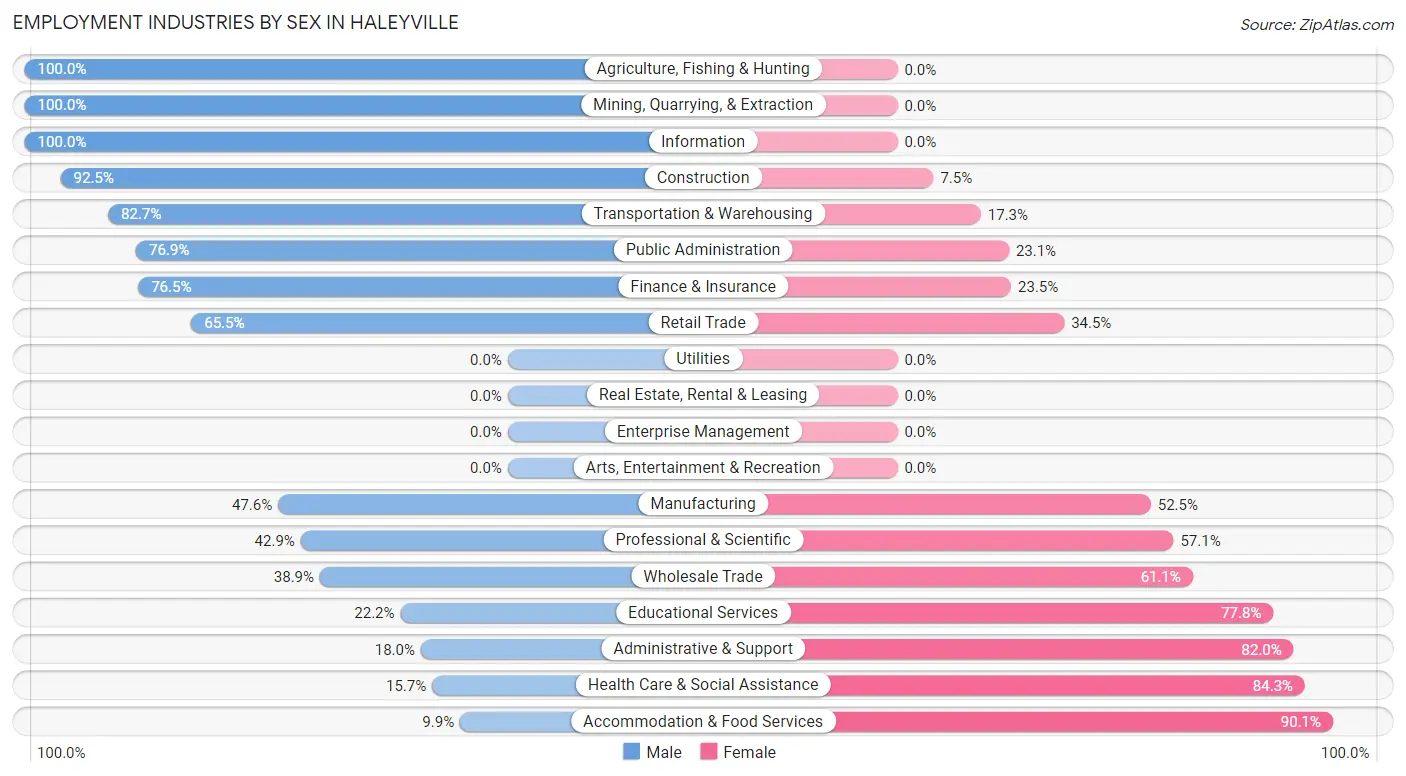
Employment Industries by Sex in Haleyville
The Haleyville industries that see more men than women are Agriculture, Fishing & Hunting (100.0%), Mining, Quarrying, & Extraction (100.0%), and Information (100.0%), whereas the industries that tend to have a higher number of women are Accommodation & Food Services (90.1%), Health Care & Social Assistance (84.3%), and Administrative & Support (82.0%).
| Industry | Male | Female |
| Agriculture, Fishing & Hunting | 22 (100.0%) | 0 (0.0%) |
| Mining, Quarrying, & Extraction | 19 (100.0%) | 0 (0.0%) |
| Construction | 124 (92.5%) | 10 (7.5%) |
| Manufacturing | 184 (47.5%) | 203 (52.4%) |
| Wholesale Trade | 7 (38.9%) | 11 (61.1%) |
| Retail Trade | 294 (65.5%) | 155 (34.5%) |
| Transportation & Warehousing | 115 (82.7%) | 24 (17.3%) |
| Utilities | 0 (0.0%) | 0 (0.0%) |
| Information | 4 (100.0%) | 0 (0.0%) |
| Finance & Insurance | 39 (76.5%) | 12 (23.5%) |
| Real Estate, Rental & Leasing | 0 (0.0%) | 0 (0.0%) |
| Professional & Scientific | 6 (42.9%) | 8 (57.1%) |
| Enterprise Management | 0 (0.0%) | 0 (0.0%) |
| Administrative & Support | 9 (18.0%) | 41 (82.0%) |
| Educational Services | 8 (22.2%) | 28 (77.8%) |
| Health Care & Social Assistance | 44 (15.7%) | 237 (84.3%) |
| Arts, Entertainment & Recreation | 0 (0.0%) | 0 (0.0%) |
| Accommodation & Food Services | 8 (9.9%) | 73 (90.1%) |
| Public Administration | 20 (76.9%) | 6 (23.1%) |
| Total | 982 (54.0%) | 835 (46.0%) |
Education in Haleyville
School Enrollment in Haleyville
The most common levels of schooling among the 915 students in Haleyville are middle school (386 | 42.2%), elementary school (133 | 14.5%), and high school (128 | 14.0%).
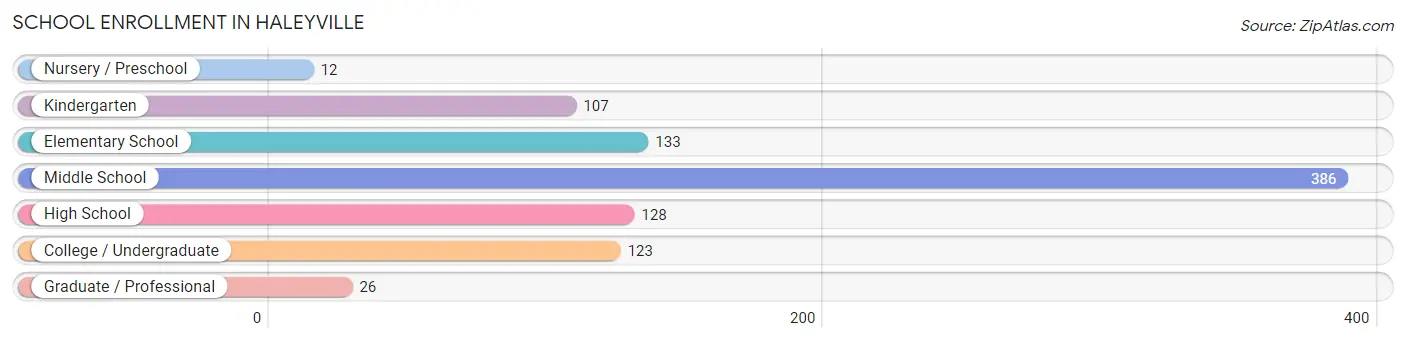
| School Level | # Students | % Students |
| Nursery / Preschool | 12 | 1.3% |
| Kindergarten | 107 | 11.7% |
| Elementary School | 133 | 14.5% |
| Middle School | 386 | 42.2% |
| High School | 128 | 14.0% |
| College / Undergraduate | 123 | 13.4% |
| Graduate / Professional | 26 | 2.8% |
| Total | 915 | 100.0% |
School Enrollment by Age by Funding Source in Haleyville
Out of a total of 915 students who are enrolled in schools in Haleyville, 46 (5.0%) attend a private institution, while the remaining 869 (95.0%) are enrolled in public schools. The age group of 25 to 34 year olds has the highest likelihood of being enrolled in private schools, with 14 (46.7% in the age bracket) enrolled. Conversely, the age group of 3 to 4 year olds has the lowest likelihood of being enrolled in a private school, with 12 (100.0% in the age bracket) attending a public institution.
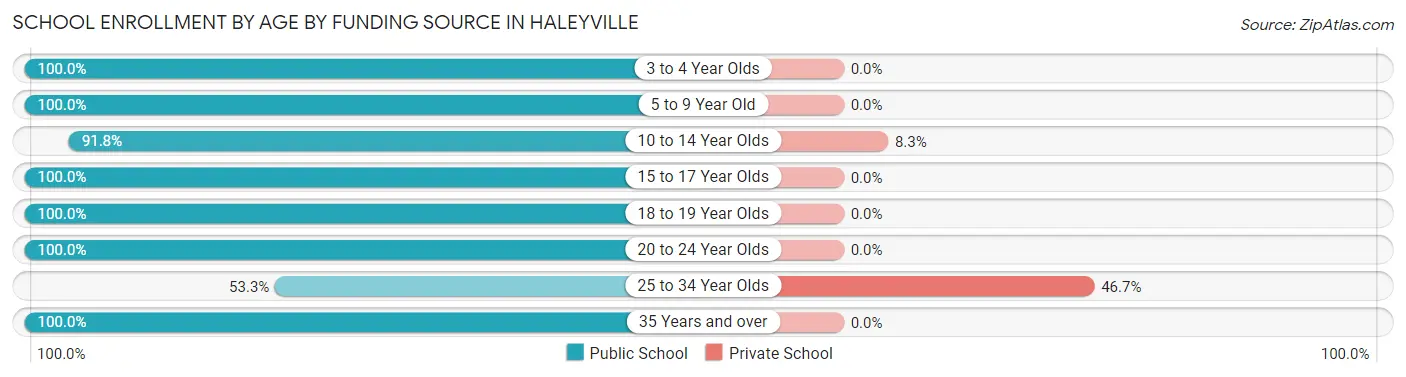
| Age Bracket | Public School | Private School |
| 3 to 4 Year Olds | 12 (100.0%) | 0 (0.0%) |
| 5 to 9 Year Old | 223 (100.0%) | 0 (0.0%) |
| 10 to 14 Year Olds | 356 (91.7%) | 32 (8.3%) |
| 15 to 17 Year Olds | 108 (100.0%) | 0 (0.0%) |
| 18 to 19 Year Olds | 35 (100.0%) | 0 (0.0%) |
| 20 to 24 Year Olds | 109 (100.0%) | 0 (0.0%) |
| 25 to 34 Year Olds | 16 (53.3%) | 14 (46.7%) |
| 35 Years and over | 10 (100.0%) | 0 (0.0%) |
| Total | 869 (95.0%) | 46 (5.0%) |
Educational Attainment by Field of Study in Haleyville
Education (109 | 31.0%), business (91 | 25.9%), science & technology (40 | 11.4%), physical & health sciences (37 | 10.5%), and bio, nature & agricultural (23 | 6.5%) are the most common fields of study among 352 individuals in Haleyville who have obtained a bachelor's degree or higher.
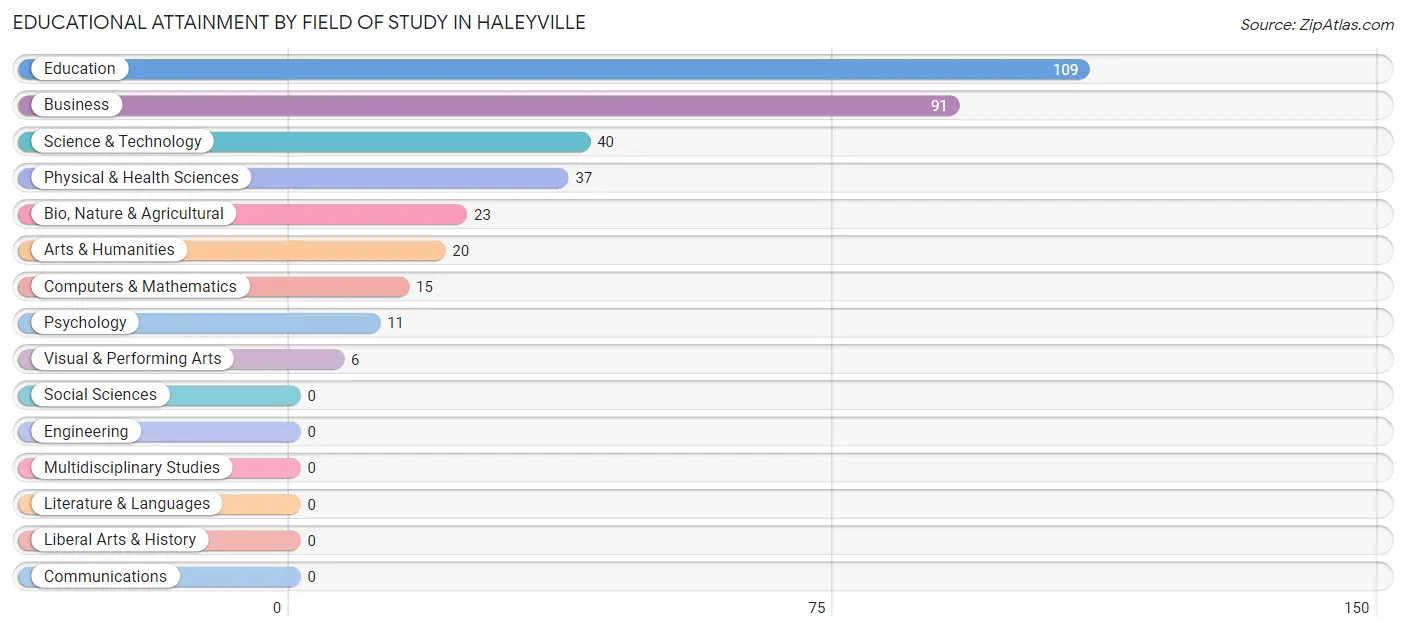
| Field of Study | # Graduates | % Graduates |
| Computers & Mathematics | 15 | 4.3% |
| Bio, Nature & Agricultural | 23 | 6.5% |
| Physical & Health Sciences | 37 | 10.5% |
| Psychology | 11 | 3.1% |
| Social Sciences | 0 | 0.0% |
| Engineering | 0 | 0.0% |
| Multidisciplinary Studies | 0 | 0.0% |
| Science & Technology | 40 | 11.4% |
| Business | 91 | 25.9% |
| Education | 109 | 31.0% |
| Literature & Languages | 0 | 0.0% |
| Liberal Arts & History | 0 | 0.0% |
| Visual & Performing Arts | 6 | 1.7% |
| Communications | 0 | 0.0% |
| Arts & Humanities | 20 | 5.7% |
| Total | 352 | 100.0% |
Transportation & Commute in Haleyville
Vehicle Availability by Sex in Haleyville
The most prevalent vehicle ownership categories in Haleyville are males with 3 vehicles (320, accounting for 33.4%) and females with 3 vehicles (234, making up 38.3%).
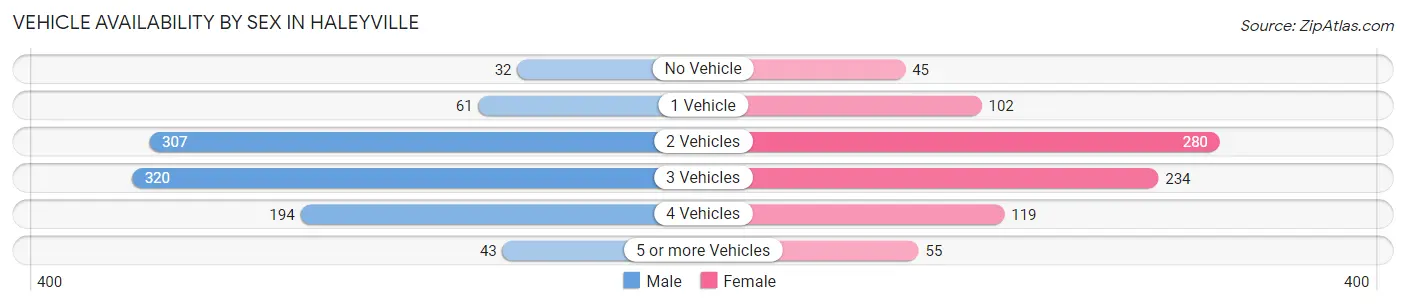
| Vehicles Available | Male | Female |
| No Vehicle | 32 (3.3%) | 45 (5.4%) |
| 1 Vehicle | 61 (6.4%) | 102 (12.2%) |
| 2 Vehicles | 307 (32.1%) | 280 (33.5%) |
| 3 Vehicles | 320 (33.4%) | 234 (28.0%) |
| 4 Vehicles | 194 (20.3%) | 119 (14.2%) |
| 5 or more Vehicles | 43 (4.5%) | 55 (6.6%) |
| Total | 957 (100.0%) | 835 (100.0%) |
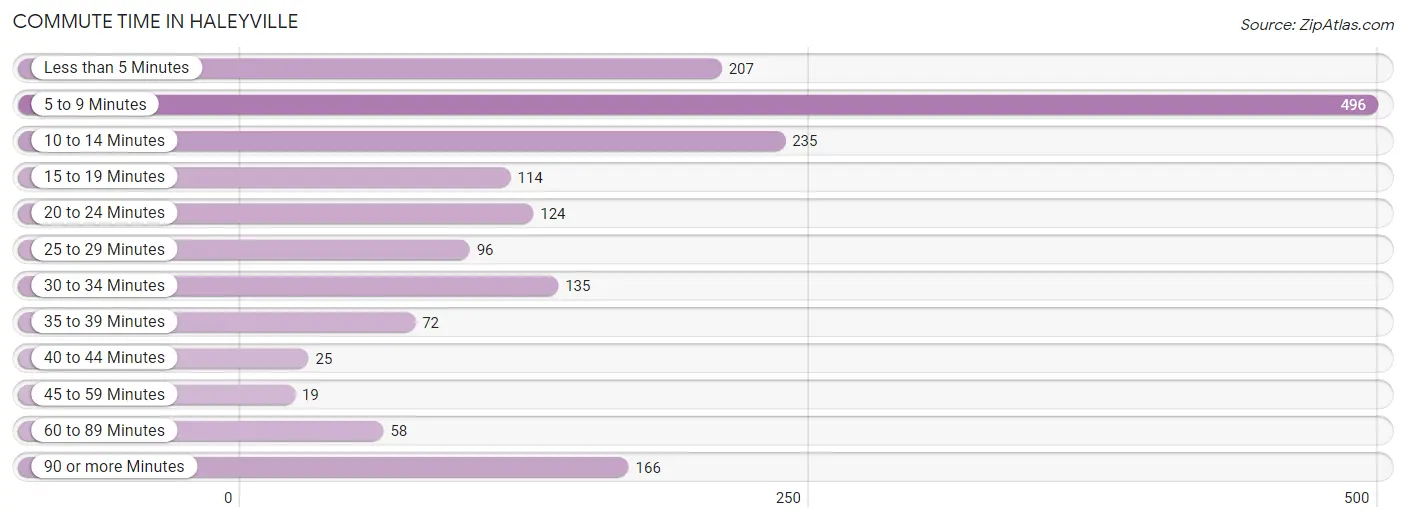
Commute Time in Haleyville
The most frequently occuring commute durations in Haleyville are 5 to 9 minutes (496 commuters, 28.4%), 10 to 14 minutes (235 commuters, 13.5%), and less than 5 minutes (207 commuters, 11.8%).
| Commute Time | # Commuters | % Commuters |
| Less than 5 Minutes | 207 | 11.8% |
| 5 to 9 Minutes | 496 | 28.4% |
| 10 to 14 Minutes | 235 | 13.5% |
| 15 to 19 Minutes | 114 | 6.5% |
| 20 to 24 Minutes | 124 | 7.1% |
| 25 to 29 Minutes | 96 | 5.5% |
| 30 to 34 Minutes | 135 | 7.7% |
| 35 to 39 Minutes | 72 | 4.1% |
| 40 to 44 Minutes | 25 | 1.4% |
| 45 to 59 Minutes | 19 | 1.1% |
| 60 to 89 Minutes | 58 | 3.3% |
| 90 or more Minutes | 166 | 9.5% |
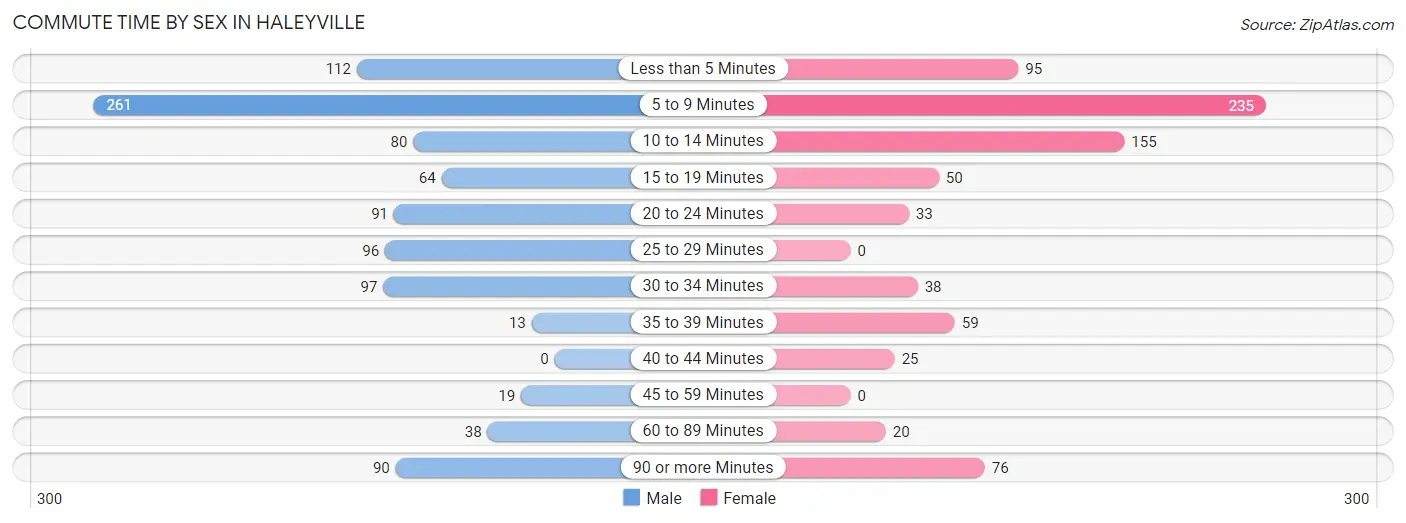
Commute Time by Sex in Haleyville
The most common commute times in Haleyville are 5 to 9 minutes (261 commuters, 27.2%) for males and 5 to 9 minutes (235 commuters, 29.9%) for females.
| Commute Time | Male | Female |
| Less than 5 Minutes | 112 (11.7%) | 95 (12.1%) |
| 5 to 9 Minutes | 261 (27.2%) | 235 (29.9%) |
| 10 to 14 Minutes | 80 (8.3%) | 155 (19.7%) |
| 15 to 19 Minutes | 64 (6.7%) | 50 (6.4%) |
| 20 to 24 Minutes | 91 (9.5%) | 33 (4.2%) |
| 25 to 29 Minutes | 96 (10.0%) | 0 (0.0%) |
| 30 to 34 Minutes | 97 (10.1%) | 38 (4.8%) |
| 35 to 39 Minutes | 13 (1.3%) | 59 (7.5%) |
| 40 to 44 Minutes | 0 (0.0%) | 25 (3.2%) |
| 45 to 59 Minutes | 19 (2.0%) | 0 (0.0%) |
| 60 to 89 Minutes | 38 (4.0%) | 20 (2.5%) |
| 90 or more Minutes | 90 (9.4%) | 76 (9.7%) |
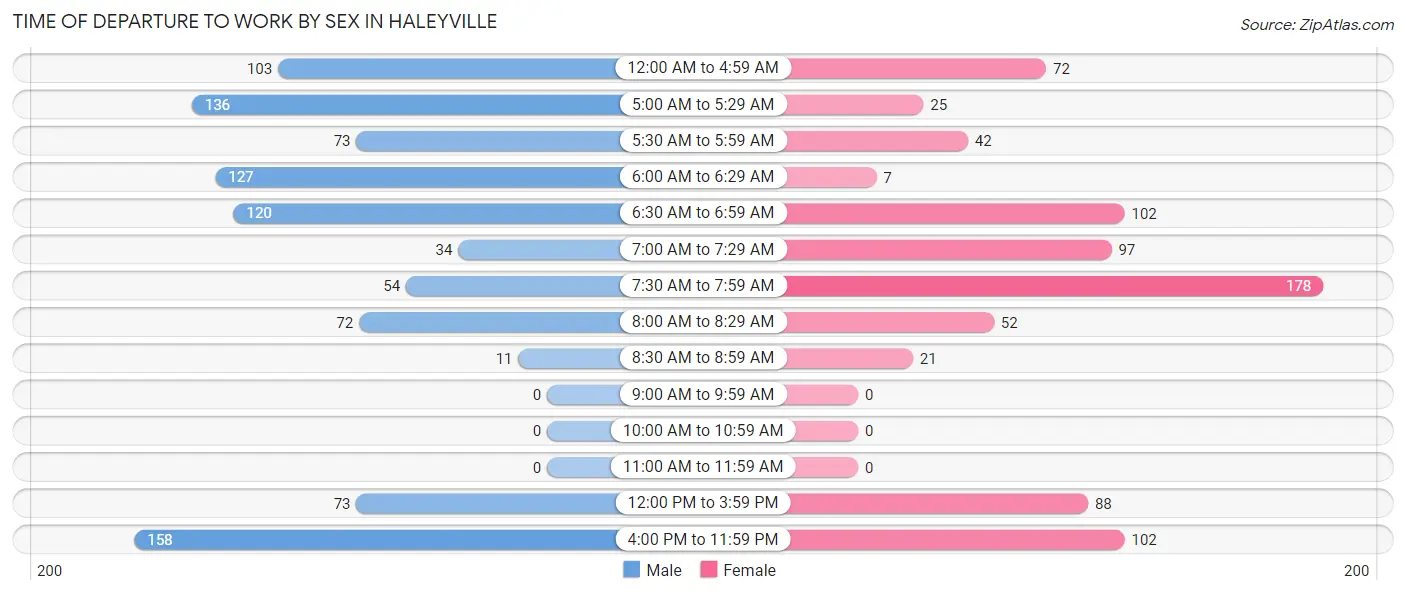
Time of Departure to Work by Sex in Haleyville
The most frequent times of departure to work in Haleyville are 4:00 PM to 11:59 PM (158, 16.4%) for males and 7:30 AM to 7:59 AM (178, 22.7%) for females.
| Time of Departure | Male | Female |
| 12:00 AM to 4:59 AM | 103 (10.7%) | 72 (9.2%) |
| 5:00 AM to 5:29 AM | 136 (14.1%) | 25 (3.2%) |
| 5:30 AM to 5:59 AM | 73 (7.6%) | 42 (5.3%) |
| 6:00 AM to 6:29 AM | 127 (13.2%) | 7 (0.9%) |
| 6:30 AM to 6:59 AM | 120 (12.5%) | 102 (13.0%) |
| 7:00 AM to 7:29 AM | 34 (3.5%) | 97 (12.3%) |
| 7:30 AM to 7:59 AM | 54 (5.6%) | 178 (22.7%) |
| 8:00 AM to 8:29 AM | 72 (7.5%) | 52 (6.6%) |
| 8:30 AM to 8:59 AM | 11 (1.1%) | 21 (2.7%) |
| 9:00 AM to 9:59 AM | 0 (0.0%) | 0 (0.0%) |
| 10:00 AM to 10:59 AM | 0 (0.0%) | 0 (0.0%) |
| 11:00 AM to 11:59 AM | 0 (0.0%) | 0 (0.0%) |
| 12:00 PM to 3:59 PM | 73 (7.6%) | 88 (11.2%) |
| 4:00 PM to 11:59 PM | 158 (16.4%) | 102 (13.0%) |
| Total | 961 (100.0%) | 786 (100.0%) |
Housing Occupancy in Haleyville
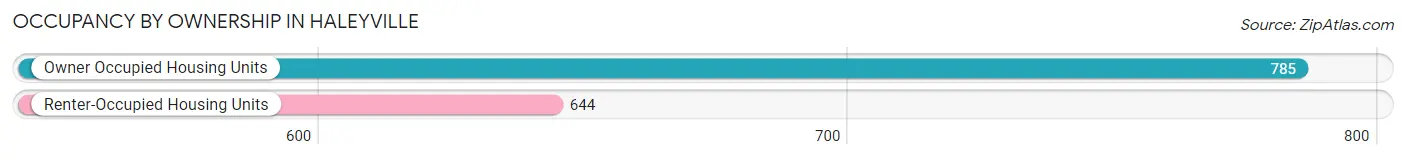
Occupancy by Ownership in Haleyville
Of the total 1,429 dwellings in Haleyville, owner-occupied units account for 785 (54.9%), while renter-occupied units make up 644 (45.1%).
| Occupancy | # Housing Units | % Housing Units |
| Owner Occupied Housing Units | 785 | 54.9% |
| Renter-Occupied Housing Units | 644 | 45.1% |
| Total Occupied Housing Units | 1,429 | 100.0% |
Occupancy by Household Size in Haleyville
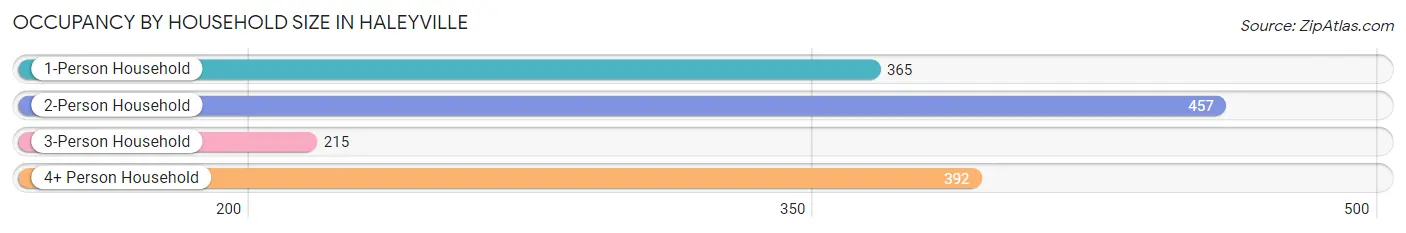
| Household Size | # Housing Units | % Housing Units |
| 1-Person Household | 365 | 25.5% |
| 2-Person Household | 457 | 32.0% |
| 3-Person Household | 215 | 15.0% |
| 4+ Person Household | 392 | 27.4% |
| Total Housing Units | 1,429 | 100.0% |
Occupancy by Ownership by Household Size in Haleyville
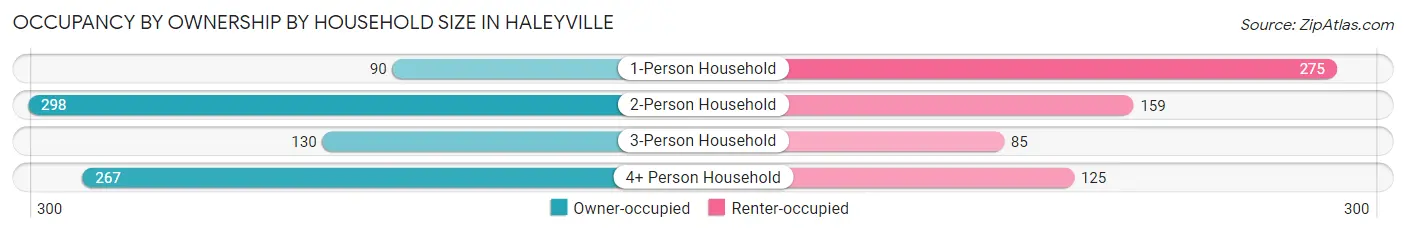
| Household Size | Owner-occupied | Renter-occupied |
| 1-Person Household | 90 (24.7%) | 275 (75.3%) |
| 2-Person Household | 298 (65.2%) | 159 (34.8%) |
| 3-Person Household | 130 (60.5%) | 85 (39.5%) |
| 4+ Person Household | 267 (68.1%) | 125 (31.9%) |
| Total Housing Units | 785 (54.9%) | 644 (45.1%) |
Occupancy by Educational Attainment in Haleyville
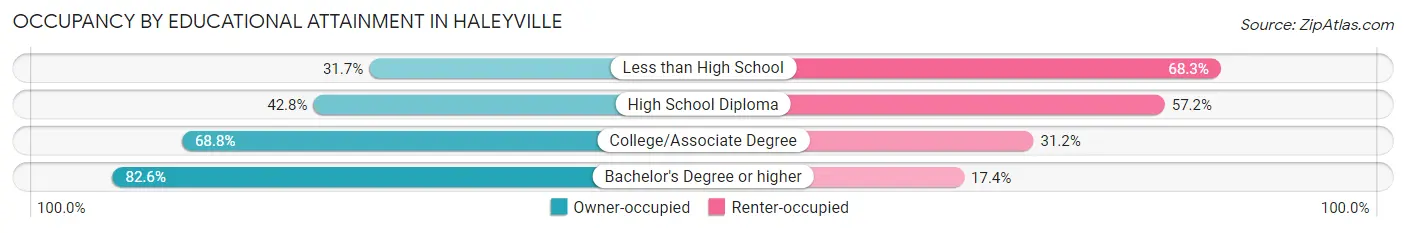
| Household Size | Owner-occupied | Renter-occupied |
| Less than High School | 85 (31.7%) | 183 (68.3%) |
| High School Diploma | 201 (42.8%) | 269 (57.2%) |
| College/Associate Degree | 357 (68.8%) | 162 (31.2%) |
| Bachelor's Degree or higher | 142 (82.6%) | 30 (17.4%) |
Occupancy by Age of Householder in Haleyville
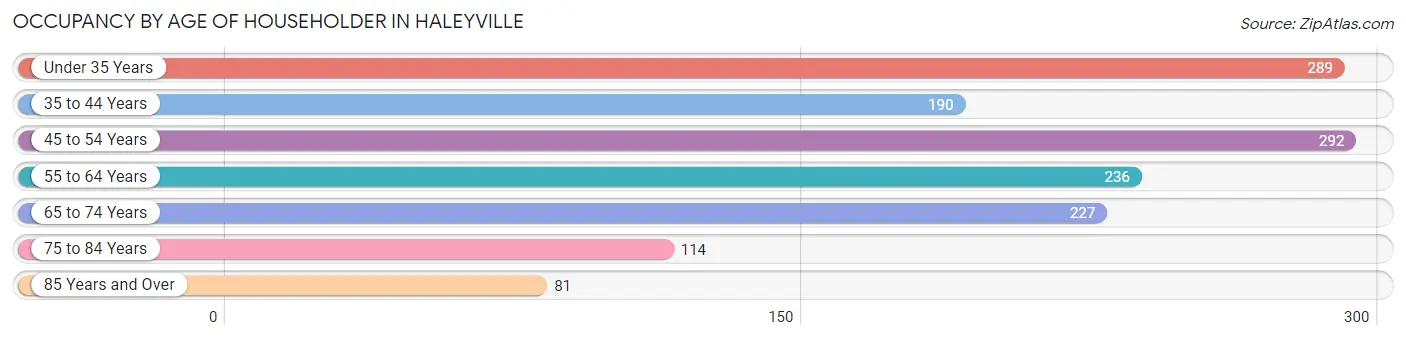
| Age Bracket | # Households | % Households |
| Under 35 Years | 289 | 20.2% |
| 35 to 44 Years | 190 | 13.3% |
| 45 to 54 Years | 292 | 20.4% |
| 55 to 64 Years | 236 | 16.5% |
| 65 to 74 Years | 227 | 15.9% |
| 75 to 84 Years | 114 | 8.0% |
| 85 Years and Over | 81 | 5.7% |
| Total | 1,429 | 100.0% |
Housing Finances in Haleyville
Median Income by Occupancy in Haleyville
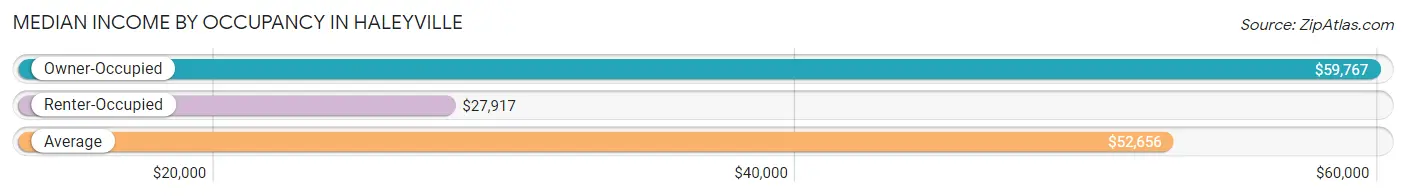
| Occupancy Type | # Households | Median Income |
| Owner-Occupied | 785 (54.9%) | $59,767 |
| Renter-Occupied | 644 (45.1%) | $27,917 |
| Average | 1,429 (100.0%) | $52,656 |
Occupancy by Householder Income Bracket in Haleyville
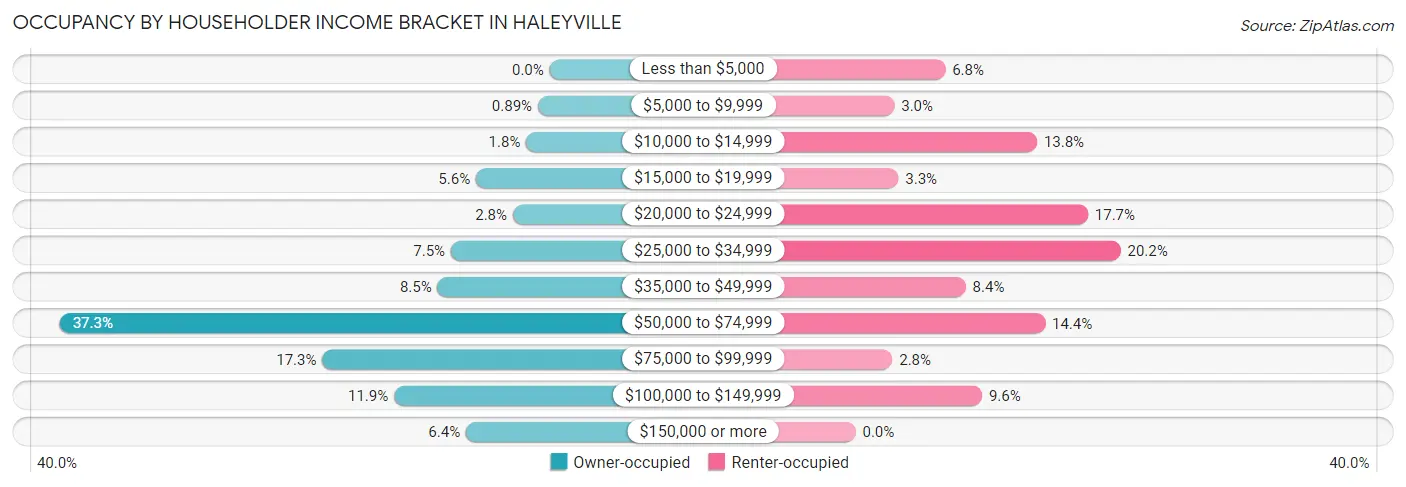
| Income Bracket | Owner-occupied | Renter-occupied |
| Less than $5,000 | 0 (0.0%) | 44 (6.8%) |
| $5,000 to $9,999 | 7 (0.9%) | 19 (2.9%) |
| $10,000 to $14,999 | 14 (1.8%) | 89 (13.8%) |
| $15,000 to $19,999 | 44 (5.6%) | 21 (3.3%) |
| $20,000 to $24,999 | 22 (2.8%) | 114 (17.7%) |
| $25,000 to $34,999 | 59 (7.5%) | 130 (20.2%) |
| $35,000 to $49,999 | 67 (8.5%) | 54 (8.4%) |
| $50,000 to $74,999 | 293 (37.3%) | 93 (14.4%) |
| $75,000 to $99,999 | 136 (17.3%) | 18 (2.8%) |
| $100,000 to $149,999 | 93 (11.8%) | 62 (9.6%) |
| $150,000 or more | 50 (6.4%) | 0 (0.0%) |
| Total | 785 (100.0%) | 644 (100.0%) |
Monthly Housing Cost Tiers in Haleyville
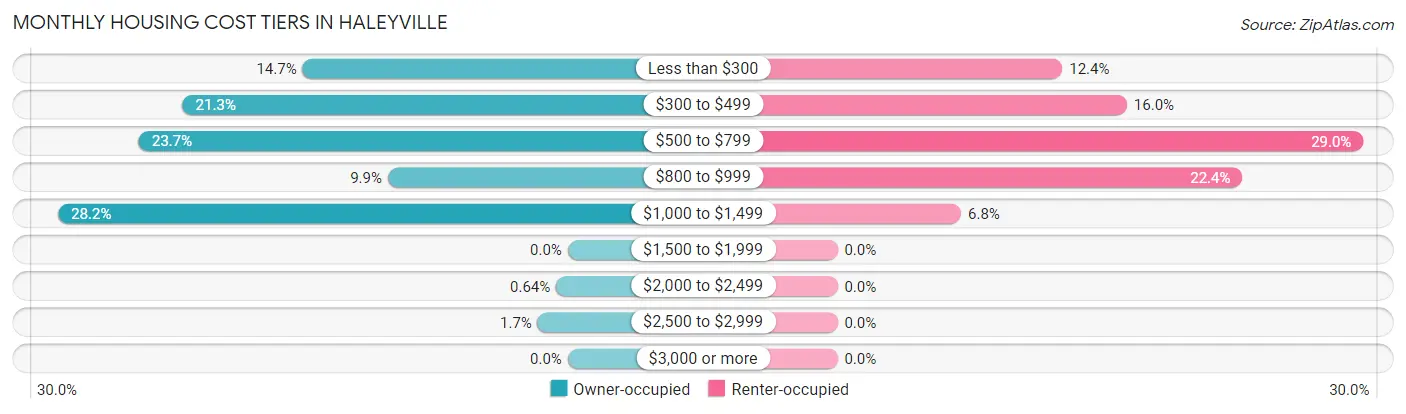
| Monthly Cost | Owner-occupied | Renter-occupied |
| Less than $300 | 115 (14.6%) | 80 (12.4%) |
| $300 to $499 | 167 (21.3%) | 103 (16.0%) |
| $500 to $799 | 186 (23.7%) | 187 (29.0%) |
| $800 to $999 | 78 (9.9%) | 144 (22.4%) |
| $1,000 to $1,499 | 221 (28.1%) | 44 (6.8%) |
| $1,500 to $1,999 | 0 (0.0%) | 0 (0.0%) |
| $2,000 to $2,499 | 5 (0.6%) | 0 (0.0%) |
| $2,500 to $2,999 | 13 (1.7%) | 0 (0.0%) |
| $3,000 or more | 0 (0.0%) | 0 (0.0%) |
| Total | 785 (100.0%) | 644 (100.0%) |
Physical Housing Characteristics in Haleyville
Housing Structures in Haleyville
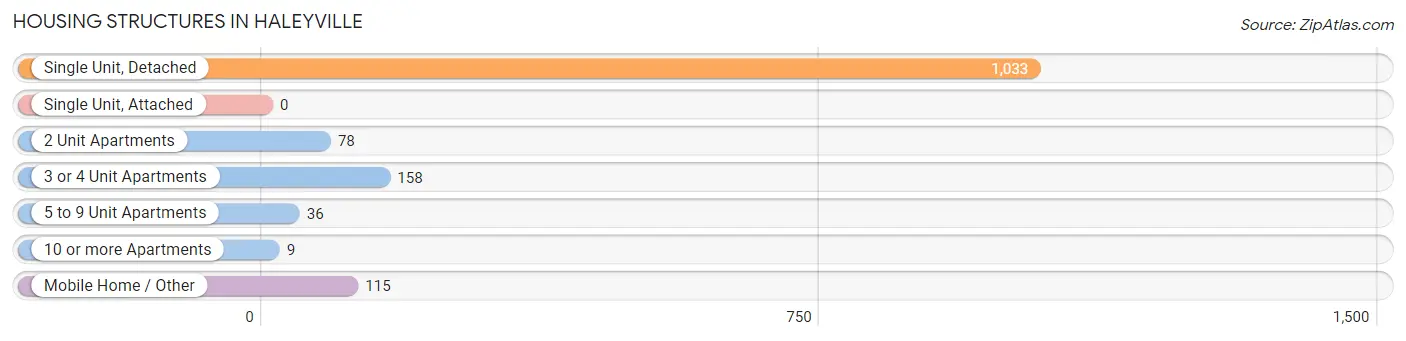
| Structure Type | # Housing Units | % Housing Units |
| Single Unit, Detached | 1,033 | 72.3% |
| Single Unit, Attached | 0 | 0.0% |
| 2 Unit Apartments | 78 | 5.5% |
| 3 or 4 Unit Apartments | 158 | 11.1% |
| 5 to 9 Unit Apartments | 36 | 2.5% |
| 10 or more Apartments | 9 | 0.6% |
| Mobile Home / Other | 115 | 8.1% |
| Total | 1,429 | 100.0% |
Housing Structures by Occupancy in Haleyville
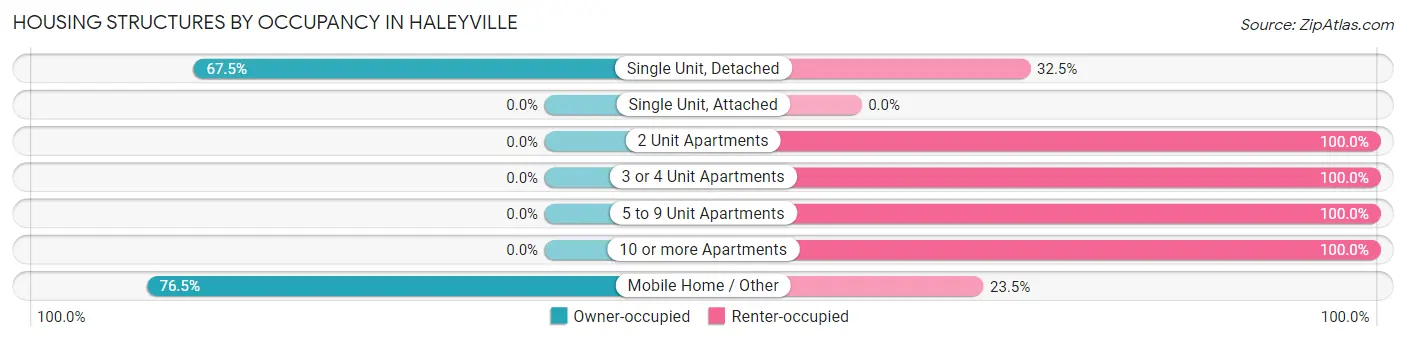
| Structure Type | Owner-occupied | Renter-occupied |
| Single Unit, Detached | 697 (67.5%) | 336 (32.5%) |
| Single Unit, Attached | 0 (0.0%) | 0 (0.0%) |
| 2 Unit Apartments | 0 (0.0%) | 78 (100.0%) |
| 3 or 4 Unit Apartments | 0 (0.0%) | 158 (100.0%) |
| 5 to 9 Unit Apartments | 0 (0.0%) | 36 (100.0%) |
| 10 or more Apartments | 0 (0.0%) | 9 (100.0%) |
| Mobile Home / Other | 88 (76.5%) | 27 (23.5%) |
| Total | 785 (54.9%) | 644 (45.1%) |
Housing Structures by Number of Rooms in Haleyville
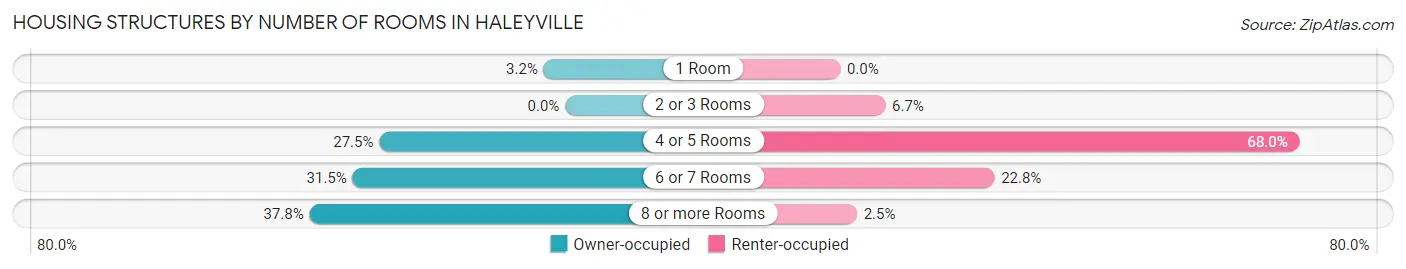
| Number of Rooms | Owner-occupied | Renter-occupied |
| 1 Room | 25 (3.2%) | 0 (0.0%) |
| 2 or 3 Rooms | 0 (0.0%) | 43 (6.7%) |
| 4 or 5 Rooms | 216 (27.5%) | 438 (68.0%) |
| 6 or 7 Rooms | 247 (31.5%) | 147 (22.8%) |
| 8 or more Rooms | 297 (37.8%) | 16 (2.5%) |
| Total | 785 (100.0%) | 644 (100.0%) |
Housing Structure by Heating Type in Haleyville
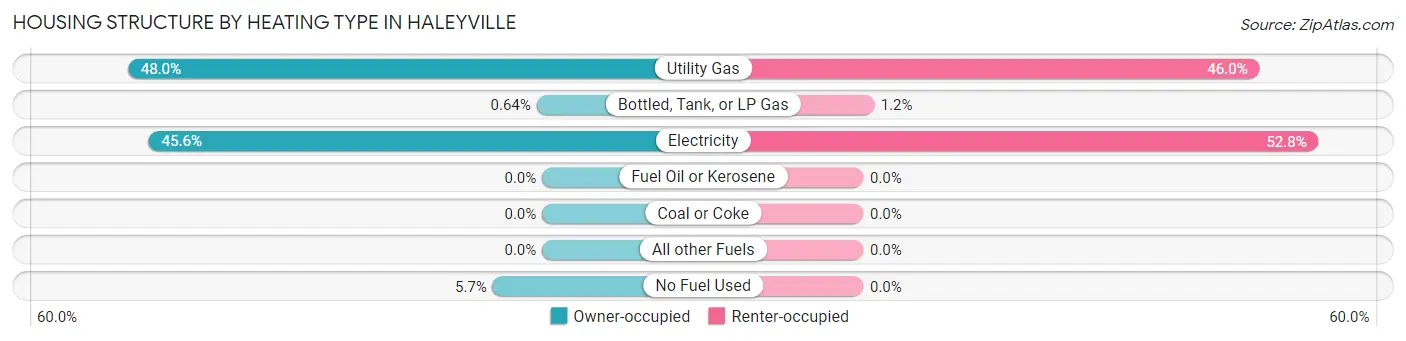
| Heating Type | Owner-occupied | Renter-occupied |
| Utility Gas | 377 (48.0%) | 296 (46.0%) |
| Bottled, Tank, or LP Gas | 5 (0.6%) | 8 (1.2%) |
| Electricity | 358 (45.6%) | 340 (52.8%) |
| Fuel Oil or Kerosene | 0 (0.0%) | 0 (0.0%) |
| Coal or Coke | 0 (0.0%) | 0 (0.0%) |
| All other Fuels | 0 (0.0%) | 0 (0.0%) |
| No Fuel Used | 45 (5.7%) | 0 (0.0%) |
| Total | 785 (100.0%) | 644 (100.0%) |
Household Vehicle Usage in Haleyville
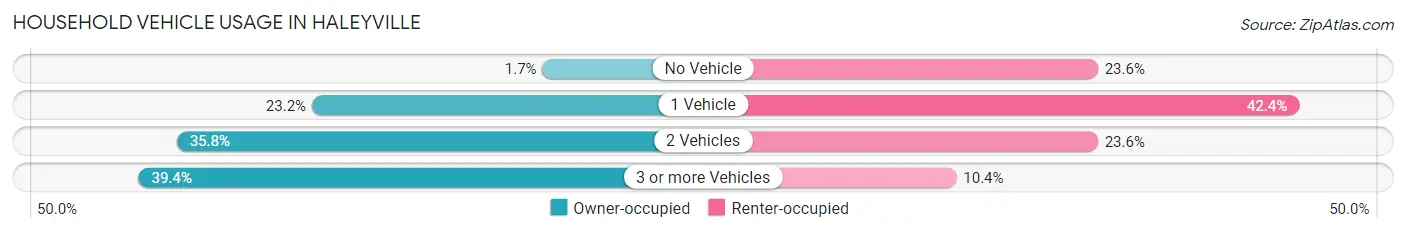
| Vehicles per Household | Owner-occupied | Renter-occupied |
| No Vehicle | 13 (1.7%) | 152 (23.6%) |
| 1 Vehicle | 182 (23.2%) | 273 (42.4%) |
| 2 Vehicles | 281 (35.8%) | 152 (23.6%) |
| 3 or more Vehicles | 309 (39.4%) | 67 (10.4%) |
| Total | 785 (100.0%) | 644 (100.0%) |
Real Estate & Mortgages in Haleyville
Real Estate and Mortgage Overview in Haleyville
| Characteristic | Without Mortgage | With Mortgage |
| Housing Units | 397 | 388 |
| Median Property Value | $81,600 | $132,300 |
| Median Household Income | $53,361 | $24 |
| Monthly Housing Costs | $384 | $0 |
| Real Estate Taxes | $291 | $24 |
Property Value by Mortgage Status in Haleyville
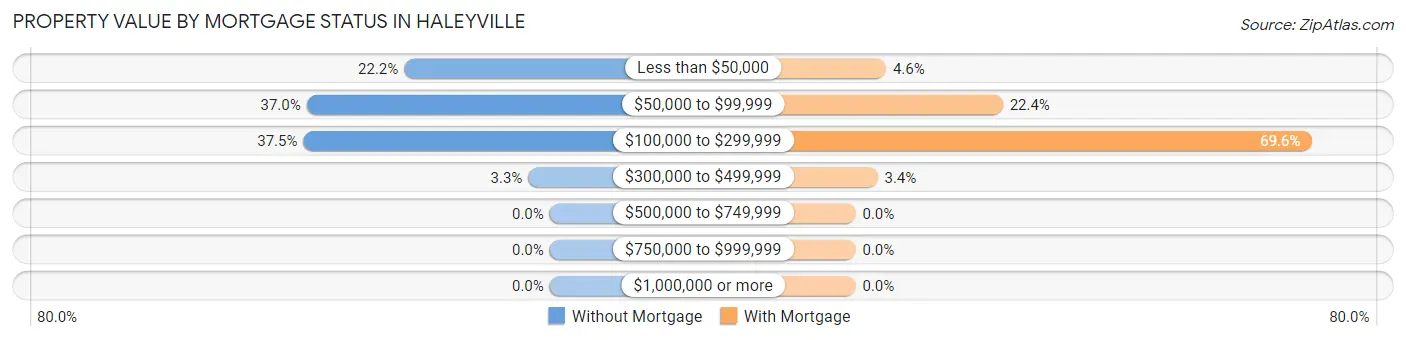
| Property Value | Without Mortgage | With Mortgage |
| Less than $50,000 | 88 (22.2%) | 18 (4.6%) |
| $50,000 to $99,999 | 147 (37.0%) | 87 (22.4%) |
| $100,000 to $299,999 | 149 (37.5%) | 270 (69.6%) |
| $300,000 to $499,999 | 13 (3.3%) | 13 (3.4%) |
| $500,000 to $749,999 | 0 (0.0%) | 0 (0.0%) |
| $750,000 to $999,999 | 0 (0.0%) | 0 (0.0%) |
| $1,000,000 or more | 0 (0.0%) | 0 (0.0%) |
| Total | 397 (100.0%) | 388 (100.0%) |
Household Income by Mortgage Status in Haleyville
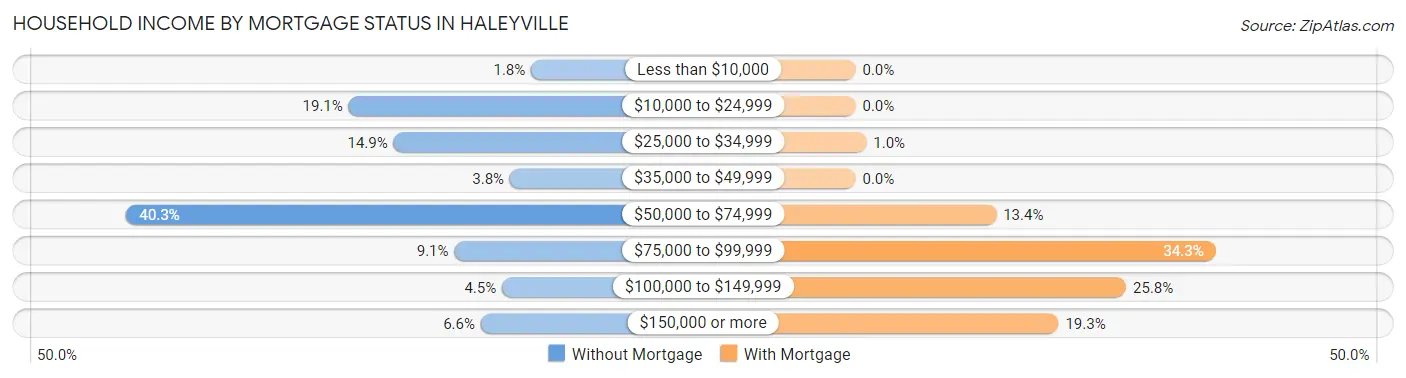
| Household Income | Without Mortgage | With Mortgage |
| Less than $10,000 | 7 (1.8%) | 0 (0.0%) |
| $10,000 to $24,999 | 76 (19.1%) | 0 (0.0%) |
| $25,000 to $34,999 | 59 (14.9%) | 4 (1.0%) |
| $35,000 to $49,999 | 15 (3.8%) | 0 (0.0%) |
| $50,000 to $74,999 | 160 (40.3%) | 52 (13.4%) |
| $75,000 to $99,999 | 36 (9.1%) | 133 (34.3%) |
| $100,000 to $149,999 | 18 (4.5%) | 100 (25.8%) |
| $150,000 or more | 26 (6.6%) | 75 (19.3%) |
| Total | 397 (100.0%) | 388 (100.0%) |
Property Value to Household Income Ratio in Haleyville
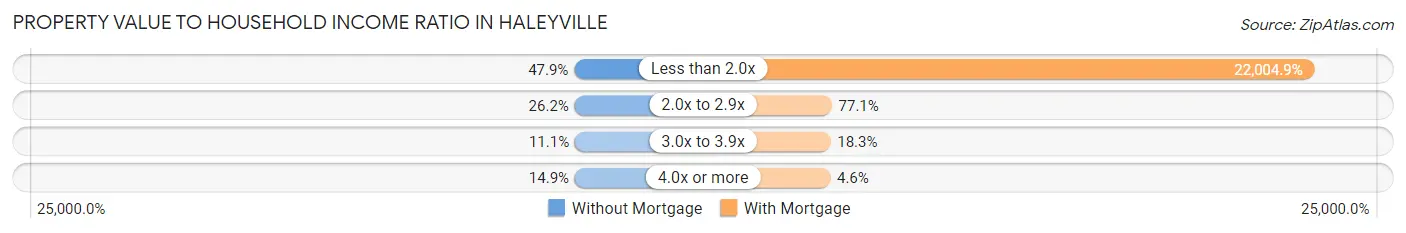
| Value-to-Income Ratio | Without Mortgage | With Mortgage |
| Less than 2.0x | 190 (47.9%) | 85,379 (22,004.9%) |
| 2.0x to 2.9x | 104 (26.2%) | 299 (77.1%) |
| 3.0x to 3.9x | 44 (11.1%) | 71 (18.3%) |
| 4.0x or more | 59 (14.9%) | 18 (4.6%) |
| Total | 397 (100.0%) | 388 (100.0%) |
Real Estate Taxes by Mortgage Status in Haleyville
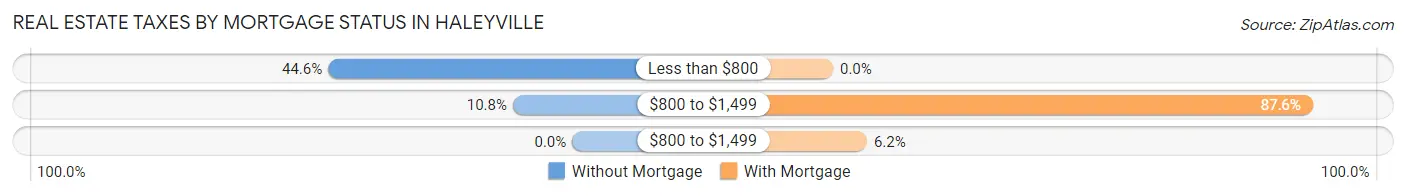
| Property Taxes | Without Mortgage | With Mortgage |
| Less than $800 | 177 (44.6%) | 0 (0.0%) |
| $800 to $1,499 | 43 (10.8%) | 340 (87.6%) |
| $800 to $1,499 | 0 (0.0%) | 24 (6.2%) |
| Total | 397 (100.0%) | 388 (100.0%) |
Health & Disability in Haleyville
Health Insurance Coverage by Age in Haleyville
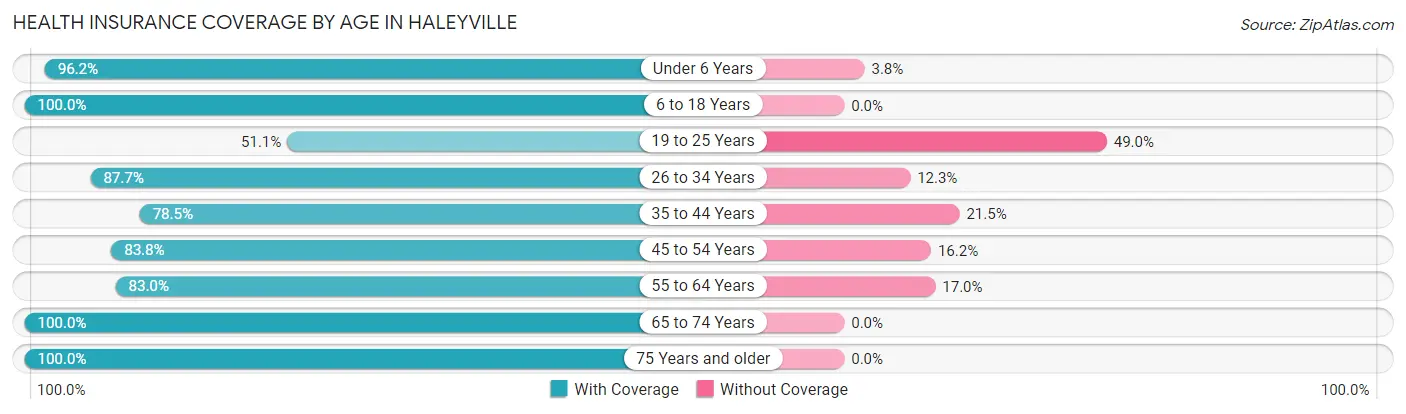
| Age Bracket | With Coverage | Without Coverage |
| Under 6 Years | 229 (96.2%) | 9 (3.8%) |
| 6 to 18 Years | 808 (100.0%) | 0 (0.0%) |
| 19 to 25 Years | 218 (51.0%) | 209 (48.9%) |
| 26 to 34 Years | 578 (87.7%) | 81 (12.3%) |
| 35 to 44 Years | 318 (78.5%) | 87 (21.5%) |
| 45 to 54 Years | 451 (83.8%) | 87 (16.2%) |
| 55 to 64 Years | 357 (83.0%) | 73 (17.0%) |
| 65 to 74 Years | 395 (100.0%) | 0 (0.0%) |
| 75 Years and older | 299 (100.0%) | 0 (0.0%) |
| Total | 3,653 (87.0%) | 546 (13.0%) |
Health Insurance Coverage by Citizenship Status in Haleyville
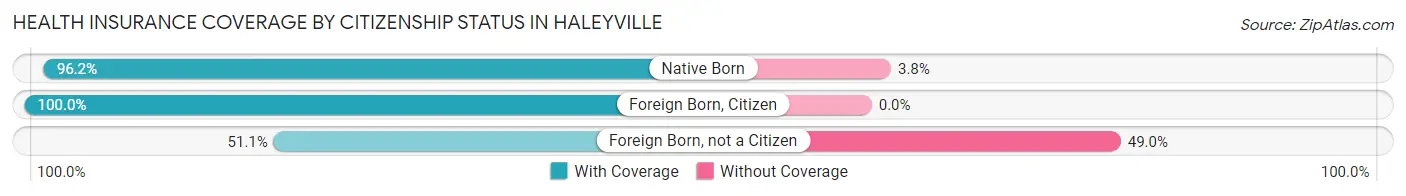
| Citizenship Status | With Coverage | Without Coverage |
| Native Born | 229 (96.2%) | 9 (3.8%) |
| Foreign Born, Citizen | 808 (100.0%) | 0 (0.0%) |
| Foreign Born, not a Citizen | 218 (51.0%) | 209 (48.9%) |
Health Insurance Coverage by Household Income in Haleyville
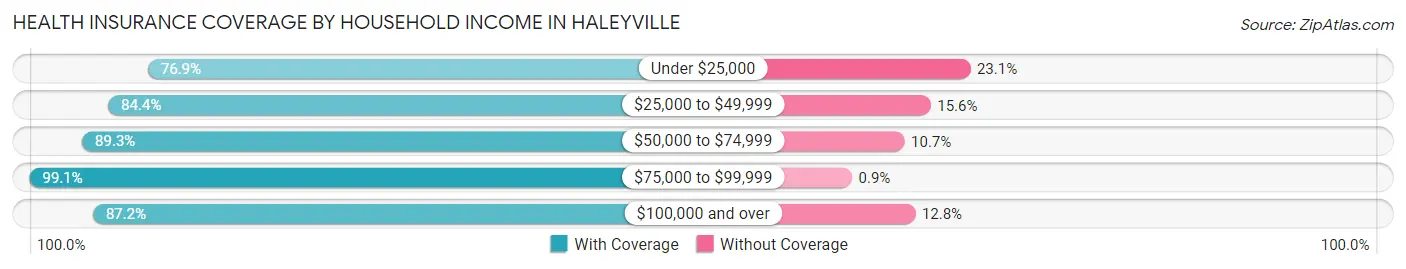
| Household Income | With Coverage | Without Coverage |
| Under $25,000 | 440 (76.9%) | 132 (23.1%) |
| $25,000 to $49,999 | 712 (84.4%) | 132 (15.6%) |
| $50,000 to $74,999 | 1,130 (89.3%) | 136 (10.7%) |
| $75,000 to $99,999 | 441 (99.1%) | 4 (0.9%) |
| $100,000 and over | 922 (87.2%) | 135 (12.8%) |
Public vs Private Health Insurance Coverage by Age in Haleyville
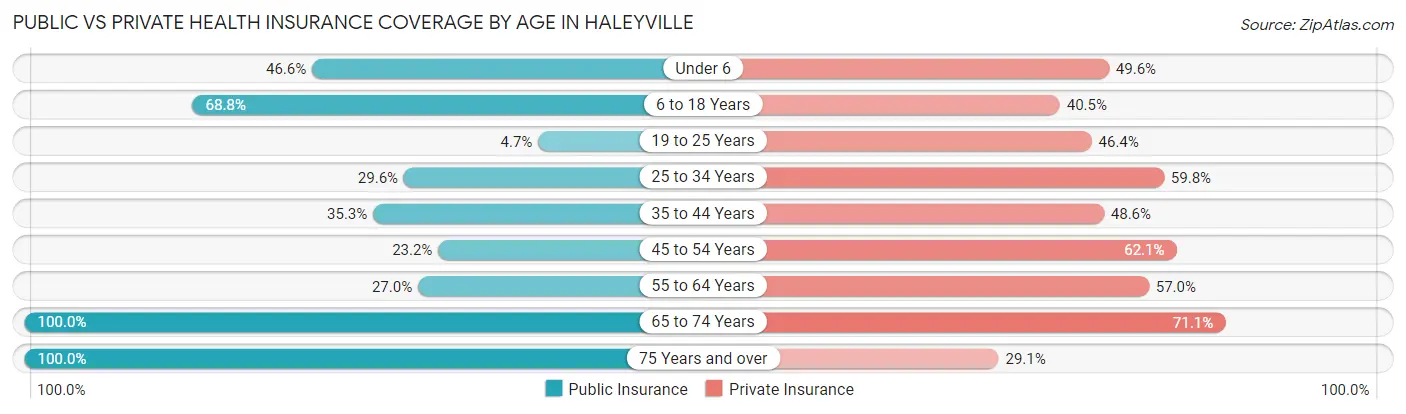
| Age Bracket | Public Insurance | Private Insurance |
| Under 6 | 111 (46.6%) | 118 (49.6%) |
| 6 to 18 Years | 556 (68.8%) | 327 (40.5%) |
| 19 to 25 Years | 20 (4.7%) | 198 (46.4%) |
| 25 to 34 Years | 195 (29.6%) | 394 (59.8%) |
| 35 to 44 Years | 143 (35.3%) | 197 (48.6%) |
| 45 to 54 Years | 125 (23.2%) | 334 (62.1%) |
| 55 to 64 Years | 116 (27.0%) | 245 (57.0%) |
| 65 to 74 Years | 395 (100.0%) | 281 (71.1%) |
| 75 Years and over | 299 (100.0%) | 87 (29.1%) |
| Total | 1,960 (46.7%) | 2,181 (51.9%) |
Disability Status by Sex by Age in Haleyville
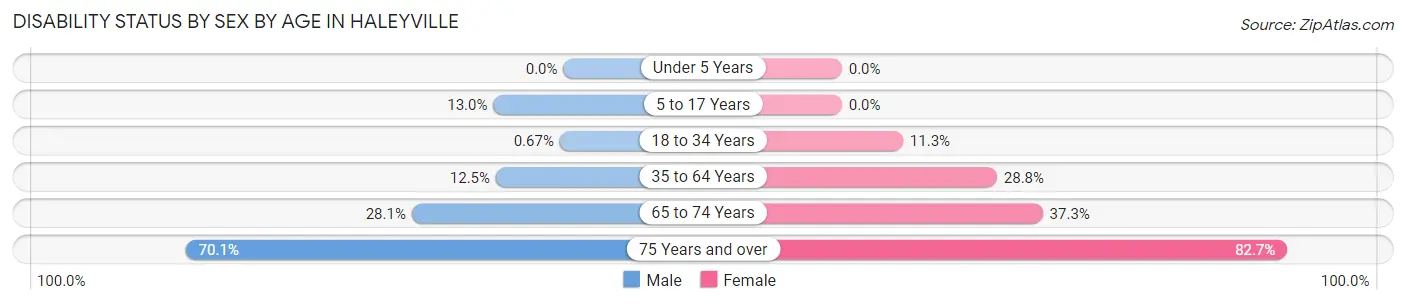
| Age Bracket | Male | Female |
| Under 5 Years | 0 (0.0%) | 0 (0.0%) |
| 5 to 17 Years | 48 (13.0%) | 0 (0.0%) |
| 18 to 34 Years | 4 (0.7%) | 66 (11.3%) |
| 35 to 64 Years | 61 (12.5%) | 255 (28.8%) |
| 65 to 74 Years | 47 (28.1%) | 85 (37.3%) |
| 75 Years and over | 68 (70.1%) | 167 (82.7%) |
Disability Class by Sex by Age in Haleyville
Disability Class: Hearing Difficulty
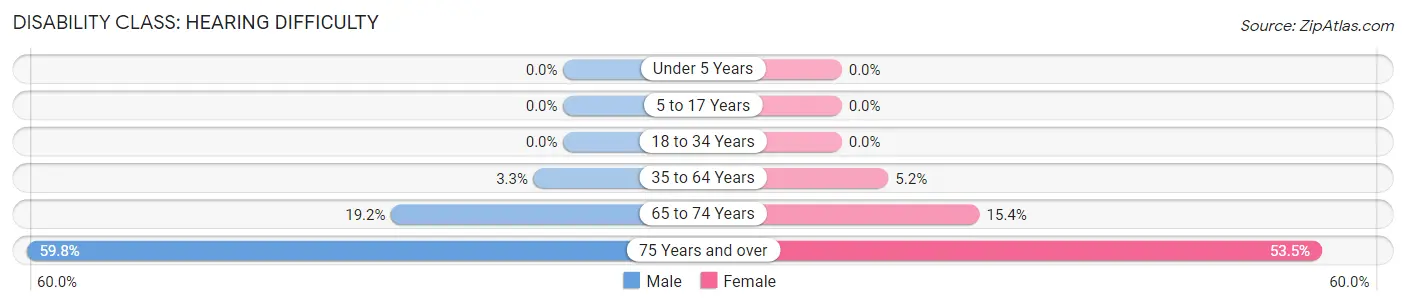
| Age Bracket | Male | Female |
| Under 5 Years | 0 (0.0%) | 0 (0.0%) |
| 5 to 17 Years | 0 (0.0%) | 0 (0.0%) |
| 18 to 34 Years | 0 (0.0%) | 0 (0.0%) |
| 35 to 64 Years | 16 (3.3%) | 46 (5.2%) |
| 65 to 74 Years | 32 (19.2%) | 35 (15.3%) |
| 75 Years and over | 58 (59.8%) | 108 (53.5%) |
Disability Class: Vision Difficulty
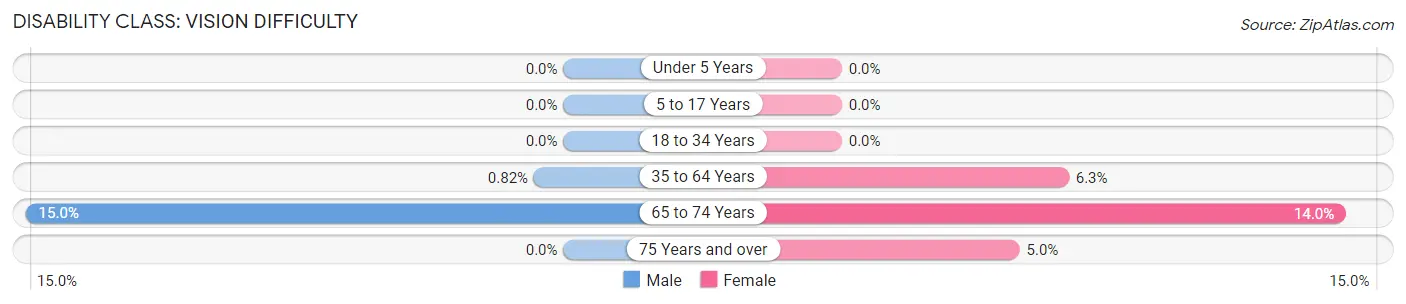
| Age Bracket | Male | Female |
| Under 5 Years | 0 (0.0%) | 0 (0.0%) |
| 5 to 17 Years | 0 (0.0%) | 0 (0.0%) |
| 18 to 34 Years | 0 (0.0%) | 0 (0.0%) |
| 35 to 64 Years | 4 (0.8%) | 56 (6.3%) |
| 65 to 74 Years | 25 (15.0%) | 32 (14.0%) |
| 75 Years and over | 0 (0.0%) | 10 (5.0%) |
Disability Class: Cognitive Difficulty
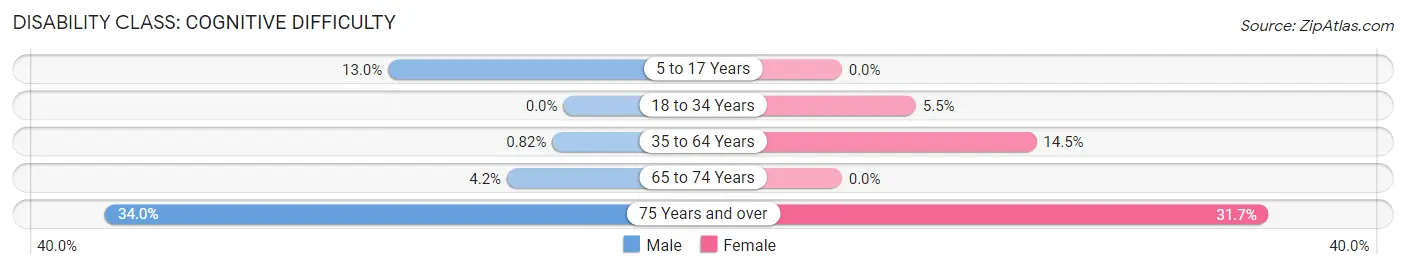
| Age Bracket | Male | Female |
| 5 to 17 Years | 48 (13.0%) | 0 (0.0%) |
| 18 to 34 Years | 0 (0.0%) | 32 (5.5%) |
| 35 to 64 Years | 4 (0.8%) | 128 (14.4%) |
| 65 to 74 Years | 7 (4.2%) | 0 (0.0%) |
| 75 Years and over | 33 (34.0%) | 64 (31.7%) |
Disability Class: Ambulatory Difficulty
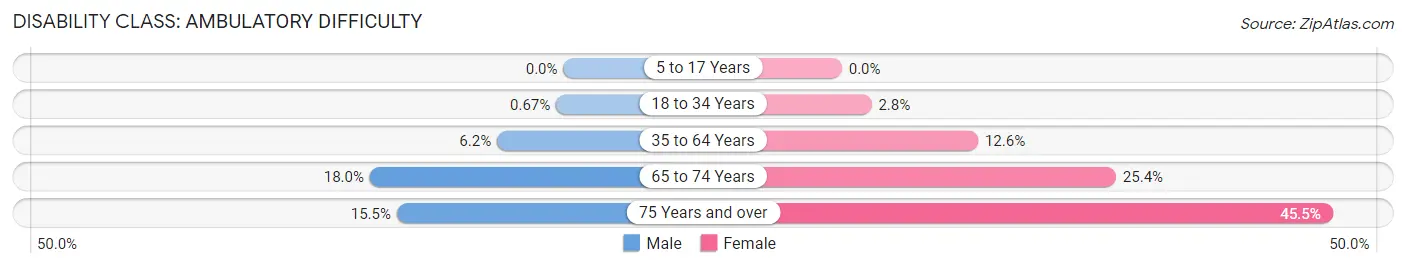
| Age Bracket | Male | Female |
| 5 to 17 Years | 0 (0.0%) | 0 (0.0%) |
| 18 to 34 Years | 4 (0.7%) | 16 (2.8%) |
| 35 to 64 Years | 30 (6.2%) | 112 (12.6%) |
| 65 to 74 Years | 30 (18.0%) | 58 (25.4%) |
| 75 Years and over | 15 (15.5%) | 92 (45.5%) |
Disability Class: Self-Care Difficulty
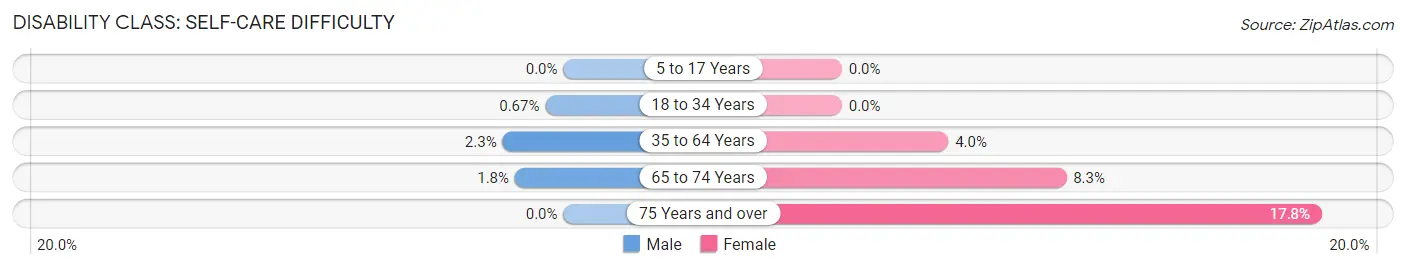
| Age Bracket | Male | Female |
| 5 to 17 Years | 0 (0.0%) | 0 (0.0%) |
| 18 to 34 Years | 4 (0.7%) | 0 (0.0%) |
| 35 to 64 Years | 11 (2.3%) | 35 (4.0%) |
| 65 to 74 Years | 3 (1.8%) | 19 (8.3%) |
| 75 Years and over | 0 (0.0%) | 36 (17.8%) |
Technology Access in Haleyville
Computing Device Access in Haleyville
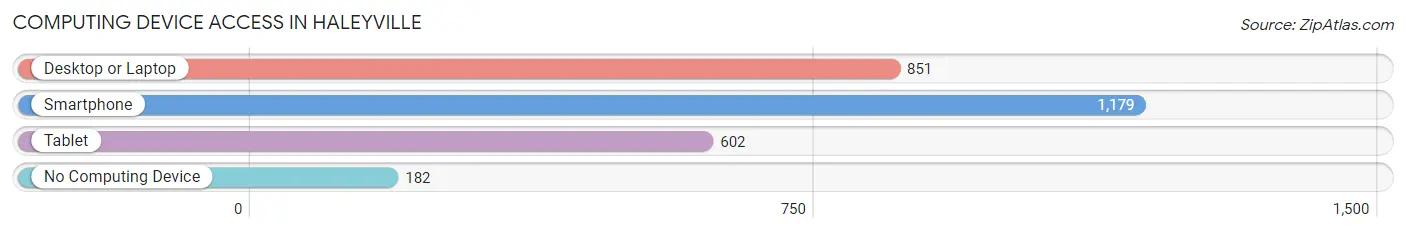
| Device Type | # Households | % Households |
| Desktop or Laptop | 851 | 59.6% |
| Smartphone | 1,179 | 82.5% |
| Tablet | 602 | 42.1% |
| No Computing Device | 182 | 12.7% |
| Total | 1,429 | 100.0% |
Internet Access in Haleyville
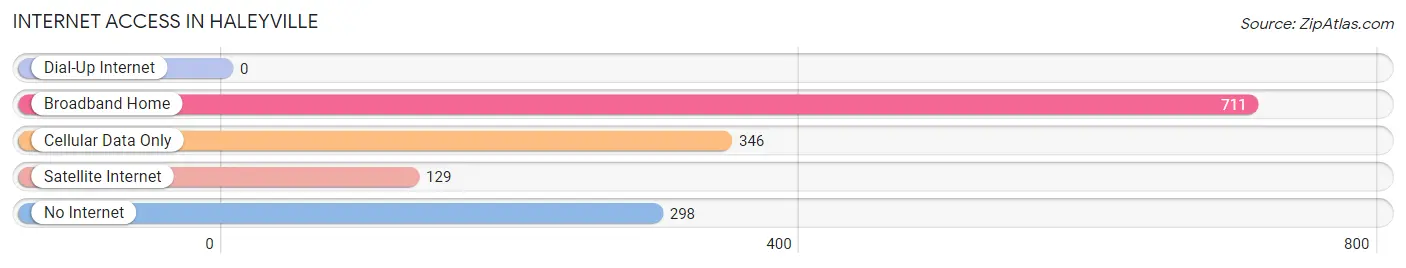
| Internet Type | # Households | % Households |
| Dial-Up Internet | 0 | 0.0% |
| Broadband Home | 711 | 49.8% |
| Cellular Data Only | 346 | 24.2% |
| Satellite Internet | 129 | 9.0% |
| No Internet | 298 | 20.8% |
| Total | 1,429 | 100.0% |
Haleyville Summary
Haleyville is a city located in the northwest corner of the state of Alabama, United States. It is the county seat of Winston County and is part of the Birmingham-Hoover Metropolitan Statistical Area. The city was incorporated in 1887 and has a population of 4,169 as of the 2010 census.
History
Haleyville was founded in 1883 by William Henry Haley, a former Confederate soldier. He named the town after himself and it quickly became a thriving center of commerce and industry. The town was incorporated in 1887 and the first mayor was elected in 1888.
The city was a major center of the coal mining industry in the early 20th century. The coal mines provided jobs for many of the residents and helped to fuel the local economy. The city also had a thriving lumber industry, which provided timber for the construction of homes and businesses.
The city was also home to a large number of textile mills, which provided employment for many of the residents. The city was also home to a large number of manufacturing plants, which provided jobs for many of the residents.
The city was also home to a large number of churches, which provided spiritual guidance for the residents. The city was also home to a large number of schools, which provided education for the residents.
Geography
Haleyville is located at 34°18'25" North, 87°41'17" West (34.306944, -87.688056). The city is situated in the northwest corner of the state of Alabama, in the foothills of the Appalachian Mountains. The city is located in Winston County and is part of the Birmingham-Hoover Metropolitan Statistical Area.
The city has a total area of 8.2 square miles, of which 8.1 square miles is land and 0.1 square miles is water. The city is located at an elevation of 845 feet above sea level.
Economy
Haleyville's economy is largely based on manufacturing and retail. The city is home to a number of manufacturing plants, including a steel mill, a paper mill, and a furniture factory. The city is also home to a number of retail stores, including a Walmart Supercenter, a Lowe's Home Improvement store, and a number of other stores.
The city is also home to a number of restaurants, including a number of fast food restaurants, a number of family-style restaurants, and a number of fine dining establishments. The city is also home to a number of hotels, including a Holiday Inn Express and a Comfort Inn.
Demographics
As of the 2010 census, the city had a population of 4,169. The racial makeup of the city was 79.2% White, 17.3% African American, 0.3% Native American, 0.3% Asian, 0.1% Pacific Islander, 1.2% from other races, and 1.7% from two or more races. Hispanic or Latino of any race were 2.7% of the population.
The median income for a household in the city was $30,938, and the median income for a family was $37,917. The per capita income for the city was $17,845. About 17.2% of families and 20.2% of the population were below the poverty line, including 28.2% of those under age 18 and 16.2% of those age 65 or over.
Common Questions
What is Per Capita Income in Haleyville?
Per Capita income in Haleyville is $24,202.
What is the Median Family Income in Haleyville?
Median Family Income in Haleyville is $56,734.
What is the Median Household income in Haleyville?
Median Household Income in Haleyville is $52,656.
What is Income or Wage Gap in Haleyville?
Income or Wage Gap in Haleyville is 24.8%.
Women in Haleyville earn 75.2 cents for every dollar earned by a man.
What is Inequality or Gini Index in Haleyville?
Inequality or Gini Index in Haleyville is 0.47.
What is the Total Population of Haleyville?
Total Population of Haleyville is 4,339.
What is the Total Male Population of Haleyville?
Total Male Population of Haleyville is 1,836.
What is the Total Female Population of Haleyville?
Total Female Population of Haleyville is 2,503.
What is the Ratio of Males per 100 Females in Haleyville?
There are 73.35 Males per 100 Females in Haleyville.
What is the Ratio of Females per 100 Males in Haleyville?
There are 136.33 Females per 100 Males in Haleyville.
What is the Median Population Age in Haleyville?
Median Population Age in Haleyville is 35.8 Years.
What is the Average Family Size in Haleyville
Average Family Size in Haleyville is 3.6 People.
What is the Average Household Size in Haleyville
Average Household Size in Haleyville is 2.9 People.
How Large is the Labor Force in Haleyville?
There are 1,932 People in the Labor Forcein in Haleyville.
What is the Percentage of People in the Labor Force in Haleyville?
55.4% of People are in the Labor Force in Haleyville.
What is the Unemployment Rate in Haleyville?
Unemployment Rate in Haleyville is 5.9%.