Stockton, AL Map & Demographics
Stockton Map
Stockton Overview
$49,564
PER CAPITA INCOME
$139,235
AVG FAMILY INCOME
$138,246
AVG HOUSEHOLD INCOME
0.29
INEQUALITY / GINI INDEX
420
TOTAL POPULATION
259
MALE POPULATION
161
FEMALE POPULATION
160.87
MALES / 100 FEMALES
62.16
FEMALES / 100 MALES
48.5
MEDIAN AGE
2.7
AVG FAMILY SIZE
2.3
AVG HOUSEHOLD SIZE
238
LABOR FORCE [ PEOPLE ]
60.4%
PERCENT IN LABOR FORCE
Stockton Zip Codes
Stockton Area Codes
Income in Stockton
Income Overview in Stockton
Per Capita Income in Stockton is $49,564, while median incomes of families and households are $139,235 and $138,246 respectively.
| Characteristic | Number | Measure |
| Per Capita Income | 420 | $49,564 |
| Median Family Income | 133 | $139,235 |
| Mean Family Income | 133 | $137,666 |
| Median Household Income | 186 | $138,246 |
| Mean Household Income | 186 | $108,096 |
| Income Deficit | 133 | $0 |
| Wage / Income Gap (%) | 420 | 0.00% |
| Wage / Income Gap ($) | 420 | 100.00¢ per $1 |
| Gini / Inequality Index | 420 | 0.29 |
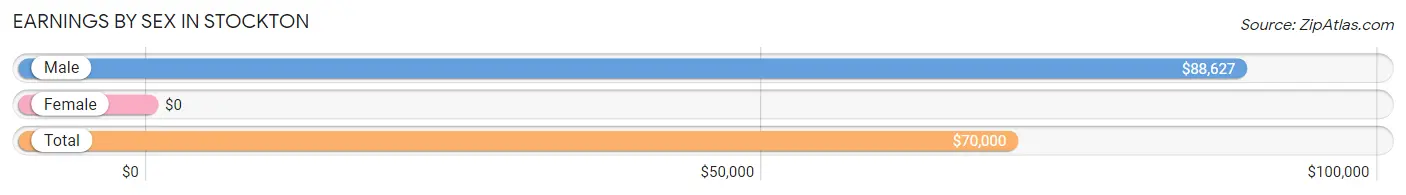
Earnings by Sex in Stockton
| Sex | Number | Average Earnings |
| Male | 98 (41.2%) | $88,627 |
| Female | 140 (58.8%) | $0 |
| Total | 238 (100.0%) | $70,000 |
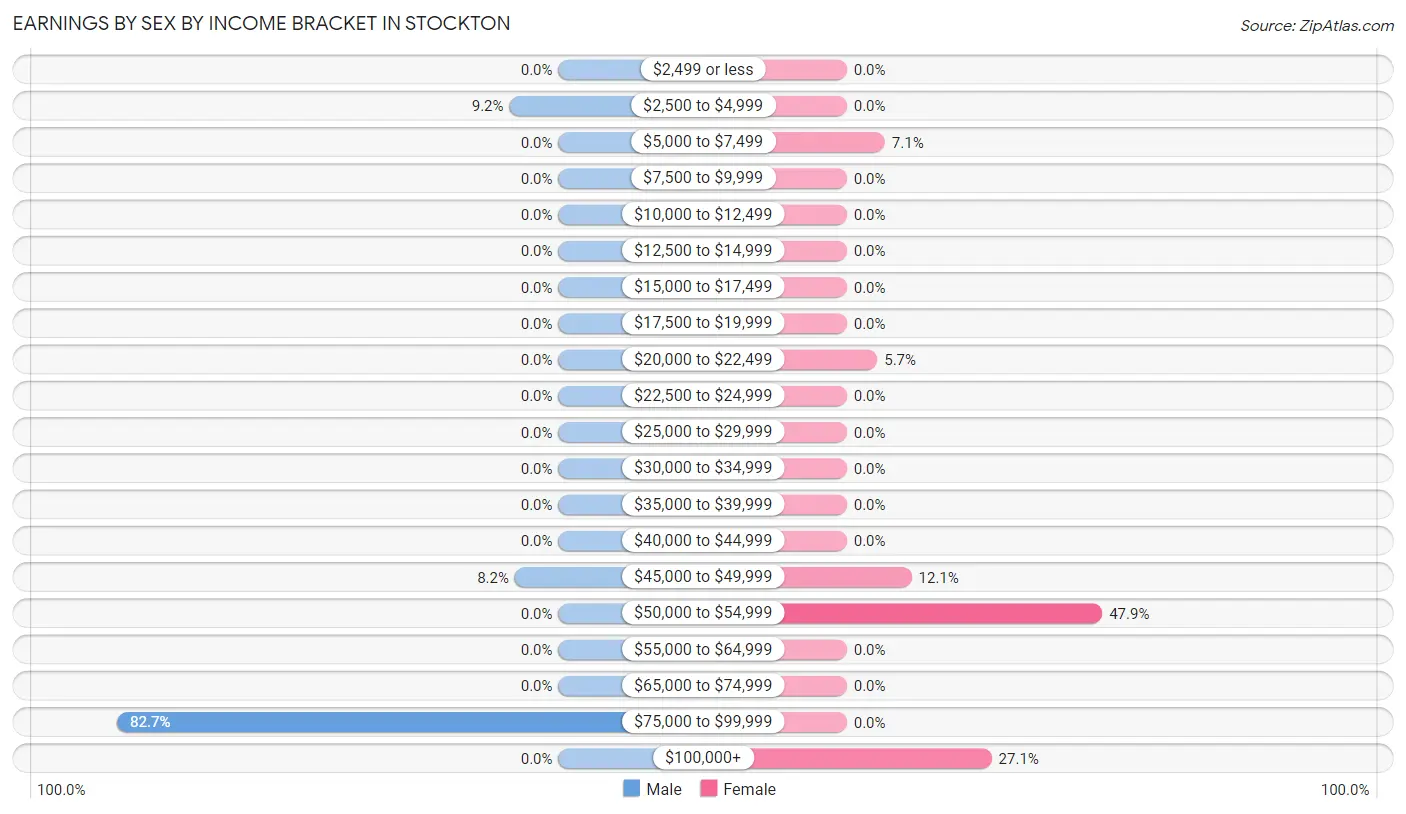
Earnings by Sex by Income Bracket in Stockton
The most common earnings brackets in Stockton are $75,000 to $99,999 for men (81 | 82.7%) and $50,000 to $54,999 for women (67 | 47.9%).
| Income | Male | Female |
| $2,499 or less | 0 (0.0%) | 0 (0.0%) |
| $2,500 to $4,999 | 9 (9.2%) | 0 (0.0%) |
| $5,000 to $7,499 | 0 (0.0%) | 10 (7.1%) |
| $7,500 to $9,999 | 0 (0.0%) | 0 (0.0%) |
| $10,000 to $12,499 | 0 (0.0%) | 0 (0.0%) |
| $12,500 to $14,999 | 0 (0.0%) | 0 (0.0%) |
| $15,000 to $17,499 | 0 (0.0%) | 0 (0.0%) |
| $17,500 to $19,999 | 0 (0.0%) | 0 (0.0%) |
| $20,000 to $22,499 | 0 (0.0%) | 8 (5.7%) |
| $22,500 to $24,999 | 0 (0.0%) | 0 (0.0%) |
| $25,000 to $29,999 | 0 (0.0%) | 0 (0.0%) |
| $30,000 to $34,999 | 0 (0.0%) | 0 (0.0%) |
| $35,000 to $39,999 | 0 (0.0%) | 0 (0.0%) |
| $40,000 to $44,999 | 0 (0.0%) | 0 (0.0%) |
| $45,000 to $49,999 | 8 (8.2%) | 17 (12.1%) |
| $50,000 to $54,999 | 0 (0.0%) | 67 (47.9%) |
| $55,000 to $64,999 | 0 (0.0%) | 0 (0.0%) |
| $65,000 to $74,999 | 0 (0.0%) | 0 (0.0%) |
| $75,000 to $99,999 | 81 (82.7%) | 0 (0.0%) |
| $100,000+ | 0 (0.0%) | 38 (27.1%) |
| Total | 98 (100.0%) | 140 (100.0%) |
Earnings by Sex by Educational Attainment in Stockton
| Educational Attainment | Male Income | Female Income |
| Less than High School | - | - |
| High School Diploma | - | - |
| College or Associate's Degree | - | - |
| Bachelor's Degree | - | - |
| Graduate Degree | - | - |
| Total | $88,627 | $0 |
Family Income in Stockton
Family Income Brackets in Stockton
According to the Stockton family income data, there are 85 families falling into the $100,000 to $149,999 income range, which is the most common income bracket and makes up 63.9% of all families.
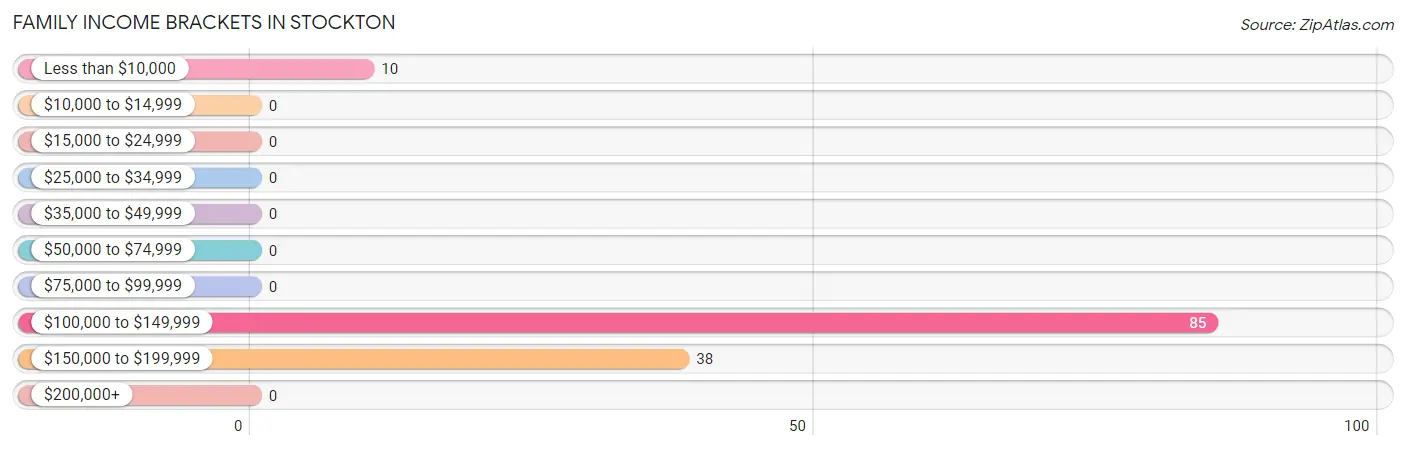
| Income Bracket | # Families | % Families |
| Less than $10,000 | 10 | 7.5% |
| $10,000 to $14,999 | 0 | 0.0% |
| $15,000 to $24,999 | 0 | 0.0% |
| $25,000 to $34,999 | 0 | 0.0% |
| $35,000 to $49,999 | 0 | 0.0% |
| $50,000 to $74,999 | 0 | 0.0% |
| $75,000 to $99,999 | 0 | 0.0% |
| $100,000 to $149,999 | 85 | 63.9% |
| $150,000 to $199,999 | 38 | 28.6% |
| $200,000+ | 0 | 0.0% |
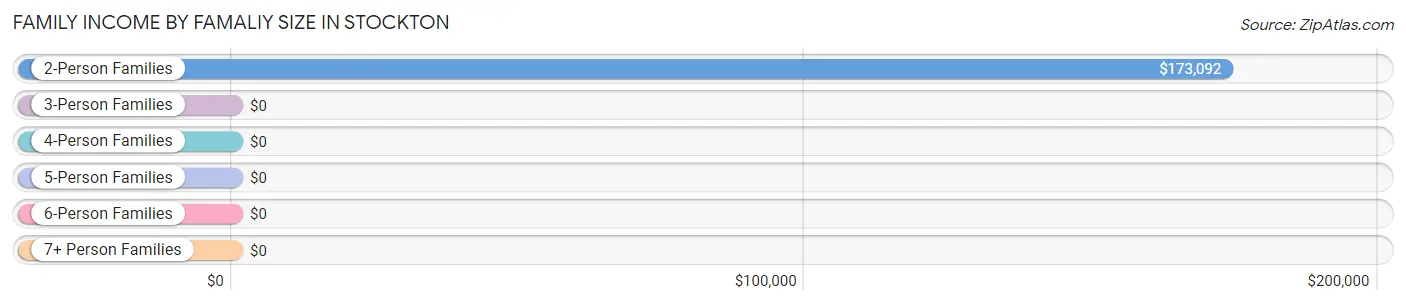
Family Income by Famaliy Size in Stockton
2-person families (58 | 43.6%) account for the highest median family income in Stockton with $173,092 per family, while 2-person families (58 | 43.6%) have the highest median income of $86,546 per family member.
| Income Bracket | # Families | Median Income |
| 2-Person Families | 58 (43.6%) | $173,092 |
| 3-Person Families | 67 (50.4%) | $0 |
| 4-Person Families | 0 (0.0%) | $0 |
| 5-Person Families | 8 (6.0%) | $0 |
| 6-Person Families | 0 (0.0%) | $0 |
| 7+ Person Families | 0 (0.0%) | $0 |
| Total | 133 (100.0%) | $139,235 |
Family Income by Number of Earners in Stockton
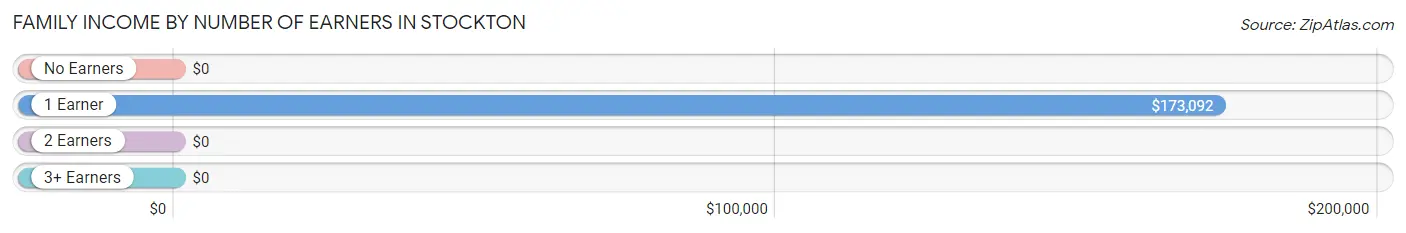
| Number of Earners | # Families | Median Income |
| No Earners | 0 (0.0%) | $0 |
| 1 Earner | 58 (43.6%) | $173,092 |
| 2 Earners | 67 (50.4%) | $0 |
| 3+ Earners | 8 (6.0%) | $0 |
| Total | 133 (100.0%) | $139,235 |
Household Income in Stockton
Household Income Brackets in Stockton
With 85 households falling in the category, the $100,000 to $149,999 income range is the most frequent in Stockton, accounting for 45.7% of all households.
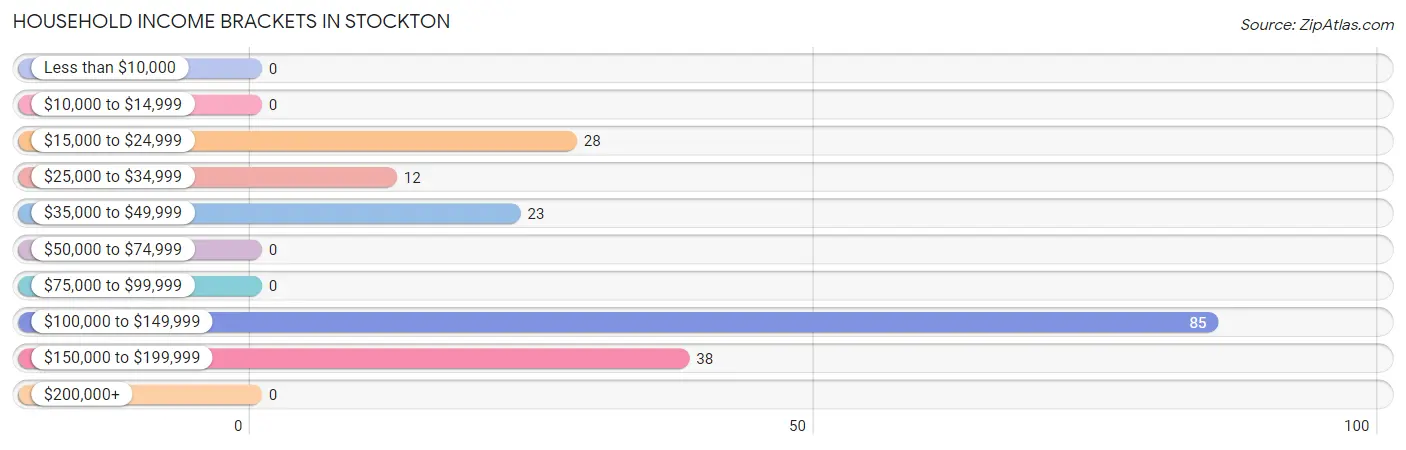
| Income Bracket | # Households | % Households |
| Less than $10,000 | 0 | 0.0% |
| $10,000 to $14,999 | 0 | 0.0% |
| $15,000 to $24,999 | 28 | 15.1% |
| $25,000 to $34,999 | 12 | 6.5% |
| $35,000 to $49,999 | 23 | 12.4% |
| $50,000 to $74,999 | 0 | 0.0% |
| $75,000 to $99,999 | 0 | 0.0% |
| $100,000 to $149,999 | 85 | 45.7% |
| $150,000 to $199,999 | 38 | 20.4% |
| $200,000+ | 0 | 0.0% |
Household Income by Householder Age in Stockton
| Income Bracket | # Households | Median Income |
| 15 to 24 Years | 0 (0.0%) | $0 |
| 25 to 44 Years | 67 (36.0%) | $0 |
| 45 to 64 Years | 81 (43.5%) | $0 |
| 65+ Years | 38 (20.4%) | $0 |
| Total | 186 (100.0%) | $138,246 |
Poverty in Stockton
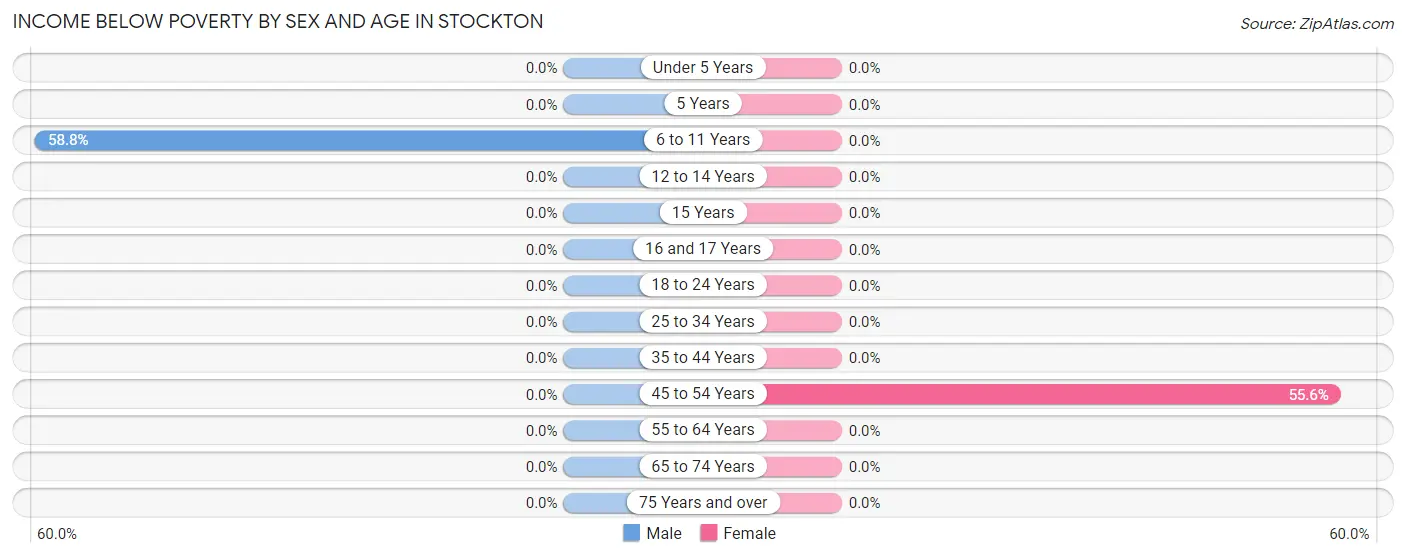
Income Below Poverty by Sex and Age in Stockton
With 3.9% poverty level for males and 6.2% for females among the residents of Stockton, 6 to 11 year old males and 45 to 54 year old females are the most vulnerable to poverty, with 10 males (58.8%) and 10 females (55.6%) in their respective age groups living below the poverty level.
| Age Bracket | Male | Female |
| Under 5 Years | 0 (0.0%) | 0 (0.0%) |
| 5 Years | 0 (0.0%) | 0 (0.0%) |
| 6 to 11 Years | 10 (58.8%) | 0 (0.0%) |
| 12 to 14 Years | 0 (0.0%) | 0 (0.0%) |
| 15 Years | 0 (0.0%) | 0 (0.0%) |
| 16 and 17 Years | 0 (0.0%) | 0 (0.0%) |
| 18 to 24 Years | 0 (0.0%) | 0 (0.0%) |
| 25 to 34 Years | 0 (0.0%) | 0 (0.0%) |
| 35 to 44 Years | 0 (0.0%) | 0 (0.0%) |
| 45 to 54 Years | 0 (0.0%) | 10 (55.6%) |
| 55 to 64 Years | 0 (0.0%) | 0 (0.0%) |
| 65 to 74 Years | 0 (0.0%) | 0 (0.0%) |
| 75 Years and over | 0 (0.0%) | 0 (0.0%) |
| Total | 10 (3.9%) | 10 (6.2%) |
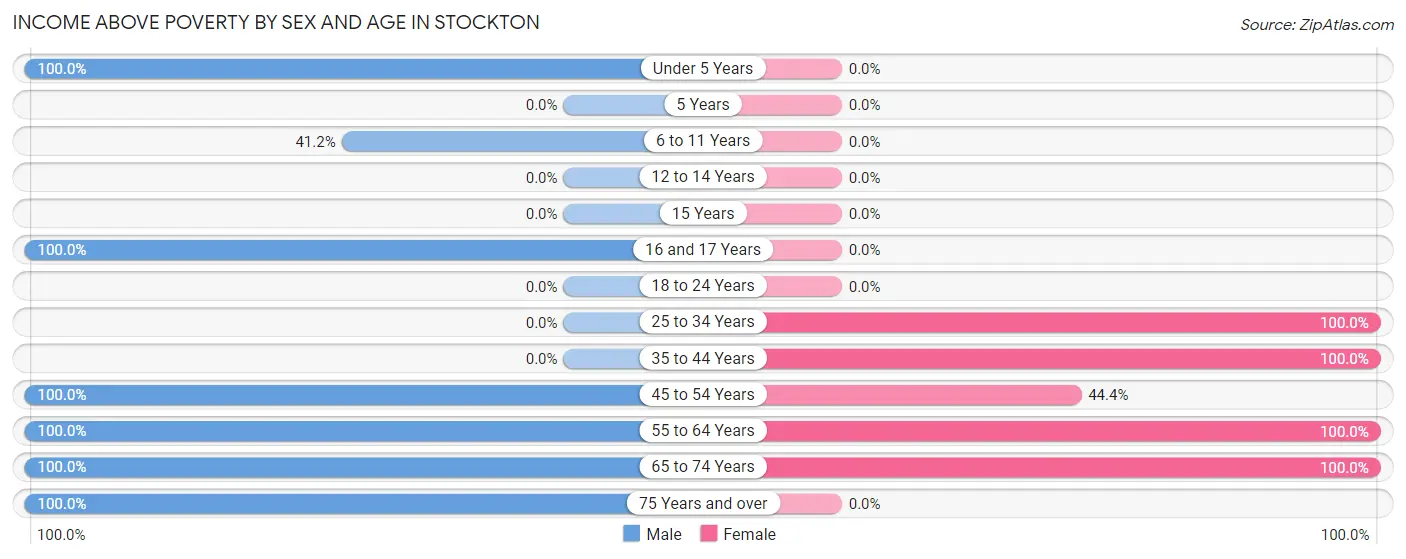
Income Above Poverty by Sex and Age in Stockton
According to the poverty statistics in Stockton, males aged under 5 years and females aged 25 to 34 years are the age groups that are most secure financially, with 100.0% of males and 100.0% of females in these age groups living above the poverty line.
| Age Bracket | Male | Female |
| Under 5 Years | 9 (100.0%) | 0 (0.0%) |
| 5 Years | 0 (0.0%) | 0 (0.0%) |
| 6 to 11 Years | 7 (41.2%) | 0 (0.0%) |
| 12 to 14 Years | 0 (0.0%) | 0 (0.0%) |
| 15 Years | 0 (0.0%) | 0 (0.0%) |
| 16 and 17 Years | 57 (100.0%) | 0 (0.0%) |
| 18 to 24 Years | 0 (0.0%) | 0 (0.0%) |
| 25 to 34 Years | 0 (0.0%) | 17 (100.0%) |
| 35 to 44 Years | 0 (0.0%) | 67 (100.0%) |
| 45 to 54 Years | 71 (100.0%) | 8 (44.4%) |
| 55 to 64 Years | 21 (100.0%) | 50 (100.0%) |
| 65 to 74 Years | 71 (100.0%) | 9 (100.0%) |
| 75 Years and over | 13 (100.0%) | 0 (0.0%) |
| Total | 249 (96.1%) | 151 (93.8%) |
Income Below Poverty Among Married-Couple Families in Stockton
| Children | Above Poverty | Below Poverty |
| No Children | 48 (100.0%) | 0 (0.0%) |
| 1 or 2 Children | 75 (100.0%) | 0 (0.0%) |
| 3 or 4 Children | 0 (0.0%) | 0 (0.0%) |
| 5 or more Children | 0 (0.0%) | 0 (0.0%) |
| Total | 123 (100.0%) | 0 (0.0%) |
Income Below Poverty Among Single-Parent Households in Stockton
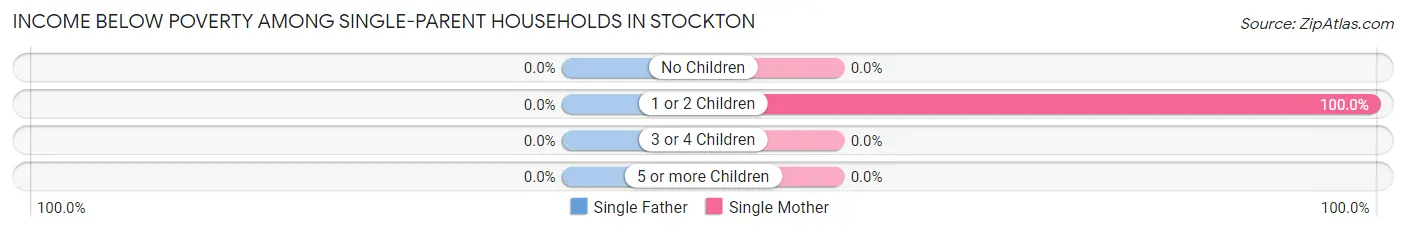
| Children | Single Father | Single Mother |
| No Children | 0 (0.0%) | 0 (0.0%) |
| 1 or 2 Children | 0 (0.0%) | 10 (100.0%) |
| 3 or 4 Children | 0 (0.0%) | 0 (0.0%) |
| 5 or more Children | 0 (0.0%) | 0 (0.0%) |
| Total | 0 (0.0%) | 10 (100.0%) |
Income Below Poverty Among Married-Couple vs Single-Parent Households in Stockton
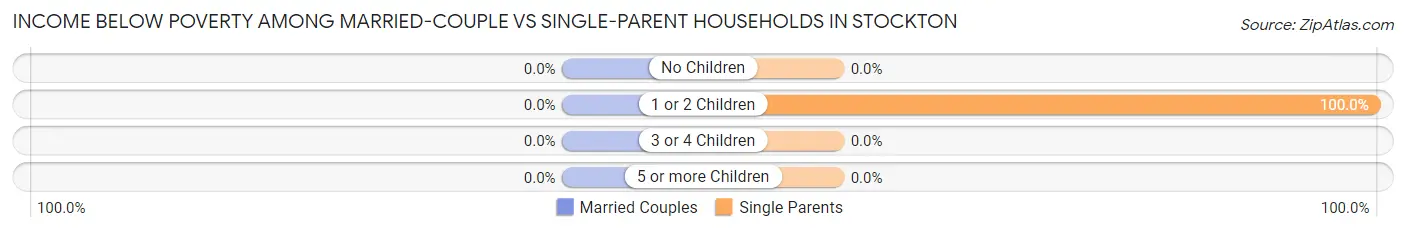
| Children | Married-Couple Families | Single-Parent Households |
| No Children | 0 (0.0%) | 0 (0.0%) |
| 1 or 2 Children | 0 (0.0%) | 10 (100.0%) |
| 3 or 4 Children | 0 (0.0%) | 0 (0.0%) |
| 5 or more Children | 0 (0.0%) | 0 (0.0%) |
| Total | 0 (0.0%) | 10 (100.0%) |
Race in Stockton
The most populous races in Stockton are White / Caucasian (396 | 94.3%), Black / African American (15 | 3.6%), and Some other Race (9 | 2.1%).
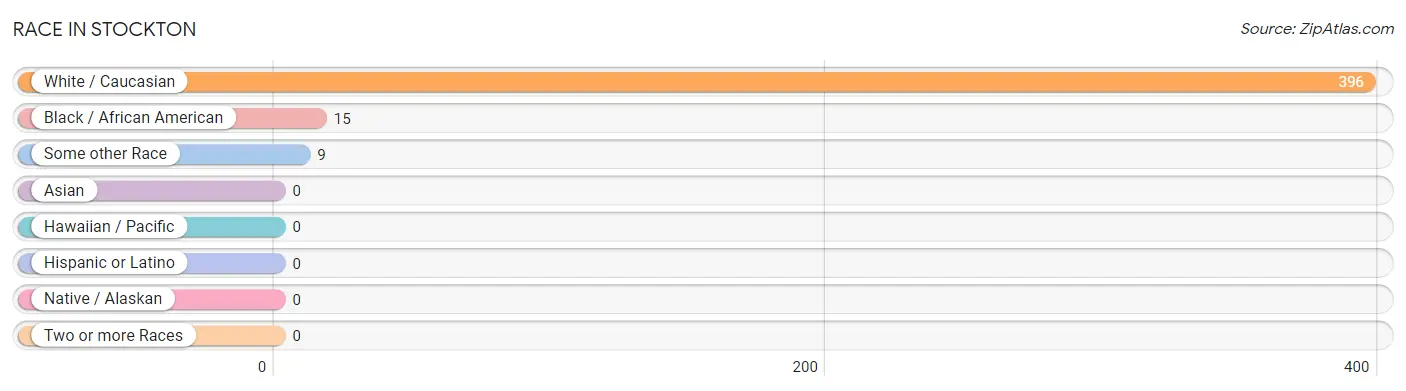
| Race | # Population | % Population |
| Asian | 0 | 0.0% |
| Black / African American | 15 | 3.6% |
| Hawaiian / Pacific | 0 | 0.0% |
| Hispanic or Latino | 0 | 0.0% |
| Native / Alaskan | 0 | 0.0% |
| White / Caucasian | 396 | 94.3% |
| Two or more Races | 0 | 0.0% |
| Some other Race | 9 | 2.1% |
| Total | 420 | 100.0% |
Ancestry in Stockton
The most populous ancestries reported in Stockton are , and American (370 | 88.1%), together accounting for 88.1% of all Stockton residents.

| Ancestry | # Population | % Population |
| American | 370 | 88.1% | View All 1 Rows |
Immigrants in Stockton

| Immigration Origin | # Population | % Population | View All 0 Rows |
Sex and Age in Stockton
Sex and Age in Stockton
The most populous age groups in Stockton are 45 to 49 Years (71 | 27.4%) for men and 40 to 44 Years (67 | 41.6%) for women.
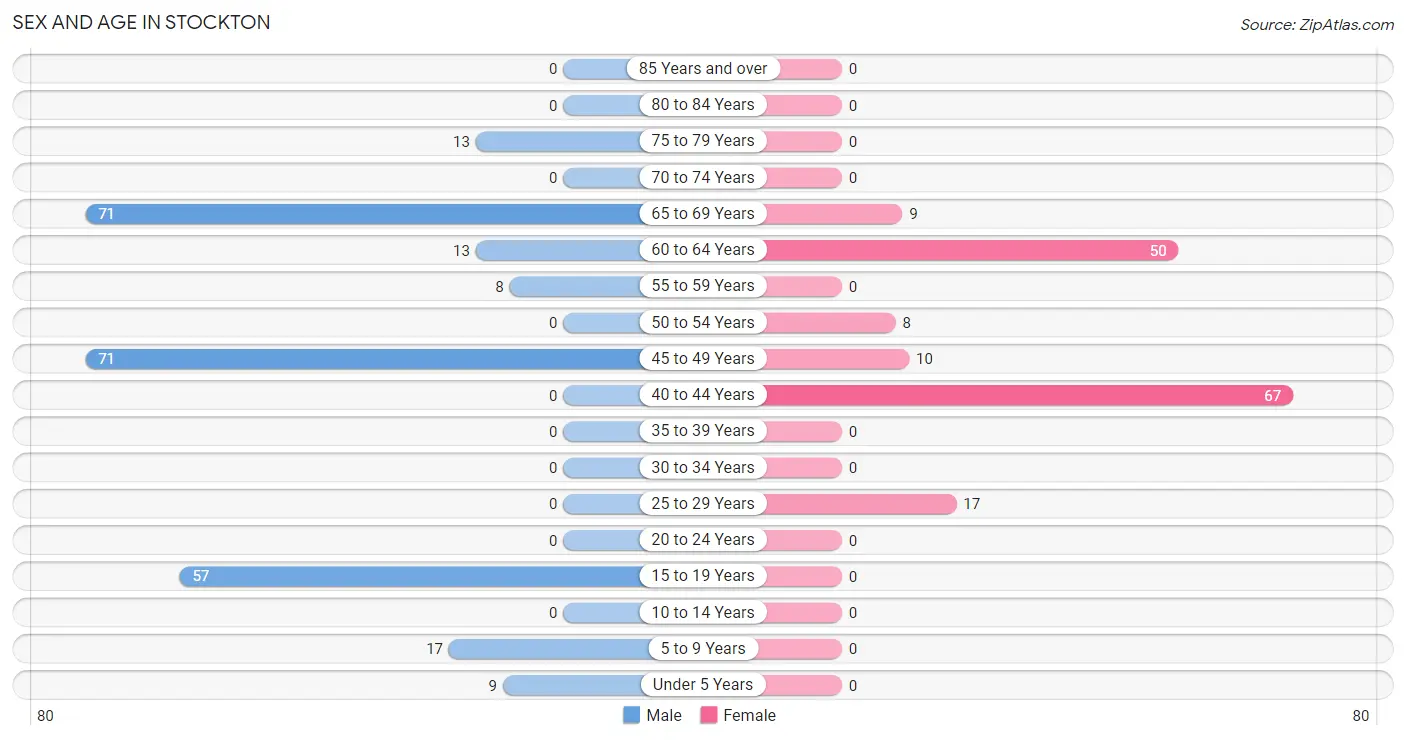
| Age Bracket | Male | Female |
| Under 5 Years | 9 (3.5%) | 0 (0.0%) |
| 5 to 9 Years | 17 (6.6%) | 0 (0.0%) |
| 10 to 14 Years | 0 (0.0%) | 0 (0.0%) |
| 15 to 19 Years | 57 (22.0%) | 0 (0.0%) |
| 20 to 24 Years | 0 (0.0%) | 0 (0.0%) |
| 25 to 29 Years | 0 (0.0%) | 17 (10.6%) |
| 30 to 34 Years | 0 (0.0%) | 0 (0.0%) |
| 35 to 39 Years | 0 (0.0%) | 0 (0.0%) |
| 40 to 44 Years | 0 (0.0%) | 67 (41.6%) |
| 45 to 49 Years | 71 (27.4%) | 10 (6.2%) |
| 50 to 54 Years | 0 (0.0%) | 8 (5.0%) |
| 55 to 59 Years | 8 (3.1%) | 0 (0.0%) |
| 60 to 64 Years | 13 (5.0%) | 50 (31.1%) |
| 65 to 69 Years | 71 (27.4%) | 9 (5.6%) |
| 70 to 74 Years | 0 (0.0%) | 0 (0.0%) |
| 75 to 79 Years | 13 (5.0%) | 0 (0.0%) |
| 80 to 84 Years | 0 (0.0%) | 0 (0.0%) |
| 85 Years and over | 0 (0.0%) | 0 (0.0%) |
| Total | 259 (100.0%) | 161 (100.0%) |
Families and Households in Stockton
Median Family Size in Stockton
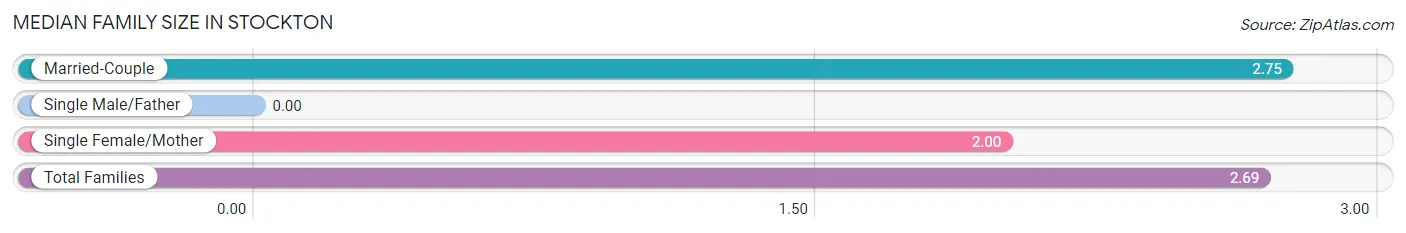
| Family Type | # Families | Family Size |
| Married-Couple | 123 (92.5%) | 2.75 |
| Single Male/Father | 0 (0.0%) | - |
| Single Female/Mother | 10 (7.5%) | 2.00 |
| Total Families | 133 (100.0%) | 2.69 |
Median Household Size in Stockton
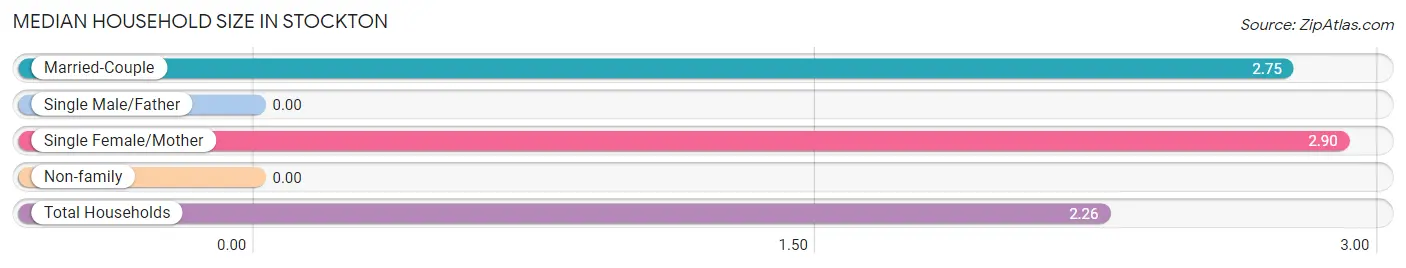
| Household Type | # Households | Household Size |
| Married-Couple | 123 (66.1%) | 2.75 |
| Single Male/Father | 0 (0.0%) | - |
| Single Female/Mother | 10 (5.4%) | 2.90 |
| Non-family | 53 (28.5%) | - |
| Total Households | 186 (100.0%) | 2.26 |
Household Size by Marriage Status in Stockton
Out of a total of 186 households in Stockton, 133 (71.5%) are family households, while 53 (28.5%) are nonfamily households. The most numerous type of family households are 3-person households, comprising 77, and the most common type of nonfamily households are 1-person households, comprising 53.
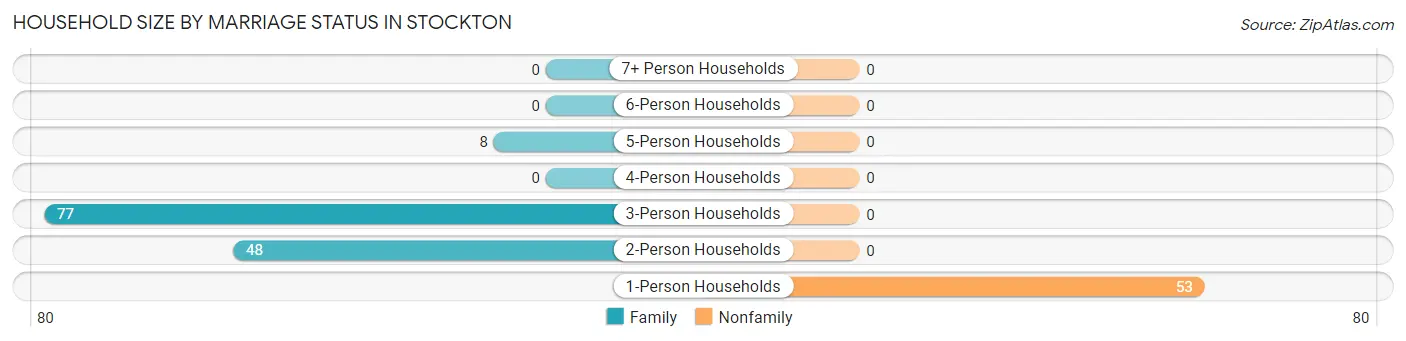
| Household Size | Family Households | Nonfamily Households |
| 1-Person Households | - | 53 (28.5%) |
| 2-Person Households | 48 (25.8%) | 0 (0.0%) |
| 3-Person Households | 77 (41.4%) | 0 (0.0%) |
| 4-Person Households | 0 (0.0%) | 0 (0.0%) |
| 5-Person Households | 8 (4.3%) | 0 (0.0%) |
| 6-Person Households | 0 (0.0%) | 0 (0.0%) |
| 7+ Person Households | 0 (0.0%) | 0 (0.0%) |
| Total | 133 (71.5%) | 53 (28.5%) |
Female Fertility in Stockton
Fertility by Age in Stockton
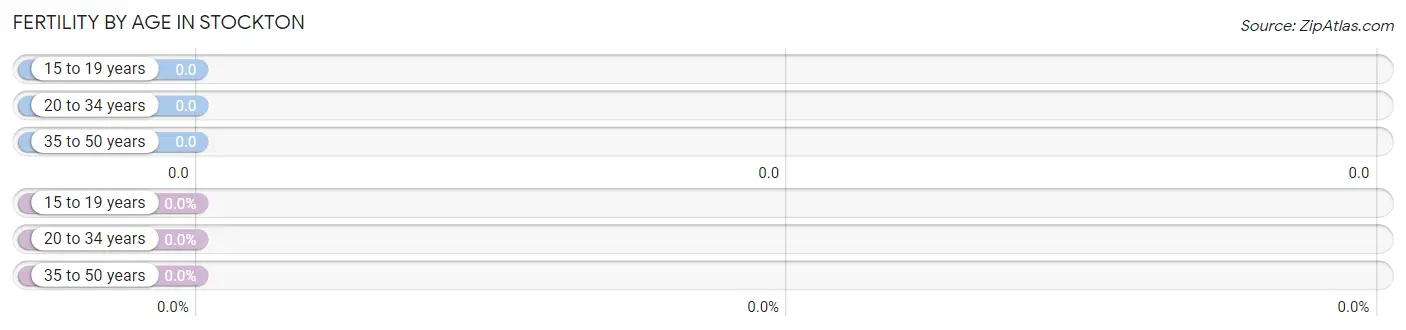
| Age Bracket | Women with Births | Births / 1,000 Women |
| 15 to 19 years | 0 (0.0%) | 0.0 |
| 20 to 34 years | 0 (0.0%) | 0.0 |
| 35 to 50 years | 0 (0.0%) | 0.0 |
| Total | 0 (0.0%) | 0.0 |
Fertility by Age by Marriage Status in Stockton
| Age Bracket | Married | Unmarried |
| 15 to 19 years | 0 (0.0%) | 0 (0.0%) |
| 20 to 34 years | 0 (0.0%) | 0 (0.0%) |
| 35 to 50 years | 0 (0.0%) | 0 (0.0%) |
| Total | 0 (0.0%) | 0 (0.0%) |
Fertility by Education in Stockton
| Educational Attainment | Women with Births | Births / 1,000 Women |
| Less than High School | 0 (0.0%) | 0.0 |
| High School Diploma | 0 (0.0%) | 0.0 |
| College or Associate's Degree | 0 (0.0%) | 0.0 |
| Bachelor's Degree | 0 (0.0%) | 0.0 |
| Graduate Degree | 0 (0.0%) | 0.0 |
| Total | 0 (0.0%) | 0.0 |
Fertility by Education by Marriage Status in Stockton
| Educational Attainment | Married | Unmarried |
| Less than High School | 0 (0.0%) | 0 (0.0%) |
| High School Diploma | 0 (0.0%) | 0 (0.0%) |
| College or Associate's Degree | 0 (0.0%) | 0 (0.0%) |
| Bachelor's Degree | 0 (0.0%) | 0 (0.0%) |
| Graduate Degree | 0 (0.0%) | 0 (0.0%) |
| Total | 0 (0.0%) | 0 (0.0%) |
Employment Characteristics in Stockton
Employment by Class of Employer in Stockton
Among the 238 employed individuals in Stockton, local government employees (71 | 29.8%), state government employees (67 | 28.1%), and not-for-profit organizations (48 | 20.2%) make up the most common classes of employment.
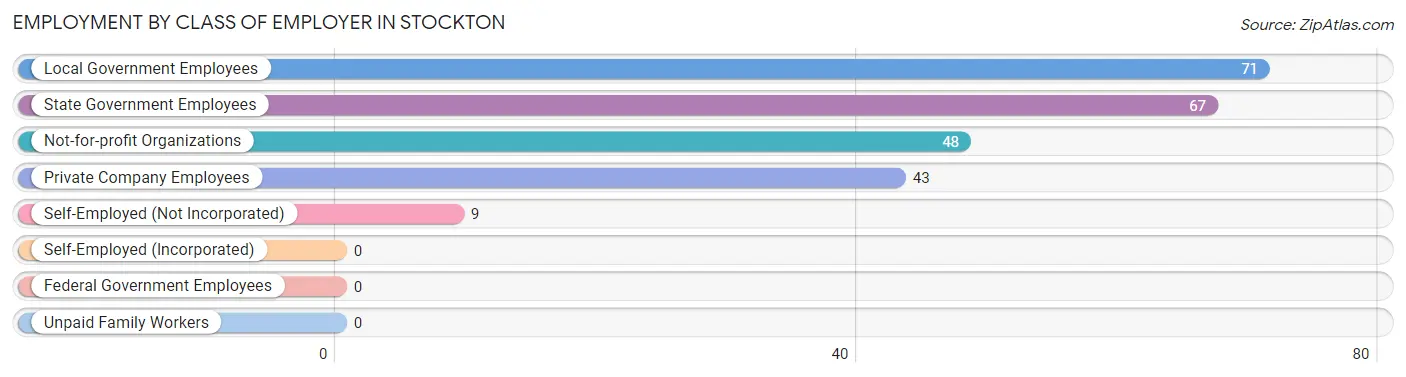
| Employer Class | # Employees | % Employees |
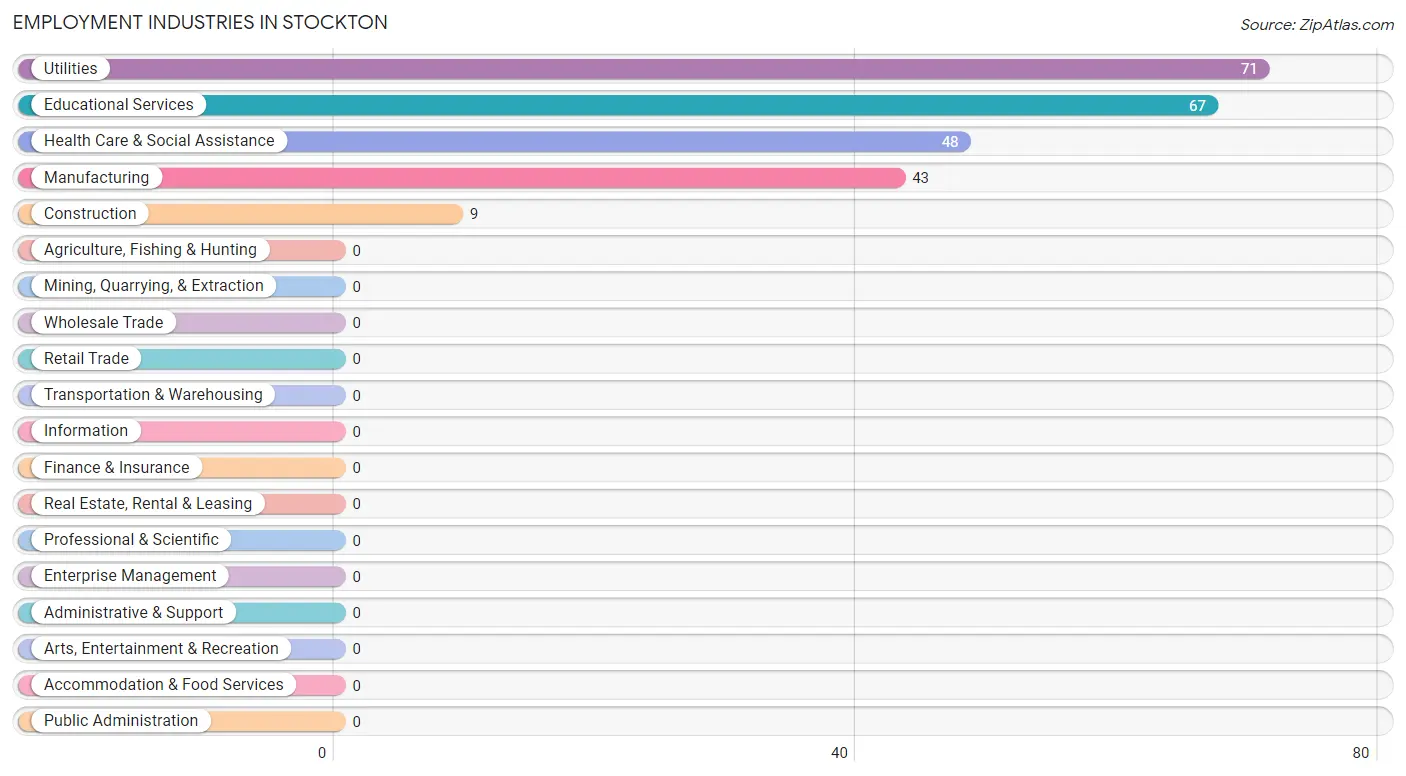
| Private Company Employees | 43 | 18.1% |
| Self-Employed (Incorporated) | 0 | 0.0% |
| Self-Employed (Not Incorporated) | 9 | 3.8% |
| Not-for-profit Organizations | 48 | 20.2% |
| Local Government Employees | 71 | 29.8% |
| State Government Employees | 67 | 28.1% |
| Federal Government Employees | 0 | 0.0% |
| Unpaid Family Workers | 0 | 0.0% |
| Total | 238 | 100.0% |
Employment Status by Age in Stockton
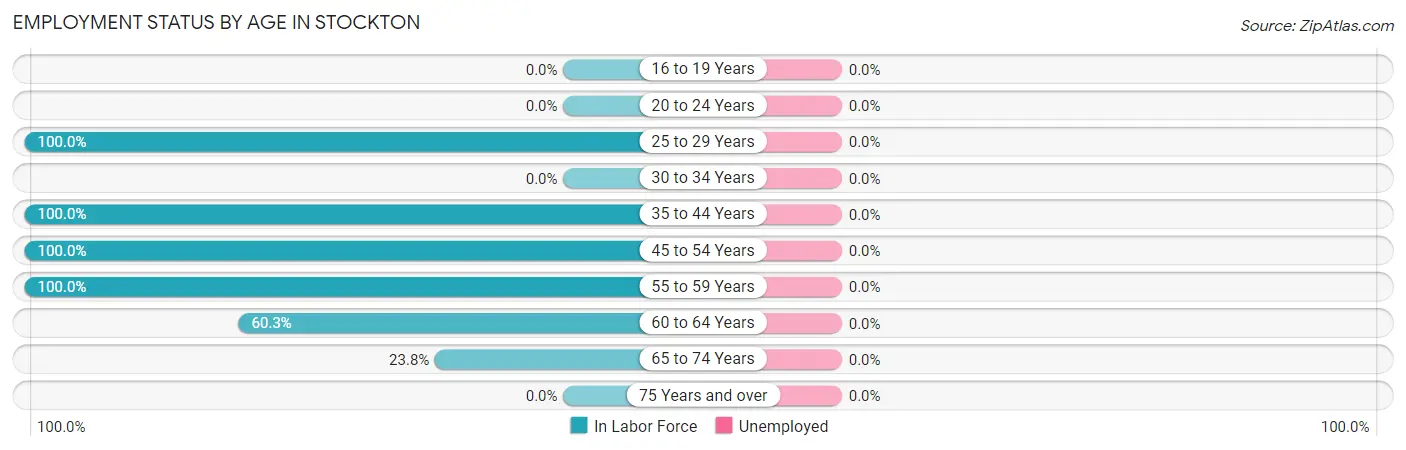
| Age Bracket | In Labor Force | Unemployed |
| 16 to 19 Years | 0 (0.0%) | 0 (0.0%) |
| 20 to 24 Years | 0 (0.0%) | 0 (0.0%) |
| 25 to 29 Years | 17 (100.0%) | 0 (0.0%) |
| 30 to 34 Years | 0 (0.0%) | 0 (0.0%) |
| 35 to 44 Years | 67 (100.0%) | 0 (0.0%) |
| 45 to 54 Years | 89 (100.0%) | 0 (0.0%) |
| 55 to 59 Years | 8 (100.0%) | 0 (0.0%) |
| 60 to 64 Years | 38 (60.3%) | 0 (0.0%) |
| 65 to 74 Years | 19 (23.8%) | 0 (0.0%) |
| 75 Years and over | 0 (0.0%) | 0 (0.0%) |
| Total | 238 (60.4%) | 0 (0.0%) |
Employment Status by Educational Attainment in Stockton
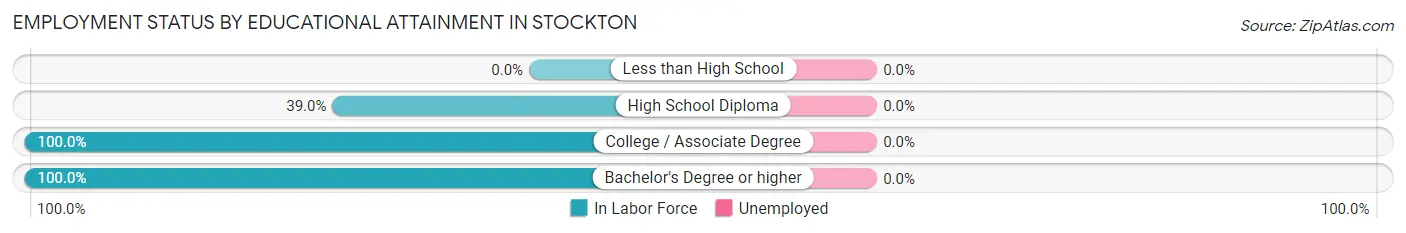
| Educational Attainment | In Labor Force | Unemployed |
| Less than High School | 0 (0.0%) | 0 (0.0%) |
| High School Diploma | 16 (39.0%) | 0 (0.0%) |
| College / Associate Degree | 17 (100.0%) | 0 (0.0%) |
| Bachelor's Degree or higher | 186 (100.0%) | 0 (0.0%) |
| Total | 219 (89.8%) | 0 (0.0%) |
Employment Occupations by Sex in Stockton
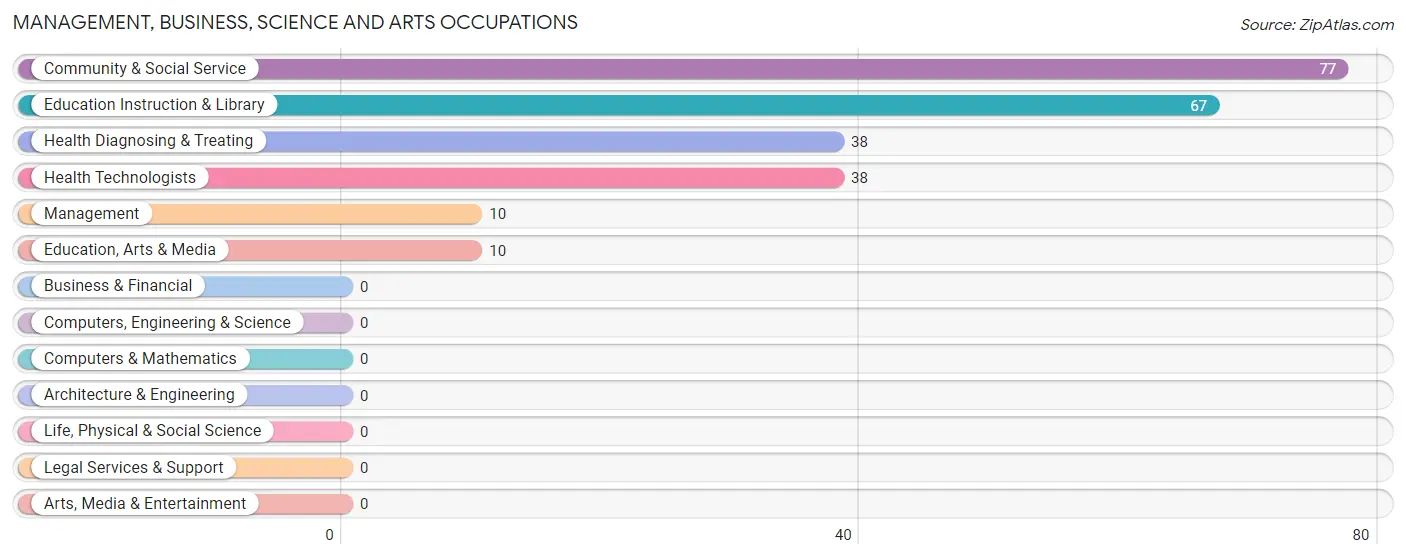
Management, Business, Science and Arts Occupations
The most common Management, Business, Science and Arts occupations in Stockton are Community & Social Service (77 | 32.4%), Education Instruction & Library (67 | 28.1%), Health Diagnosing & Treating (38 | 16.0%), Health Technologists (38 | 16.0%), and Management (10 | 4.2%).
Management, Business, Science and Arts Occupations by Sex
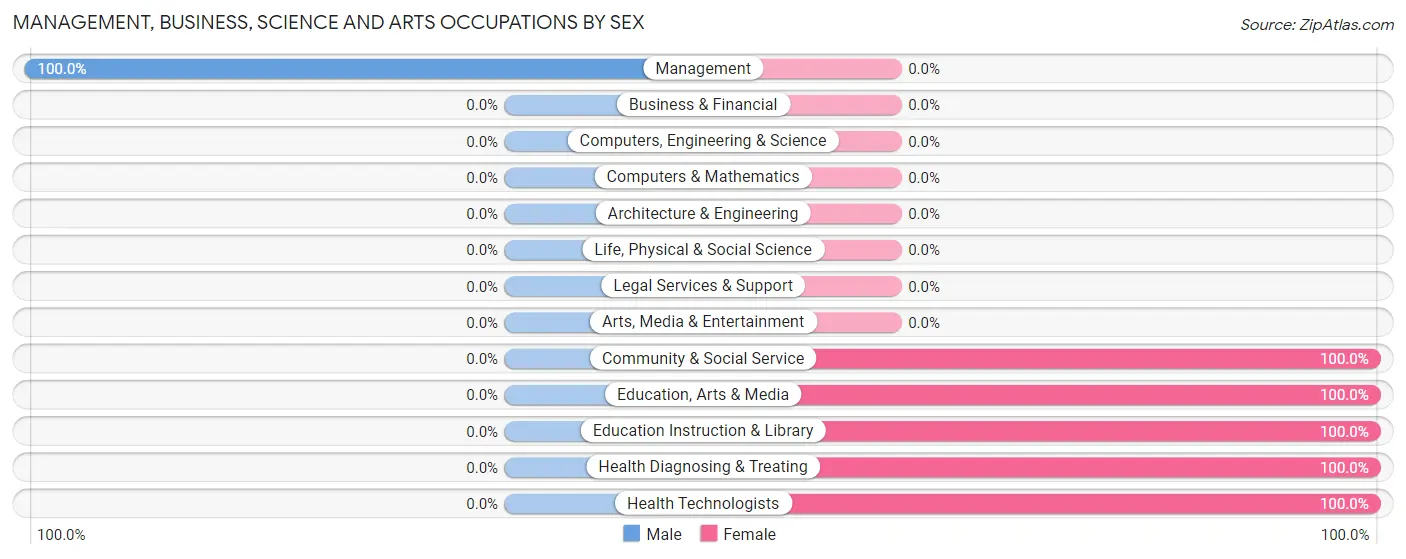
| Occupation | Male | Female |
| Management | 10 (100.0%) | 0 (0.0%) |
| Business & Financial | 0 (0.0%) | 0 (0.0%) |
| Computers, Engineering & Science | 0 (0.0%) | 0 (0.0%) |
| Computers & Mathematics | 0 (0.0%) | 0 (0.0%) |
| Architecture & Engineering | 0 (0.0%) | 0 (0.0%) |
| Life, Physical & Social Science | 0 (0.0%) | 0 (0.0%) |
| Community & Social Service | 0 (0.0%) | 77 (100.0%) |
| Education, Arts & Media | 0 (0.0%) | 10 (100.0%) |
| Legal Services & Support | 0 (0.0%) | 0 (0.0%) |
| Education Instruction & Library | 0 (0.0%) | 67 (100.0%) |
| Arts, Media & Entertainment | 0 (0.0%) | 0 (0.0%) |
| Health Diagnosing & Treating | 0 (0.0%) | 38 (100.0%) |
| Health Technologists | 0 (0.0%) | 38 (100.0%) |
| Total (Category) | 10 (8.0%) | 115 (92.0%) |
| Total (Overall) | 98 (41.2%) | 140 (58.8%) |
Services Occupations
The most common Services occupations in Stockton are , and Cleaning & Maintenance (25 | 10.5%).
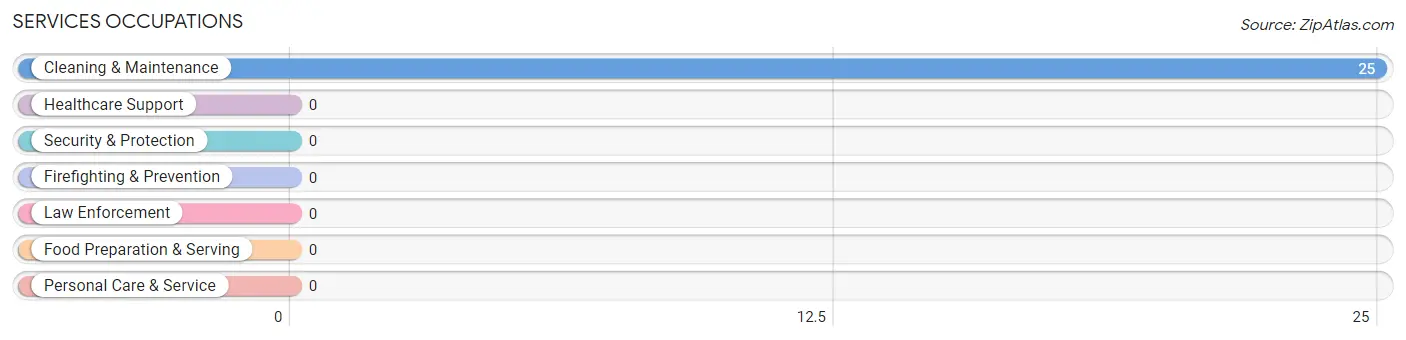
Services Occupations by Sex
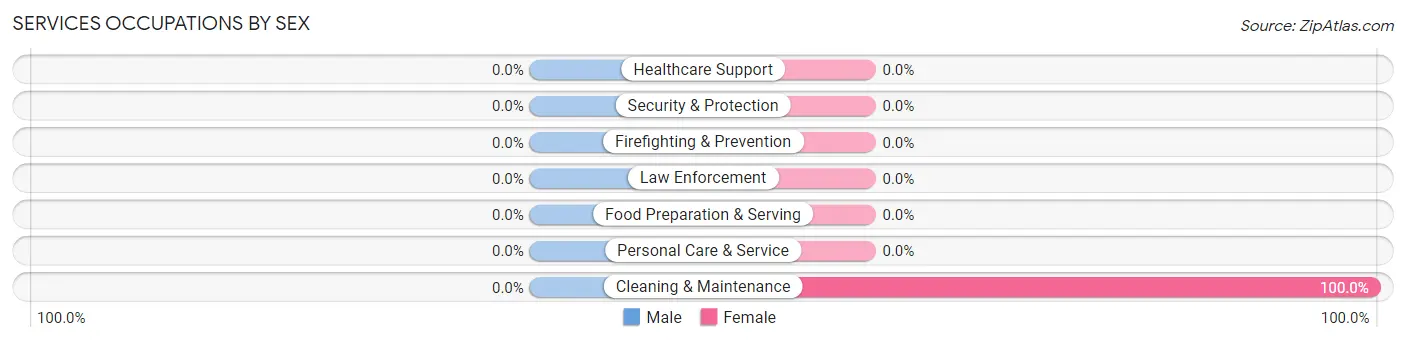
| Occupation | Male | Female |
| Healthcare Support | 0 (0.0%) | 0 (0.0%) |
| Security & Protection | 0 (0.0%) | 0 (0.0%) |
| Firefighting & Prevention | 0 (0.0%) | 0 (0.0%) |
| Law Enforcement | 0 (0.0%) | 0 (0.0%) |
| Food Preparation & Serving | 0 (0.0%) | 0 (0.0%) |
| Cleaning & Maintenance | 0 (0.0%) | 25 (100.0%) |
| Personal Care & Service | 0 (0.0%) | 0 (0.0%) |
| Total (Category) | 0 (0.0%) | 25 (100.0%) |
| Total (Overall) | 98 (41.2%) | 140 (58.8%) |
Sales and Office Occupations
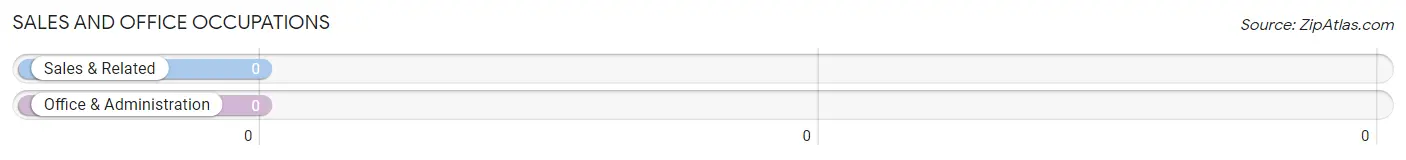
Sales and Office Occupations by Sex
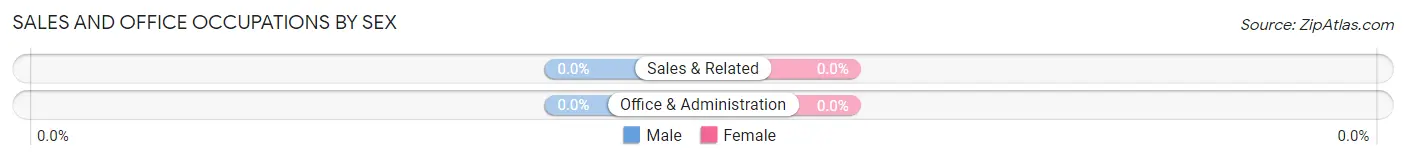
| Occupation | Male | Female |
| Sales & Related | 0 (0.0%) | 0 (0.0%) |
| Office & Administration | 0 (0.0%) | 0 (0.0%) |
| Total (Category) | 0 (0.0%) | 0 (0.0%) |
| Total (Overall) | 98 (41.2%) | 140 (58.8%) |
Natural Resources, Construction and Maintenance Occupations
The most common Natural Resources, Construction and Maintenance occupations in Stockton are , and Construction & Extraction (9 | 3.8%).
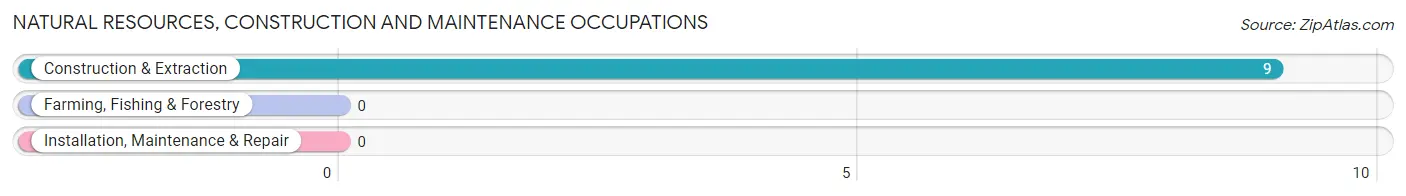
Natural Resources, Construction and Maintenance Occupations by Sex
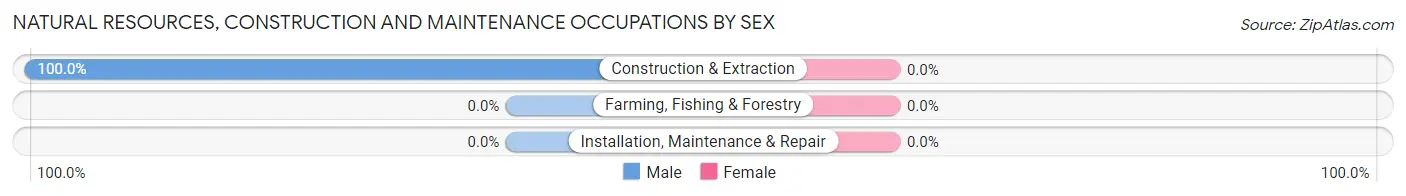
| Occupation | Male | Female |
| Farming, Fishing & Forestry | 0 (0.0%) | 0 (0.0%) |
| Construction & Extraction | 9 (100.0%) | 0 (0.0%) |
| Installation, Maintenance & Repair | 0 (0.0%) | 0 (0.0%) |
| Total (Category) | 9 (100.0%) | 0 (0.0%) |
| Total (Overall) | 98 (41.2%) | 140 (58.8%) |
Production, Transportation and Moving Occupations
The most common Production, Transportation and Moving occupations in Stockton are , and Production (79 | 33.2%).
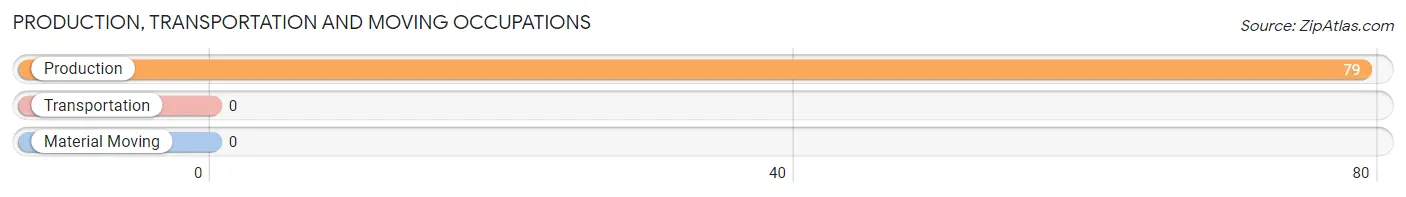
Production, Transportation and Moving Occupations by Sex
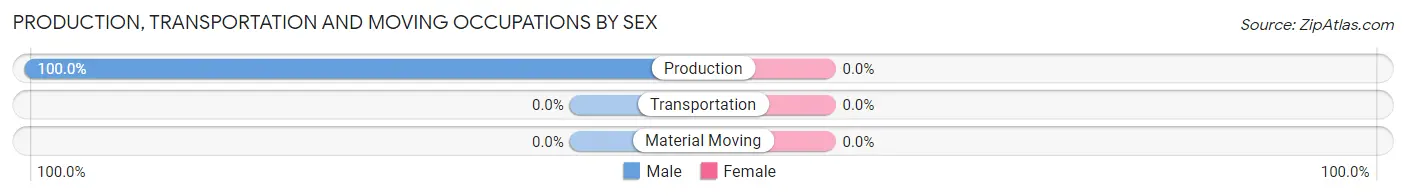
| Occupation | Male | Female |
| Production | 79 (100.0%) | 0 (0.0%) |
| Transportation | 0 (0.0%) | 0 (0.0%) |
| Material Moving | 0 (0.0%) | 0 (0.0%) |
| Total (Category) | 79 (100.0%) | 0 (0.0%) |
| Total (Overall) | 98 (41.2%) | 140 (58.8%) |
Employment Industries by Sex in Stockton
Employment Industries in Stockton
The major employment industries in Stockton include Utilities (71 | 29.8%), Educational Services (67 | 28.1%), Health Care & Social Assistance (48 | 20.2%), Manufacturing (43 | 18.1%), and Construction (9 | 3.8%).
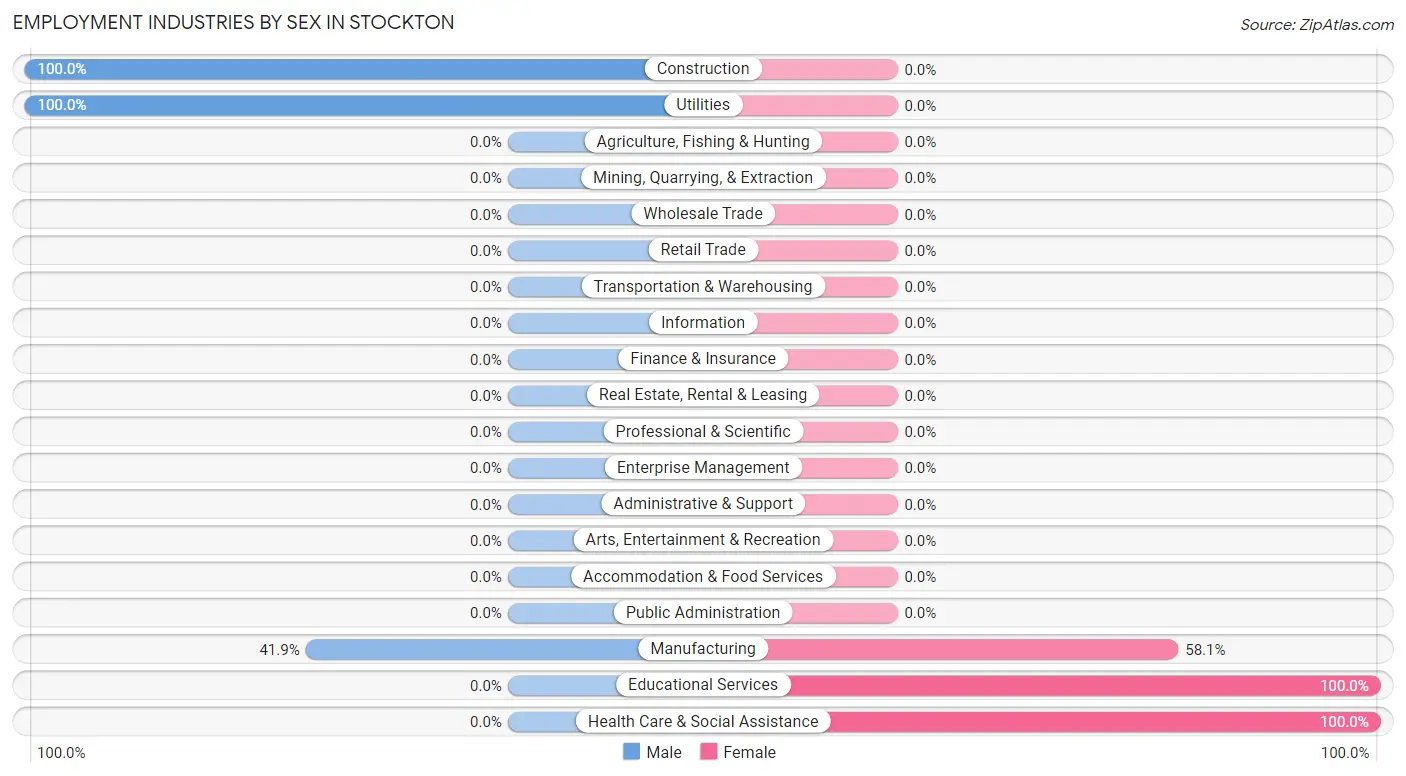
Employment Industries by Sex in Stockton
The Stockton industries that see more men than women are Construction (100.0%), Utilities (100.0%), and Manufacturing (41.9%), whereas the industries that tend to have a higher number of women are Educational Services (100.0%), Health Care & Social Assistance (100.0%), and Manufacturing (58.1%).
| Industry | Male | Female |
| Agriculture, Fishing & Hunting | 0 (0.0%) | 0 (0.0%) |
| Mining, Quarrying, & Extraction | 0 (0.0%) | 0 (0.0%) |
| Construction | 9 (100.0%) | 0 (0.0%) |
| Manufacturing | 18 (41.9%) | 25 (58.1%) |
| Wholesale Trade | 0 (0.0%) | 0 (0.0%) |
| Retail Trade | 0 (0.0%) | 0 (0.0%) |
| Transportation & Warehousing | 0 (0.0%) | 0 (0.0%) |
| Utilities | 71 (100.0%) | 0 (0.0%) |
| Information | 0 (0.0%) | 0 (0.0%) |
| Finance & Insurance | 0 (0.0%) | 0 (0.0%) |
| Real Estate, Rental & Leasing | 0 (0.0%) | 0 (0.0%) |
| Professional & Scientific | 0 (0.0%) | 0 (0.0%) |
| Enterprise Management | 0 (0.0%) | 0 (0.0%) |
| Administrative & Support | 0 (0.0%) | 0 (0.0%) |
| Educational Services | 0 (0.0%) | 67 (100.0%) |
| Health Care & Social Assistance | 0 (0.0%) | 48 (100.0%) |
| Arts, Entertainment & Recreation | 0 (0.0%) | 0 (0.0%) |
| Accommodation & Food Services | 0 (0.0%) | 0 (0.0%) |
| Public Administration | 0 (0.0%) | 0 (0.0%) |
| Total | 98 (41.2%) | 140 (58.8%) |
Education in Stockton
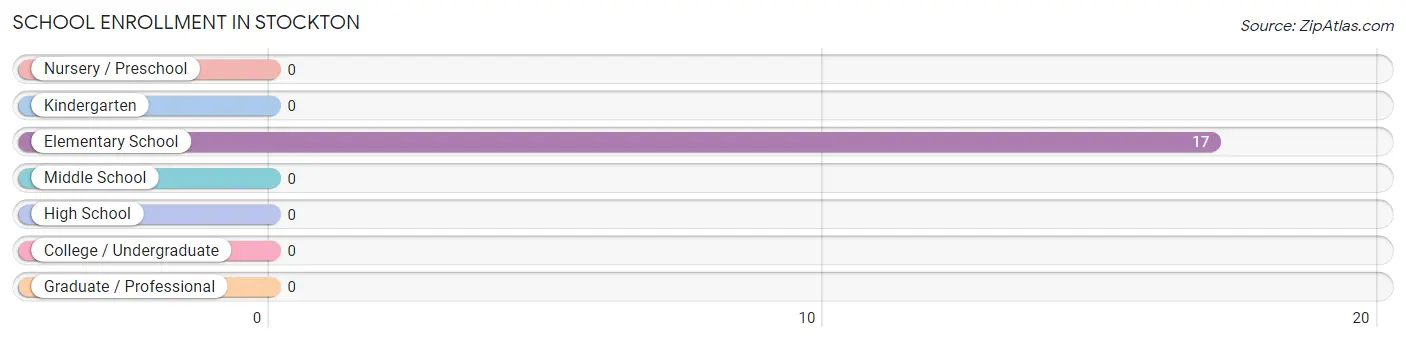
School Enrollment in Stockton
| School Level | # Students | % Students |
| Nursery / Preschool | 0 | 0.0% |
| Kindergarten | 0 | 0.0% |
| Elementary School | 17 | 100.0% |
| Middle School | 0 | 0.0% |
| High School | 0 | 0.0% |
| College / Undergraduate | 0 | 0.0% |
| Graduate / Professional | 0 | 0.0% |
| Total | 17 | 100.0% |
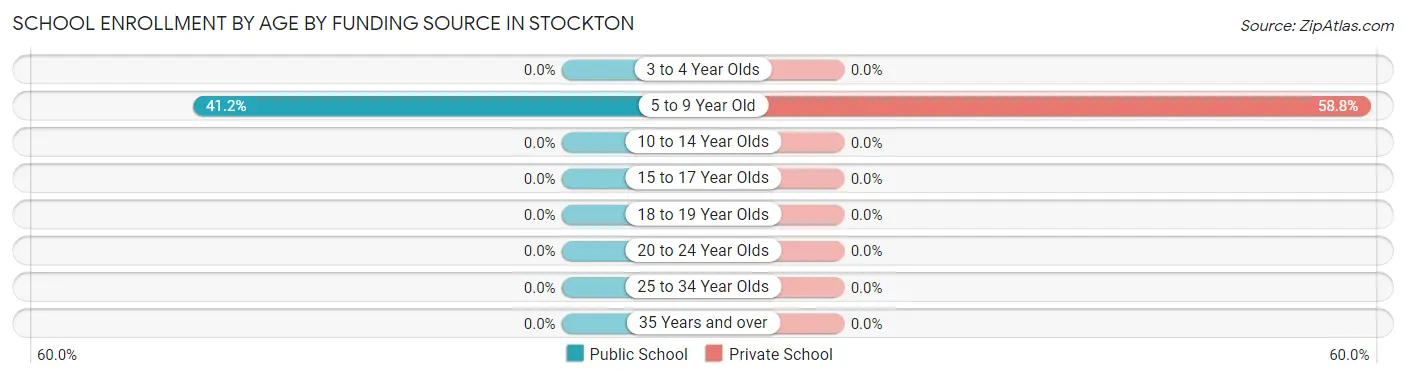
School Enrollment by Age by Funding Source in Stockton
Out of a total of 17 students who are enrolled in schools in Stockton, 10 (58.8%) attend a private institution, while the remaining 7 (41.2%) are enrolled in public schools. The age group of 5 to 9 year old has the highest likelihood of being enrolled in private schools, with 10 (58.8% in the age bracket) enrolled. Conversely, the age group of 5 to 9 year old has the lowest likelihood of being enrolled in a private school, with 7 (41.2% in the age bracket) attending a public institution.
| Age Bracket | Public School | Private School |
| 3 to 4 Year Olds | 0 (0.0%) | 0 (0.0%) |
| 5 to 9 Year Old | 7 (41.2%) | 10 (58.8%) |
| 10 to 14 Year Olds | 0 (0.0%) | 0 (0.0%) |
| 15 to 17 Year Olds | 0 (0.0%) | 0 (0.0%) |
| 18 to 19 Year Olds | 0 (0.0%) | 0 (0.0%) |
| 20 to 24 Year Olds | 0 (0.0%) | 0 (0.0%) |
| 25 to 34 Year Olds | 0 (0.0%) | 0 (0.0%) |
| 35 Years and over | 0 (0.0%) | 0 (0.0%) |
| Total | 7 (41.2%) | 10 (58.8%) |
Educational Attainment by Field of Study in Stockton
Arts & humanities (71 | 38.2%), education (67 | 36.0%), science & technology (38 | 20.4%), and psychology (10 | 5.4%) are the most common fields of study among 186 individuals in Stockton who have obtained a bachelor's degree or higher.
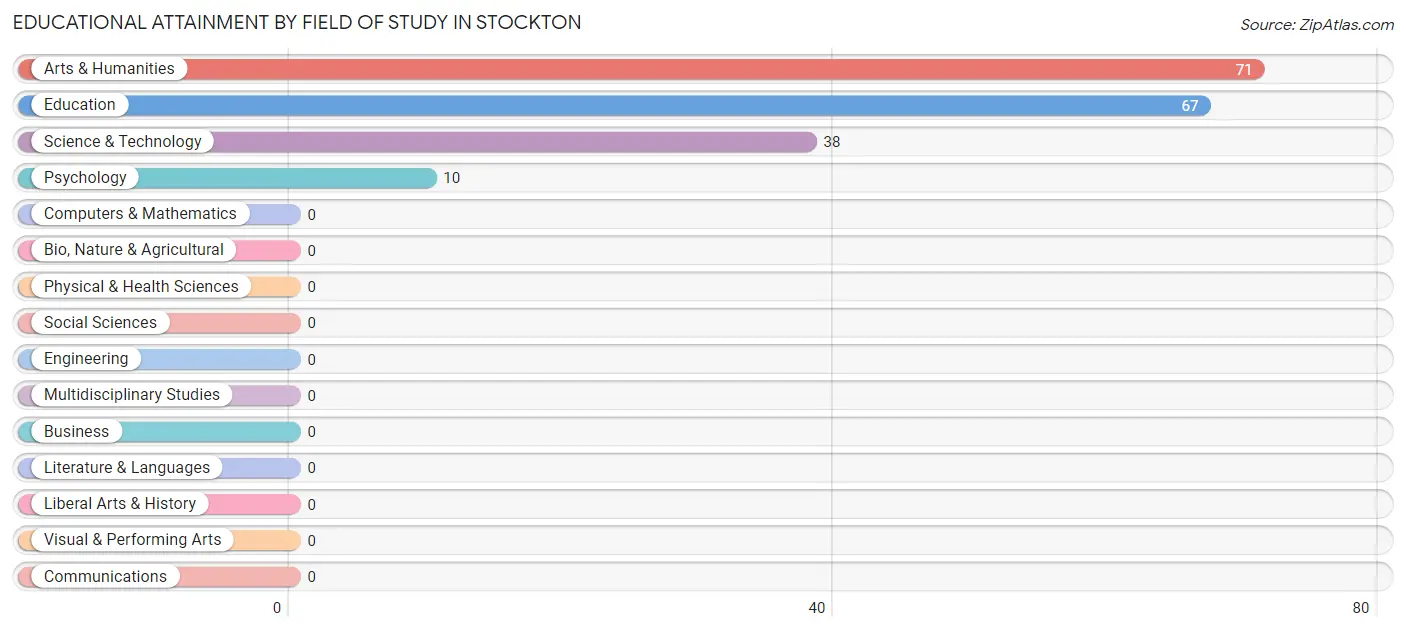
| Field of Study | # Graduates | % Graduates |
| Computers & Mathematics | 0 | 0.0% |
| Bio, Nature & Agricultural | 0 | 0.0% |
| Physical & Health Sciences | 0 | 0.0% |
| Psychology | 10 | 5.4% |
| Social Sciences | 0 | 0.0% |
| Engineering | 0 | 0.0% |
| Multidisciplinary Studies | 0 | 0.0% |
| Science & Technology | 38 | 20.4% |
| Business | 0 | 0.0% |
| Education | 67 | 36.0% |
| Literature & Languages | 0 | 0.0% |
| Liberal Arts & History | 0 | 0.0% |
| Visual & Performing Arts | 0 | 0.0% |
| Communications | 0 | 0.0% |
| Arts & Humanities | 71 | 38.2% |
| Total | 186 | 100.0% |
Transportation & Commute in Stockton
Vehicle Availability by Sex in Stockton
The most prevalent vehicle ownership categories in Stockton are males with 2 vehicles (90, accounting for 91.8%) and females with 2 vehicles (77, making up 64.3%).
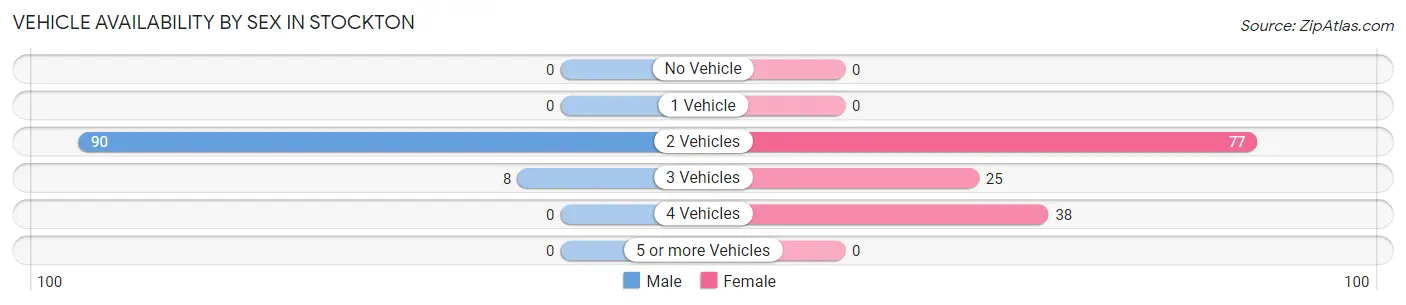
| Vehicles Available | Male | Female |
| No Vehicle | 0 (0.0%) | 0 (0.0%) |
| 1 Vehicle | 0 (0.0%) | 0 (0.0%) |
| 2 Vehicles | 90 (91.8%) | 77 (55.0%) |
| 3 Vehicles | 8 (8.2%) | 25 (17.9%) |
| 4 Vehicles | 0 (0.0%) | 38 (27.1%) |
| 5 or more Vehicles | 0 (0.0%) | 0 (0.0%) |
| Total | 98 (100.0%) | 140 (100.0%) |
Commute Time in Stockton
The most frequently occuring commute durations in Stockton are 15 to 19 minutes (164 commuters, 71.9%), 30 to 34 minutes (38 commuters, 16.7%), and 25 to 29 minutes (10 commuters, 4.4%).
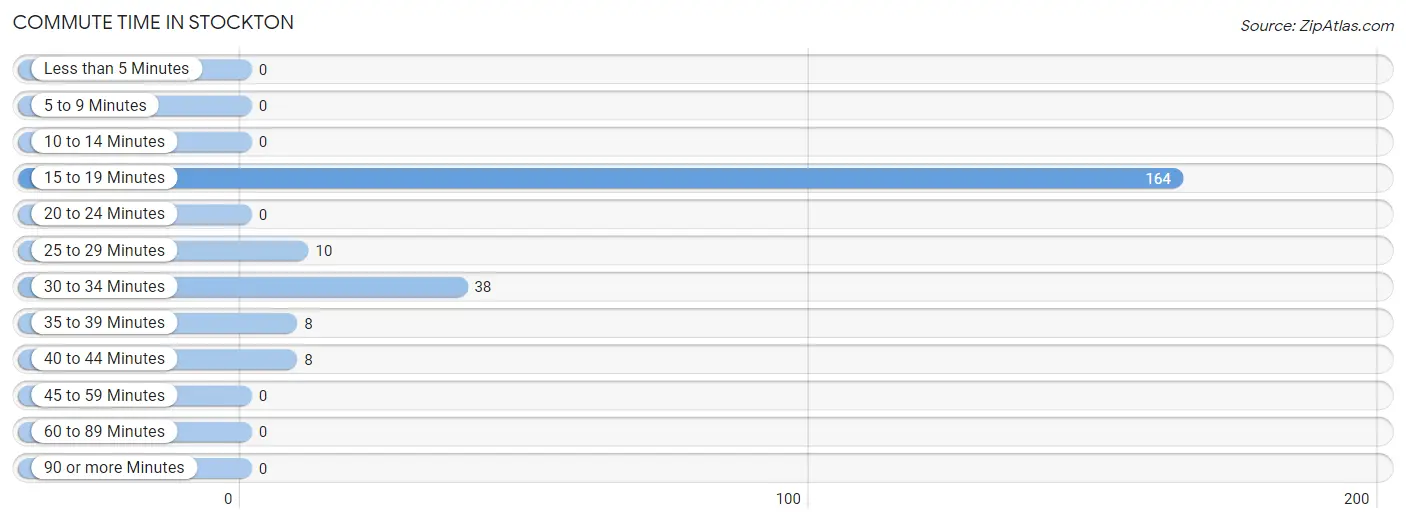
| Commute Time | # Commuters | % Commuters |
| Less than 5 Minutes | 0 | 0.0% |
| 5 to 9 Minutes | 0 | 0.0% |
| 10 to 14 Minutes | 0 | 0.0% |
| 15 to 19 Minutes | 164 | 71.9% |
| 20 to 24 Minutes | 0 | 0.0% |
| 25 to 29 Minutes | 10 | 4.4% |
| 30 to 34 Minutes | 38 | 16.7% |
| 35 to 39 Minutes | 8 | 3.5% |
| 40 to 44 Minutes | 8 | 3.5% |
| 45 to 59 Minutes | 0 | 0.0% |
| 60 to 89 Minutes | 0 | 0.0% |
| 90 or more Minutes | 0 | 0.0% |
Commute Time by Sex in Stockton
The most common commute times in Stockton are 15 to 19 minutes (80 commuters, 81.6%) for males and 15 to 19 minutes (84 commuters, 64.6%) for females.
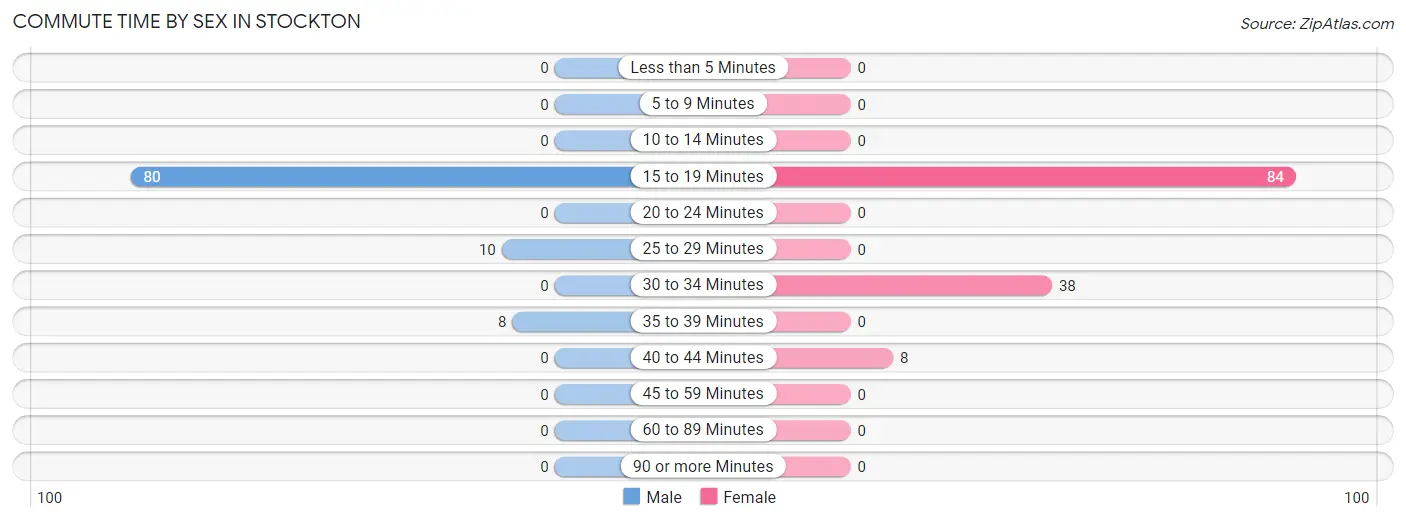
| Commute Time | Male | Female |
| Less than 5 Minutes | 0 (0.0%) | 0 (0.0%) |
| 5 to 9 Minutes | 0 (0.0%) | 0 (0.0%) |
| 10 to 14 Minutes | 0 (0.0%) | 0 (0.0%) |
| 15 to 19 Minutes | 80 (81.6%) | 84 (64.6%) |
| 20 to 24 Minutes | 0 (0.0%) | 0 (0.0%) |
| 25 to 29 Minutes | 10 (10.2%) | 0 (0.0%) |
| 30 to 34 Minutes | 0 (0.0%) | 38 (29.2%) |
| 35 to 39 Minutes | 8 (8.2%) | 0 (0.0%) |
| 40 to 44 Minutes | 0 (0.0%) | 8 (6.1%) |
| 45 to 59 Minutes | 0 (0.0%) | 0 (0.0%) |
| 60 to 89 Minutes | 0 (0.0%) | 0 (0.0%) |
| 90 or more Minutes | 0 (0.0%) | 0 (0.0%) |
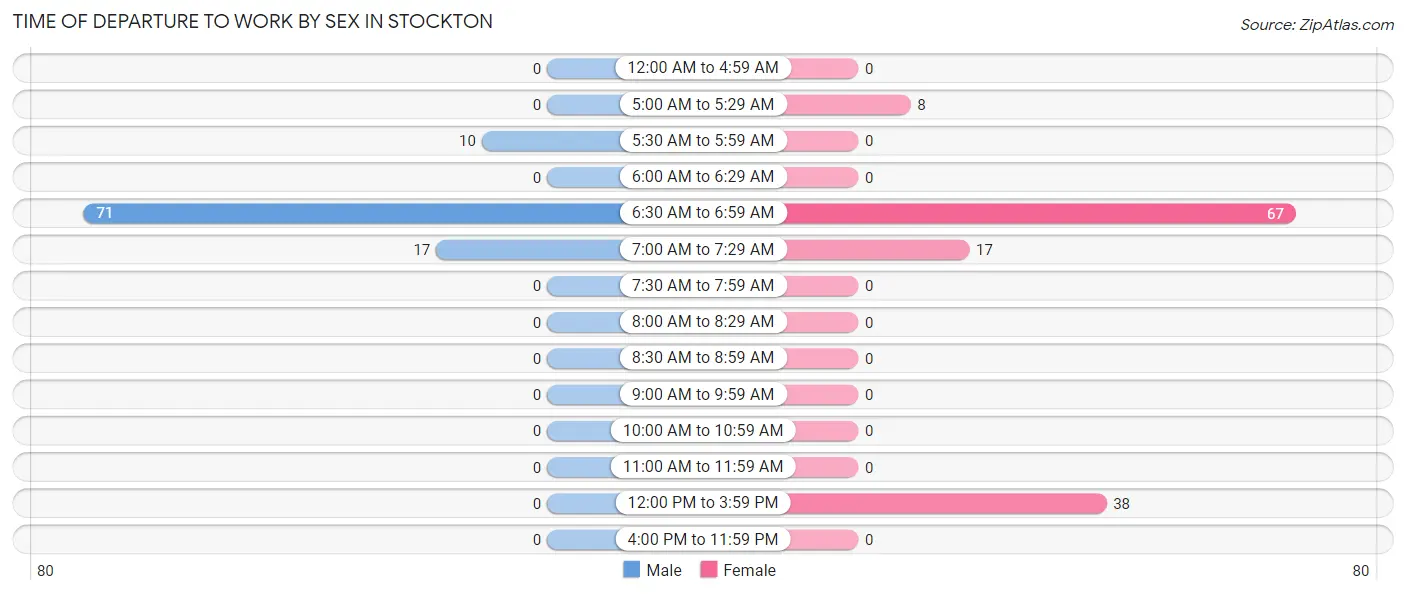
Time of Departure to Work by Sex in Stockton
The most frequent times of departure to work in Stockton are 6:30 AM to 6:59 AM (71, 72.5%) for males and 6:30 AM to 6:59 AM (67, 51.5%) for females.
| Time of Departure | Male | Female |
| 12:00 AM to 4:59 AM | 0 (0.0%) | 0 (0.0%) |
| 5:00 AM to 5:29 AM | 0 (0.0%) | 8 (6.1%) |
| 5:30 AM to 5:59 AM | 10 (10.2%) | 0 (0.0%) |
| 6:00 AM to 6:29 AM | 0 (0.0%) | 0 (0.0%) |
| 6:30 AM to 6:59 AM | 71 (72.5%) | 67 (51.5%) |
| 7:00 AM to 7:29 AM | 17 (17.3%) | 17 (13.1%) |
| 7:30 AM to 7:59 AM | 0 (0.0%) | 0 (0.0%) |
| 8:00 AM to 8:29 AM | 0 (0.0%) | 0 (0.0%) |
| 8:30 AM to 8:59 AM | 0 (0.0%) | 0 (0.0%) |
| 9:00 AM to 9:59 AM | 0 (0.0%) | 0 (0.0%) |
| 10:00 AM to 10:59 AM | 0 (0.0%) | 0 (0.0%) |
| 11:00 AM to 11:59 AM | 0 (0.0%) | 0 (0.0%) |
| 12:00 PM to 3:59 PM | 0 (0.0%) | 38 (29.2%) |
| 4:00 PM to 11:59 PM | 0 (0.0%) | 0 (0.0%) |
| Total | 98 (100.0%) | 130 (100.0%) |
Housing Occupancy in Stockton
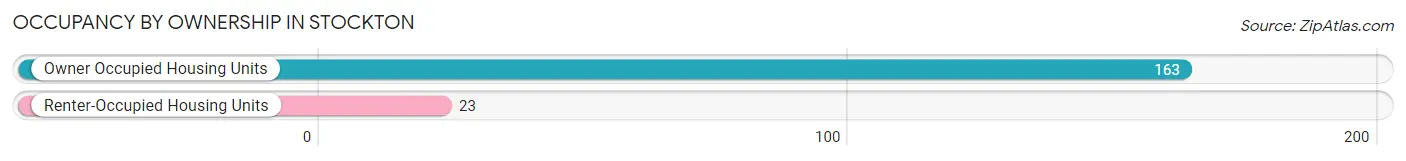
Occupancy by Ownership in Stockton
Of the total 186 dwellings in Stockton, owner-occupied units account for 163 (87.6%), while renter-occupied units make up 23 (12.4%).
| Occupancy | # Housing Units | % Housing Units |
| Owner Occupied Housing Units | 163 | 87.6% |
| Renter-Occupied Housing Units | 23 | 12.4% |
| Total Occupied Housing Units | 186 | 100.0% |
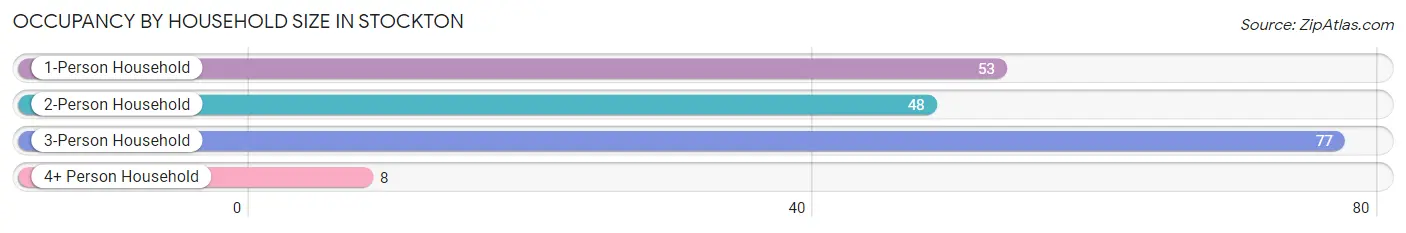
Occupancy by Household Size in Stockton
| Household Size | # Housing Units | % Housing Units |
| 1-Person Household | 53 | 28.5% |
| 2-Person Household | 48 | 25.8% |
| 3-Person Household | 77 | 41.4% |
| 4+ Person Household | 8 | 4.3% |
| Total Housing Units | 186 | 100.0% |
Occupancy by Ownership by Household Size in Stockton
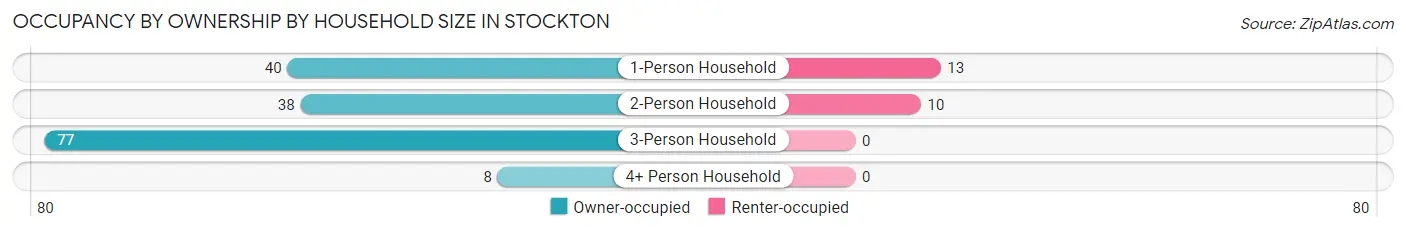
| Household Size | Owner-occupied | Renter-occupied |
| 1-Person Household | 40 (75.5%) | 13 (24.5%) |
| 2-Person Household | 38 (79.2%) | 10 (20.8%) |
| 3-Person Household | 77 (100.0%) | 0 (0.0%) |
| 4+ Person Household | 8 (100.0%) | 0 (0.0%) |
| Total Housing Units | 163 (87.6%) | 23 (12.4%) |
Occupancy by Educational Attainment in Stockton
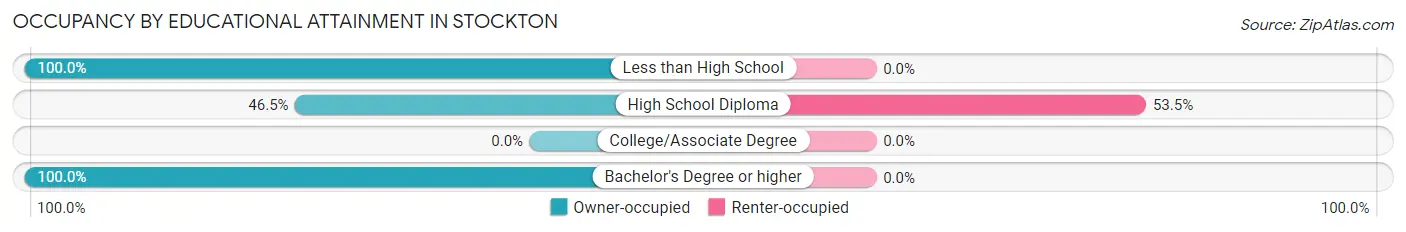
| Household Size | Owner-occupied | Renter-occupied |
| Less than High School | 28 (100.0%) | 0 (0.0%) |
| High School Diploma | 20 (46.5%) | 23 (53.5%) |
| College/Associate Degree | 0 (0.0%) | 0 (0.0%) |
| Bachelor's Degree or higher | 115 (100.0%) | 0 (0.0%) |
Occupancy by Age of Householder in Stockton
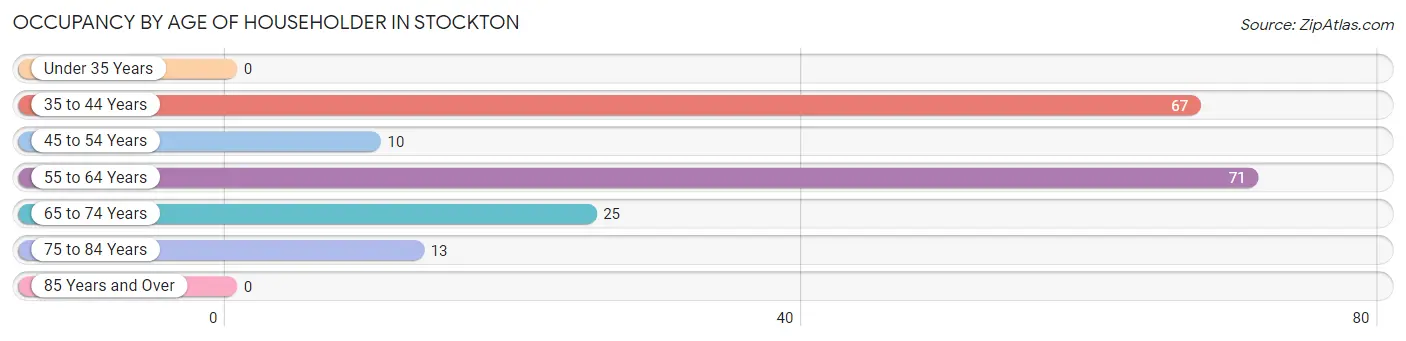
| Age Bracket | # Households | % Households |
| Under 35 Years | 0 | 0.0% |
| 35 to 44 Years | 67 | 36.0% |
| 45 to 54 Years | 10 | 5.4% |
| 55 to 64 Years | 71 | 38.2% |
| 65 to 74 Years | 25 | 13.4% |
| 75 to 84 Years | 13 | 7.0% |
| 85 Years and Over | 0 | 0.0% |
| Total | 186 | 100.0% |
Housing Finances in Stockton
Median Income by Occupancy in Stockton
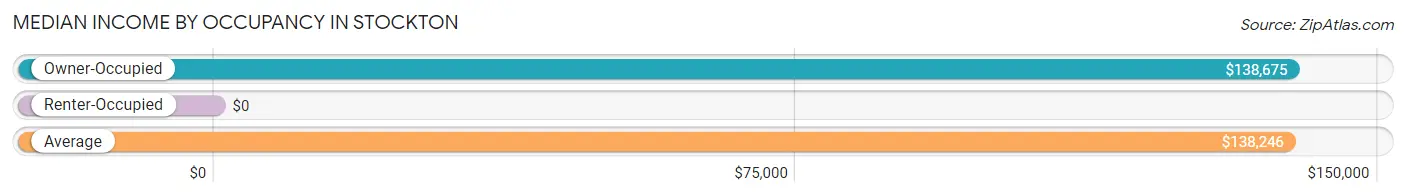
| Occupancy Type | # Households | Median Income |
| Owner-Occupied | 163 (87.6%) | $138,675 |
| Renter-Occupied | 23 (12.4%) | $0 |
| Average | 186 (100.0%) | $138,246 |
Occupancy by Householder Income Bracket in Stockton
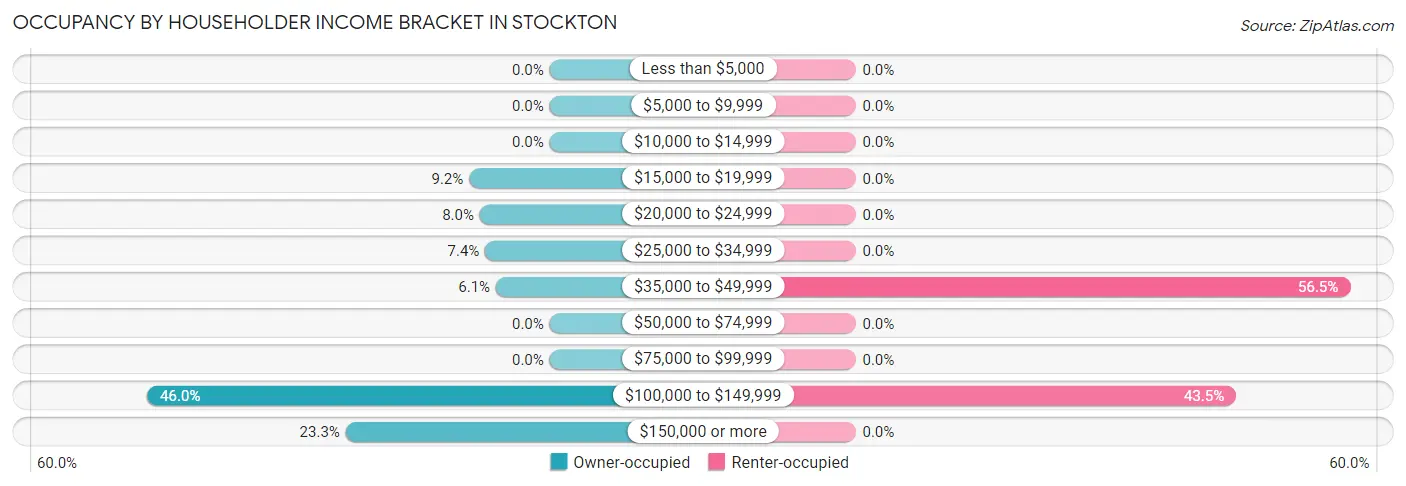
| Income Bracket | Owner-occupied | Renter-occupied |
| Less than $5,000 | 0 (0.0%) | 0 (0.0%) |
| $5,000 to $9,999 | 0 (0.0%) | 0 (0.0%) |
| $10,000 to $14,999 | 0 (0.0%) | 0 (0.0%) |
| $15,000 to $19,999 | 15 (9.2%) | 0 (0.0%) |
| $20,000 to $24,999 | 13 (8.0%) | 0 (0.0%) |
| $25,000 to $34,999 | 12 (7.4%) | 0 (0.0%) |
| $35,000 to $49,999 | 10 (6.1%) | 13 (56.5%) |
| $50,000 to $74,999 | 0 (0.0%) | 0 (0.0%) |
| $75,000 to $99,999 | 0 (0.0%) | 0 (0.0%) |
| $100,000 to $149,999 | 75 (46.0%) | 10 (43.5%) |
| $150,000 or more | 38 (23.3%) | 0 (0.0%) |
| Total | 163 (100.0%) | 23 (100.0%) |
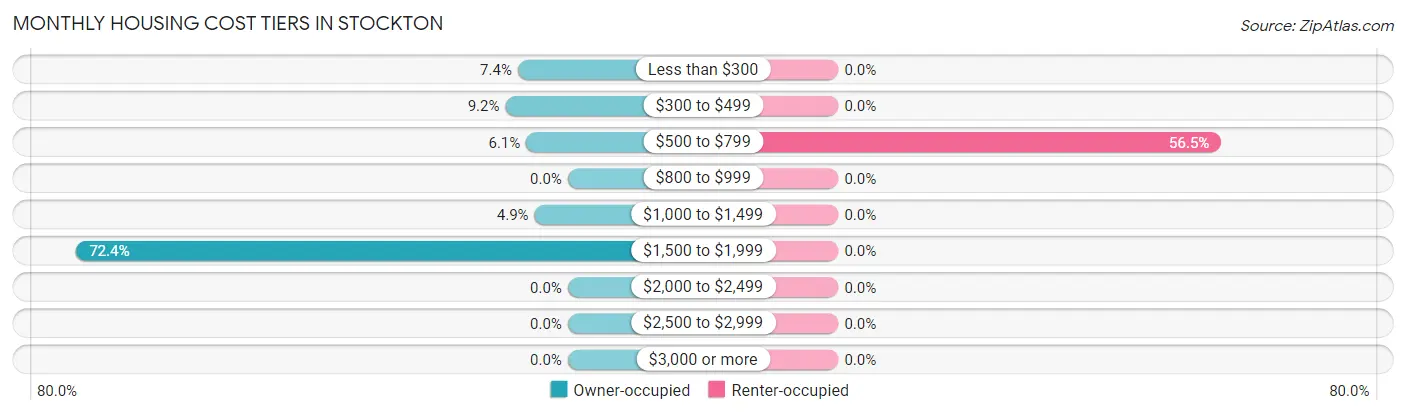
Monthly Housing Cost Tiers in Stockton
| Monthly Cost | Owner-occupied | Renter-occupied |
| Less than $300 | 12 (7.4%) | 0 (0.0%) |
| $300 to $499 | 15 (9.2%) | 0 (0.0%) |
| $500 to $799 | 10 (6.1%) | 13 (56.5%) |
| $800 to $999 | 0 (0.0%) | 0 (0.0%) |
| $1,000 to $1,499 | 8 (4.9%) | 0 (0.0%) |
| $1,500 to $1,999 | 118 (72.4%) | 0 (0.0%) |
| $2,000 to $2,499 | 0 (0.0%) | 0 (0.0%) |
| $2,500 to $2,999 | 0 (0.0%) | 0 (0.0%) |
| $3,000 or more | 0 (0.0%) | 0 (0.0%) |
| Total | 163 (100.0%) | 23 (100.0%) |
Physical Housing Characteristics in Stockton
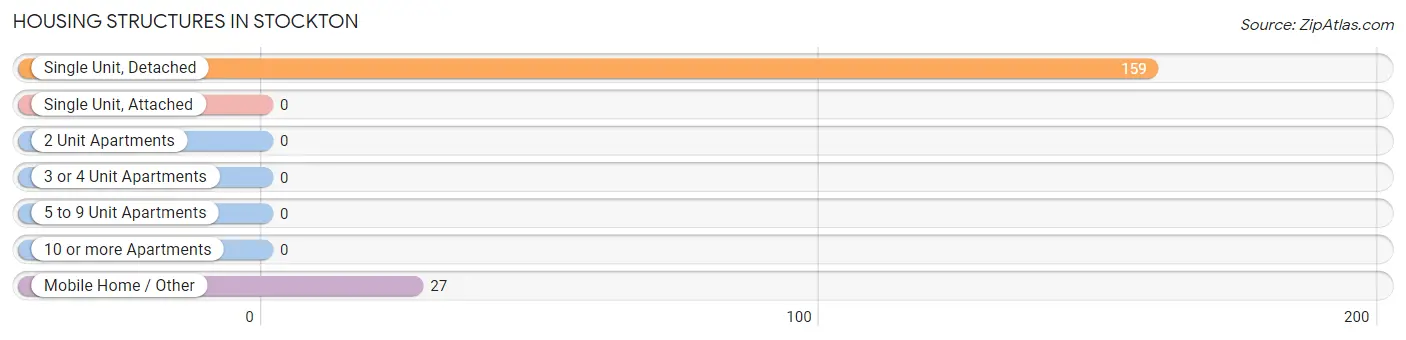
Housing Structures in Stockton
| Structure Type | # Housing Units | % Housing Units |
| Single Unit, Detached | 159 | 85.5% |
| Single Unit, Attached | 0 | 0.0% |
| 2 Unit Apartments | 0 | 0.0% |
| 3 or 4 Unit Apartments | 0 | 0.0% |
| 5 to 9 Unit Apartments | 0 | 0.0% |
| 10 or more Apartments | 0 | 0.0% |
| Mobile Home / Other | 27 | 14.5% |
| Total | 186 | 100.0% |
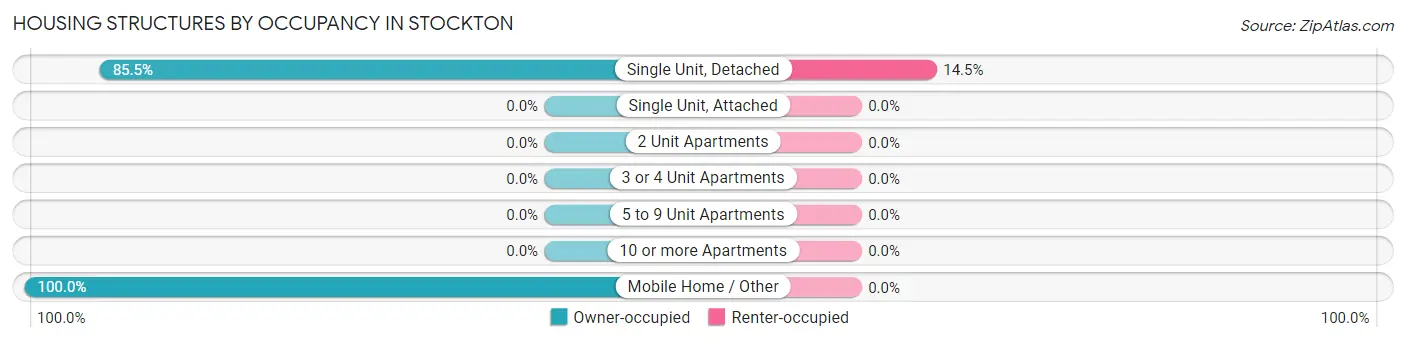
Housing Structures by Occupancy in Stockton
| Structure Type | Owner-occupied | Renter-occupied |
| Single Unit, Detached | 136 (85.5%) | 23 (14.5%) |
| Single Unit, Attached | 0 (0.0%) | 0 (0.0%) |
| 2 Unit Apartments | 0 (0.0%) | 0 (0.0%) |
| 3 or 4 Unit Apartments | 0 (0.0%) | 0 (0.0%) |
| 5 to 9 Unit Apartments | 0 (0.0%) | 0 (0.0%) |
| 10 or more Apartments | 0 (0.0%) | 0 (0.0%) |
| Mobile Home / Other | 27 (100.0%) | 0 (0.0%) |
| Total | 163 (87.6%) | 23 (12.4%) |
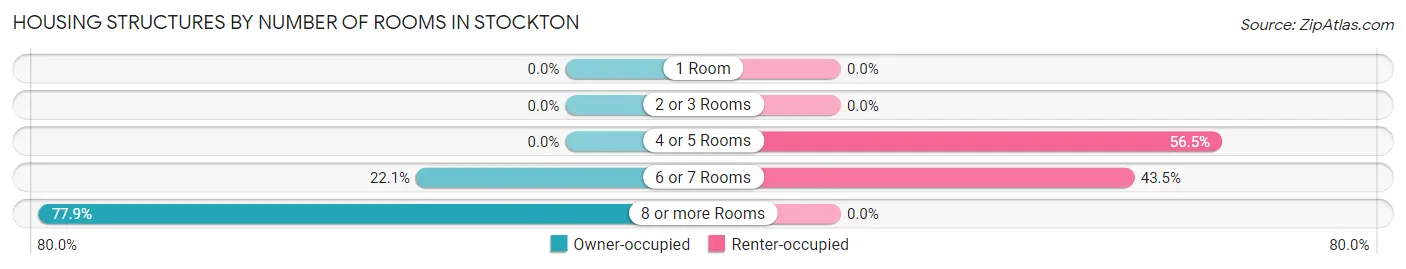
Housing Structures by Number of Rooms in Stockton
| Number of Rooms | Owner-occupied | Renter-occupied |
| 1 Room | 0 (0.0%) | 0 (0.0%) |
| 2 or 3 Rooms | 0 (0.0%) | 0 (0.0%) |
| 4 or 5 Rooms | 0 (0.0%) | 13 (56.5%) |
| 6 or 7 Rooms | 36 (22.1%) | 10 (43.5%) |
| 8 or more Rooms | 127 (77.9%) | 0 (0.0%) |
| Total | 163 (100.0%) | 23 (100.0%) |
Housing Structure by Heating Type in Stockton
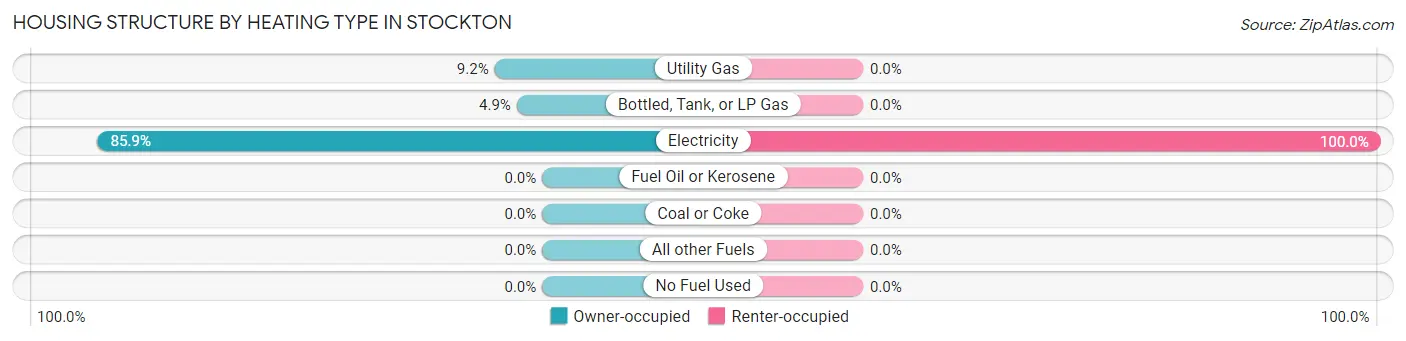
| Heating Type | Owner-occupied | Renter-occupied |
| Utility Gas | 15 (9.2%) | 0 (0.0%) |
| Bottled, Tank, or LP Gas | 8 (4.9%) | 0 (0.0%) |
| Electricity | 140 (85.9%) | 23 (100.0%) |
| Fuel Oil or Kerosene | 0 (0.0%) | 0 (0.0%) |
| Coal or Coke | 0 (0.0%) | 0 (0.0%) |
| All other Fuels | 0 (0.0%) | 0 (0.0%) |
| No Fuel Used | 0 (0.0%) | 0 (0.0%) |
| Total | 163 (100.0%) | 23 (100.0%) |
Household Vehicle Usage in Stockton
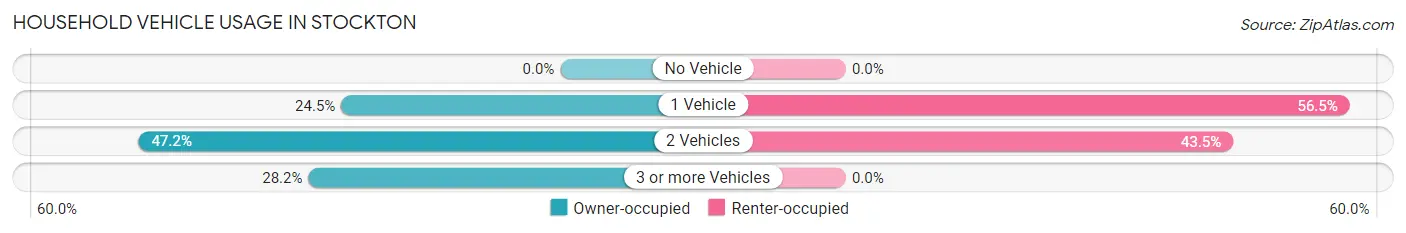
| Vehicles per Household | Owner-occupied | Renter-occupied |
| No Vehicle | 0 (0.0%) | 0 (0.0%) |
| 1 Vehicle | 40 (24.5%) | 13 (56.5%) |
| 2 Vehicles | 77 (47.2%) | 10 (43.5%) |
| 3 or more Vehicles | 46 (28.2%) | 0 (0.0%) |
| Total | 163 (100.0%) | 23 (100.0%) |
Real Estate & Mortgages in Stockton
Real Estate and Mortgage Overview in Stockton
| Characteristic | Without Mortgage | With Mortgage |
| Housing Units | 37 | 126 |
| Median Property Value | - | - |
| Median Household Income | $25,729 | $38 |
| Monthly Housing Costs | $322 | $0 |
| Real Estate Taxes | - | - |
Property Value by Mortgage Status in Stockton
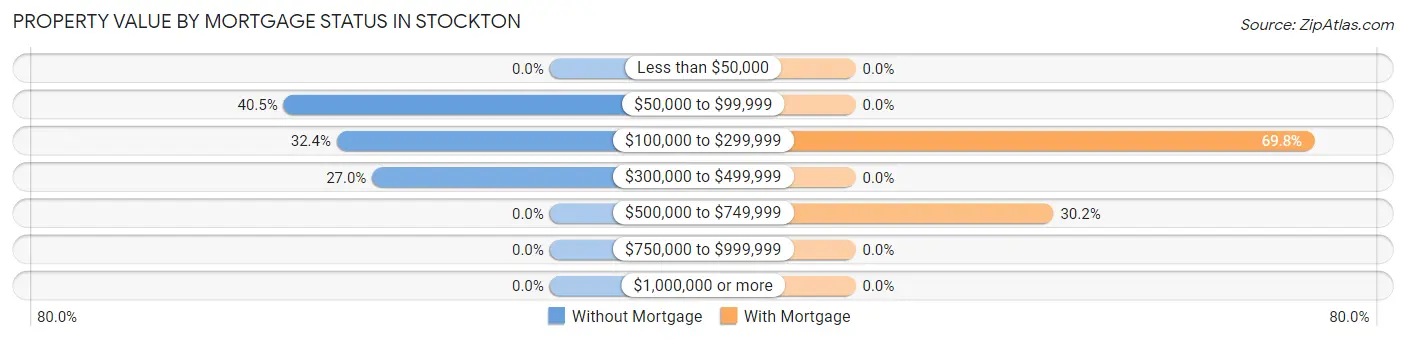
| Property Value | Without Mortgage | With Mortgage |
| Less than $50,000 | 0 (0.0%) | 0 (0.0%) |
| $50,000 to $99,999 | 15 (40.5%) | 0 (0.0%) |
| $100,000 to $299,999 | 12 (32.4%) | 88 (69.8%) |
| $300,000 to $499,999 | 10 (27.0%) | 0 (0.0%) |
| $500,000 to $749,999 | 0 (0.0%) | 38 (30.2%) |
| $750,000 to $999,999 | 0 (0.0%) | 0 (0.0%) |
| $1,000,000 or more | 0 (0.0%) | 0 (0.0%) |
| Total | 37 (100.0%) | 126 (100.0%) |
Household Income by Mortgage Status in Stockton
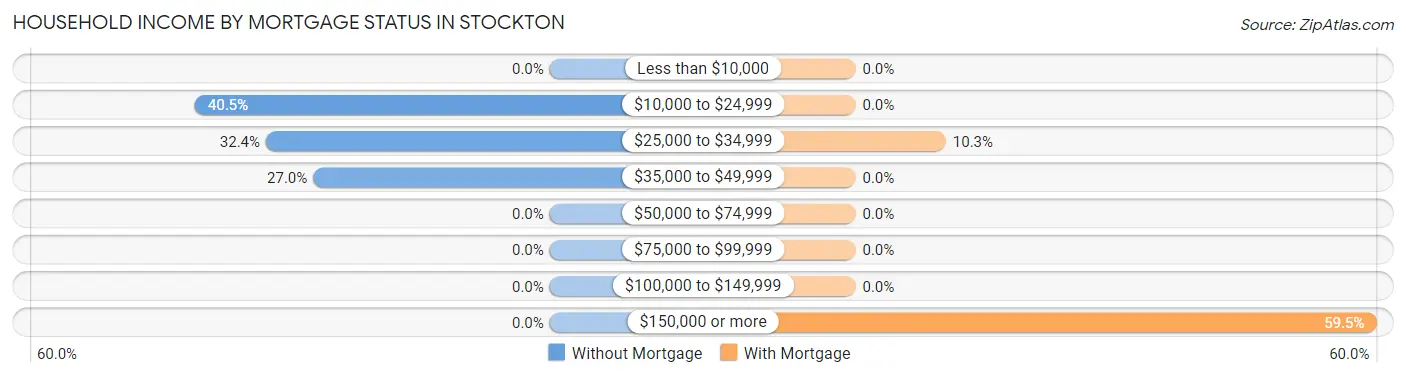
| Household Income | Without Mortgage | With Mortgage |
| Less than $10,000 | 0 (0.0%) | 0 (0.0%) |
| $10,000 to $24,999 | 15 (40.5%) | 0 (0.0%) |
| $25,000 to $34,999 | 12 (32.4%) | 13 (10.3%) |
| $35,000 to $49,999 | 10 (27.0%) | 0 (0.0%) |
| $50,000 to $74,999 | 0 (0.0%) | 0 (0.0%) |
| $75,000 to $99,999 | 0 (0.0%) | 0 (0.0%) |
| $100,000 to $149,999 | 0 (0.0%) | 0 (0.0%) |
| $150,000 or more | 0 (0.0%) | 75 (59.5%) |
| Total | 37 (100.0%) | 126 (100.0%) |
Property Value to Household Income Ratio in Stockton
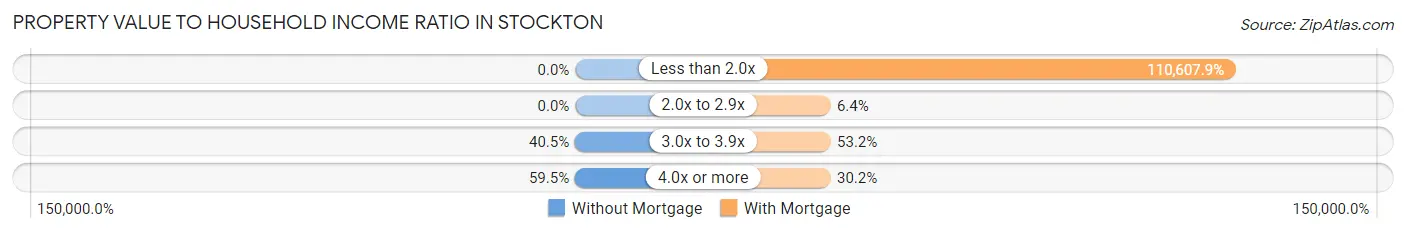
| Value-to-Income Ratio | Without Mortgage | With Mortgage |
| Less than 2.0x | 0 (0.0%) | 139,366 (110,607.9%) |
| 2.0x to 2.9x | 0 (0.0%) | 8 (6.4%) |
| 3.0x to 3.9x | 15 (40.5%) | 67 (53.2%) |
| 4.0x or more | 22 (59.5%) | 38 (30.2%) |
| Total | 37 (100.0%) | 126 (100.0%) |
Real Estate Taxes by Mortgage Status in Stockton
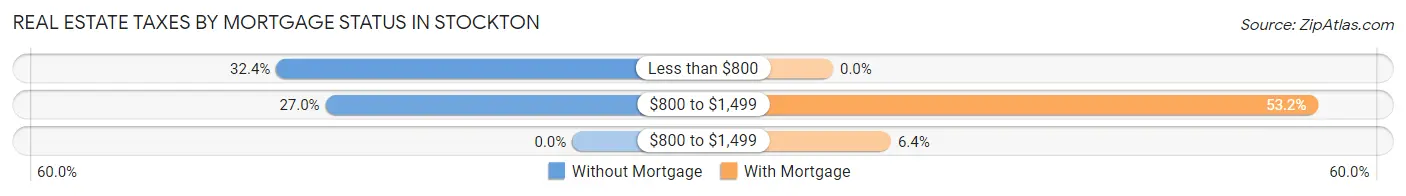
| Property Taxes | Without Mortgage | With Mortgage |
| Less than $800 | 12 (32.4%) | 0 (0.0%) |
| $800 to $1,499 | 10 (27.0%) | 67 (53.2%) |
| $800 to $1,499 | 0 (0.0%) | 8 (6.4%) |
| Total | 37 (100.0%) | 126 (100.0%) |
Health & Disability in Stockton
Health Insurance Coverage by Age in Stockton
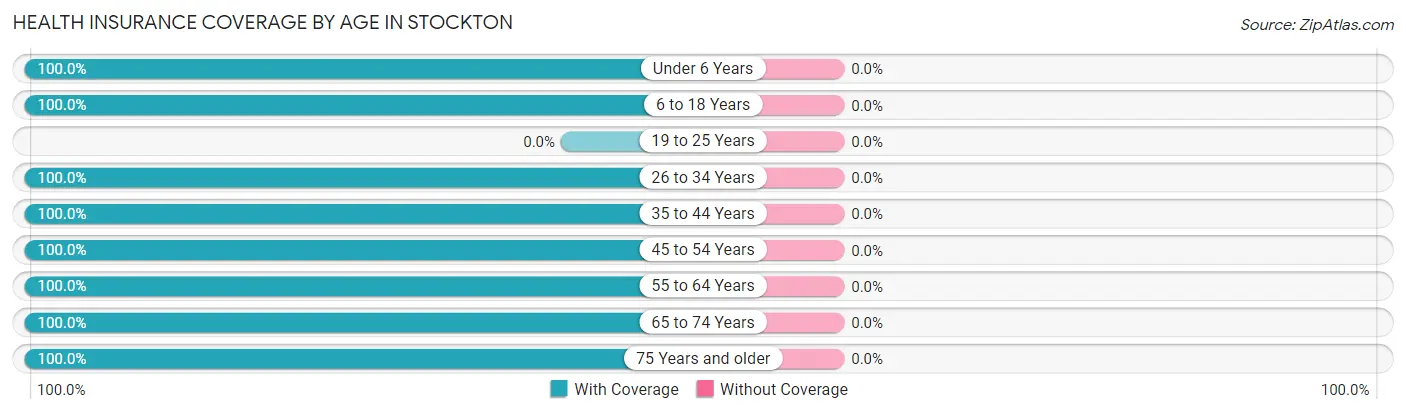
| Age Bracket | With Coverage | Without Coverage |
| Under 6 Years | 9 (100.0%) | 0 (0.0%) |
| 6 to 18 Years | 74 (100.0%) | 0 (0.0%) |
| 19 to 25 Years | 0 (0.0%) | 0 (0.0%) |
| 26 to 34 Years | 17 (100.0%) | 0 (0.0%) |
| 35 to 44 Years | 67 (100.0%) | 0 (0.0%) |
| 45 to 54 Years | 89 (100.0%) | 0 (0.0%) |
| 55 to 64 Years | 71 (100.0%) | 0 (0.0%) |
| 65 to 74 Years | 80 (100.0%) | 0 (0.0%) |
| 75 Years and older | 13 (100.0%) | 0 (0.0%) |
| Total | 420 (100.0%) | 0 (0.0%) |
Health Insurance Coverage by Citizenship Status in Stockton
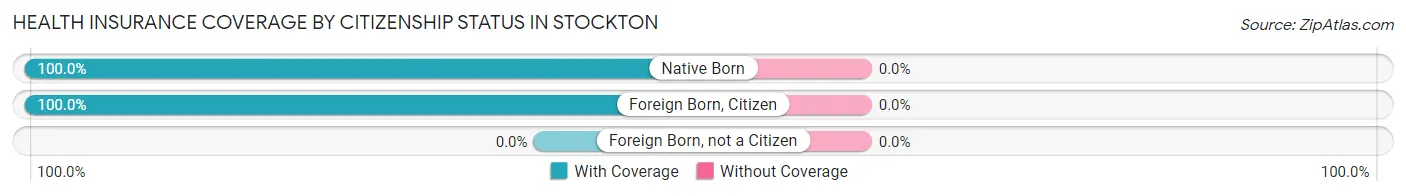
| Citizenship Status | With Coverage | Without Coverage |
| Native Born | 9 (100.0%) | 0 (0.0%) |
| Foreign Born, Citizen | 74 (100.0%) | 0 (0.0%) |
| Foreign Born, not a Citizen | 0 (0.0%) | 0 (0.0%) |
Health Insurance Coverage by Household Income in Stockton
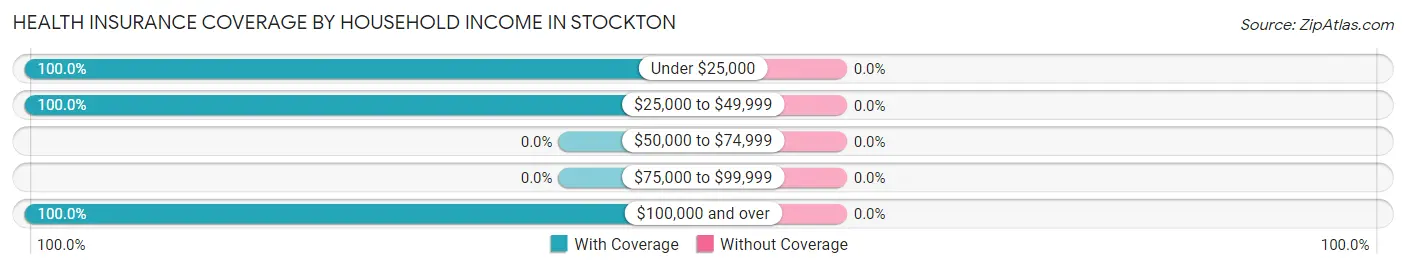
| Household Income | With Coverage | Without Coverage |
| Under $25,000 | 28 (100.0%) | 0 (0.0%) |
| $25,000 to $49,999 | 54 (100.0%) | 0 (0.0%) |
| $50,000 to $74,999 | 0 (0.0%) | 0 (0.0%) |
| $75,000 to $99,999 | 0 (0.0%) | 0 (0.0%) |
| $100,000 and over | 338 (100.0%) | 0 (0.0%) |
Public vs Private Health Insurance Coverage by Age in Stockton
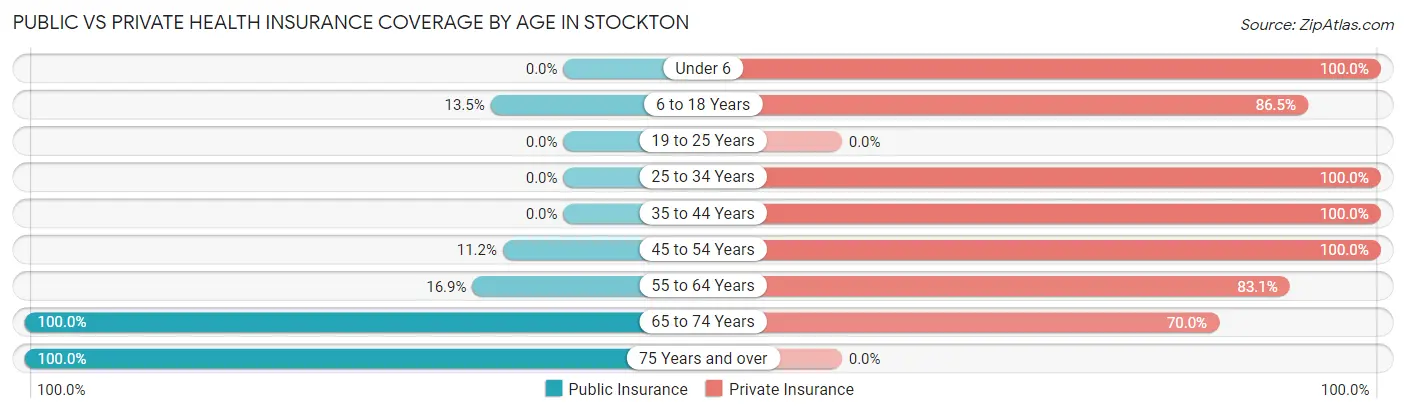
| Age Bracket | Public Insurance | Private Insurance |
| Under 6 | 0 (0.0%) | 9 (100.0%) |
| 6 to 18 Years | 10 (13.5%) | 64 (86.5%) |
| 19 to 25 Years | 0 (0.0%) | 0 (0.0%) |
| 25 to 34 Years | 0 (0.0%) | 17 (100.0%) |
| 35 to 44 Years | 0 (0.0%) | 67 (100.0%) |
| 45 to 54 Years | 10 (11.2%) | 89 (100.0%) |
| 55 to 64 Years | 12 (16.9%) | 59 (83.1%) |
| 65 to 74 Years | 80 (100.0%) | 56 (70.0%) |
| 75 Years and over | 13 (100.0%) | 0 (0.0%) |
| Total | 125 (29.8%) | 361 (86.0%) |
Disability Status by Sex by Age in Stockton
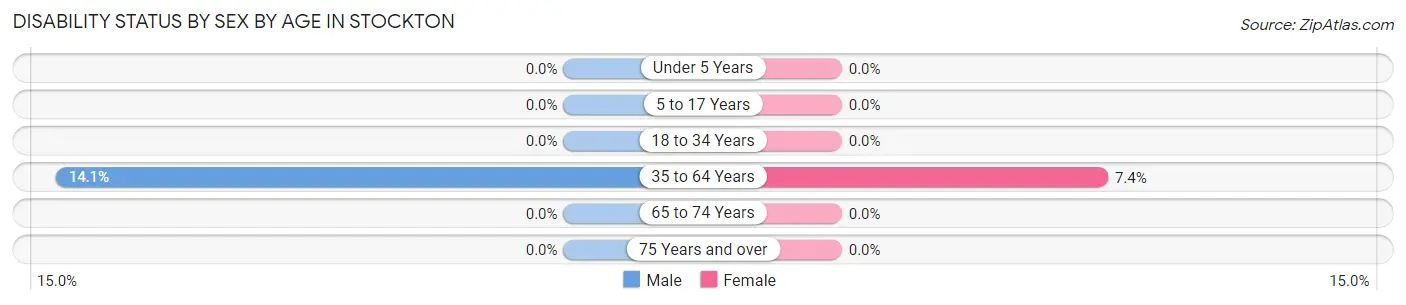
| Age Bracket | Male | Female |
| Under 5 Years | 0 (0.0%) | 0 (0.0%) |
| 5 to 17 Years | 0 (0.0%) | 0 (0.0%) |
| 18 to 34 Years | 0 (0.0%) | 0 (0.0%) |
| 35 to 64 Years | 13 (14.1%) | 10 (7.4%) |
| 65 to 74 Years | 0 (0.0%) | 0 (0.0%) |
| 75 Years and over | 0 (0.0%) | 0 (0.0%) |
Disability Class by Sex by Age in Stockton
Disability Class: Hearing Difficulty
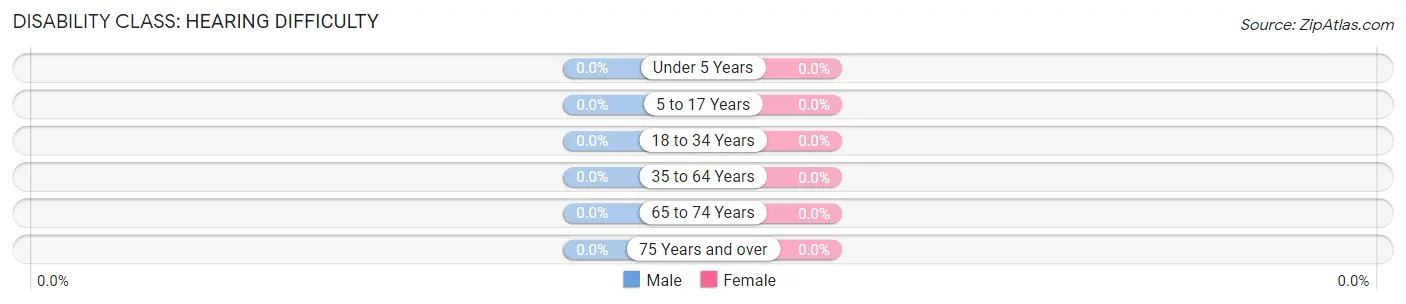
| Age Bracket | Male | Female |
| Under 5 Years | 0 (0.0%) | 0 (0.0%) |
| 5 to 17 Years | 0 (0.0%) | 0 (0.0%) |
| 18 to 34 Years | 0 (0.0%) | 0 (0.0%) |
| 35 to 64 Years | 0 (0.0%) | 0 (0.0%) |
| 65 to 74 Years | 0 (0.0%) | 0 (0.0%) |
| 75 Years and over | 0 (0.0%) | 0 (0.0%) |
Disability Class: Vision Difficulty
| Age Bracket | Male | Female |
| Under 5 Years | 0 (0.0%) | 0 (0.0%) |
| 5 to 17 Years | 0 (0.0%) | 0 (0.0%) |
| 18 to 34 Years | 0 (0.0%) | 0 (0.0%) |
| 35 to 64 Years | 0 (0.0%) | 0 (0.0%) |
| 65 to 74 Years | 0 (0.0%) | 0 (0.0%) |
| 75 Years and over | 0 (0.0%) | 0 (0.0%) |
Disability Class: Cognitive Difficulty
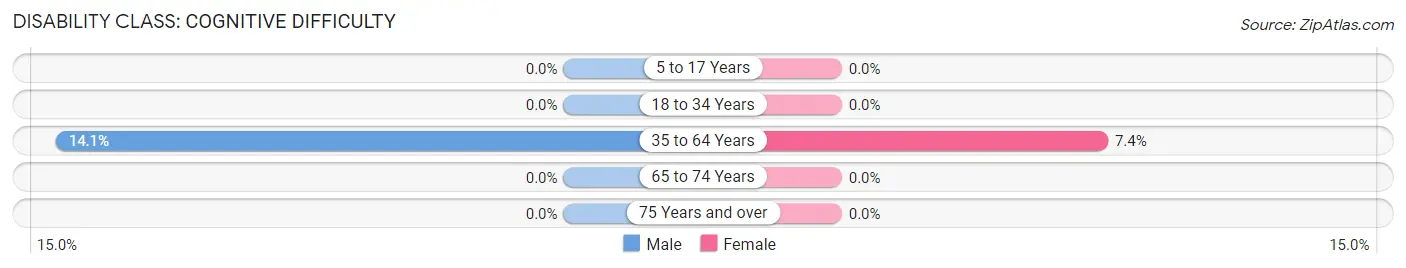
| Age Bracket | Male | Female |
| 5 to 17 Years | 0 (0.0%) | 0 (0.0%) |
| 18 to 34 Years | 0 (0.0%) | 0 (0.0%) |
| 35 to 64 Years | 13 (14.1%) | 10 (7.4%) |
| 65 to 74 Years | 0 (0.0%) | 0 (0.0%) |
| 75 Years and over | 0 (0.0%) | 0 (0.0%) |
Disability Class: Ambulatory Difficulty
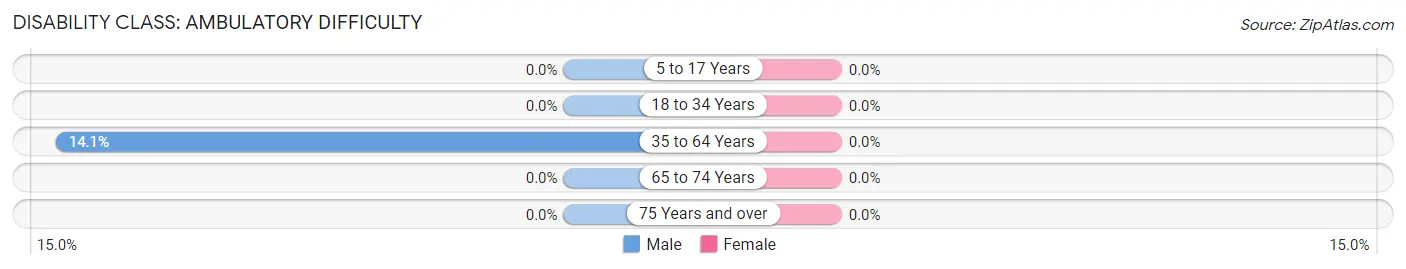
| Age Bracket | Male | Female |
| 5 to 17 Years | 0 (0.0%) | 0 (0.0%) |
| 18 to 34 Years | 0 (0.0%) | 0 (0.0%) |
| 35 to 64 Years | 13 (14.1%) | 0 (0.0%) |
| 65 to 74 Years | 0 (0.0%) | 0 (0.0%) |
| 75 Years and over | 0 (0.0%) | 0 (0.0%) |
Disability Class: Self-Care Difficulty
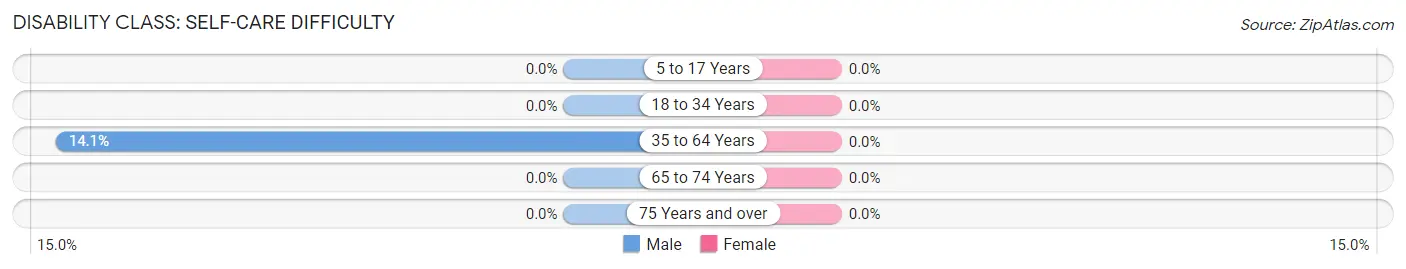
| Age Bracket | Male | Female |
| 5 to 17 Years | 0 (0.0%) | 0 (0.0%) |
| 18 to 34 Years | 0 (0.0%) | 0 (0.0%) |
| 35 to 64 Years | 13 (14.1%) | 0 (0.0%) |
| 65 to 74 Years | 0 (0.0%) | 0 (0.0%) |
| 75 Years and over | 0 (0.0%) | 0 (0.0%) |
Technology Access in Stockton
Computing Device Access in Stockton
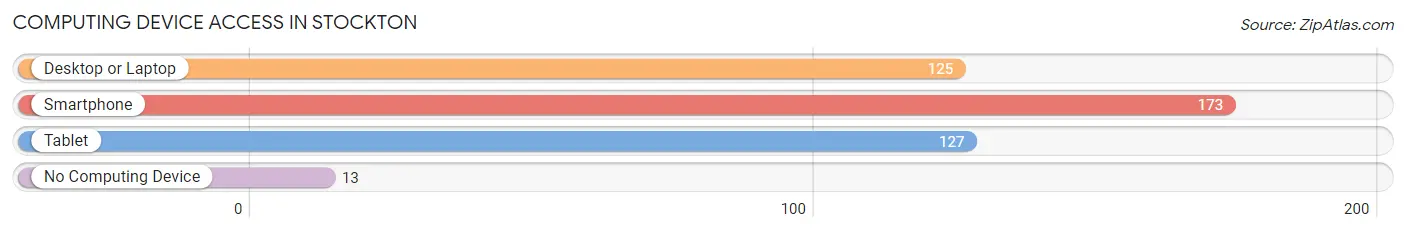
| Device Type | # Households | % Households |
| Desktop or Laptop | 125 | 67.2% |
| Smartphone | 173 | 93.0% |
| Tablet | 127 | 68.3% |
| No Computing Device | 13 | 7.0% |
| Total | 186 | 100.0% |
Internet Access in Stockton
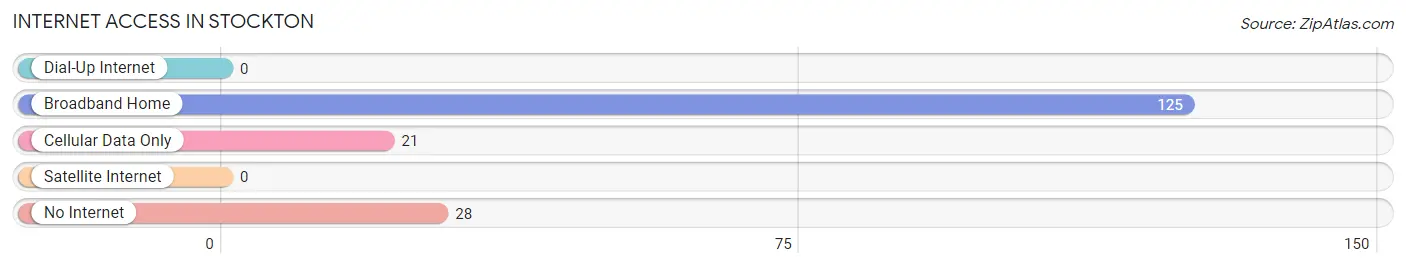
| Internet Type | # Households | % Households |
| Dial-Up Internet | 0 | 0.0% |
| Broadband Home | 125 | 67.2% |
| Cellular Data Only | 21 | 11.3% |
| Satellite Internet | 0 | 0.0% |
| No Internet | 28 | 15.0% |
| Total | 186 | 100.0% |
Stockton Summary
Stockton, Alabama is a small town located in the northwest corner of the state, in the county of Baldwin. It is situated on the banks of the Tensaw River, and is part of the Mobile metropolitan area. The town has a population of approximately 1,500 people, and is known for its rural charm and friendly atmosphere.
History
Stockton was founded in 1818 by settlers from the nearby town of Tensaw. The town was named after the Stockton family, who were among the first settlers. The Stocktons were a prominent family in the area, and their descendants still live in the town today.
The town was originally a farming community, and the main crops grown were cotton, corn, and sweet potatoes. In the late 19th century, the town began to grow as a trading center for the surrounding area. The town was also home to a number of sawmills and lumber companies.
In the early 20th century, Stockton began to experience a period of growth and prosperity. The town was home to a number of businesses, including a bank, a hotel, a movie theater, and a number of stores. The town also had a number of churches, including the First Baptist Church, which was founded in 1845.
Geography
Stockton is located in the northwest corner of Baldwin County, Alabama. The town is situated on the banks of the Tensaw River, and is part of the Mobile metropolitan area. The town is surrounded by a number of small towns and rural communities, including Bay Minette, Loxley, and Robertsdale.
The town is located in a humid subtropical climate zone, and experiences hot, humid summers and mild winters. The average annual temperature is around 70 degrees Fahrenheit, and the average annual precipitation is around 50 inches.
Economy
The economy of Stockton is largely based on agriculture and tourism. The town is home to a number of farms, and the main crops grown are cotton, corn, and sweet potatoes. The town is also home to a number of small businesses, including restaurants, stores, and a movie theater.
The town is also home to a number of tourist attractions, including the Stockton State Park, which is located on the banks of the Tensaw River. The park offers a variety of activities, including camping, fishing, and hiking.
Demographics
As of the 2010 census, the population of Stockton was 1,500. The town is predominantly white, with a small African American population. The median household income is around $35,000, and the median home value is around $100,000. The town has a low unemployment rate, and the majority of the population is employed in the agricultural and tourism industries.
Common Questions
What is Per Capita Income in Stockton?
Per Capita income in Stockton is $49,564.
What is the Median Family Income in Stockton?
Median Family Income in Stockton is $139,235.
What is the Median Household income in Stockton?
Median Household Income in Stockton is $138,246.
What is Inequality or Gini Index in Stockton?
Inequality or Gini Index in Stockton is 0.29.
What is the Total Population of Stockton?
Total Population of Stockton is 420.
What is the Total Male Population of Stockton?
Total Male Population of Stockton is 259.
What is the Total Female Population of Stockton?
Total Female Population of Stockton is 161.
What is the Ratio of Males per 100 Females in Stockton?
There are 160.87 Males per 100 Females in Stockton.
What is the Ratio of Females per 100 Males in Stockton?
There are 62.16 Females per 100 Males in Stockton.
What is the Median Population Age in Stockton?
Median Population Age in Stockton is 48.5 Years.
What is the Average Family Size in Stockton
Average Family Size in Stockton is 2.7 People.
What is the Average Household Size in Stockton
Average Household Size in Stockton is 2.3 People.
How Large is the Labor Force in Stockton?
There are 238 People in the Labor Forcein in Stockton.
What is the Percentage of People in the Labor Force in Stockton?
60.4% of People are in the Labor Force in Stockton.