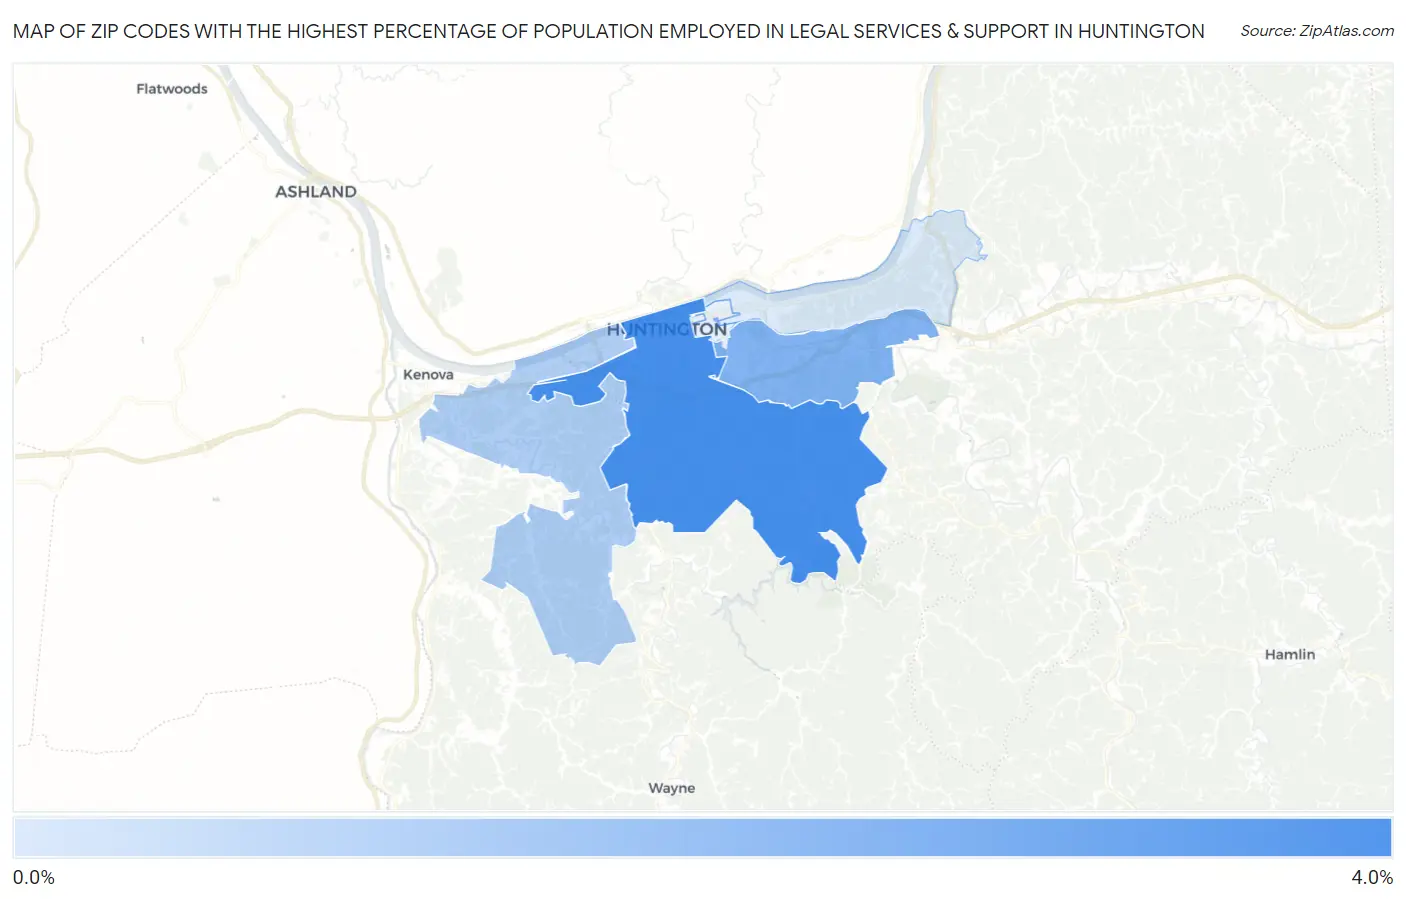
Zip Codes with the Highest Percentage of Population Employed in Legal Services & Support in Huntington, WV
RELATED REPORTS & OPTIONS
Legal Services & Support
Huntington
Compare Zip Codes
Map of Zip Codes with the Highest Percentage of Population Employed in Legal Services & Support in Huntington
0.30%
3.7%
Zip Codes with the Highest Percentage of Population Employed in Legal Services & Support in Huntington, WV
| Zip Code | % Employed | vs State | vs National | |
| 1. | 25701 | 3.7% | 1.1%(+2.58)#27 | 1.2%(+2.49)#1,298 |
| 2. | 25705 | 2.4% | 1.1%(+1.26)#40 | 1.2%(+1.17)#2,750 |
| 3. | 25704 | 1.3% | 1.1%(+0.244)#73 | 1.2%(+0.151)#5,763 |
| 4. | 25702 | 0.30% | 1.1%(-0.790)#159 | 1.2%(-0.882)#15,026 |
1
Common Questions
What are the Top 5 Zip Codes with the Highest Percentage of Population Employed in Legal Services & Support in Huntington, WV?
Top 5 Zip Codes with the Highest Percentage of Population Employed in Legal Services & Support in Huntington, WV are:
What zip code has the Highest Percentage of Population Employed in Legal Services & Support in Huntington, WV?
25701 has the Highest Percentage of Population Employed in Legal Services & Support in Huntington, WV with 3.7%.
What is the Percentage of Population Employed in Legal Services & Support in Huntington, WV?
Percentage of Population Employed in Legal Services & Support in Huntington is 2.0%.
What is the Percentage of Population Employed in Legal Services & Support in West Virginia?
Percentage of Population Employed in Legal Services & Support in West Virginia is 1.1%.
What is the Percentage of Population Employed in Legal Services & Support in the United States?
Percentage of Population Employed in Legal Services & Support in the United States is 1.2%.