Cities with the Highest Percentage of Owner-Occupied Units in New Hampshire
RELATED REPORTS & OPTIONS
Highest Owner-Occupied
New Hampshire
Compare Cities
Map of Cities with the Highest Percentage of Owner-Occupied Units in New Hampshire
0.0%
100.0%
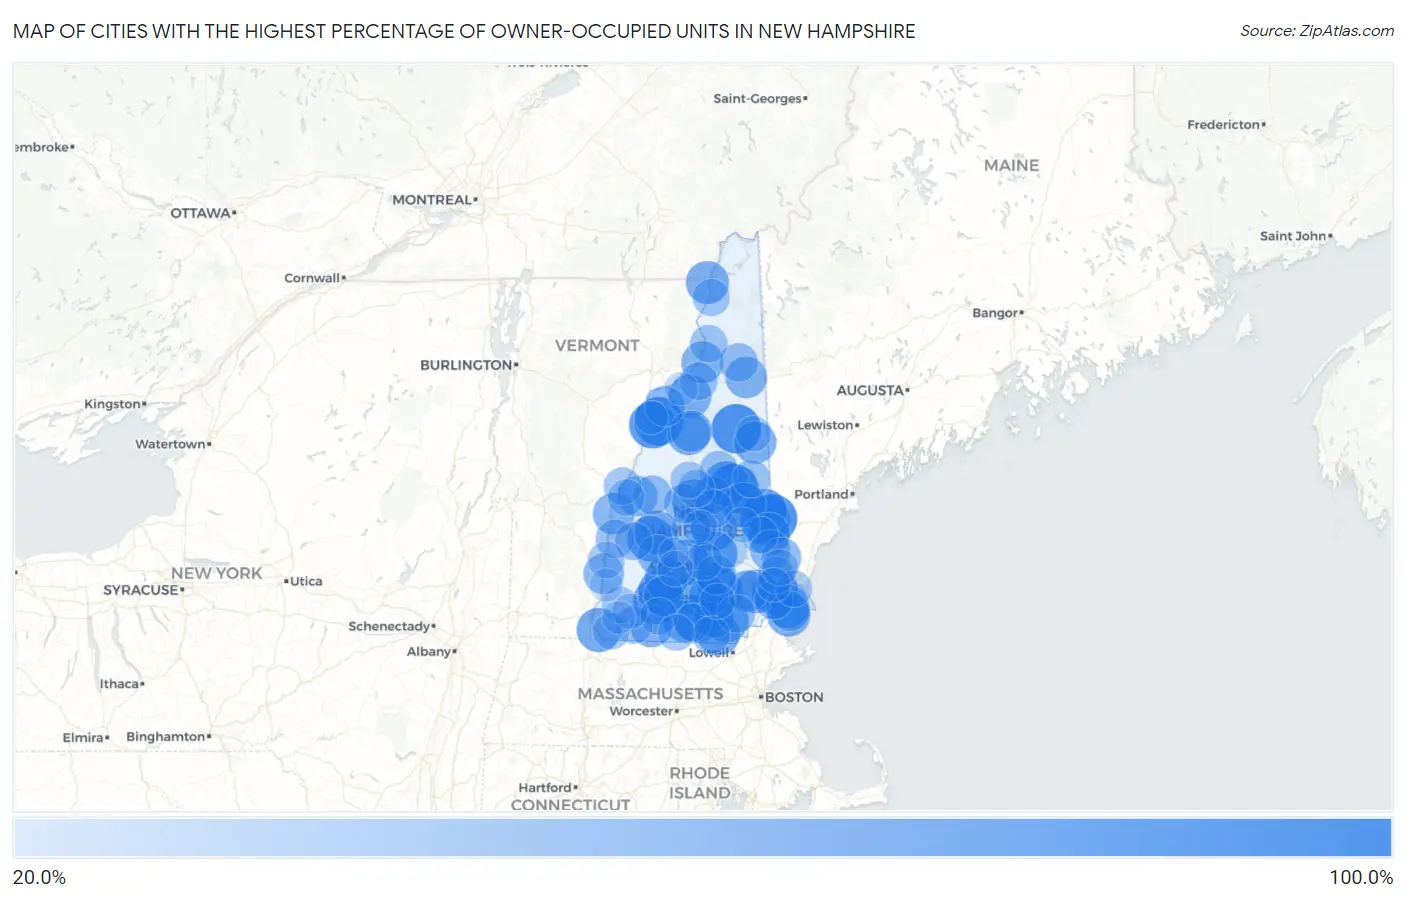
Cities with the Highest Percentage of Owner-Occupied Units in New Hampshire
| City | % Owner-Occupied | vs State | vs National | |
| 1. | Union | 100.0% | 72.3% (+27.7)#1 | 64.8% (+35.2)#355 |
| 2. | Bartlett | 100.0% | 72.3% (+27.7)#2 | 64.8% (+35.2)#554 |
| 3. | Francestown | 100.0% | 72.3% (+27.7)#3 | 64.8% (+35.2)#1,060 |
| 4. | Milton Mills | 100.0% | 72.3% (+27.7)#4 | 64.8% (+35.2)#1,123 |
| 5. | Melvin Village | 100.0% | 72.3% (+27.7)#5 | 64.8% (+35.2)#1,216 |
| 6. | Mountain Lakes | 97.1% | 72.3% (+24.8)#6 | 64.8% (+32.3)#3,118 |
| 7. | Amherst | 91.3% | 72.3% (+19.0)#7 | 64.8% (+26.5)#5,505 |
| 8. | North Haverhill | 90.4% | 72.3% (+18.1)#8 | 64.8% (+25.6)#6,026 |
| 9. | Goffstown | 88.5% | 72.3% (+16.2)#9 | 64.8% (+23.7)#7,023 |
| 10. | Hancock | 88.3% | 72.3% (+16.0)#10 | 64.8% (+23.5)#7,158 |
| 11. | Newfields | 87.9% | 72.3% (+15.6)#11 | 64.8% (+23.0)#7,399 |
| 12. | Contoocook | 86.6% | 72.3% (+14.4)#12 | 64.8% (+21.8)#8,155 |
| 13. | Blodgett Landing | 85.7% | 72.3% (+13.4)#13 | 64.8% (+20.9)#8,749 |
| 14. | Belmont | 85.6% | 72.3% (+13.3)#14 | 64.8% (+20.8)#8,834 |
| 15. | South Hooksett | 85.1% | 72.3% (+12.8)#15 | 64.8% (+20.2)#9,152 |
| 16. | Suissevale | 83.4% | 72.3% (+11.2)#16 | 64.8% (+18.6)#10,125 |
| 17. | Loudon | 83.0% | 72.3% (+10.7)#17 | 64.8% (+18.2)#10,447 |
| 18. | Londonderry | 82.3% | 72.3% (+10.00)#18 | 64.8% (+17.4)#10,958 |
| 19. | Sanbornville | 81.8% | 72.3% (+9.49)#19 | 64.8% (+16.9)#11,293 |
| 20. | Wolfeboro | 81.8% | 72.3% (+9.48)#20 | 64.8% (+16.9)#11,297 |
| 21. | Hinsdale | 80.4% | 72.3% (+8.16)#21 | 64.8% (+15.6)#12,144 |
| 22. | Antrim | 79.9% | 72.3% (+7.65)#22 | 64.8% (+15.1)#12,517 |
| 23. | New London | 79.3% | 72.3% (+7.08)#23 | 64.8% (+14.5)#12,864 |
| 24. | New Hampton | 79.0% | 72.3% (+6.74)#24 | 64.8% (+14.2)#13,082 |
| 25. | New Boston | 78.1% | 72.3% (+5.81)#25 | 64.8% (+13.3)#13,718 |
| 26. | Epping | 77.8% | 72.3% (+5.58)#26 | 64.8% (+13.0)#13,872 |
| 27. | Hillsborough | 77.5% | 72.3% (+5.23)#27 | 64.8% (+12.7)#14,120 |
| 28. | Hampton | 77.2% | 72.3% (+4.89)#28 | 64.8% (+12.3)#14,327 |
| 29. | Seabrook Beach | 76.6% | 72.3% (+4.29)#29 | 64.8% (+11.7)#14,743 |
| 30. | West Stewartstown | 76.0% | 72.3% (+3.76)#30 | 64.8% (+11.2)#15,121 |
| 31. | Hudson | 75.9% | 72.3% (+3.63)#31 | 64.8% (+11.1)#15,211 |
| 32. | Klondike Corner | 75.3% | 72.3% (+3.03)#32 | 64.8% (+10.5)#15,606 |
| 33. | Bethlehem | 75.0% | 72.3% (+2.73)#33 | 64.8% (+10.2)#15,786 |
| 34. | North Woodstock | 74.6% | 72.3% (+2.32)#34 | 64.8% (+9.77)#16,086 |
| 35. | Milton | 74.4% | 72.3% (+2.12)#35 | 64.8% (+9.57)#16,209 |
| 36. | Conway | 74.2% | 72.3% (+1.94)#36 | 64.8% (+9.39)#16,310 |
| 37. | Wilton | 72.9% | 72.3% (+0.661)#37 | 64.8% (+8.11)#17,188 |
| 38. | Lancaster | 72.6% | 72.3% (+0.290)#38 | 64.8% (+7.74)#17,450 |
| 39. | Jaffrey | 71.7% | 72.3% (-0.543)#39 | 64.8% (+6.91)#18,000 |
| 40. | Plainfield | 71.1% | 72.3% (-1.18)#40 | 64.8% (+6.27)#18,422 |
| 41. | Gorham | 70.5% | 72.3% (-1.75)#41 | 64.8% (+5.70)#18,839 |
| 42. | Raymond | 70.1% | 72.3% (-2.12)#42 | 64.8% (+5.33)#19,077 |
| 43. | Lincoln | 69.9% | 72.3% (-2.33)#43 | 64.8% (+5.12)#19,230 |
| 44. | East Merrimack | 69.2% | 72.3% (-3.04)#44 | 64.8% (+4.41)#19,698 |
| 45. | North Walpole | 66.9% | 72.3% (-5.32)#45 | 64.8% (+2.13)#21,040 |
| 46. | Bennington | 66.9% | 72.3% (-5.33)#46 | 64.8% (+2.13)#21,049 |
| 47. | Hooksett | 66.4% | 72.3% (-5.86)#47 | 64.8% (+1.60)#21,404 |
| 48. | Enfield | 66.1% | 72.3% (-6.16)#48 | 64.8% (+1.29)#21,548 |
| 49. | Rochester | 66.0% | 72.3% (-6.30)#49 | 64.8% (+1.15)#21,628 |
| 50. | Bradford | 65.7% | 72.3% (-6.61)#50 | 64.8% (+0.846)#21,795 |
| 51. | Lisbon | 65.3% | 72.3% (-6.96)#51 | 64.8% (+0.495)#21,978 |
| 52. | Somersworth | 64.8% | 72.3% (-7.51)#52 | 64.8% (-0.061)#22,287 |
| 53. | Pinardville | 64.3% | 72.3% (-7.94)#53 | 64.8% (-0.493)#22,522 |
| 54. | Suncook | 64.2% | 72.3% (-8.07)#54 | 64.8% (-0.613)#22,591 |
| 55. | Hampton Beach | 64.0% | 72.3% (-8.25)#55 | 64.8% (-0.798)#22,683 |
| 56. | Franklin | 62.1% | 72.3% (-10.2)#56 | 64.8% (-2.72)#23,768 |
| 57. | Bristol | 61.7% | 72.3% (-10.6)#57 | 64.8% (-3.14)#23,976 |
| 58. | Canaan | 61.0% | 72.3% (-11.3)#58 | 64.8% (-3.84)#24,281 |
| 59. | Exeter | 59.4% | 72.3% (-12.8)#59 | 64.8% (-5.39)#25,043 |
| 60. | Berlin | 59.4% | 72.3% (-12.9)#60 | 64.8% (-5.42)#25,058 |
| 61. | Claremont | 59.2% | 72.3% (-13.0)#61 | 64.8% (-5.58)#25,138 |
| 62. | Meredith | 58.9% | 72.3% (-13.4)#62 | 64.8% (-5.91)#25,271 |
| 63. | Laconia | 58.8% | 72.3% (-13.5)#63 | 64.8% (-6.02)#25,324 |
| 64. | Center Sandwich | 58.7% | 72.3% (-13.6)#64 | 64.8% (-6.15)#25,368 |
| 65. | Derry | 58.0% | 72.3% (-14.2)#65 | 64.8% (-6.77)#25,635 |
| 66. | Concord | 57.2% | 72.3% (-15.0)#66 | 64.8% (-7.59)#25,983 |
| 67. | Newport | 57.1% | 72.3% (-15.2)#67 | 64.8% (-7.74)#26,053 |
| 68. | Whitefield | 56.6% | 72.3% (-15.7)#68 | 64.8% (-8.24)#26,246 |
| 69. | Milford | 56.5% | 72.3% (-15.8)#69 | 64.8% (-8.30)#26,270 |
| 70. | Hanover | 56.3% | 72.3% (-16.0)#70 | 64.8% (-8.50)#26,356 |
| 71. | Center Ossipee | 56.1% | 72.3% (-16.2)#71 | 64.8% (-8.71)#26,445 |
| 72. | Groveton | 55.8% | 72.3% (-16.5)#72 | 64.8% (-9.02)#26,556 |
| 73. | Nashua | 55.5% | 72.3% (-16.7)#73 | 64.8% (-9.27)#26,671 |
| 74. | Troy | 55.5% | 72.3% (-16.8)#74 | 64.8% (-9.35)#26,689 |
| 75. | Ashland | 55.4% | 72.3% (-16.9)#75 | 64.8% (-9.46)#26,728 |
| 76. | Colebrook | 54.6% | 72.3% (-17.7)#76 | 64.8% (-10.2)#27,012 |
| 77. | Durham | 54.1% | 72.3% (-18.1)#77 | 64.8% (-10.7)#27,153 |
| 78. | Peterborough | 54.0% | 72.3% (-18.2)#78 | 64.8% (-10.8)#27,188 |
| 79. | Winchester | 53.0% | 72.3% (-19.3)#79 | 64.8% (-11.9)#27,537 |
| 80. | Charlestown | 52.8% | 72.3% (-19.4)#80 | 64.8% (-12.0)#27,583 |
| 81. | Farmington | 52.8% | 72.3% (-19.5)#81 | 64.8% (-12.0)#27,587 |
| 82. | Plymouth | 52.4% | 72.3% (-19.8)#82 | 64.8% (-12.4)#27,721 |
| 83. | Lebanon | 52.3% | 72.3% (-20.0)#83 | 64.8% (-12.5)#27,760 |
| 84. | Portsmouth | 52.2% | 72.3% (-20.1)#84 | 64.8% (-12.6)#27,808 |
| 85. | Dover | 51.9% | 72.3% (-20.3)#85 | 64.8% (-12.9)#27,883 |
| 86. | Greenville | 51.6% | 72.3% (-20.7)#86 | 64.8% (-13.2)#27,997 |
| 87. | Keene | 51.4% | 72.3% (-20.8)#87 | 64.8% (-13.4)#28,038 |
| 88. | Manchester | 48.2% | 72.3% (-24.1)#88 | 64.8% (-16.6)#28,920 |
| 89. | Henniker | 48.2% | 72.3% (-24.1)#89 | 64.8% (-16.7)#28,927 |
| 90. | North Conway | 47.7% | 72.3% (-24.6)#90 | 64.8% (-17.1)#29,020 |
| 91. | Marlborough | 47.2% | 72.3% (-25.1)#91 | 64.8% (-17.6)#29,123 |
| 92. | Pittsfield | 46.8% | 72.3% (-25.5)#92 | 64.8% (-18.1)#29,219 |
| 93. | Alton | 46.5% | 72.3% (-25.8)#93 | 64.8% (-18.4)#29,280 |
| 94. | Tilton Northfield | 44.6% | 72.3% (-27.6)#94 | 64.8% (-20.2)#29,575 |
| 95. | Newmarket | 42.8% | 72.3% (-29.5)#95 | 64.8% (-22.0)#29,840 |
| 96. | Littleton | 40.5% | 72.3% (-31.8)#96 | 64.8% (-24.3)#30,116 |
| 97. | Woodsville | 40.4% | 72.3% (-31.9)#97 | 64.8% (-24.4)#30,127 |
| 98. | Walpole | 39.8% | 72.3% (-32.5)#98 | 64.8% (-25.0)#30,199 |
| 99. | West Swanzey | 38.2% | 72.3% (-34.0)#99 | 64.8% (-26.6)#30,341 |
| 100. | Warner | 28.6% | 72.3% (-43.7)#100 | 64.8% (-36.2)#30,892 |
1
Common Questions
What are the Top 10 Cities with the Highest Percentage of Owner-Occupied Units in New Hampshire?
Top 10 Cities with the Highest Percentage of Owner-Occupied Units in New Hampshire are:
#1
100.0%
#2
100.0%
#3
100.0%
#4
100.0%
#5
97.1%
#6
91.3%
#7
90.4%
#8
88.5%
#9
88.3%
#10
87.9%
What city has the Highest Percentage of Owner-Occupied Units in New Hampshire?
Union has the Highest Percentage of Owner-Occupied Units in New Hampshire with 100.0%.
What is the Percentage of Owner-Occupied Units in the State of New Hampshire?
Percentage of Owner-Occupied Units in New Hampshire is 72.3%.
What is the Percentage of Owner-Occupied Units in the United States?
Percentage of Owner-Occupied Units in the United States is 64.8%.