Turkish vs Immigrants from Afghanistan 3 or more Vehicles in Household
COMPARE
Turkish
Immigrants from Afghanistan
3 or more Vehicles in Household
3 or more Vehicles in Household Comparison
Turks
Immigrants from Afghanistan
18.4%
3 OR MORE VEHICLES IN HOUSEHOLD
5.4/ 100
METRIC RATING
228th/ 347
METRIC RANK
21.2%
3 OR MORE VEHICLES IN HOUSEHOLD
99.1/ 100
METRIC RATING
90th/ 347
METRIC RANK
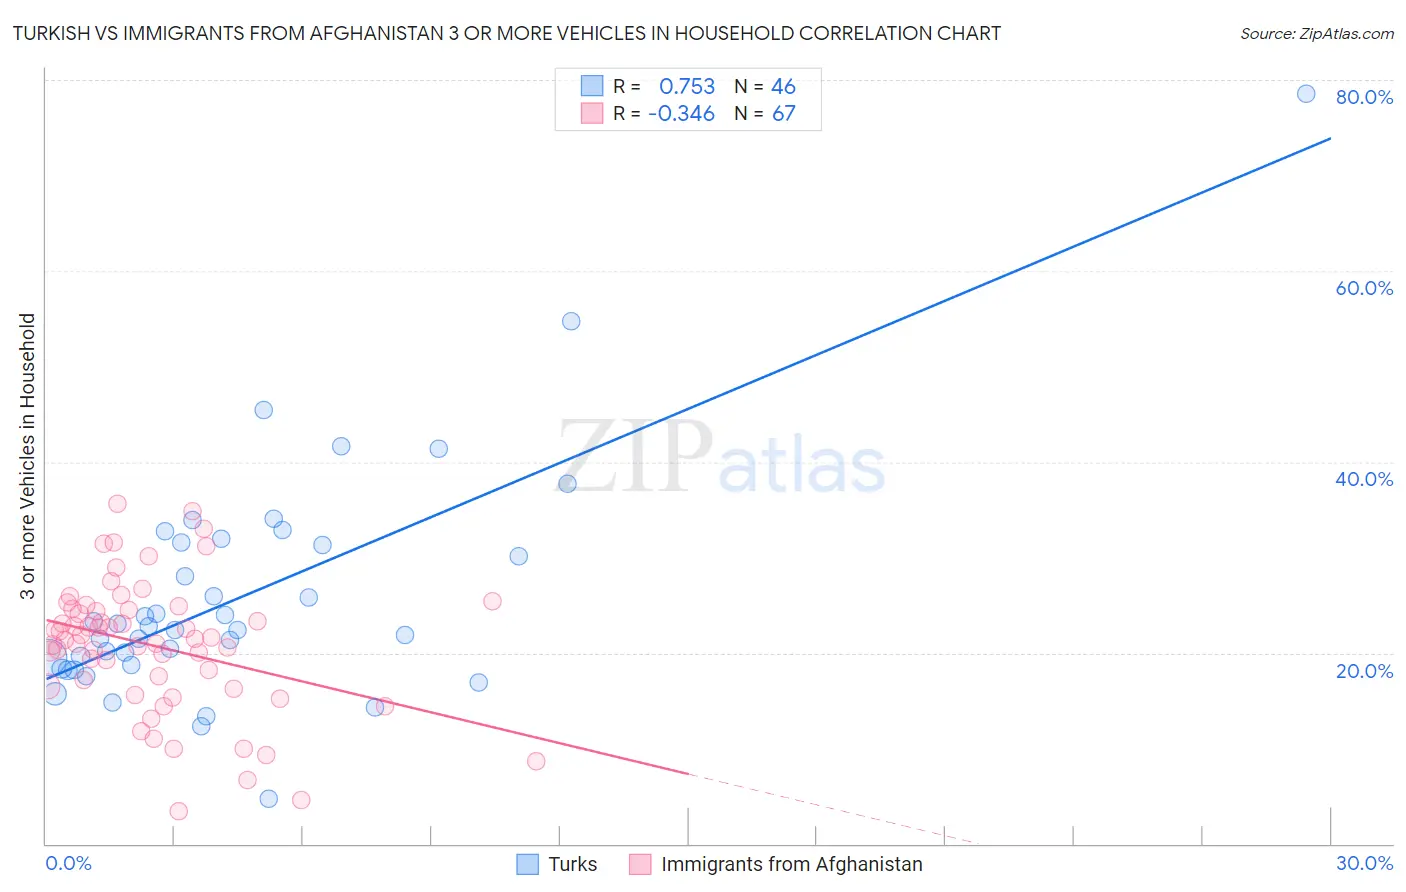
Turkish vs Immigrants from Afghanistan 3 or more Vehicles in Household Correlation Chart
The statistical analysis conducted on geographies consisting of 271,619,794 people shows a strong positive correlation between the proportion of Turks and percentage of households with 3 or more vehicles available in the United States with a correlation coefficient (R) of 0.753 and weighted average of 18.4%. Similarly, the statistical analysis conducted on geographies consisting of 147,579,076 people shows a mild negative correlation between the proportion of Immigrants from Afghanistan and percentage of households with 3 or more vehicles available in the United States with a correlation coefficient (R) of -0.346 and weighted average of 21.2%, a difference of 15.2%.
3 or more Vehicles in Household Correlation Summary
| Measurement | Turkish | Immigrants from Afghanistan |
| Minimum | 4.7% | 3.4% |
| Maximum | 78.6% | 35.6% |
| Range | 73.9% | 32.2% |
| Mean | 25.9% | 20.7% |
| Median | 22.6% | 21.5% |
| Interquartile 25% (IQ1) | 18.7% | 16.5% |
| Interquartile 75% (IQ3) | 31.6% | 24.6% |
| Interquartile Range (IQR) | 12.8% | 8.1% |
| Standard Deviation (Sample) | 12.3% | 6.9% |
| Standard Deviation (Population) | 12.2% | 6.8% |
Similar Demographics by 3 or more Vehicles in Household
Demographics Similar to Turks by 3 or more Vehicles in Household
In terms of 3 or more vehicles in household, the demographic groups most similar to Turks are Immigrants from Singapore (18.4%, a difference of 0.020%), Immigrants from Hungary (18.5%, a difference of 0.050%), Immigrants from Lithuania (18.5%, a difference of 0.080%), Immigrants from Argentina (18.5%, a difference of 0.090%), and Immigrants from Switzerland (18.4%, a difference of 0.17%).
| Demographics | Rating | Rank | 3 or more Vehicles in Household |
| Immigrants | Poland | 7.5 /100 | #221 | Tragic 18.6% |
| Belizeans | 7.3 /100 | #222 | Tragic 18.6% |
| Immigrants | Czechoslovakia | 5.9 /100 | #223 | Tragic 18.5% |
| Immigrants | Argentina | 5.6 /100 | #224 | Tragic 18.5% |
| Immigrants | Lithuania | 5.6 /100 | #225 | Tragic 18.5% |
| Immigrants | Hungary | 5.5 /100 | #226 | Tragic 18.5% |
| Immigrants | Singapore | 5.4 /100 | #227 | Tragic 18.4% |
| Turks | 5.4 /100 | #228 | Tragic 18.4% |
| Immigrants | Switzerland | 5.0 /100 | #229 | Tragic 18.4% |
| Immigrants | Western Asia | 4.8 /100 | #230 | Tragic 18.4% |
| Immigrants | Belgium | 4.8 /100 | #231 | Tragic 18.4% |
| Immigrants | Uganda | 4.6 /100 | #232 | Tragic 18.4% |
| Hondurans | 4.6 /100 | #233 | Tragic 18.4% |
| Immigrants | North Macedonia | 4.4 /100 | #234 | Tragic 18.4% |
| Sierra Leoneans | 3.9 /100 | #235 | Tragic 18.3% |
Demographics Similar to Immigrants from Afghanistan by 3 or more Vehicles in Household
In terms of 3 or more vehicles in household, the demographic groups most similar to Immigrants from Afghanistan are Marshallese (21.3%, a difference of 0.22%), Belgian (21.2%, a difference of 0.33%), Apache (21.2%, a difference of 0.41%), Immigrants from Indonesia (21.1%, a difference of 0.61%), and French (21.4%, a difference of 0.78%).
| Demographics | Rating | Rank | 3 or more Vehicles in Household |
| Chippewa | 99.6 /100 | #83 | Exceptional 21.5% |
| Icelanders | 99.6 /100 | #84 | Exceptional 21.5% |
| Laotians | 99.6 /100 | #85 | Exceptional 21.5% |
| Delaware | 99.6 /100 | #86 | Exceptional 21.5% |
| Immigrants | Azores | 99.5 /100 | #87 | Exceptional 21.5% |
| French | 99.4 /100 | #88 | Exceptional 21.4% |
| Marshallese | 99.2 /100 | #89 | Exceptional 21.3% |
| Immigrants | Afghanistan | 99.1 /100 | #90 | Exceptional 21.2% |
| Belgians | 98.9 /100 | #91 | Exceptional 21.2% |
| Apache | 98.9 /100 | #92 | Exceptional 21.2% |
| Immigrants | Indonesia | 98.8 /100 | #93 | Exceptional 21.1% |
| Immigrants | Cambodia | 98.6 /100 | #94 | Exceptional 21.1% |
| Pakistanis | 98.5 /100 | #95 | Exceptional 21.0% |
| Cree | 98.4 /100 | #96 | Exceptional 21.0% |
| Canadians | 98.3 /100 | #97 | Exceptional 21.0% |