Moroccan vs Scottish 3 or more Vehicles in Household
COMPARE
Moroccan
Scottish
3 or more Vehicles in Household
3 or more Vehicles in Household Comparison
Moroccans
Scottish
15.9%
3 OR MORE VEHICLES IN HOUSEHOLD
0.0/ 100
METRIC RATING
310th/ 347
METRIC RANK
22.6%
3 OR MORE VEHICLES IN HOUSEHOLD
100.0/ 100
METRIC RATING
48th/ 347
METRIC RANK
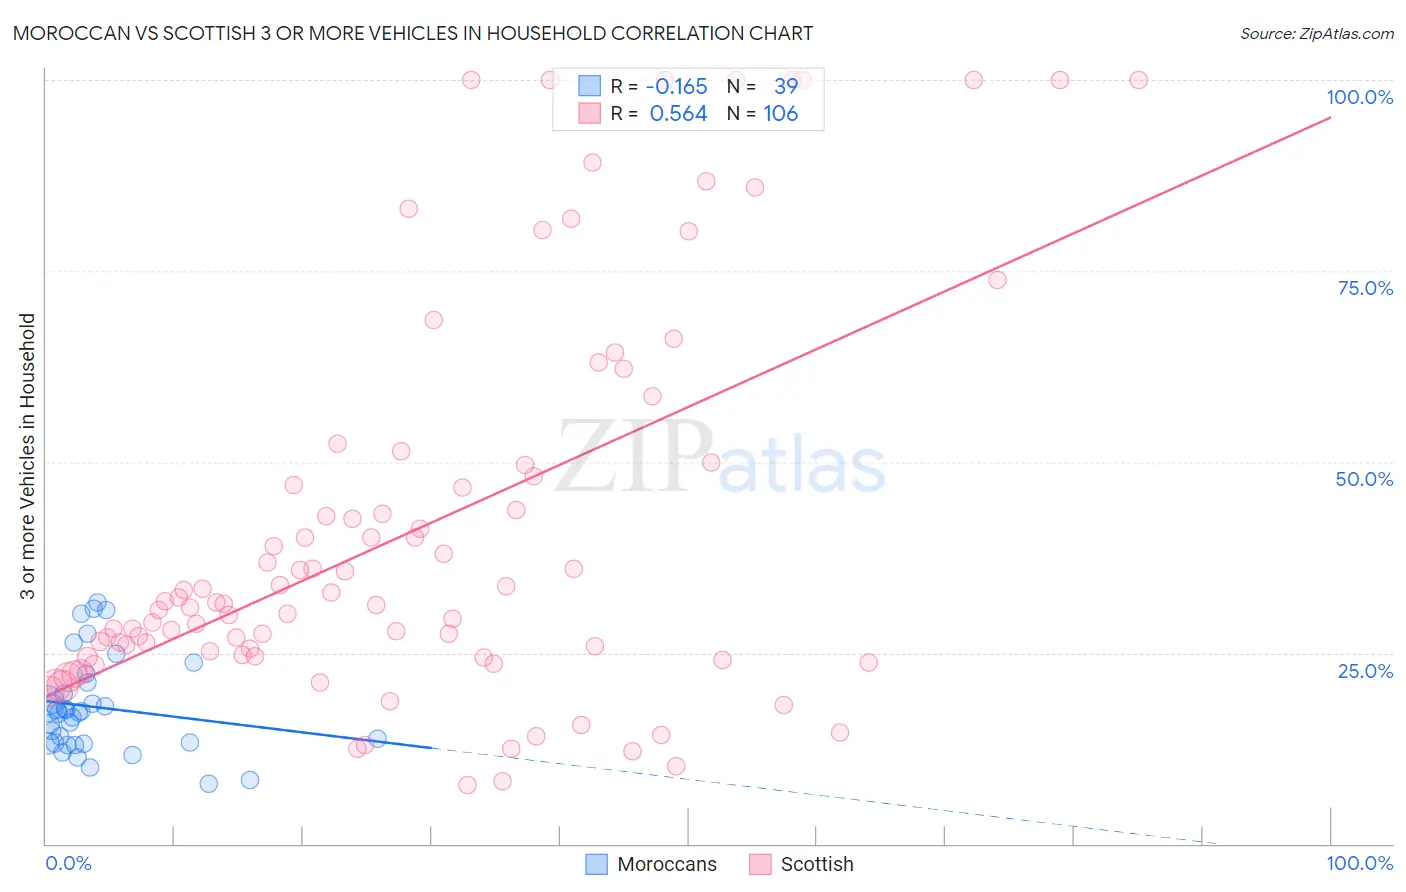
Moroccan vs Scottish 3 or more Vehicles in Household Correlation Chart
The statistical analysis conducted on geographies consisting of 201,717,590 people shows a poor negative correlation between the proportion of Moroccans and percentage of households with 3 or more vehicles available in the United States with a correlation coefficient (R) of -0.165 and weighted average of 15.9%. Similarly, the statistical analysis conducted on geographies consisting of 566,280,219 people shows a substantial positive correlation between the proportion of Scottish and percentage of households with 3 or more vehicles available in the United States with a correlation coefficient (R) of 0.564 and weighted average of 22.6%, a difference of 42.4%.
3 or more Vehicles in Household Correlation Summary
| Measurement | Moroccan | Scottish |
| Minimum | 7.9% | 7.6% |
| Maximum | 31.7% | 100.0% |
| Range | 23.7% | 92.4% |
| Mean | 17.9% | 41.1% |
| Median | 17.3% | 31.5% |
| Interquartile 25% (IQ1) | 13.1% | 24.5% |
| Interquartile 75% (IQ3) | 21.1% | 49.6% |
| Interquartile Range (IQR) | 8.0% | 25.1% |
| Standard Deviation (Sample) | 6.3% | 25.7% |
| Standard Deviation (Population) | 6.2% | 25.6% |
Similar Demographics by 3 or more Vehicles in Household
Demographics Similar to Moroccans by 3 or more Vehicles in Household
In terms of 3 or more vehicles in household, the demographic groups most similar to Moroccans are Immigrants from Somalia (15.9%, a difference of 0.24%), Albanian (15.8%, a difference of 0.50%), Houma (16.1%, a difference of 1.2%), Puerto Rican (15.6%, a difference of 1.6%), and Immigrants from Israel (15.6%, a difference of 1.7%).
| Demographics | Rating | Rank | 3 or more Vehicles in Household |
| Immigrants | Serbia | 0.0 /100 | #303 | Tragic 16.4% |
| Ghanaians | 0.0 /100 | #304 | Tragic 16.4% |
| Immigrants | Morocco | 0.0 /100 | #305 | Tragic 16.3% |
| Somalis | 0.0 /100 | #306 | Tragic 16.2% |
| Immigrants | Ghana | 0.0 /100 | #307 | Tragic 16.2% |
| Houma | 0.0 /100 | #308 | Tragic 16.1% |
| Immigrants | Somalia | 0.0 /100 | #309 | Tragic 15.9% |
| Moroccans | 0.0 /100 | #310 | Tragic 15.9% |
| Albanians | 0.0 /100 | #311 | Tragic 15.8% |
| Puerto Ricans | 0.0 /100 | #312 | Tragic 15.6% |
| Immigrants | Israel | 0.0 /100 | #313 | Tragic 15.6% |
| Immigrants | Belarus | 0.0 /100 | #314 | Tragic 15.5% |
| Haitians | 0.0 /100 | #315 | Tragic 15.5% |
| U.S. Virgin Islanders | 0.0 /100 | #316 | Tragic 15.4% |
| Jamaicans | 0.0 /100 | #317 | Tragic 15.2% |
Demographics Similar to Scottish by 3 or more Vehicles in Household
In terms of 3 or more vehicles in household, the demographic groups most similar to Scottish are Malaysian (22.6%, a difference of 0.010%), American (22.6%, a difference of 0.020%), Scotch-Irish (22.6%, a difference of 0.10%), Sioux (22.6%, a difference of 0.16%), and White/Caucasian (22.6%, a difference of 0.17%).
| Demographics | Rating | Rank | 3 or more Vehicles in Household |
| Germans | 100.0 /100 | #41 | Exceptional 22.7% |
| Natives/Alaskans | 100.0 /100 | #42 | Exceptional 22.7% |
| Osage | 100.0 /100 | #43 | Exceptional 22.7% |
| Cheyenne | 100.0 /100 | #44 | Exceptional 22.7% |
| Ute | 100.0 /100 | #45 | Exceptional 22.7% |
| Americans | 100.0 /100 | #46 | Exceptional 22.6% |
| Malaysians | 100.0 /100 | #47 | Exceptional 22.6% |
| Scottish | 100.0 /100 | #48 | Exceptional 22.6% |
| Scotch-Irish | 100.0 /100 | #49 | Exceptional 22.6% |
| Sioux | 100.0 /100 | #50 | Exceptional 22.6% |
| Whites/Caucasians | 100.0 /100 | #51 | Exceptional 22.6% |
| Welsh | 100.0 /100 | #52 | Exceptional 22.6% |
| Czechs | 100.0 /100 | #53 | Exceptional 22.5% |
| Crow | 100.0 /100 | #54 | Exceptional 22.5% |
| Immigrants | Laos | 100.0 /100 | #55 | Exceptional 22.4% |