Moroccan vs Danish 3 or more Vehicles in Household
COMPARE
Moroccan
Danish
3 or more Vehicles in Household
3 or more Vehicles in Household Comparison
Moroccans
Danes
15.9%
3 OR MORE VEHICLES IN HOUSEHOLD
0.0/ 100
METRIC RATING
310th/ 347
METRIC RANK
24.7%
3 OR MORE VEHICLES IN HOUSEHOLD
100.0/ 100
METRIC RATING
12th/ 347
METRIC RANK
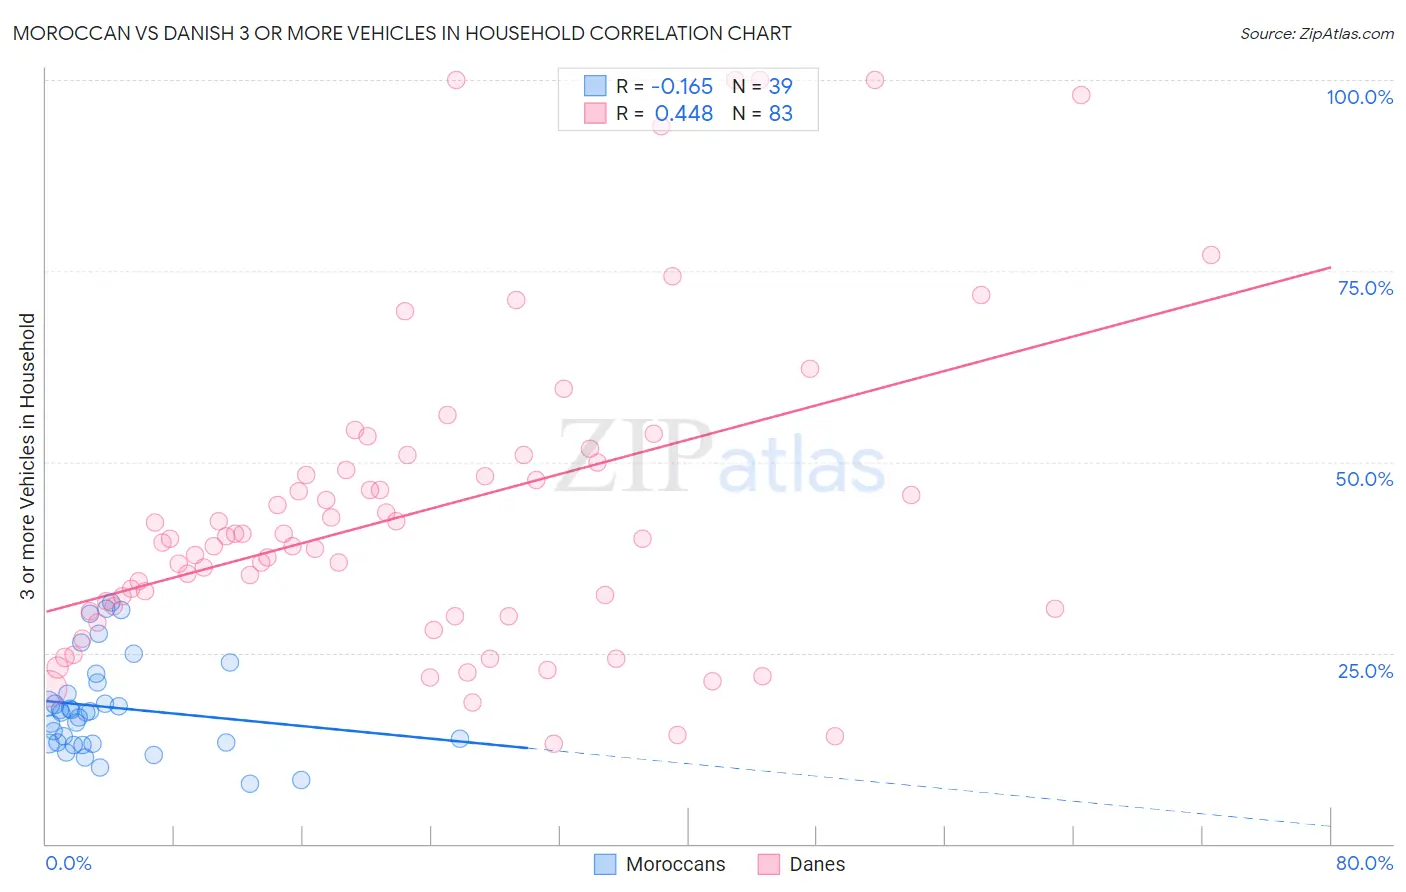
Moroccan vs Danish 3 or more Vehicles in Household Correlation Chart
The statistical analysis conducted on geographies consisting of 201,717,590 people shows a poor negative correlation between the proportion of Moroccans and percentage of households with 3 or more vehicles available in the United States with a correlation coefficient (R) of -0.165 and weighted average of 15.9%. Similarly, the statistical analysis conducted on geographies consisting of 473,746,883 people shows a moderate positive correlation between the proportion of Danes and percentage of households with 3 or more vehicles available in the United States with a correlation coefficient (R) of 0.448 and weighted average of 24.7%, a difference of 55.7%.
3 or more Vehicles in Household Correlation Summary
| Measurement | Moroccan | Danish |
| Minimum | 7.9% | 13.0% |
| Maximum | 31.7% | 100.0% |
| Range | 23.7% | 87.0% |
| Mean | 17.9% | 43.5% |
| Median | 17.3% | 40.0% |
| Interquartile 25% (IQ1) | 13.1% | 30.5% |
| Interquartile 75% (IQ3) | 21.1% | 50.0% |
| Interquartile Range (IQR) | 8.0% | 19.5% |
| Standard Deviation (Sample) | 6.3% | 20.6% |
| Standard Deviation (Population) | 6.2% | 20.5% |
Similar Demographics by 3 or more Vehicles in Household
Demographics Similar to Moroccans by 3 or more Vehicles in Household
In terms of 3 or more vehicles in household, the demographic groups most similar to Moroccans are Immigrants from Somalia (15.9%, a difference of 0.24%), Albanian (15.8%, a difference of 0.50%), Houma (16.1%, a difference of 1.2%), Puerto Rican (15.6%, a difference of 1.6%), and Immigrants from Israel (15.6%, a difference of 1.7%).
| Demographics | Rating | Rank | 3 or more Vehicles in Household |
| Immigrants | Serbia | 0.0 /100 | #303 | Tragic 16.4% |
| Ghanaians | 0.0 /100 | #304 | Tragic 16.4% |
| Immigrants | Morocco | 0.0 /100 | #305 | Tragic 16.3% |
| Somalis | 0.0 /100 | #306 | Tragic 16.2% |
| Immigrants | Ghana | 0.0 /100 | #307 | Tragic 16.2% |
| Houma | 0.0 /100 | #308 | Tragic 16.1% |
| Immigrants | Somalia | 0.0 /100 | #309 | Tragic 15.9% |
| Moroccans | 0.0 /100 | #310 | Tragic 15.9% |
| Albanians | 0.0 /100 | #311 | Tragic 15.8% |
| Puerto Ricans | 0.0 /100 | #312 | Tragic 15.6% |
| Immigrants | Israel | 0.0 /100 | #313 | Tragic 15.6% |
| Immigrants | Belarus | 0.0 /100 | #314 | Tragic 15.5% |
| Haitians | 0.0 /100 | #315 | Tragic 15.5% |
| U.S. Virgin Islanders | 0.0 /100 | #316 | Tragic 15.4% |
| Jamaicans | 0.0 /100 | #317 | Tragic 15.2% |
Demographics Similar to Danes by 3 or more Vehicles in Household
In terms of 3 or more vehicles in household, the demographic groups most similar to Danes are Mexican (24.7%, a difference of 0.080%), Immigrants from Mexico (24.6%, a difference of 0.52%), Shoshone (24.9%, a difference of 0.69%), Nepalese (24.9%, a difference of 0.79%), and Native Hawaiian (24.9%, a difference of 0.88%).
| Demographics | Rating | Rank | 3 or more Vehicles in Household |
| Puget Sound Salish | 100.0 /100 | #5 | Exceptional 26.4% |
| Immigrants | Fiji | 100.0 /100 | #6 | Exceptional 26.1% |
| Colville | 100.0 /100 | #7 | Exceptional 25.8% |
| Samoans | 100.0 /100 | #8 | Exceptional 25.0% |
| Native Hawaiians | 100.0 /100 | #9 | Exceptional 24.9% |
| Nepalese | 100.0 /100 | #10 | Exceptional 24.9% |
| Shoshone | 100.0 /100 | #11 | Exceptional 24.9% |
| Danes | 100.0 /100 | #12 | Exceptional 24.7% |
| Mexicans | 100.0 /100 | #13 | Exceptional 24.7% |
| Immigrants | Mexico | 100.0 /100 | #14 | Exceptional 24.6% |
| Hawaiians | 100.0 /100 | #15 | Exceptional 24.3% |
| Basques | 100.0 /100 | #16 | Exceptional 24.3% |
| Koreans | 100.0 /100 | #17 | Exceptional 24.1% |
| Norwegians | 100.0 /100 | #18 | Exceptional 23.9% |
| Chinese | 100.0 /100 | #19 | Exceptional 23.9% |