Moroccan vs Cuban 3 or more Vehicles in Household
COMPARE
Moroccan
Cuban
3 or more Vehicles in Household
3 or more Vehicles in Household Comparison
Moroccans
Cubans
15.9%
3 OR MORE VEHICLES IN HOUSEHOLD
0.0/ 100
METRIC RATING
310th/ 347
METRIC RANK
19.3%
3 OR MORE VEHICLES IN HOUSEHOLD
36.6/ 100
METRIC RATING
182nd/ 347
METRIC RANK
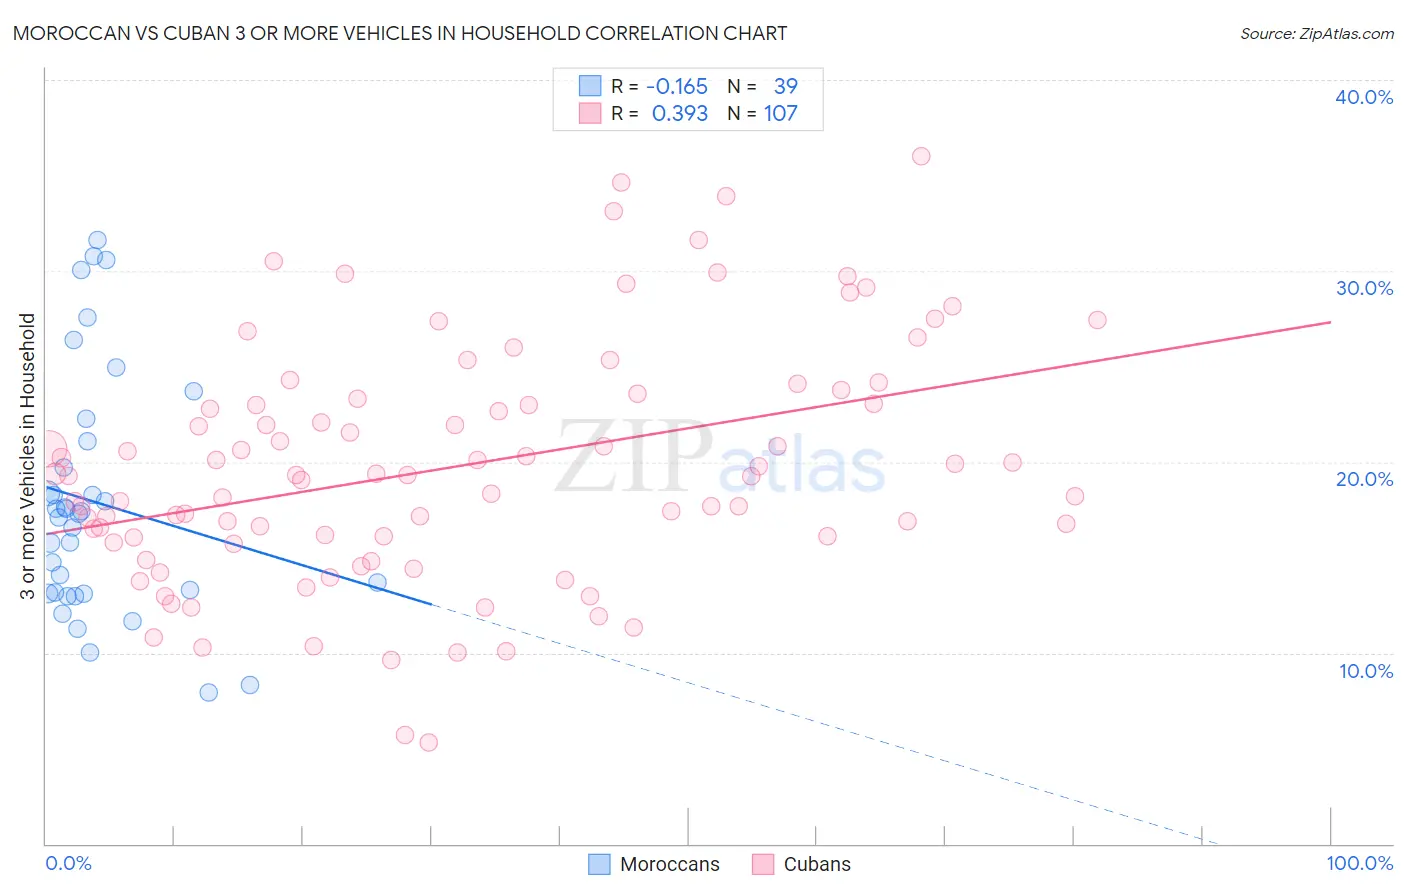
Moroccan vs Cuban 3 or more Vehicles in Household Correlation Chart
The statistical analysis conducted on geographies consisting of 201,717,590 people shows a poor negative correlation between the proportion of Moroccans and percentage of households with 3 or more vehicles available in the United States with a correlation coefficient (R) of -0.165 and weighted average of 15.9%. Similarly, the statistical analysis conducted on geographies consisting of 448,802,841 people shows a mild positive correlation between the proportion of Cubans and percentage of households with 3 or more vehicles available in the United States with a correlation coefficient (R) of 0.393 and weighted average of 19.3%, a difference of 21.5%.
3 or more Vehicles in Household Correlation Summary
| Measurement | Moroccan | Cuban |
| Minimum | 7.9% | 5.3% |
| Maximum | 31.7% | 36.0% |
| Range | 23.7% | 30.7% |
| Mean | 17.9% | 19.8% |
| Median | 17.3% | 19.3% |
| Interquartile 25% (IQ1) | 13.1% | 16.0% |
| Interquartile 75% (IQ3) | 21.1% | 23.3% |
| Interquartile Range (IQR) | 8.0% | 7.3% |
| Standard Deviation (Sample) | 6.3% | 6.3% |
| Standard Deviation (Population) | 6.2% | 6.2% |
Similar Demographics by 3 or more Vehicles in Household
Demographics Similar to Moroccans by 3 or more Vehicles in Household
In terms of 3 or more vehicles in household, the demographic groups most similar to Moroccans are Immigrants from Somalia (15.9%, a difference of 0.24%), Albanian (15.8%, a difference of 0.50%), Houma (16.1%, a difference of 1.2%), Puerto Rican (15.6%, a difference of 1.6%), and Immigrants from Israel (15.6%, a difference of 1.7%).
| Demographics | Rating | Rank | 3 or more Vehicles in Household |
| Immigrants | Serbia | 0.0 /100 | #303 | Tragic 16.4% |
| Ghanaians | 0.0 /100 | #304 | Tragic 16.4% |
| Immigrants | Morocco | 0.0 /100 | #305 | Tragic 16.3% |
| Somalis | 0.0 /100 | #306 | Tragic 16.2% |
| Immigrants | Ghana | 0.0 /100 | #307 | Tragic 16.2% |
| Houma | 0.0 /100 | #308 | Tragic 16.1% |
| Immigrants | Somalia | 0.0 /100 | #309 | Tragic 15.9% |
| Moroccans | 0.0 /100 | #310 | Tragic 15.9% |
| Albanians | 0.0 /100 | #311 | Tragic 15.8% |
| Puerto Ricans | 0.0 /100 | #312 | Tragic 15.6% |
| Immigrants | Israel | 0.0 /100 | #313 | Tragic 15.6% |
| Immigrants | Belarus | 0.0 /100 | #314 | Tragic 15.5% |
| Haitians | 0.0 /100 | #315 | Tragic 15.5% |
| U.S. Virgin Islanders | 0.0 /100 | #316 | Tragic 15.4% |
| Jamaicans | 0.0 /100 | #317 | Tragic 15.2% |
Demographics Similar to Cubans by 3 or more Vehicles in Household
In terms of 3 or more vehicles in household, the demographic groups most similar to Cubans are Romanian (19.3%, a difference of 0.040%), Cajun (19.3%, a difference of 0.050%), South African (19.3%, a difference of 0.070%), Latvian (19.3%, a difference of 0.070%), and Immigrants from South Central Asia (19.3%, a difference of 0.19%).
| Demographics | Rating | Rank | 3 or more Vehicles in Household |
| Syrians | 47.0 /100 | #175 | Average 19.5% |
| Iroquois | 46.0 /100 | #176 | Average 19.4% |
| Immigrants | Peru | 41.1 /100 | #177 | Average 19.4% |
| Immigrants | Syria | 40.3 /100 | #178 | Average 19.4% |
| Immigrants | South Central Asia | 38.9 /100 | #179 | Fair 19.3% |
| South Africans | 37.5 /100 | #180 | Fair 19.3% |
| Romanians | 37.1 /100 | #181 | Fair 19.3% |
| Cubans | 36.6 /100 | #182 | Fair 19.3% |
| Cajuns | 36.0 /100 | #183 | Fair 19.3% |
| Latvians | 35.7 /100 | #184 | Fair 19.3% |
| Immigrants | Sri Lanka | 30.7 /100 | #185 | Fair 19.2% |
| Immigrants | Sweden | 29.0 /100 | #186 | Fair 19.2% |
| Immigrants | Hong Kong | 28.3 /100 | #187 | Fair 19.2% |
| Immigrants | Kuwait | 26.1 /100 | #188 | Fair 19.1% |
| Indians (Asian) | 26.0 /100 | #189 | Fair 19.1% |