Japanese vs Spanish 3 or more Vehicles in Household
COMPARE
Japanese
Spanish
3 or more Vehicles in Household
3 or more Vehicles in Household Comparison
Japanese
Spanish
21.8%
3 OR MORE VEHICLES IN HOUSEHOLD
99.8/ 100
METRIC RATING
75th/ 347
METRIC RANK
23.1%
3 OR MORE VEHICLES IN HOUSEHOLD
100.0/ 100
METRIC RATING
29th/ 347
METRIC RANK
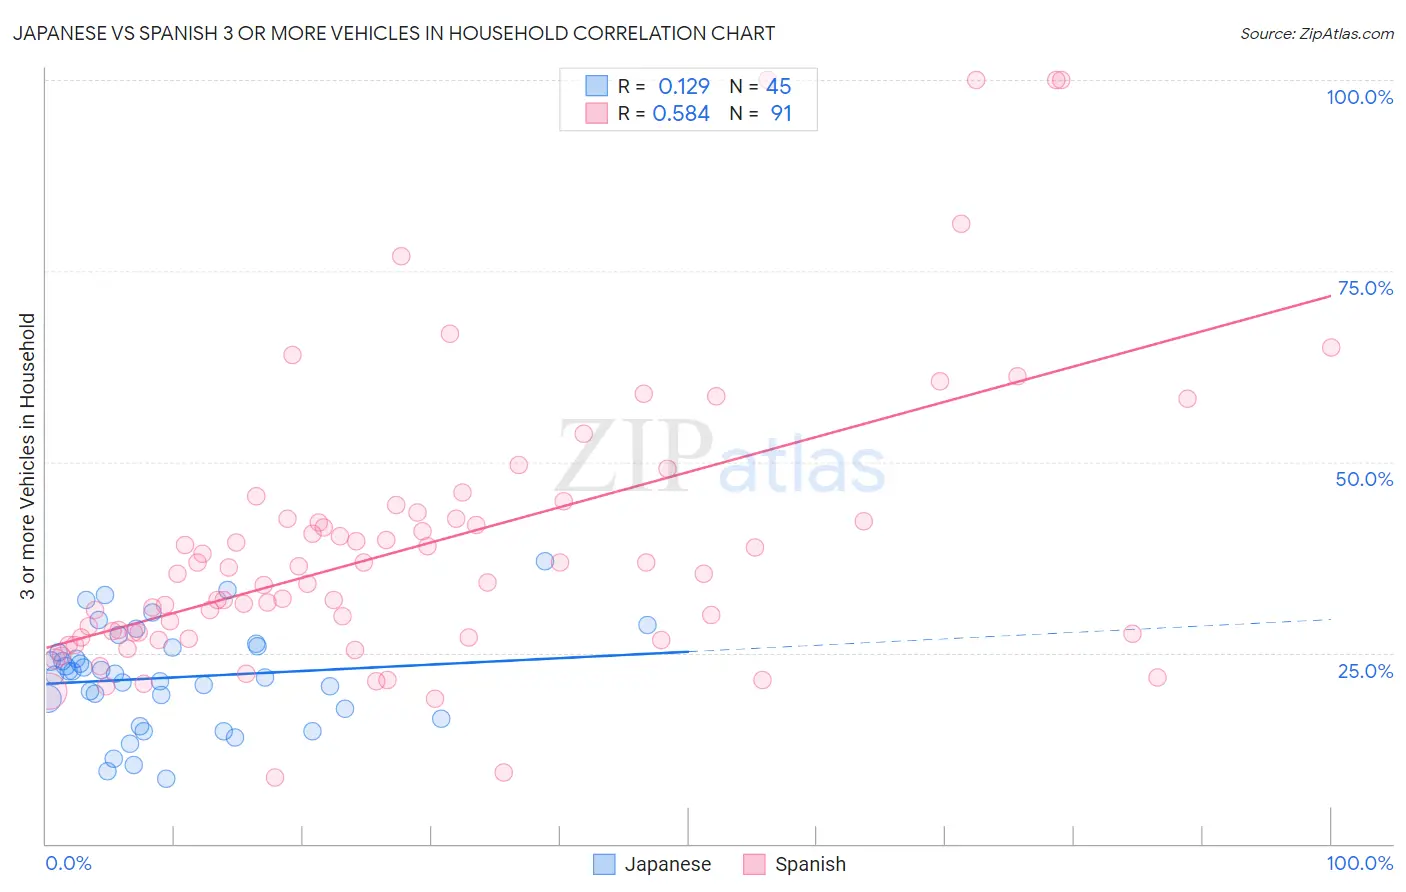
Japanese vs Spanish 3 or more Vehicles in Household Correlation Chart
The statistical analysis conducted on geographies consisting of 249,016,700 people shows a poor positive correlation between the proportion of Japanese and percentage of households with 3 or more vehicles available in the United States with a correlation coefficient (R) of 0.129 and weighted average of 21.8%. Similarly, the statistical analysis conducted on geographies consisting of 421,817,917 people shows a substantial positive correlation between the proportion of Spanish and percentage of households with 3 or more vehicles available in the United States with a correlation coefficient (R) of 0.584 and weighted average of 23.1%, a difference of 6.2%.
3 or more Vehicles in Household Correlation Summary
| Measurement | Japanese | Spanish |
| Minimum | 8.6% | 8.7% |
| Maximum | 37.0% | 100.0% |
| Range | 28.5% | 91.3% |
| Mean | 21.8% | 39.1% |
| Median | 22.3% | 35.3% |
| Interquartile 25% (IQ1) | 17.0% | 27.1% |
| Interquartile 75% (IQ3) | 25.8% | 42.6% |
| Interquartile Range (IQR) | 8.8% | 15.5% |
| Standard Deviation (Sample) | 6.5% | 18.7% |
| Standard Deviation (Population) | 6.5% | 18.6% |
Similar Demographics by 3 or more Vehicles in Household
Demographics Similar to Japanese by 3 or more Vehicles in Household
In terms of 3 or more vehicles in household, the demographic groups most similar to Japanese are Nonimmigrants (21.8%, a difference of 0.040%), Immigrants from Oceania (21.8%, a difference of 0.10%), Salvadoran (21.8%, a difference of 0.12%), Irish (21.8%, a difference of 0.12%), and Portuguese (21.8%, a difference of 0.21%).
| Demographics | Rating | Rank | 3 or more Vehicles in Household |
| British | 99.9 /100 | #68 | Exceptional 21.9% |
| Creek | 99.9 /100 | #69 | Exceptional 21.9% |
| Bangladeshis | 99.8 /100 | #70 | Exceptional 21.9% |
| Potawatomi | 99.8 /100 | #71 | Exceptional 21.9% |
| Portuguese | 99.8 /100 | #72 | Exceptional 21.8% |
| Salvadorans | 99.8 /100 | #73 | Exceptional 21.8% |
| Immigrants | Oceania | 99.8 /100 | #74 | Exceptional 21.8% |
| Japanese | 99.8 /100 | #75 | Exceptional 21.8% |
| Immigrants | Nonimmigrants | 99.8 /100 | #76 | Exceptional 21.8% |
| Irish | 99.8 /100 | #77 | Exceptional 21.8% |
| Czechoslovakians | 99.8 /100 | #78 | Exceptional 21.7% |
| Assyrians/Chaldeans/Syriacs | 99.8 /100 | #79 | Exceptional 21.7% |
| Afghans | 99.7 /100 | #80 | Exceptional 21.7% |
| Celtics | 99.7 /100 | #81 | Exceptional 21.7% |
| Immigrants | El Salvador | 99.6 /100 | #82 | Exceptional 21.5% |
Demographics Similar to Spanish by 3 or more Vehicles in Household
In terms of 3 or more vehicles in household, the demographic groups most similar to Spanish are Lumbee (23.1%, a difference of 0.070%), Immigrants from South Eastern Asia (23.1%, a difference of 0.17%), English (23.1%, a difference of 0.36%), Guamanian/Chamorro (23.2%, a difference of 0.40%), and Pueblo (23.0%, a difference of 0.45%).
| Demographics | Rating | Rank | 3 or more Vehicles in Household |
| Immigrants | Philippines | 100.0 /100 | #22 | Exceptional 23.8% |
| Scandinavians | 100.0 /100 | #23 | Exceptional 23.6% |
| Sri Lankans | 100.0 /100 | #24 | Exceptional 23.6% |
| Immigrants | Central America | 100.0 /100 | #25 | Exceptional 23.4% |
| Mexican American Indians | 100.0 /100 | #26 | Exceptional 23.3% |
| Guamanians/Chamorros | 100.0 /100 | #27 | Exceptional 23.2% |
| Lumbee | 100.0 /100 | #28 | Exceptional 23.1% |
| Spanish | 100.0 /100 | #29 | Exceptional 23.1% |
| Immigrants | South Eastern Asia | 100.0 /100 | #30 | Exceptional 23.1% |
| English | 100.0 /100 | #31 | Exceptional 23.1% |
| Pueblo | 100.0 /100 | #32 | Exceptional 23.0% |
| Spanish Americans | 100.0 /100 | #33 | Exceptional 23.0% |
| Swiss | 100.0 /100 | #34 | Exceptional 23.0% |
| Choctaw | 100.0 /100 | #35 | Exceptional 23.0% |
| Cherokee | 100.0 /100 | #36 | Exceptional 23.0% |