Japanese vs Immigrants from Croatia 3 or more Vehicles in Household
COMPARE
Japanese
Immigrants from Croatia
3 or more Vehicles in Household
3 or more Vehicles in Household Comparison
Japanese
Immigrants from Croatia
21.8%
3 OR MORE VEHICLES IN HOUSEHOLD
99.8/ 100
METRIC RATING
75th/ 347
METRIC RANK
17.2%
3 OR MORE VEHICLES IN HOUSEHOLD
0.2/ 100
METRIC RATING
285th/ 347
METRIC RANK
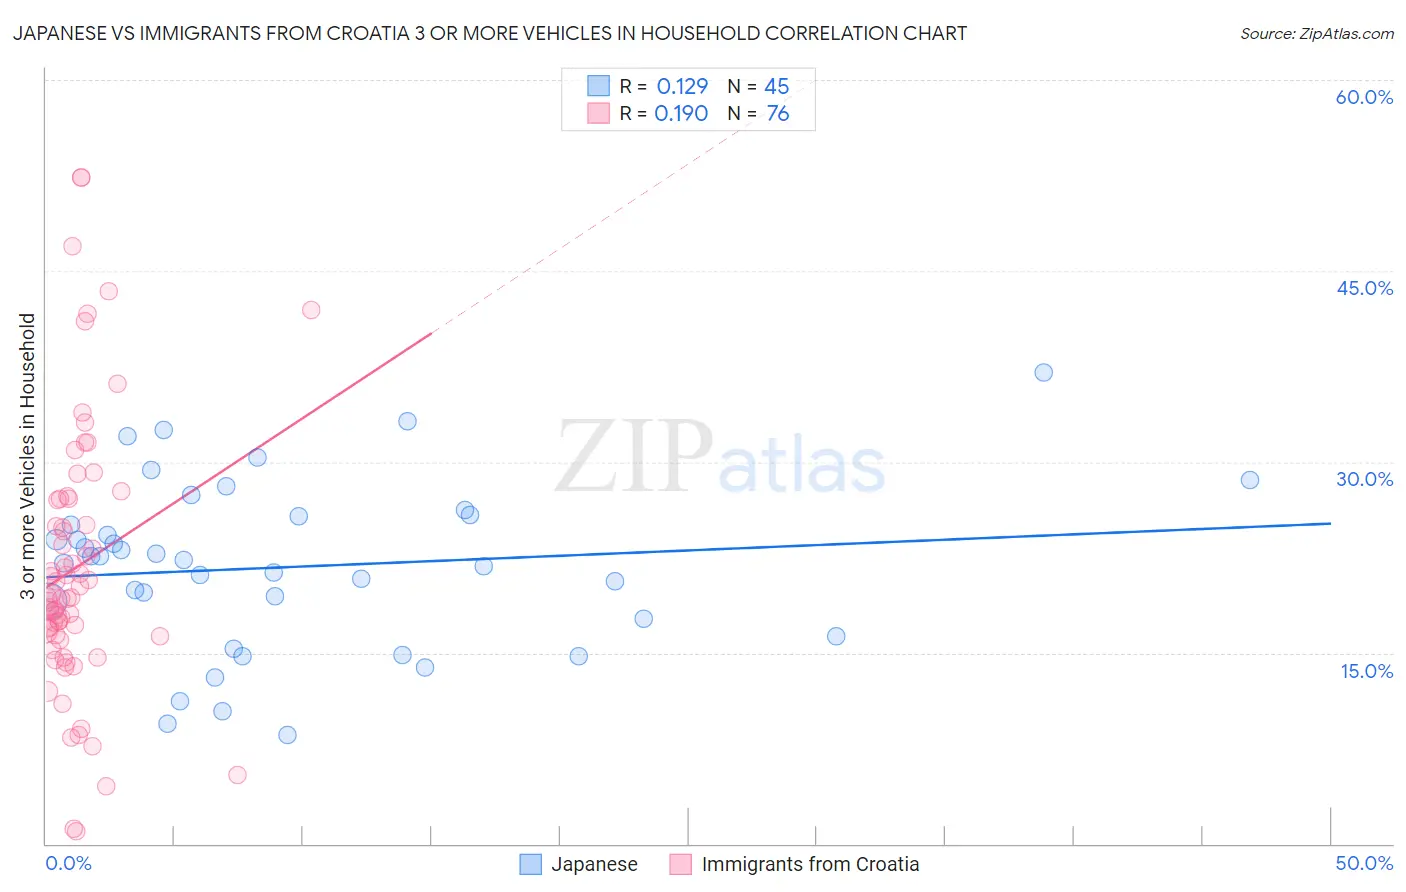
Japanese vs Immigrants from Croatia 3 or more Vehicles in Household Correlation Chart
The statistical analysis conducted on geographies consisting of 249,016,700 people shows a poor positive correlation between the proportion of Japanese and percentage of households with 3 or more vehicles available in the United States with a correlation coefficient (R) of 0.129 and weighted average of 21.8%. Similarly, the statistical analysis conducted on geographies consisting of 132,550,126 people shows a poor positive correlation between the proportion of Immigrants from Croatia and percentage of households with 3 or more vehicles available in the United States with a correlation coefficient (R) of 0.190 and weighted average of 17.2%, a difference of 26.7%.
3 or more Vehicles in Household Correlation Summary
| Measurement | Japanese | Immigrants from Croatia |
| Minimum | 8.6% | 0.97% |
| Maximum | 37.0% | 52.4% |
| Range | 28.5% | 51.4% |
| Mean | 21.8% | 21.7% |
| Median | 22.3% | 19.3% |
| Interquartile 25% (IQ1) | 17.0% | 16.4% |
| Interquartile 75% (IQ3) | 25.8% | 27.1% |
| Interquartile Range (IQR) | 8.8% | 10.7% |
| Standard Deviation (Sample) | 6.5% | 10.5% |
| Standard Deviation (Population) | 6.5% | 10.5% |
Similar Demographics by 3 or more Vehicles in Household
Demographics Similar to Japanese by 3 or more Vehicles in Household
In terms of 3 or more vehicles in household, the demographic groups most similar to Japanese are Nonimmigrants (21.8%, a difference of 0.040%), Immigrants from Oceania (21.8%, a difference of 0.10%), Salvadoran (21.8%, a difference of 0.12%), Irish (21.8%, a difference of 0.12%), and Portuguese (21.8%, a difference of 0.21%).
| Demographics | Rating | Rank | 3 or more Vehicles in Household |
| British | 99.9 /100 | #68 | Exceptional 21.9% |
| Creek | 99.9 /100 | #69 | Exceptional 21.9% |
| Bangladeshis | 99.8 /100 | #70 | Exceptional 21.9% |
| Potawatomi | 99.8 /100 | #71 | Exceptional 21.9% |
| Portuguese | 99.8 /100 | #72 | Exceptional 21.8% |
| Salvadorans | 99.8 /100 | #73 | Exceptional 21.8% |
| Immigrants | Oceania | 99.8 /100 | #74 | Exceptional 21.8% |
| Japanese | 99.8 /100 | #75 | Exceptional 21.8% |
| Immigrants | Nonimmigrants | 99.8 /100 | #76 | Exceptional 21.8% |
| Irish | 99.8 /100 | #77 | Exceptional 21.8% |
| Czechoslovakians | 99.8 /100 | #78 | Exceptional 21.7% |
| Assyrians/Chaldeans/Syriacs | 99.8 /100 | #79 | Exceptional 21.7% |
| Afghans | 99.7 /100 | #80 | Exceptional 21.7% |
| Celtics | 99.7 /100 | #81 | Exceptional 21.7% |
| Immigrants | El Salvador | 99.6 /100 | #82 | Exceptional 21.5% |
Demographics Similar to Immigrants from Croatia by 3 or more Vehicles in Household
In terms of 3 or more vehicles in household, the demographic groups most similar to Immigrants from Croatia are Menominee (17.2%, a difference of 0.060%), Immigrants from Brazil (17.1%, a difference of 0.36%), Immigrants from Uruguay (17.1%, a difference of 0.45%), Immigrants from Liberia (17.1%, a difference of 0.52%), and Immigrants from Colombia (17.3%, a difference of 0.73%).
| Demographics | Rating | Rank | 3 or more Vehicles in Household |
| Immigrants | Bahamas | 0.3 /100 | #278 | Tragic 17.4% |
| Immigrants | Kazakhstan | 0.3 /100 | #279 | Tragic 17.4% |
| Immigrants | Eastern Europe | 0.3 /100 | #280 | Tragic 17.4% |
| Immigrants | Latvia | 0.3 /100 | #281 | Tragic 17.4% |
| Immigrants | Ireland | 0.3 /100 | #282 | Tragic 17.3% |
| Blacks/African Americans | 0.3 /100 | #283 | Tragic 17.3% |
| Immigrants | Colombia | 0.3 /100 | #284 | Tragic 17.3% |
| Immigrants | Croatia | 0.2 /100 | #285 | Tragic 17.2% |
| Menominee | 0.2 /100 | #286 | Tragic 17.2% |
| Immigrants | Brazil | 0.2 /100 | #287 | Tragic 17.1% |
| Immigrants | Uruguay | 0.2 /100 | #288 | Tragic 17.1% |
| Immigrants | Liberia | 0.1 /100 | #289 | Tragic 17.1% |
| Liberians | 0.1 /100 | #290 | Tragic 17.0% |
| Immigrants | Congo | 0.1 /100 | #291 | Tragic 17.0% |
| Immigrants | Spain | 0.1 /100 | #292 | Tragic 17.0% |