Japanese vs Immigrants from Middle Africa 3 or more Vehicles in Household
COMPARE
Japanese
Immigrants from Middle Africa
3 or more Vehicles in Household
3 or more Vehicles in Household Comparison
Japanese
Immigrants from Middle Africa
21.8%
3 OR MORE VEHICLES IN HOUSEHOLD
99.8/ 100
METRIC RATING
75th/ 347
METRIC RANK
18.2%
3 OR MORE VEHICLES IN HOUSEHOLD
3.1/ 100
METRIC RATING
239th/ 347
METRIC RANK
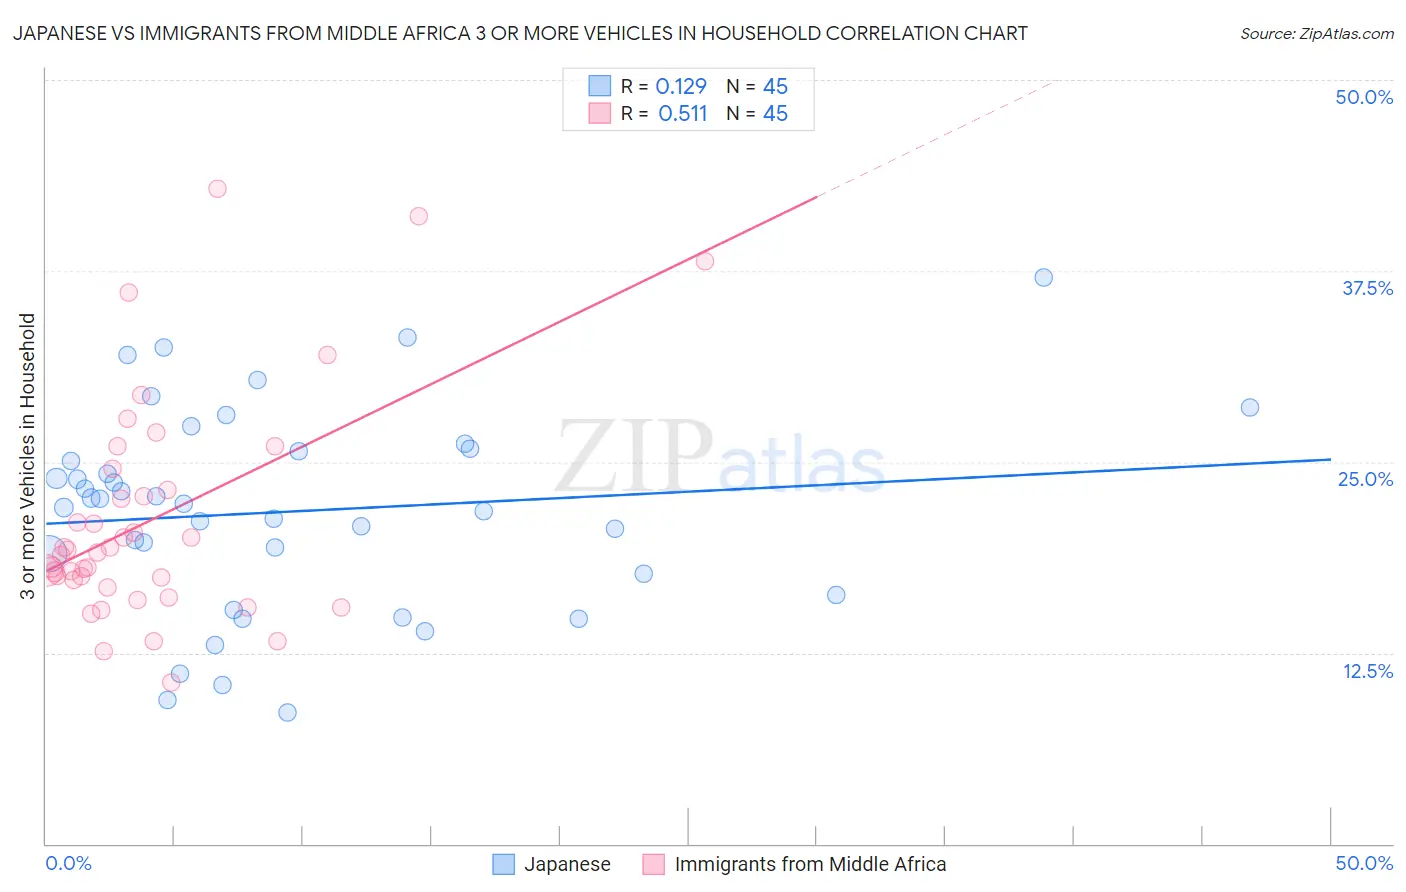
Japanese vs Immigrants from Middle Africa 3 or more Vehicles in Household Correlation Chart
The statistical analysis conducted on geographies consisting of 249,016,700 people shows a poor positive correlation between the proportion of Japanese and percentage of households with 3 or more vehicles available in the United States with a correlation coefficient (R) of 0.129 and weighted average of 21.8%. Similarly, the statistical analysis conducted on geographies consisting of 202,639,411 people shows a substantial positive correlation between the proportion of Immigrants from Middle Africa and percentage of households with 3 or more vehicles available in the United States with a correlation coefficient (R) of 0.511 and weighted average of 18.2%, a difference of 19.4%.
3 or more Vehicles in Household Correlation Summary
| Measurement | Japanese | Immigrants from Middle Africa |
| Minimum | 8.6% | 10.6% |
| Maximum | 37.0% | 42.9% |
| Range | 28.5% | 32.3% |
| Mean | 21.8% | 21.2% |
| Median | 22.3% | 19.1% |
| Interquartile 25% (IQ1) | 17.0% | 17.0% |
| Interquartile 75% (IQ3) | 25.8% | 23.8% |
| Interquartile Range (IQR) | 8.8% | 6.8% |
| Standard Deviation (Sample) | 6.5% | 7.3% |
| Standard Deviation (Population) | 6.5% | 7.2% |
Similar Demographics by 3 or more Vehicles in Household
Demographics Similar to Japanese by 3 or more Vehicles in Household
In terms of 3 or more vehicles in household, the demographic groups most similar to Japanese are Nonimmigrants (21.8%, a difference of 0.040%), Immigrants from Oceania (21.8%, a difference of 0.10%), Salvadoran (21.8%, a difference of 0.12%), Irish (21.8%, a difference of 0.12%), and Portuguese (21.8%, a difference of 0.21%).
| Demographics | Rating | Rank | 3 or more Vehicles in Household |
| British | 99.9 /100 | #68 | Exceptional 21.9% |
| Creek | 99.9 /100 | #69 | Exceptional 21.9% |
| Bangladeshis | 99.8 /100 | #70 | Exceptional 21.9% |
| Potawatomi | 99.8 /100 | #71 | Exceptional 21.9% |
| Portuguese | 99.8 /100 | #72 | Exceptional 21.8% |
| Salvadorans | 99.8 /100 | #73 | Exceptional 21.8% |
| Immigrants | Oceania | 99.8 /100 | #74 | Exceptional 21.8% |
| Japanese | 99.8 /100 | #75 | Exceptional 21.8% |
| Immigrants | Nonimmigrants | 99.8 /100 | #76 | Exceptional 21.8% |
| Irish | 99.8 /100 | #77 | Exceptional 21.8% |
| Czechoslovakians | 99.8 /100 | #78 | Exceptional 21.7% |
| Assyrians/Chaldeans/Syriacs | 99.8 /100 | #79 | Exceptional 21.7% |
| Afghans | 99.7 /100 | #80 | Exceptional 21.7% |
| Celtics | 99.7 /100 | #81 | Exceptional 21.7% |
| Immigrants | El Salvador | 99.6 /100 | #82 | Exceptional 21.5% |
Demographics Similar to Immigrants from Middle Africa by 3 or more Vehicles in Household
In terms of 3 or more vehicles in household, the demographic groups most similar to Immigrants from Middle Africa are Immigrants from Honduras (18.2%, a difference of 0.010%), Immigrants from China (18.2%, a difference of 0.13%), Indonesian (18.3%, a difference of 0.24%), Immigrants from Malaysia (18.3%, a difference of 0.28%), and African (18.2%, a difference of 0.32%).
| Demographics | Rating | Rank | 3 or more Vehicles in Household |
| Immigrants | Uganda | 4.6 /100 | #232 | Tragic 18.4% |
| Hondurans | 4.6 /100 | #233 | Tragic 18.4% |
| Immigrants | North Macedonia | 4.4 /100 | #234 | Tragic 18.4% |
| Sierra Leoneans | 3.9 /100 | #235 | Tragic 18.3% |
| Immigrants | Malaysia | 3.6 /100 | #236 | Tragic 18.3% |
| Indonesians | 3.5 /100 | #237 | Tragic 18.3% |
| Immigrants | Honduras | 3.1 /100 | #238 | Tragic 18.2% |
| Immigrants | Middle Africa | 3.1 /100 | #239 | Tragic 18.2% |
| Immigrants | China | 2.9 /100 | #240 | Tragic 18.2% |
| Africans | 2.7 /100 | #241 | Tragic 18.2% |
| Hopi | 2.5 /100 | #242 | Tragic 18.2% |
| Immigrants | Europe | 2.4 /100 | #243 | Tragic 18.1% |
| Mongolians | 2.3 /100 | #244 | Tragic 18.1% |
| Immigrants | Belize | 2.1 /100 | #245 | Tragic 18.1% |
| Immigrants | Australia | 2.0 /100 | #246 | Tragic 18.1% |