Japanese vs Immigrants from Canada 3 or more Vehicles in Household
COMPARE
Japanese
Immigrants from Canada
3 or more Vehicles in Household
3 or more Vehicles in Household Comparison
Japanese
Immigrants from Canada
21.8%
3 OR MORE VEHICLES IN HOUSEHOLD
99.8/ 100
METRIC RATING
75th/ 347
METRIC RANK
20.2%
3 OR MORE VEHICLES IN HOUSEHOLD
87.8/ 100
METRIC RATING
132nd/ 347
METRIC RANK
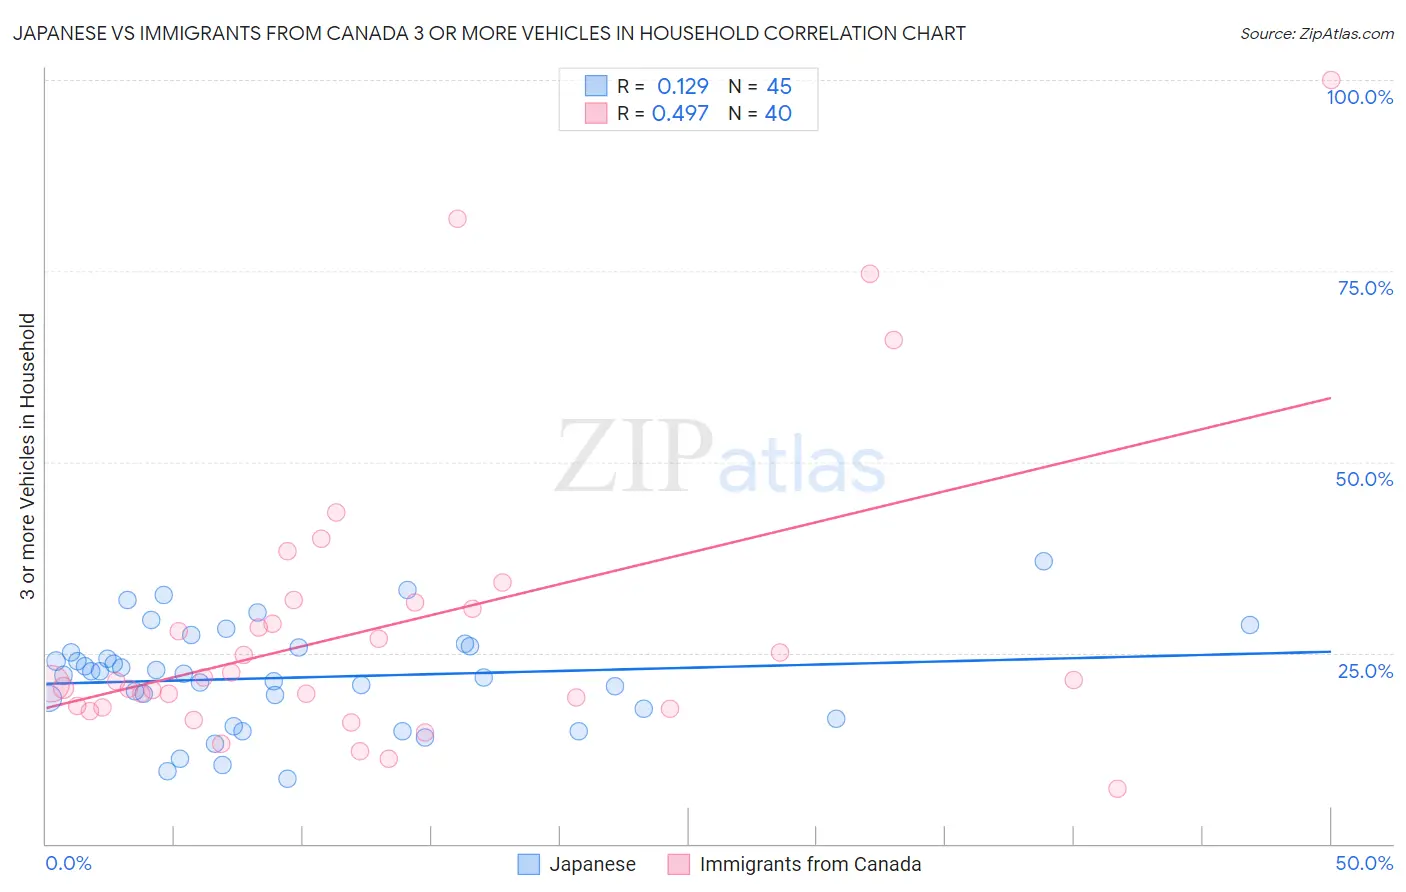
Japanese vs Immigrants from Canada 3 or more Vehicles in Household Correlation Chart
The statistical analysis conducted on geographies consisting of 249,016,700 people shows a poor positive correlation between the proportion of Japanese and percentage of households with 3 or more vehicles available in the United States with a correlation coefficient (R) of 0.129 and weighted average of 21.8%. Similarly, the statistical analysis conducted on geographies consisting of 458,971,200 people shows a moderate positive correlation between the proportion of Immigrants from Canada and percentage of households with 3 or more vehicles available in the United States with a correlation coefficient (R) of 0.497 and weighted average of 20.2%, a difference of 7.7%.
3 or more Vehicles in Household Correlation Summary
| Measurement | Japanese | Immigrants from Canada |
| Minimum | 8.6% | 7.1% |
| Maximum | 37.0% | 100.0% |
| Range | 28.5% | 92.9% |
| Mean | 21.8% | 28.6% |
| Median | 22.3% | 21.4% |
| Interquartile 25% (IQ1) | 17.0% | 18.0% |
| Interquartile 75% (IQ3) | 25.8% | 31.1% |
| Interquartile Range (IQR) | 8.8% | 13.1% |
| Standard Deviation (Sample) | 6.5% | 19.6% |
| Standard Deviation (Population) | 6.5% | 19.4% |
Similar Demographics by 3 or more Vehicles in Household
Demographics Similar to Japanese by 3 or more Vehicles in Household
In terms of 3 or more vehicles in household, the demographic groups most similar to Japanese are Nonimmigrants (21.8%, a difference of 0.040%), Immigrants from Oceania (21.8%, a difference of 0.10%), Salvadoran (21.8%, a difference of 0.12%), Irish (21.8%, a difference of 0.12%), and Portuguese (21.8%, a difference of 0.21%).
| Demographics | Rating | Rank | 3 or more Vehicles in Household |
| British | 99.9 /100 | #68 | Exceptional 21.9% |
| Creek | 99.9 /100 | #69 | Exceptional 21.9% |
| Bangladeshis | 99.8 /100 | #70 | Exceptional 21.9% |
| Potawatomi | 99.8 /100 | #71 | Exceptional 21.9% |
| Portuguese | 99.8 /100 | #72 | Exceptional 21.8% |
| Salvadorans | 99.8 /100 | #73 | Exceptional 21.8% |
| Immigrants | Oceania | 99.8 /100 | #74 | Exceptional 21.8% |
| Japanese | 99.8 /100 | #75 | Exceptional 21.8% |
| Immigrants | Nonimmigrants | 99.8 /100 | #76 | Exceptional 21.8% |
| Irish | 99.8 /100 | #77 | Exceptional 21.8% |
| Czechoslovakians | 99.8 /100 | #78 | Exceptional 21.7% |
| Assyrians/Chaldeans/Syriacs | 99.8 /100 | #79 | Exceptional 21.7% |
| Afghans | 99.7 /100 | #80 | Exceptional 21.7% |
| Celtics | 99.7 /100 | #81 | Exceptional 21.7% |
| Immigrants | El Salvador | 99.6 /100 | #82 | Exceptional 21.5% |
Demographics Similar to Immigrants from Canada by 3 or more Vehicles in Household
In terms of 3 or more vehicles in household, the demographic groups most similar to Immigrants from Canada are Immigrants from North America (20.2%, a difference of 0.0%), Immigrants from Asia (20.2%, a difference of 0.050%), Polish (20.2%, a difference of 0.090%), Immigrants from India (20.2%, a difference of 0.11%), and Immigrants from Nicaragua (20.2%, a difference of 0.12%).
| Demographics | Rating | Rank | 3 or more Vehicles in Household |
| Immigrants | Netherlands | 92.9 /100 | #125 | Exceptional 20.4% |
| Slavs | 92.1 /100 | #126 | Exceptional 20.4% |
| Immigrants | Bolivia | 92.0 /100 | #127 | Exceptional 20.4% |
| New Zealanders | 91.3 /100 | #128 | Exceptional 20.4% |
| Zimbabweans | 88.7 /100 | #129 | Excellent 20.3% |
| Greeks | 88.6 /100 | #130 | Excellent 20.3% |
| Immigrants | Asia | 88.1 /100 | #131 | Excellent 20.2% |
| Immigrants | Canada | 87.8 /100 | #132 | Excellent 20.2% |
| Immigrants | North America | 87.8 /100 | #133 | Excellent 20.2% |
| Poles | 87.3 /100 | #134 | Excellent 20.2% |
| Immigrants | India | 87.2 /100 | #135 | Excellent 20.2% |
| Immigrants | Nicaragua | 87.1 /100 | #136 | Excellent 20.2% |
| Immigrants | Iraq | 87.1 /100 | #137 | Excellent 20.2% |
| Aleuts | 86.3 /100 | #138 | Excellent 20.2% |
| Slovenes | 85.5 /100 | #139 | Excellent 20.2% |