Immigrants from Zimbabwe vs Immigrants from Portugal 3 or more Vehicles in Household
COMPARE
Immigrants from Zimbabwe
Immigrants from Portugal
3 or more Vehicles in Household
3 or more Vehicles in Household Comparison
Immigrants from Zimbabwe
Immigrants from Portugal
19.1%
3 OR MORE VEHICLES IN HOUSEHOLD
25.5/ 100
METRIC RATING
190th/ 347
METRIC RANK
18.6%
3 OR MORE VEHICLES IN HOUSEHOLD
8.9/ 100
METRIC RATING
218th/ 347
METRIC RANK
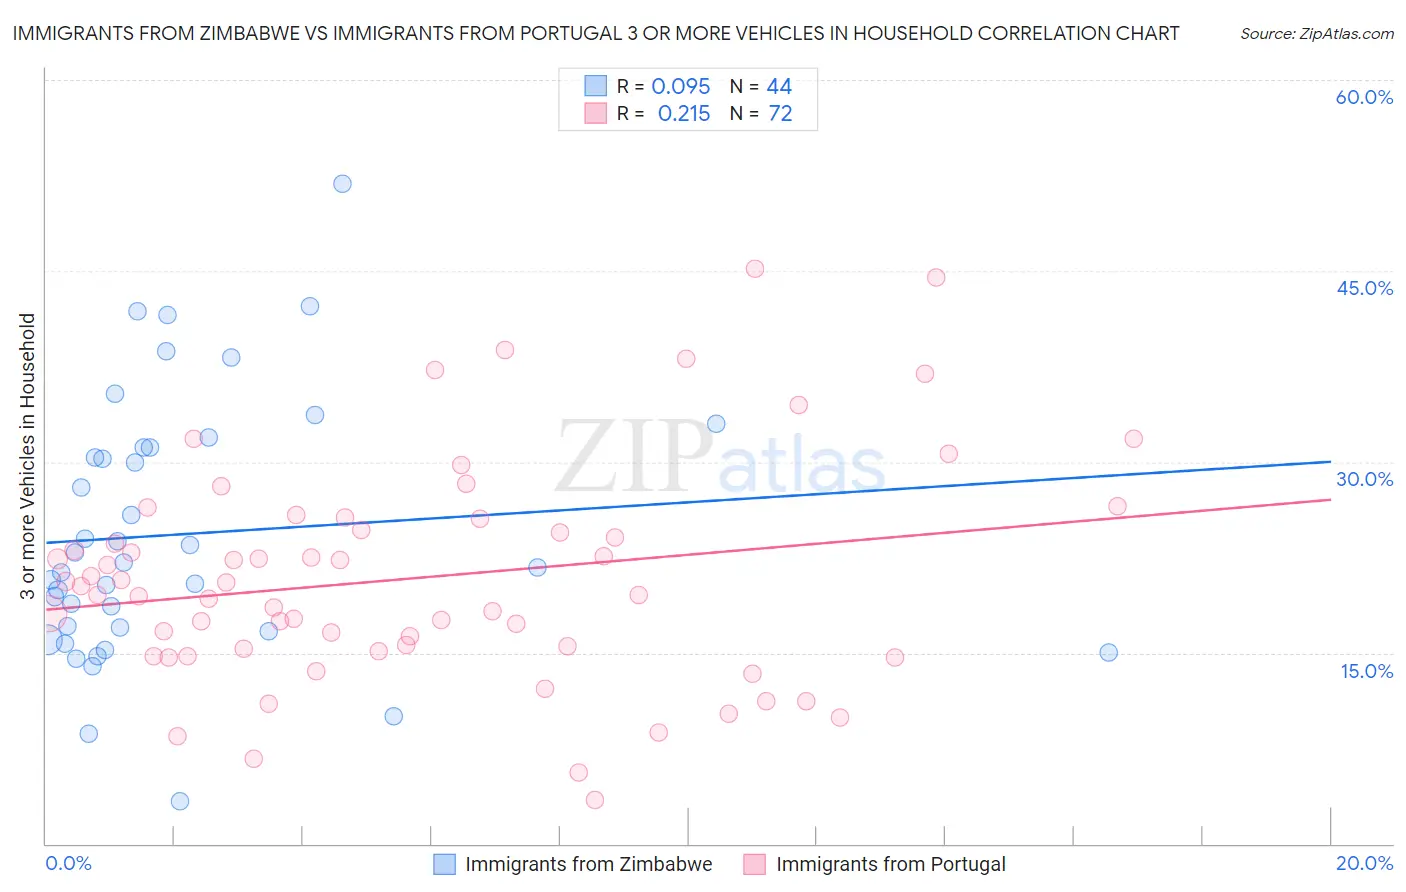
Immigrants from Zimbabwe vs Immigrants from Portugal 3 or more Vehicles in Household Correlation Chart
The statistical analysis conducted on geographies consisting of 117,785,307 people shows a slight positive correlation between the proportion of Immigrants from Zimbabwe and percentage of households with 3 or more vehicles available in the United States with a correlation coefficient (R) of 0.095 and weighted average of 19.1%. Similarly, the statistical analysis conducted on geographies consisting of 174,744,003 people shows a weak positive correlation between the proportion of Immigrants from Portugal and percentage of households with 3 or more vehicles available in the United States with a correlation coefficient (R) of 0.215 and weighted average of 18.6%, a difference of 2.5%.
3 or more Vehicles in Household Correlation Summary
| Measurement | Immigrants from Zimbabwe | Immigrants from Portugal |
| Minimum | 3.3% | 3.4% |
| Maximum | 51.9% | 45.2% |
| Range | 48.5% | 41.7% |
| Mean | 24.3% | 20.9% |
| Median | 21.9% | 19.9% |
| Interquartile 25% (IQ1) | 16.8% | 15.2% |
| Interquartile 75% (IQ3) | 31.1% | 25.1% |
| Interquartile Range (IQR) | 14.3% | 9.9% |
| Standard Deviation (Sample) | 10.2% | 8.7% |
| Standard Deviation (Population) | 10.1% | 8.6% |
Similar Demographics by 3 or more Vehicles in Household
Demographics Similar to Immigrants from Zimbabwe by 3 or more Vehicles in Household
In terms of 3 or more vehicles in household, the demographic groups most similar to Immigrants from Zimbabwe are South American Indian (19.1%, a difference of 0.010%), Indian (Asian) (19.1%, a difference of 0.050%), Immigrants from Kuwait (19.1%, a difference of 0.060%), Kenyan (19.1%, a difference of 0.080%), and Tsimshian (19.1%, a difference of 0.11%).
| Demographics | Rating | Rank | 3 or more Vehicles in Household |
| Cajuns | 36.0 /100 | #183 | Fair 19.3% |
| Latvians | 35.7 /100 | #184 | Fair 19.3% |
| Immigrants | Sri Lanka | 30.7 /100 | #185 | Fair 19.2% |
| Immigrants | Sweden | 29.0 /100 | #186 | Fair 19.2% |
| Immigrants | Hong Kong | 28.3 /100 | #187 | Fair 19.2% |
| Immigrants | Kuwait | 26.1 /100 | #188 | Fair 19.1% |
| Indians (Asian) | 26.0 /100 | #189 | Fair 19.1% |
| Immigrants | Zimbabwe | 25.5 /100 | #190 | Fair 19.1% |
| South American Indians | 25.4 /100 | #191 | Fair 19.1% |
| Kenyans | 24.7 /100 | #192 | Fair 19.1% |
| Tsimshian | 24.4 /100 | #193 | Fair 19.1% |
| Serbians | 24.0 /100 | #194 | Fair 19.1% |
| Immigrants | Moldova | 23.6 /100 | #195 | Fair 19.1% |
| Central American Indians | 22.2 /100 | #196 | Fair 19.0% |
| Immigrants | Japan | 22.0 /100 | #197 | Fair 19.0% |
Demographics Similar to Immigrants from Portugal by 3 or more Vehicles in Household
In terms of 3 or more vehicles in household, the demographic groups most similar to Immigrants from Portugal are Immigrants from Armenia (18.6%, a difference of 0.080%), Nigerian (18.6%, a difference of 0.28%), Immigrants from Italy (18.7%, a difference of 0.29%), Immigrants from Nigeria (18.7%, a difference of 0.31%), and Eastern European (18.7%, a difference of 0.37%).
| Demographics | Rating | Rank | 3 or more Vehicles in Household |
| Immigrants | Kenya | 12.4 /100 | #211 | Poor 18.8% |
| Panamanians | 11.6 /100 | #212 | Poor 18.8% |
| Immigrants | Cuba | 11.6 /100 | #213 | Poor 18.8% |
| Immigrants | Sierra Leone | 10.8 /100 | #214 | Poor 18.7% |
| Eastern Europeans | 10.6 /100 | #215 | Poor 18.7% |
| Immigrants | Nigeria | 10.3 /100 | #216 | Poor 18.7% |
| Immigrants | Italy | 10.2 /100 | #217 | Poor 18.7% |
| Immigrants | Portugal | 8.9 /100 | #218 | Tragic 18.6% |
| Immigrants | Armenia | 8.6 /100 | #219 | Tragic 18.6% |
| Nigerians | 7.9 /100 | #220 | Tragic 18.6% |
| Immigrants | Poland | 7.5 /100 | #221 | Tragic 18.6% |
| Belizeans | 7.3 /100 | #222 | Tragic 18.6% |
| Immigrants | Czechoslovakia | 5.9 /100 | #223 | Tragic 18.5% |
| Immigrants | Argentina | 5.6 /100 | #224 | Tragic 18.5% |
| Immigrants | Lithuania | 5.6 /100 | #225 | Tragic 18.5% |