Immigrants from Zimbabwe vs Immigrants from Eritrea 3 or more Vehicles in Household
COMPARE
Immigrants from Zimbabwe
Immigrants from Eritrea
3 or more Vehicles in Household
3 or more Vehicles in Household Comparison
Immigrants from Zimbabwe
Immigrants from Eritrea
19.1%
3 OR MORE VEHICLES IN HOUSEHOLD
25.5/ 100
METRIC RATING
190th/ 347
METRIC RANK
17.8%
3 OR MORE VEHICLES IN HOUSEHOLD
1.1/ 100
METRIC RATING
257th/ 347
METRIC RANK
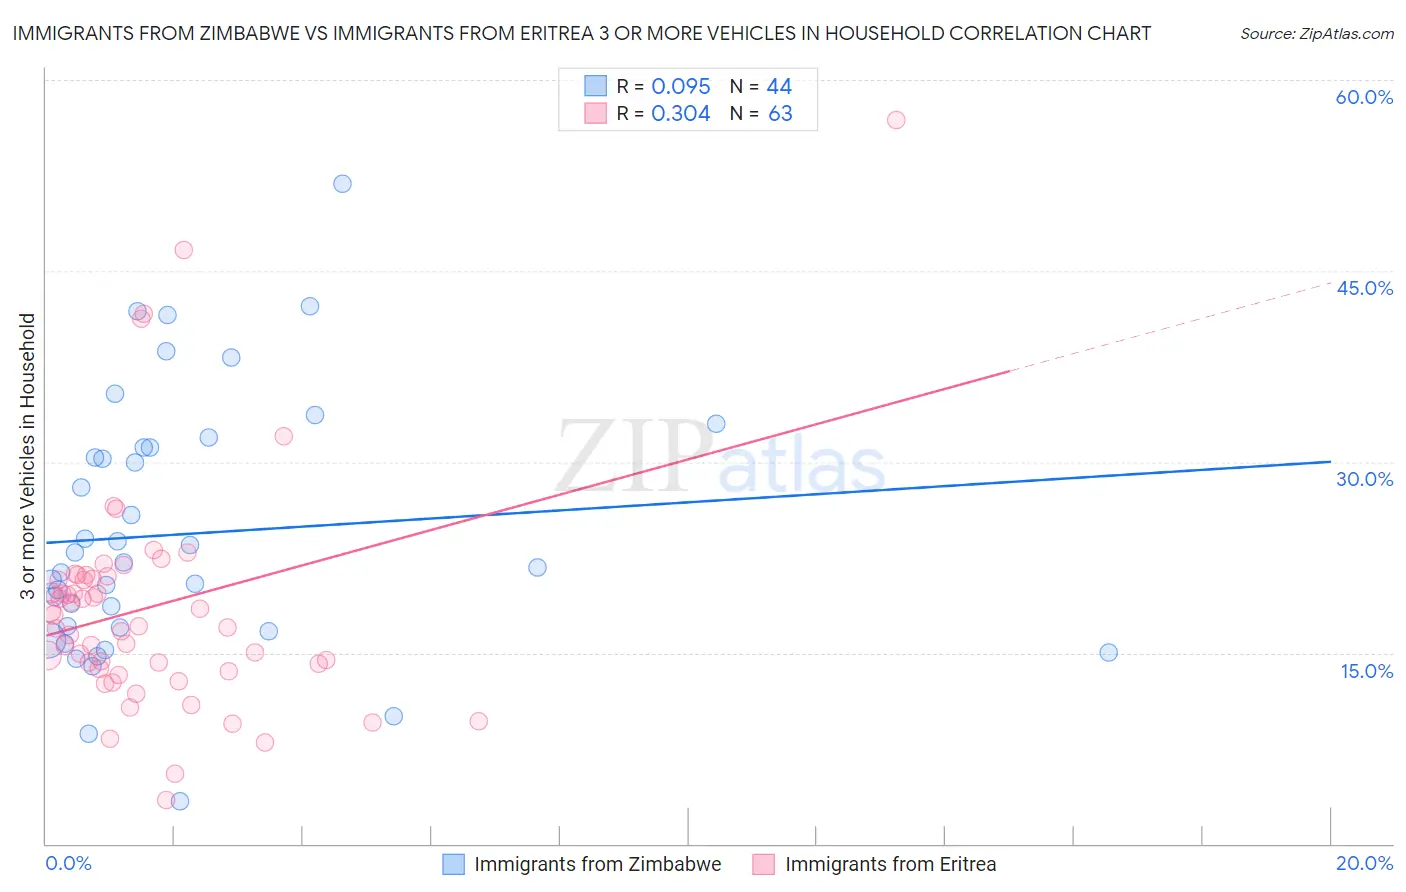
Immigrants from Zimbabwe vs Immigrants from Eritrea 3 or more Vehicles in Household Correlation Chart
The statistical analysis conducted on geographies consisting of 117,785,307 people shows a slight positive correlation between the proportion of Immigrants from Zimbabwe and percentage of households with 3 or more vehicles available in the United States with a correlation coefficient (R) of 0.095 and weighted average of 19.1%. Similarly, the statistical analysis conducted on geographies consisting of 104,844,595 people shows a mild positive correlation between the proportion of Immigrants from Eritrea and percentage of households with 3 or more vehicles available in the United States with a correlation coefficient (R) of 0.304 and weighted average of 17.8%, a difference of 7.0%.
3 or more Vehicles in Household Correlation Summary
| Measurement | Immigrants from Zimbabwe | Immigrants from Eritrea |
| Minimum | 3.3% | 3.4% |
| Maximum | 51.9% | 56.8% |
| Range | 48.5% | 53.4% |
| Mean | 24.3% | 18.6% |
| Median | 21.9% | 17.0% |
| Interquartile 25% (IQ1) | 16.8% | 13.8% |
| Interquartile 75% (IQ3) | 31.1% | 21.0% |
| Interquartile Range (IQR) | 14.3% | 7.2% |
| Standard Deviation (Sample) | 10.2% | 9.1% |
| Standard Deviation (Population) | 10.1% | 9.0% |
Similar Demographics by 3 or more Vehicles in Household
Demographics Similar to Immigrants from Zimbabwe by 3 or more Vehicles in Household
In terms of 3 or more vehicles in household, the demographic groups most similar to Immigrants from Zimbabwe are South American Indian (19.1%, a difference of 0.010%), Indian (Asian) (19.1%, a difference of 0.050%), Immigrants from Kuwait (19.1%, a difference of 0.060%), Kenyan (19.1%, a difference of 0.080%), and Tsimshian (19.1%, a difference of 0.11%).
| Demographics | Rating | Rank | 3 or more Vehicles in Household |
| Cajuns | 36.0 /100 | #183 | Fair 19.3% |
| Latvians | 35.7 /100 | #184 | Fair 19.3% |
| Immigrants | Sri Lanka | 30.7 /100 | #185 | Fair 19.2% |
| Immigrants | Sweden | 29.0 /100 | #186 | Fair 19.2% |
| Immigrants | Hong Kong | 28.3 /100 | #187 | Fair 19.2% |
| Immigrants | Kuwait | 26.1 /100 | #188 | Fair 19.1% |
| Indians (Asian) | 26.0 /100 | #189 | Fair 19.1% |
| Immigrants | Zimbabwe | 25.5 /100 | #190 | Fair 19.1% |
| South American Indians | 25.4 /100 | #191 | Fair 19.1% |
| Kenyans | 24.7 /100 | #192 | Fair 19.1% |
| Tsimshian | 24.4 /100 | #193 | Fair 19.1% |
| Serbians | 24.0 /100 | #194 | Fair 19.1% |
| Immigrants | Moldova | 23.6 /100 | #195 | Fair 19.1% |
| Central American Indians | 22.2 /100 | #196 | Fair 19.0% |
| Immigrants | Japan | 22.0 /100 | #197 | Fair 19.0% |
Demographics Similar to Immigrants from Eritrea by 3 or more Vehicles in Household
In terms of 3 or more vehicles in household, the demographic groups most similar to Immigrants from Eritrea are Sudanese (17.8%, a difference of 0.0%), Subsaharan African (17.9%, a difference of 0.050%), Immigrants from Turkey (17.9%, a difference of 0.20%), Uruguayan (17.8%, a difference of 0.22%), and Immigrants from Ethiopia (17.9%, a difference of 0.23%).
| Demographics | Rating | Rank | 3 or more Vehicles in Household |
| Venezuelans | 1.7 /100 | #250 | Tragic 18.0% |
| Alsatians | 1.5 /100 | #251 | Tragic 18.0% |
| Immigrants | Southern Europe | 1.4 /100 | #252 | Tragic 17.9% |
| Immigrants | Ethiopia | 1.3 /100 | #253 | Tragic 17.9% |
| Ethiopians | 1.2 /100 | #254 | Tragic 17.9% |
| Immigrants | Turkey | 1.2 /100 | #255 | Tragic 17.9% |
| Sub-Saharan Africans | 1.1 /100 | #256 | Tragic 17.9% |
| Immigrants | Eritrea | 1.1 /100 | #257 | Tragic 17.8% |
| Sudanese | 1.1 /100 | #258 | Tragic 17.8% |
| Uruguayans | 1.0 /100 | #259 | Tragic 17.8% |
| Ugandans | 0.9 /100 | #260 | Tragic 17.8% |
| Immigrants | Northern Africa | 0.9 /100 | #261 | Tragic 17.8% |
| Colombians | 0.9 /100 | #262 | Tragic 17.8% |
| Bermudans | 0.9 /100 | #263 | Tragic 17.8% |
| Cambodians | 0.9 /100 | #264 | Tragic 17.8% |