Immigrants from Zimbabwe vs Cypriot 3 or more Vehicles in Household
COMPARE
Immigrants from Zimbabwe
Cypriot
3 or more Vehicles in Household
3 or more Vehicles in Household Comparison
Immigrants from Zimbabwe
Cypriots
19.1%
3 OR MORE VEHICLES IN HOUSEHOLD
25.5/ 100
METRIC RATING
190th/ 347
METRIC RANK
16.6%
3 OR MORE VEHICLES IN HOUSEHOLD
0.0/ 100
METRIC RATING
300th/ 347
METRIC RANK
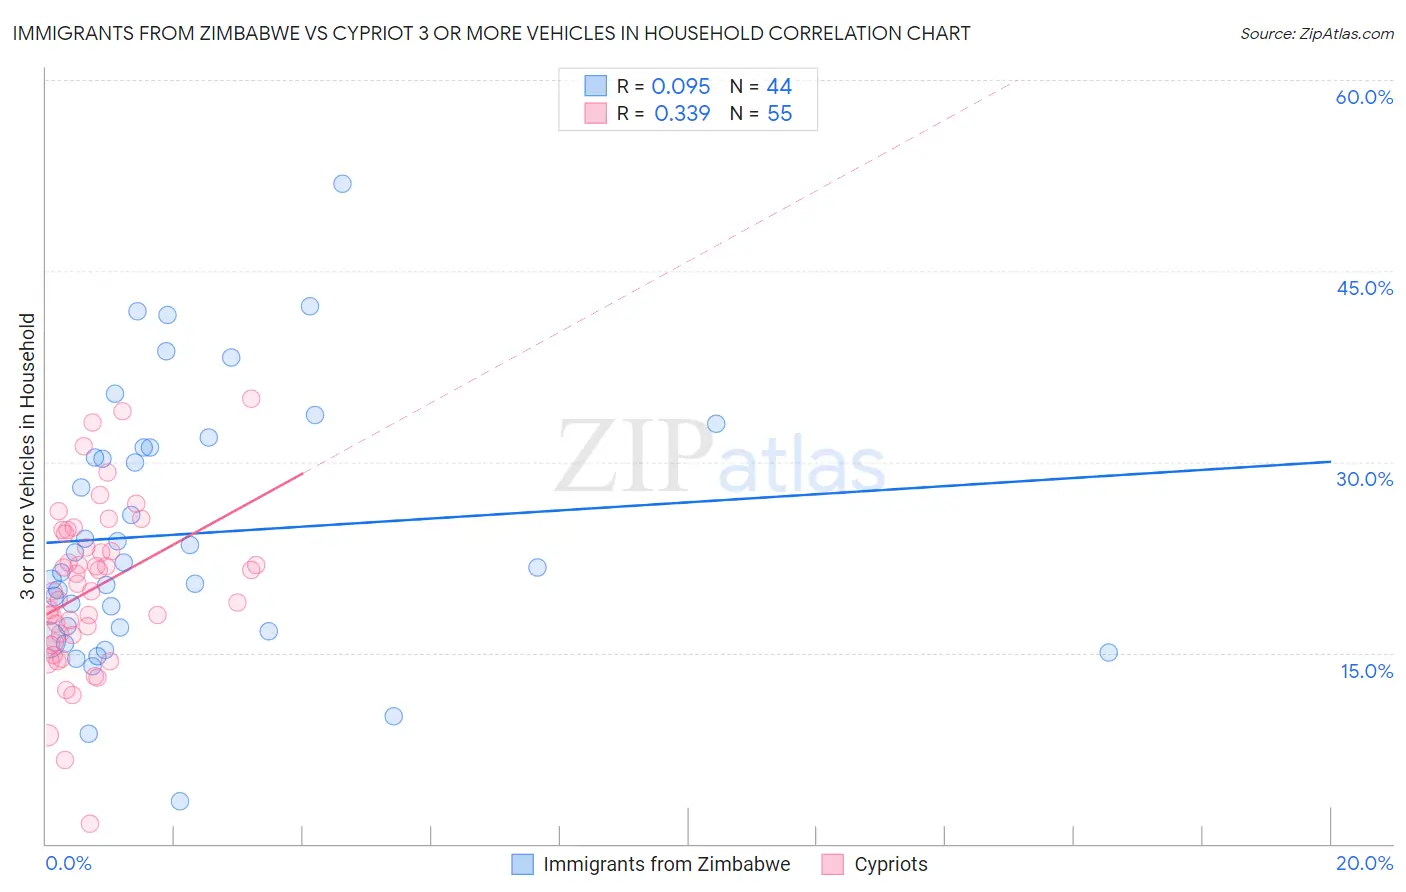
Immigrants from Zimbabwe vs Cypriot 3 or more Vehicles in Household Correlation Chart
The statistical analysis conducted on geographies consisting of 117,785,307 people shows a slight positive correlation between the proportion of Immigrants from Zimbabwe and percentage of households with 3 or more vehicles available in the United States with a correlation coefficient (R) of 0.095 and weighted average of 19.1%. Similarly, the statistical analysis conducted on geographies consisting of 61,836,618 people shows a mild positive correlation between the proportion of Cypriots and percentage of households with 3 or more vehicles available in the United States with a correlation coefficient (R) of 0.339 and weighted average of 16.6%, a difference of 14.9%.
3 or more Vehicles in Household Correlation Summary
| Measurement | Immigrants from Zimbabwe | Cypriot |
| Minimum | 3.3% | 1.6% |
| Maximum | 51.9% | 34.9% |
| Range | 48.5% | 33.3% |
| Mean | 24.3% | 20.0% |
| Median | 21.9% | 19.9% |
| Interquartile 25% (IQ1) | 16.8% | 15.8% |
| Interquartile 75% (IQ3) | 31.1% | 24.3% |
| Interquartile Range (IQR) | 14.3% | 8.5% |
| Standard Deviation (Sample) | 10.2% | 6.5% |
| Standard Deviation (Population) | 10.1% | 6.4% |
Similar Demographics by 3 or more Vehicles in Household
Demographics Similar to Immigrants from Zimbabwe by 3 or more Vehicles in Household
In terms of 3 or more vehicles in household, the demographic groups most similar to Immigrants from Zimbabwe are South American Indian (19.1%, a difference of 0.010%), Indian (Asian) (19.1%, a difference of 0.050%), Immigrants from Kuwait (19.1%, a difference of 0.060%), Kenyan (19.1%, a difference of 0.080%), and Tsimshian (19.1%, a difference of 0.11%).
| Demographics | Rating | Rank | 3 or more Vehicles in Household |
| Cajuns | 36.0 /100 | #183 | Fair 19.3% |
| Latvians | 35.7 /100 | #184 | Fair 19.3% |
| Immigrants | Sri Lanka | 30.7 /100 | #185 | Fair 19.2% |
| Immigrants | Sweden | 29.0 /100 | #186 | Fair 19.2% |
| Immigrants | Hong Kong | 28.3 /100 | #187 | Fair 19.2% |
| Immigrants | Kuwait | 26.1 /100 | #188 | Fair 19.1% |
| Indians (Asian) | 26.0 /100 | #189 | Fair 19.1% |
| Immigrants | Zimbabwe | 25.5 /100 | #190 | Fair 19.1% |
| South American Indians | 25.4 /100 | #191 | Fair 19.1% |
| Kenyans | 24.7 /100 | #192 | Fair 19.1% |
| Tsimshian | 24.4 /100 | #193 | Fair 19.1% |
| Serbians | 24.0 /100 | #194 | Fair 19.1% |
| Immigrants | Moldova | 23.6 /100 | #195 | Fair 19.1% |
| Central American Indians | 22.2 /100 | #196 | Fair 19.0% |
| Immigrants | Japan | 22.0 /100 | #197 | Fair 19.0% |
Demographics Similar to Cypriots by 3 or more Vehicles in Household
In terms of 3 or more vehicles in household, the demographic groups most similar to Cypriots are Paraguayan (16.6%, a difference of 0.41%), Immigrants from South America (16.7%, a difference of 0.48%), Immigrants from Zaire (16.7%, a difference of 0.54%), Immigrants from Greece (16.5%, a difference of 0.83%), and Israeli (16.8%, a difference of 0.91%).
| Demographics | Rating | Rank | 3 or more Vehicles in Household |
| Bahamians | 0.1 /100 | #293 | Tragic 16.9% |
| Immigrants | Western Africa | 0.1 /100 | #294 | Tragic 16.9% |
| Immigrants | Russia | 0.1 /100 | #295 | Tragic 16.9% |
| Inupiat | 0.1 /100 | #296 | Tragic 16.9% |
| Israelis | 0.1 /100 | #297 | Tragic 16.8% |
| Immigrants | Zaire | 0.1 /100 | #298 | Tragic 16.7% |
| Immigrants | South America | 0.1 /100 | #299 | Tragic 16.7% |
| Cypriots | 0.0 /100 | #300 | Tragic 16.6% |
| Paraguayans | 0.0 /100 | #301 | Tragic 16.6% |
| Immigrants | Greece | 0.0 /100 | #302 | Tragic 16.5% |
| Immigrants | Serbia | 0.0 /100 | #303 | Tragic 16.4% |
| Ghanaians | 0.0 /100 | #304 | Tragic 16.4% |
| Immigrants | Morocco | 0.0 /100 | #305 | Tragic 16.3% |
| Somalis | 0.0 /100 | #306 | Tragic 16.2% |
| Immigrants | Ghana | 0.0 /100 | #307 | Tragic 16.2% |