Immigrants from Zimbabwe vs Immigrants from Denmark 3 or more Vehicles in Household
COMPARE
Immigrants from Zimbabwe
Immigrants from Denmark
3 or more Vehicles in Household
3 or more Vehicles in Household Comparison
Immigrants from Zimbabwe
Immigrants from Denmark
19.1%
3 OR MORE VEHICLES IN HOUSEHOLD
25.5/ 100
METRIC RATING
190th/ 347
METRIC RANK
19.6%
3 OR MORE VEHICLES IN HOUSEHOLD
57.6/ 100
METRIC RATING
169th/ 347
METRIC RANK
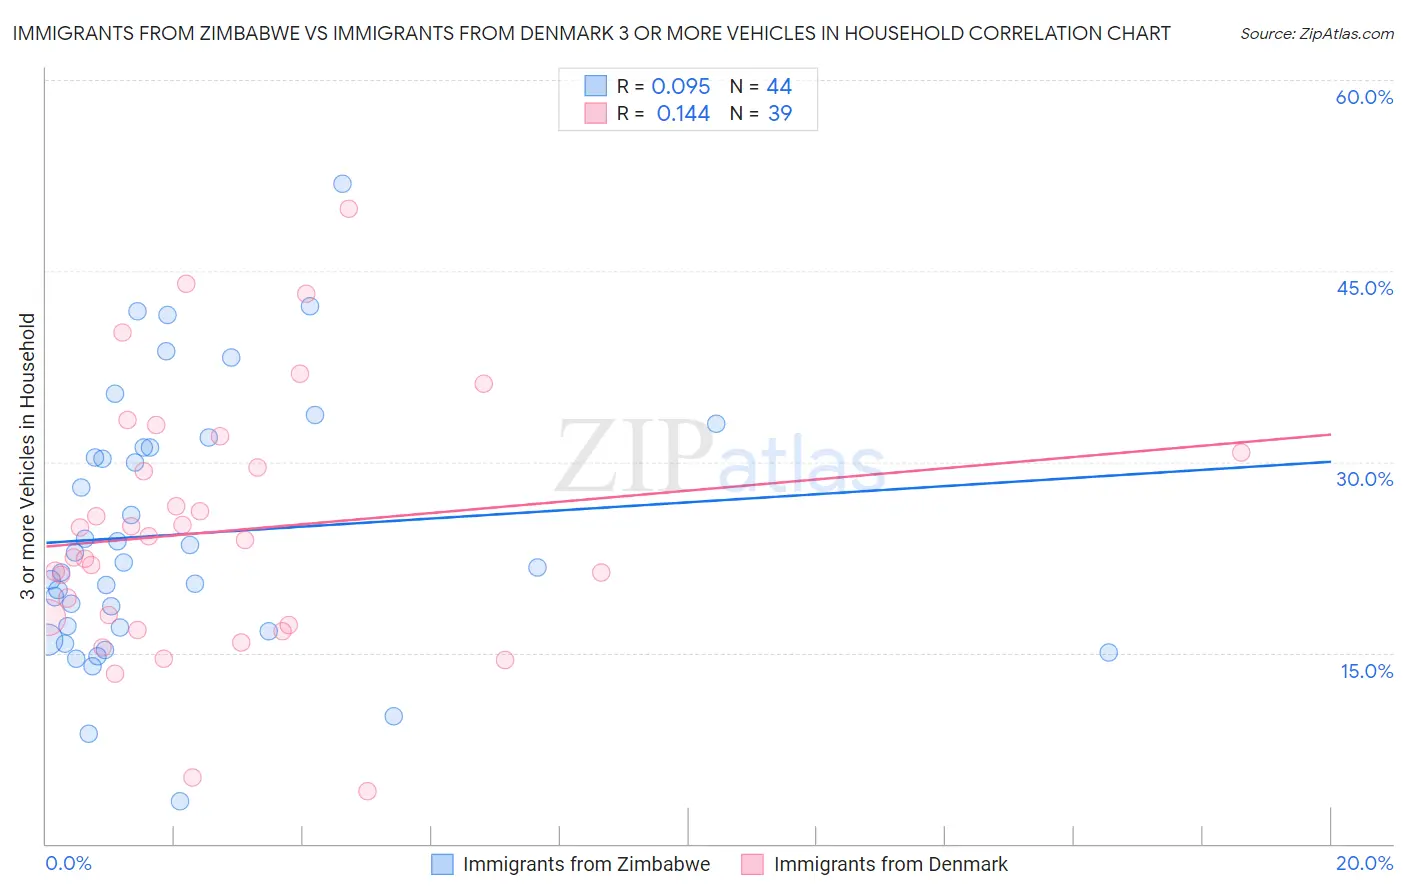
Immigrants from Zimbabwe vs Immigrants from Denmark 3 or more Vehicles in Household Correlation Chart
The statistical analysis conducted on geographies consisting of 117,785,307 people shows a slight positive correlation between the proportion of Immigrants from Zimbabwe and percentage of households with 3 or more vehicles available in the United States with a correlation coefficient (R) of 0.095 and weighted average of 19.1%. Similarly, the statistical analysis conducted on geographies consisting of 136,395,357 people shows a poor positive correlation between the proportion of Immigrants from Denmark and percentage of households with 3 or more vehicles available in the United States with a correlation coefficient (R) of 0.144 and weighted average of 19.6%, a difference of 2.7%.
3 or more Vehicles in Household Correlation Summary
| Measurement | Immigrants from Zimbabwe | Immigrants from Denmark |
| Minimum | 3.3% | 4.2% |
| Maximum | 51.9% | 49.9% |
| Range | 48.5% | 45.7% |
| Mean | 24.3% | 24.6% |
| Median | 21.9% | 23.8% |
| Interquartile 25% (IQ1) | 16.8% | 17.2% |
| Interquartile 75% (IQ3) | 31.1% | 30.8% |
| Interquartile Range (IQR) | 14.3% | 13.5% |
| Standard Deviation (Sample) | 10.2% | 10.0% |
| Standard Deviation (Population) | 10.1% | 9.9% |
Similar Demographics by 3 or more Vehicles in Household
Demographics Similar to Immigrants from Zimbabwe by 3 or more Vehicles in Household
In terms of 3 or more vehicles in household, the demographic groups most similar to Immigrants from Zimbabwe are South American Indian (19.1%, a difference of 0.010%), Indian (Asian) (19.1%, a difference of 0.050%), Immigrants from Kuwait (19.1%, a difference of 0.060%), Kenyan (19.1%, a difference of 0.080%), and Tsimshian (19.1%, a difference of 0.11%).
| Demographics | Rating | Rank | 3 or more Vehicles in Household |
| Cajuns | 36.0 /100 | #183 | Fair 19.3% |
| Latvians | 35.7 /100 | #184 | Fair 19.3% |
| Immigrants | Sri Lanka | 30.7 /100 | #185 | Fair 19.2% |
| Immigrants | Sweden | 29.0 /100 | #186 | Fair 19.2% |
| Immigrants | Hong Kong | 28.3 /100 | #187 | Fair 19.2% |
| Immigrants | Kuwait | 26.1 /100 | #188 | Fair 19.1% |
| Indians (Asian) | 26.0 /100 | #189 | Fair 19.1% |
| Immigrants | Zimbabwe | 25.5 /100 | #190 | Fair 19.1% |
| South American Indians | 25.4 /100 | #191 | Fair 19.1% |
| Kenyans | 24.7 /100 | #192 | Fair 19.1% |
| Tsimshian | 24.4 /100 | #193 | Fair 19.1% |
| Serbians | 24.0 /100 | #194 | Fair 19.1% |
| Immigrants | Moldova | 23.6 /100 | #195 | Fair 19.1% |
| Central American Indians | 22.2 /100 | #196 | Fair 19.0% |
| Immigrants | Japan | 22.0 /100 | #197 | Fair 19.0% |
Demographics Similar to Immigrants from Denmark by 3 or more Vehicles in Household
In terms of 3 or more vehicles in household, the demographic groups most similar to Immigrants from Denmark are Peruvian (19.6%, a difference of 0.090%), Ukrainian (19.6%, a difference of 0.10%), Iraqi (19.6%, a difference of 0.13%), Immigrants from Cameroon (19.7%, a difference of 0.25%), and Immigrants from Costa Rica (19.7%, a difference of 0.33%).
| Demographics | Rating | Rank | 3 or more Vehicles in Household |
| Estonians | 63.2 /100 | #162 | Good 19.7% |
| Chileans | 63.0 /100 | #163 | Good 19.7% |
| Yugoslavians | 62.9 /100 | #164 | Good 19.7% |
| Immigrants | Costa Rica | 61.9 /100 | #165 | Good 19.7% |
| Immigrants | Cameroon | 60.9 /100 | #166 | Good 19.7% |
| Ukrainians | 58.9 /100 | #167 | Average 19.6% |
| Peruvians | 58.8 /100 | #168 | Average 19.6% |
| Immigrants | Denmark | 57.6 /100 | #169 | Average 19.6% |
| Iraqis | 56.0 /100 | #170 | Average 19.6% |
| Immigrants | Western Europe | 53.2 /100 | #171 | Average 19.5% |
| Kiowa | 50.9 /100 | #172 | Average 19.5% |
| Immigrants | Northern Europe | 50.2 /100 | #173 | Average 19.5% |
| Immigrants | South Africa | 50.0 /100 | #174 | Average 19.5% |
| Syrians | 47.0 /100 | #175 | Average 19.5% |
| Iroquois | 46.0 /100 | #176 | Average 19.4% |