Burmese vs Immigrants from Japan 3 or more Vehicles in Household
COMPARE
Burmese
Immigrants from Japan
3 or more Vehicles in Household
3 or more Vehicles in Household Comparison
Burmese
Immigrants from Japan
20.6%
3 OR MORE VEHICLES IN HOUSEHOLD
95.8/ 100
METRIC RATING
114th/ 347
METRIC RANK
19.0%
3 OR MORE VEHICLES IN HOUSEHOLD
22.0/ 100
METRIC RATING
197th/ 347
METRIC RANK
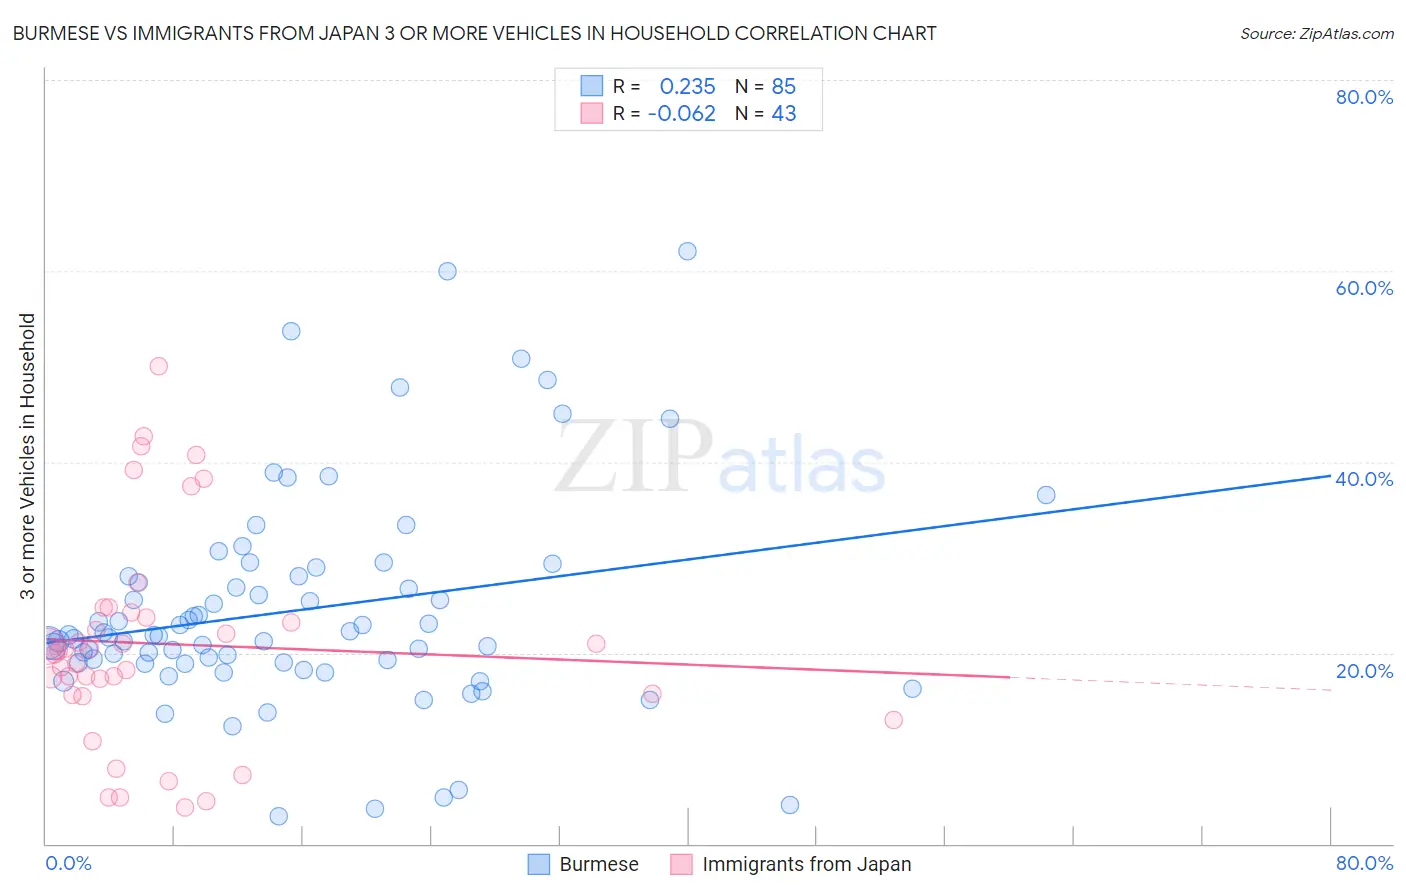
Burmese vs Immigrants from Japan 3 or more Vehicles in Household Correlation Chart
The statistical analysis conducted on geographies consisting of 464,700,639 people shows a weak positive correlation between the proportion of Burmese and percentage of households with 3 or more vehicles available in the United States with a correlation coefficient (R) of 0.235 and weighted average of 20.6%. Similarly, the statistical analysis conducted on geographies consisting of 339,875,755 people shows a slight negative correlation between the proportion of Immigrants from Japan and percentage of households with 3 or more vehicles available in the United States with a correlation coefficient (R) of -0.062 and weighted average of 19.0%, a difference of 8.5%.
3 or more Vehicles in Household Correlation Summary
| Measurement | Burmese | Immigrants from Japan |
| Minimum | 2.8% | 3.8% |
| Maximum | 62.0% | 50.1% |
| Range | 59.2% | 46.3% |
| Mean | 24.5% | 20.9% |
| Median | 21.7% | 20.3% |
| Interquartile 25% (IQ1) | 18.9% | 15.6% |
| Interquartile 75% (IQ3) | 28.0% | 24.2% |
| Interquartile Range (IQR) | 9.1% | 8.6% |
| Standard Deviation (Sample) | 11.4% | 11.0% |
| Standard Deviation (Population) | 11.3% | 10.9% |
Similar Demographics by 3 or more Vehicles in Household
Demographics Similar to Burmese by 3 or more Vehicles in Household
In terms of 3 or more vehicles in household, the demographic groups most similar to Burmese are Immigrants from England (20.7%, a difference of 0.18%), Nicaraguan (20.7%, a difference of 0.19%), French Canadian (20.6%, a difference of 0.31%), Italian (20.6%, a difference of 0.34%), and Croatian (20.6%, a difference of 0.36%).
| Demographics | Rating | Rank | 3 or more Vehicles in Household |
| Immigrants | Germany | 97.4 /100 | #107 | Exceptional 20.8% |
| Immigrants | Scotland | 97.1 /100 | #108 | Exceptional 20.8% |
| Filipinos | 97.0 /100 | #109 | Exceptional 20.8% |
| Asians | 96.8 /100 | #110 | Exceptional 20.8% |
| Immigrants | Micronesia | 96.7 /100 | #111 | Exceptional 20.7% |
| Nicaraguans | 96.2 /100 | #112 | Exceptional 20.7% |
| Immigrants | England | 96.2 /100 | #113 | Exceptional 20.7% |
| Burmese | 95.8 /100 | #114 | Exceptional 20.6% |
| French Canadians | 95.0 /100 | #115 | Exceptional 20.6% |
| Italians | 94.9 /100 | #116 | Exceptional 20.6% |
| Croatians | 94.9 /100 | #117 | Exceptional 20.6% |
| Costa Ricans | 94.6 /100 | #118 | Exceptional 20.6% |
| Immigrants | Latin America | 94.5 /100 | #119 | Exceptional 20.5% |
| Maltese | 93.9 /100 | #120 | Exceptional 20.5% |
| Immigrants | Thailand | 93.8 /100 | #121 | Exceptional 20.5% |
Demographics Similar to Immigrants from Japan by 3 or more Vehicles in Household
In terms of 3 or more vehicles in household, the demographic groups most similar to Immigrants from Japan are Central American Indian (19.0%, a difference of 0.030%), Immigrants from Moldova (19.1%, a difference of 0.18%), Serbian (19.1%, a difference of 0.22%), Tsimshian (19.1%, a difference of 0.26%), and Kenyan (19.1%, a difference of 0.30%).
| Demographics | Rating | Rank | 3 or more Vehicles in Household |
| Immigrants | Zimbabwe | 25.5 /100 | #190 | Fair 19.1% |
| South American Indians | 25.4 /100 | #191 | Fair 19.1% |
| Kenyans | 24.7 /100 | #192 | Fair 19.1% |
| Tsimshian | 24.4 /100 | #193 | Fair 19.1% |
| Serbians | 24.0 /100 | #194 | Fair 19.1% |
| Immigrants | Moldova | 23.6 /100 | #195 | Fair 19.1% |
| Central American Indians | 22.2 /100 | #196 | Fair 19.0% |
| Immigrants | Japan | 22.0 /100 | #197 | Fair 19.0% |
| Egyptians | 19.5 /100 | #198 | Poor 19.0% |
| Immigrants | Norway | 19.0 /100 | #199 | Poor 19.0% |
| Argentineans | 18.2 /100 | #200 | Poor 18.9% |
| Arabs | 17.7 /100 | #201 | Poor 18.9% |
| Immigrants | Austria | 15.4 /100 | #202 | Poor 18.9% |
| Tohono O'odham | 14.8 /100 | #203 | Poor 18.9% |
| Immigrants | Romania | 14.6 /100 | #204 | Poor 18.9% |