Burmese vs Aleut 3 or more Vehicles in Household
COMPARE
Burmese
Aleut
3 or more Vehicles in Household
3 or more Vehicles in Household Comparison
Burmese
Aleuts
20.6%
3 OR MORE VEHICLES IN HOUSEHOLD
95.8/ 100
METRIC RATING
114th/ 347
METRIC RANK
20.2%
3 OR MORE VEHICLES IN HOUSEHOLD
86.3/ 100
METRIC RATING
138th/ 347
METRIC RANK
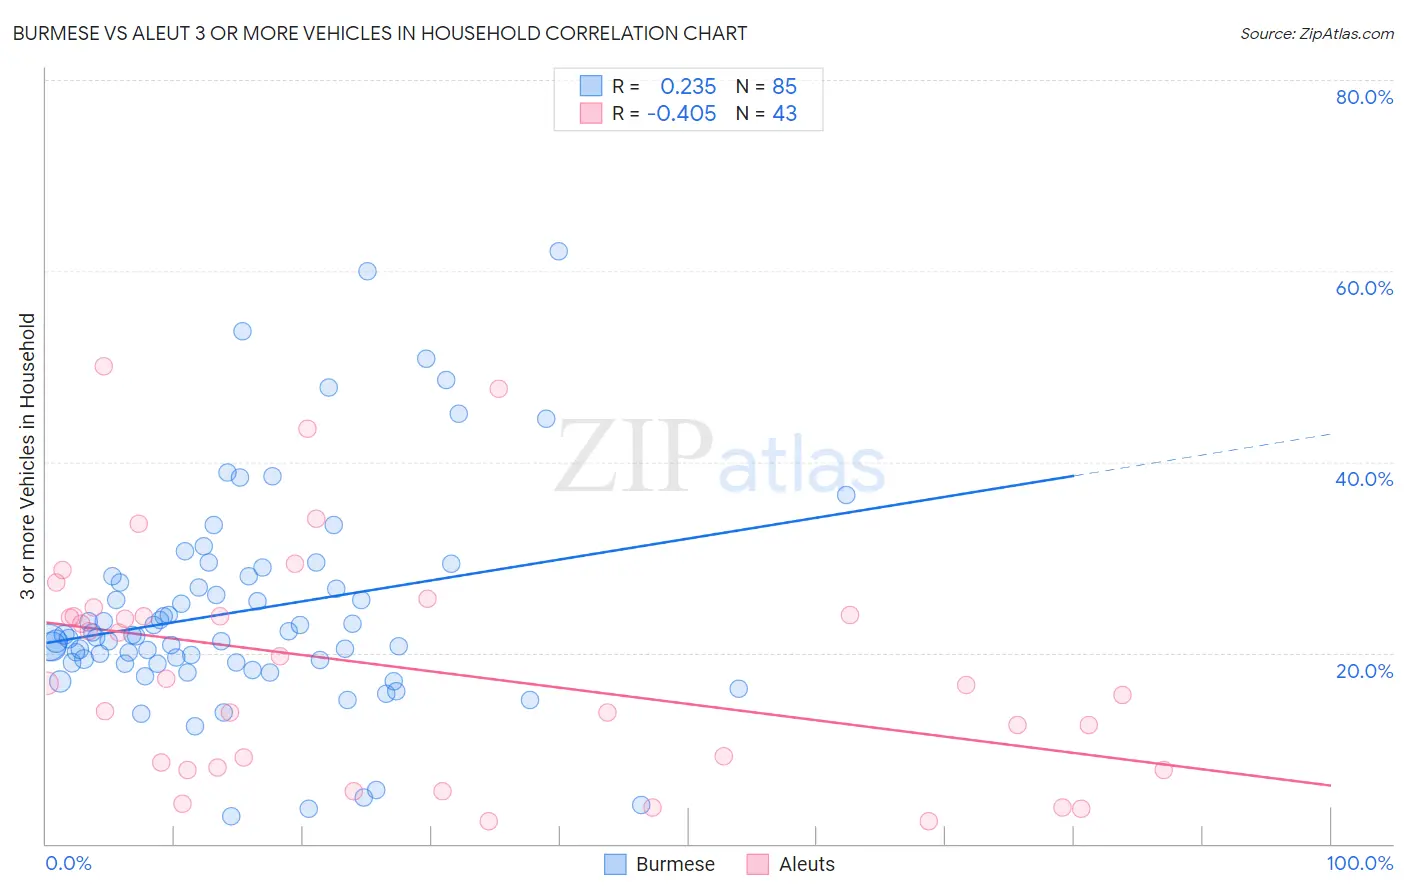
Burmese vs Aleut 3 or more Vehicles in Household Correlation Chart
The statistical analysis conducted on geographies consisting of 464,700,639 people shows a weak positive correlation between the proportion of Burmese and percentage of households with 3 or more vehicles available in the United States with a correlation coefficient (R) of 0.235 and weighted average of 20.6%. Similarly, the statistical analysis conducted on geographies consisting of 61,759,938 people shows a moderate negative correlation between the proportion of Aleuts and percentage of households with 3 or more vehicles available in the United States with a correlation coefficient (R) of -0.405 and weighted average of 20.2%, a difference of 2.3%.
3 or more Vehicles in Household Correlation Summary
| Measurement | Burmese | Aleut |
| Minimum | 2.8% | 2.3% |
| Maximum | 62.0% | 50.0% |
| Range | 59.2% | 47.7% |
| Mean | 24.5% | 18.3% |
| Median | 21.7% | 16.8% |
| Interquartile 25% (IQ1) | 18.9% | 8.0% |
| Interquartile 75% (IQ3) | 28.0% | 24.0% |
| Interquartile Range (IQR) | 9.1% | 16.0% |
| Standard Deviation (Sample) | 11.4% | 12.0% |
| Standard Deviation (Population) | 11.3% | 11.8% |
Similar Demographics by 3 or more Vehicles in Household
Demographics Similar to Burmese by 3 or more Vehicles in Household
In terms of 3 or more vehicles in household, the demographic groups most similar to Burmese are Immigrants from England (20.7%, a difference of 0.18%), Nicaraguan (20.7%, a difference of 0.19%), French Canadian (20.6%, a difference of 0.31%), Italian (20.6%, a difference of 0.34%), and Croatian (20.6%, a difference of 0.36%).
| Demographics | Rating | Rank | 3 or more Vehicles in Household |
| Immigrants | Germany | 97.4 /100 | #107 | Exceptional 20.8% |
| Immigrants | Scotland | 97.1 /100 | #108 | Exceptional 20.8% |
| Filipinos | 97.0 /100 | #109 | Exceptional 20.8% |
| Asians | 96.8 /100 | #110 | Exceptional 20.8% |
| Immigrants | Micronesia | 96.7 /100 | #111 | Exceptional 20.7% |
| Nicaraguans | 96.2 /100 | #112 | Exceptional 20.7% |
| Immigrants | England | 96.2 /100 | #113 | Exceptional 20.7% |
| Burmese | 95.8 /100 | #114 | Exceptional 20.6% |
| French Canadians | 95.0 /100 | #115 | Exceptional 20.6% |
| Italians | 94.9 /100 | #116 | Exceptional 20.6% |
| Croatians | 94.9 /100 | #117 | Exceptional 20.6% |
| Costa Ricans | 94.6 /100 | #118 | Exceptional 20.6% |
| Immigrants | Latin America | 94.5 /100 | #119 | Exceptional 20.5% |
| Maltese | 93.9 /100 | #120 | Exceptional 20.5% |
| Immigrants | Thailand | 93.8 /100 | #121 | Exceptional 20.5% |
Demographics Similar to Aleuts by 3 or more Vehicles in Household
In terms of 3 or more vehicles in household, the demographic groups most similar to Aleuts are Immigrants from Nicaragua (20.2%, a difference of 0.12%), Immigrants from Iraq (20.2%, a difference of 0.12%), Slovene (20.2%, a difference of 0.12%), Immigrants from India (20.2%, a difference of 0.13%), and French American Indian (20.1%, a difference of 0.15%).
| Demographics | Rating | Rank | 3 or more Vehicles in Household |
| Immigrants | Asia | 88.1 /100 | #131 | Excellent 20.2% |
| Immigrants | Canada | 87.8 /100 | #132 | Excellent 20.2% |
| Immigrants | North America | 87.8 /100 | #133 | Excellent 20.2% |
| Poles | 87.3 /100 | #134 | Excellent 20.2% |
| Immigrants | India | 87.2 /100 | #135 | Excellent 20.2% |
| Immigrants | Nicaragua | 87.1 /100 | #136 | Excellent 20.2% |
| Immigrants | Iraq | 87.1 /100 | #137 | Excellent 20.2% |
| Aleuts | 86.3 /100 | #138 | Excellent 20.2% |
| Slovenes | 85.5 /100 | #139 | Excellent 20.2% |
| French American Indians | 85.3 /100 | #140 | Excellent 20.1% |
| Ottawa | 84.9 /100 | #141 | Excellent 20.1% |
| Jordanians | 84.4 /100 | #142 | Excellent 20.1% |
| Lithuanians | 84.4 /100 | #143 | Excellent 20.1% |
| Iranians | 84.0 /100 | #144 | Excellent 20.1% |
| Palestinians | 83.9 /100 | #145 | Excellent 20.1% |