British vs Immigrants from Portugal 3 or more Vehicles in Household

COMPARE

British
Race
Ancestry
AfghanAfricanAlaska NativeAlaskan AthabascanAlbanianAleutAlsatianAmericanApacheArabArapahoArgentineanArmenianAssyrian/Chaldean/SyriacAustralianAustrianBahamianBangladeshiBarbadianBasqueBelgianBelizeanBermudanBhutaneseBlackfeetBolivianBrazilianBritishBritish West IndianBulgarianBurmeseCajunCambodianCanadianCape VerdeanCarpatho RusynCelticCentral AmericanCentral American IndianCherokeeCheyenneChickasawChileanChineseChippewaChoctawColombianColvilleComancheCosta RicanCreeCreekCroatianCrowCubanCypriotCzechCzechoslovakianDanishDelawareDominicanDutchDutch West IndianEastern EuropeanEcuadorianEgyptianEnglishEstonianEthiopianEuropeanFijianFilipinoFinnishFrenchFrench American IndianFrench CanadianGermanGerman RussianGhanaianGreekGuamanian/ChamorroGuatemalanGuyaneseHaitianHmongHonduranHopiHoumaHungarianIcelanderIndian (Asian)IndonesianInupiatIranianIraqiIrishIroquoisIsraeliItalianJamaicanJapaneseJordanianKenyanKiowaKoreanLaotianLatvianLebaneseLiberianLithuanianLumbeeLuxembourgerMacedonianMalaysianMalteseMarshalleseMenomineeMexicanMexican American IndianMongolianMoroccanNative HawaiianNavajoNepaleseNew ZealanderNicaraguanNigerianNorthern EuropeanNorwegianOkinawanOsageOttawaPaiutePakistaniPalestinianPanamanianParaguayanPennsylvania GermanPeruvianPimaPolishPortuguesePotawatomiPuebloPuerto RicanPuget Sound SalishRomanianRussianSalvadoranSamoanScandinavianScotch-IrishScottishSeminoleSenegaleseSerbianShoshoneSierra LeoneanSiouxSlavicSlovakSloveneSomaliSouth AfricanSouth AmericanSouth American IndianSoviet UnionSpaniardSpanishSpanish AmericanSpanish American IndianSri LankanSubsaharan AfricanSudaneseSwedishSwissSyrianTaiwaneseThaiTlingit-HaidaTohono O'OdhamTonganTrinidadian and TobagonianTsimshianTurkishU.S. Virgin IslanderUgandanUkrainianUruguayanUteVenezuelanVietnameseWelshWest IndianYakamaYaquiYugoslavianYumanYup'ikZimbabwean
Immigration
NonimmigrantsImmigrantsAfghanistanAfricaAlbaniaArgentinaArmeniaAsiaAustraliaAustriaBahamasBangladeshBarbadosBelarusBelgiumBelizeBoliviaBosnia and HerzegovinaBrazilBulgariaBurma/MyanmarCabo VerdeCambodiaCameroonCanadaCaribbeanCentral AmericaChileChinaColombiaCongoCosta RicaCroatiaCubaCzechoslovakiaDenmarkDominicaDominican RepublicEastern AfricaEastern AsiaEastern EuropeEcuadorEgyptEl SalvadorEnglandEritreaEthiopiaEuropeFijiFranceGermanyGhanaGreeceGrenadaGuatemalaGuyanaHaitiHondurasHong KongHungaryIndiaIndonesiaIranIraqIrelandIsraelItalyJamaicaJapanJordanKazakhstanKenyaKoreaKuwaitLaosLatin AmericaLatviaLebanonLiberiaLithuaniaMalaysiaMexicoMicronesiaMiddle AfricaMoldovaMoroccoNepalNetherlandsNicaraguaNigeriaNorth AmericaNorth MacedoniaNorthern AfricaNorthern EuropeNorwayOceaniaPakistanPanamaPeruPhilippinesPolandRomaniaRussiaSaudi ArabiaScotlandSenegalSerbiaSierra LeoneSingaporeSomaliaSouth AfricaSouth AmericaSouth Central AsiaSouth Eastern AsiaSouthern EuropeSpainSri LankaSt. Vincent and the GrenadinesSudanSwedenSwitzerlandSyriaTaiwanThailandTrinidad and TobagoTurkeyUgandaUkraineUruguayUzbekistanVenezuelaVietnamWest IndiesWestern AfricaWestern AsiaWestern EuropeYemenZaireZimbabweAzores
Immigrants from Portugal
Race
Ancestry
AfghanAfricanAlaska NativeAlaskan AthabascanAlbanianAleutAlsatianAmericanApacheArabArapahoArgentineanArmenianAssyrian/Chaldean/SyriacAustralianAustrianBahamianBangladeshiBarbadianBasqueBelgianBelizeanBermudanBhutaneseBlackfeetBolivianBrazilianBritish West IndianBulgarianBurmeseCajunCambodianCanadianCape VerdeanCarpatho RusynCelticCentral AmericanCentral American IndianCherokeeCheyenneChickasawChileanChineseChippewaChoctawColombianColvilleComancheCosta RicanCreeCreekCroatianCrowCubanCypriotCzechCzechoslovakianDanishDelawareDominicanDutchDutch West IndianEastern EuropeanEcuadorianEgyptianEnglishEstonianEthiopianEuropeanFijianFilipinoFinnishFrenchFrench American IndianFrench CanadianGermanGerman RussianGhanaianGreekGuamanian/ChamorroGuatemalanGuyaneseHaitianHmongHonduranHopiHoumaHungarianIcelanderIndian (Asian)IndonesianInupiatIranianIraqiIrishIroquoisIsraeliItalianJamaicanJapaneseJordanianKenyanKiowaKoreanLaotianLatvianLebaneseLiberianLithuanianLumbeeLuxembourgerMacedonianMalaysianMalteseMarshalleseMenomineeMexicanMexican American IndianMongolianMoroccanNative HawaiianNavajoNepaleseNew ZealanderNicaraguanNigerianNorthern EuropeanNorwegianOkinawanOsageOttawaPaiutePakistaniPalestinianPanamanianParaguayanPennsylvania GermanPeruvianPimaPolishPortuguesePotawatomiPuebloPuerto RicanPuget Sound SalishRomanianRussianSalvadoranSamoanScandinavianScotch-IrishScottishSeminoleSenegaleseSerbianShoshoneSierra LeoneanSiouxSlavicSlovakSloveneSomaliSouth AfricanSouth AmericanSouth American IndianSoviet UnionSpaniardSpanishSpanish AmericanSpanish American IndianSri LankanSubsaharan AfricanSudaneseSwedishSwissSyrianTaiwaneseThaiTlingit-HaidaTohono O'OdhamTonganTrinidadian and TobagonianTsimshianTurkishU.S. Virgin IslanderUgandanUkrainianUruguayanUteVenezuelanVietnameseWelshWest IndianYakamaYaquiYugoslavianYumanYup'ikZimbabwean
Immigration
NonimmigrantsImmigrantsAfghanistanAfricaAlbaniaArgentinaArmeniaAsiaAustraliaAustriaBahamasBangladeshBarbadosBelarusBelgiumBelizeBoliviaBosnia and HerzegovinaBrazilBulgariaBurma/MyanmarCabo VerdeCambodiaCameroonCanadaCaribbeanCentral AmericaChileChinaColombiaCongoCosta RicaCroatiaCubaCzechoslovakiaDenmarkDominicaDominican RepublicEastern AfricaEastern AsiaEastern EuropeEcuadorEgyptEl SalvadorEnglandEritreaEthiopiaEuropeFijiFranceGermanyGhanaGreeceGrenadaGuatemalaGuyanaHaitiHondurasHong KongHungaryIndiaIndonesiaIranIraqIrelandIsraelItalyJamaicaJapanJordanKazakhstanKenyaKoreaKuwaitLaosLatin AmericaLatviaLebanonLiberiaLithuaniaMalaysiaMexicoMicronesiaMiddle AfricaMoldovaMoroccoNepalNetherlandsNicaraguaNigeriaNorth AmericaNorth MacedoniaNorthern AfricaNorthern EuropeNorwayOceaniaPakistanPanamaPeruPhilippinesPolandPortugalRomaniaRussiaSaudi ArabiaScotlandSenegalSerbiaSierra LeoneSingaporeSomaliaSouth AfricaSouth AmericaSouth Central AsiaSouth Eastern AsiaSouthern EuropeSpainSri LankaSt. Vincent and the GrenadinesSudanSwedenSwitzerlandSyriaTaiwanThailandTrinidad and TobagoTurkeyUgandaUkraineUruguayUzbekistanVenezuelaVietnamWest IndiesWestern AfricaWestern AsiaWestern EuropeYemenZaireZimbabweAzores
3 or more Vehicles in Household
Income
Poverty
Unemployment
Labor Participation
Family Structure
Vehicle Availability
Education Level
Disability

3 or more Vehicles in Household Comparison

British

Immigrants from Portugal

Exceptional
Tragic
21.9%
3 OR MORE VEHICLES IN HOUSEHOLD
99.9/ 100
METRIC RATING
68th/ 347
METRIC RANK
18.6%
3 OR MORE VEHICLES IN HOUSEHOLD
8.9/ 100
METRIC RATING
218th/ 347
METRIC RANK

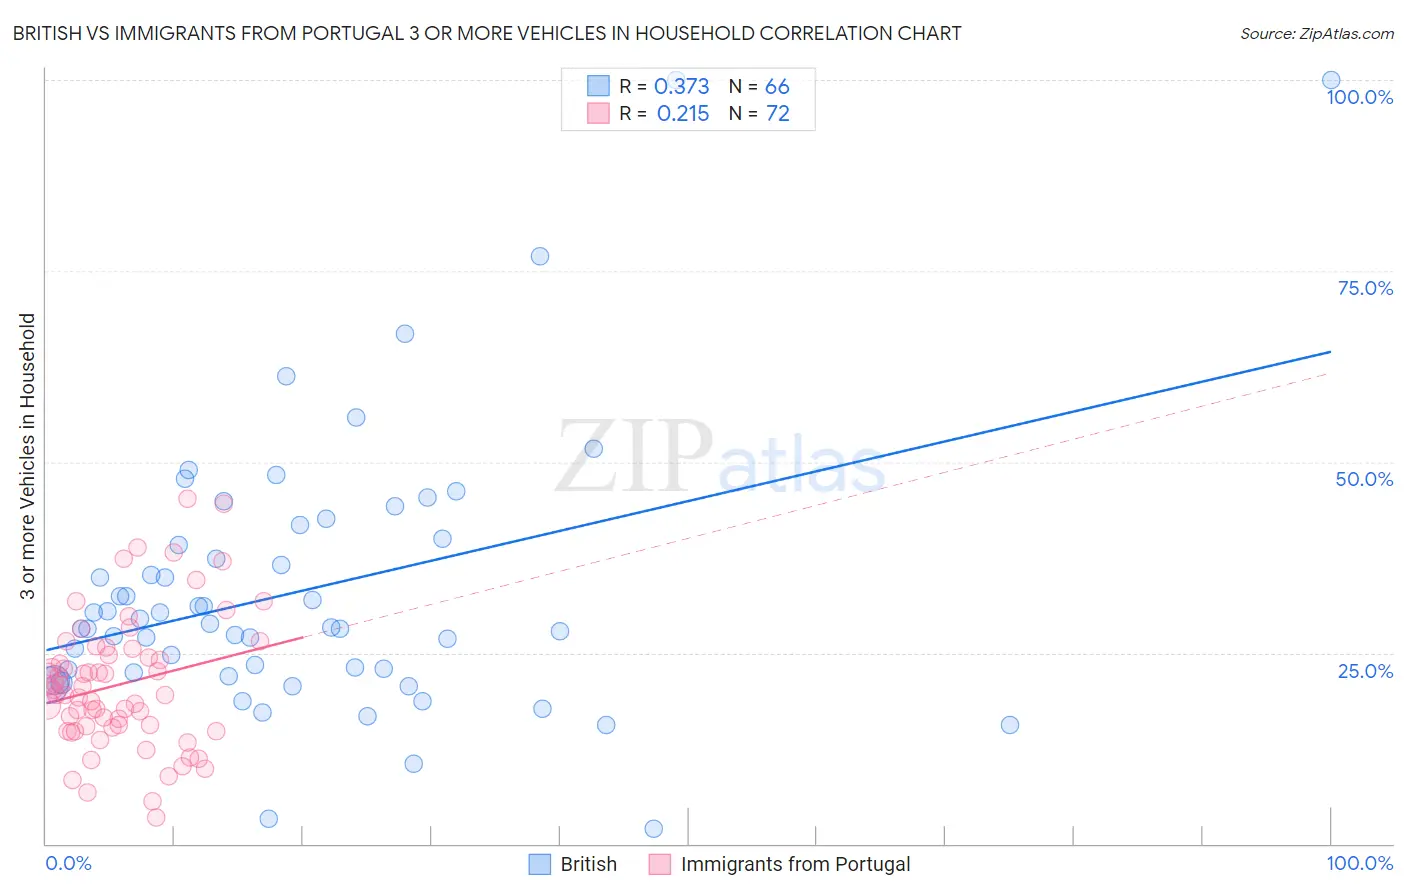
British vs Immigrants from Portugal 3 or more Vehicles in Household Correlation Chart

The statistical analysis conducted on geographies consisting of 530,803,931 people shows a mild positive correlation between the proportion of British and percentage of households with 3 or more vehicles available in the United States with a correlation coefficient (R) of 0.373 and weighted average of 21.9%. Similarly, the statistical analysis conducted on geographies consisting of 174,744,003 people shows a weak positive correlation between the proportion of Immigrants from Portugal and percentage of households with 3 or more vehicles available in the United States with a correlation coefficient (R) of 0.215 and weighted average of 18.6%, a difference of 17.5%.
British vs Immigrants from Portugal 3 or more Vehicles in Household

3 or more Vehicles in Household Correlation Summary

MeasurementBritishImmigrants from Portugal
Minimum1.9%3.4%
Maximum100.0%45.2%
Range98.1%41.7%
Mean33.2%20.9%
Median28.6%19.9%
Interquartile 25% (IQ1)22.5%15.2%
Interquartile 75% (IQ3)40.0%25.1%
Interquartile Range (IQR)17.5%9.9%
Standard Deviation (Sample)18.1%8.7%
Standard Deviation (Population)18.0%8.6%

Similar Demographics by 3 or more Vehicles in Household

Demographics Similar to British by 3 or more Vehicles in Household

In terms of 3 or more vehicles in household, the demographic groups most similar to British are Creek (21.9%, a difference of 0.030%), Alaskan Athabascan (21.9%, a difference of 0.15%), Bangladeshi (21.9%, a difference of 0.22%), Potawatomi (21.9%, a difference of 0.23%), and Northern European (22.0%, a difference of 0.41%).
DemographicsRating | Rank3 or more Vehicles in Household
Bhutanese
99.9
/100
|
#61
Exceptional
22.2%
Fijians
99.9
/100
|
#62
Exceptional
22.2%
Chickasaw
99.9
/100
|
#63
Exceptional
22.2%
Immigrants | Taiwan
99.9
/100
|
#64
Exceptional
22.1%
Pima
99.9
/100
|
#65
Exceptional
22.0%
Northern Europeans
99.9
/100
|
#66
Exceptional
22.0%
Alaskan Athabascans
99.9
/100
|
#67
Exceptional
21.9%
British
99.9
/100
|
#68
Exceptional
21.9%
Creek
99.9
/100
|
#69
Exceptional
21.9%
Bangladeshis
99.8
/100
|
#70
Exceptional
21.9%
Potawatomi
99.8
/100
|
#71
Exceptional
21.9%
Portuguese
99.8
/100
|
#72
Exceptional
21.8%
Salvadorans
99.8
/100
|
#73
Exceptional
21.8%
Immigrants | Oceania
99.8
/100
|
#74
Exceptional
21.8%
Japanese
99.8
/100
|
#75
Exceptional
21.8%

Demographics Similar to Immigrants from Portugal by 3 or more Vehicles in Household

In terms of 3 or more vehicles in household, the demographic groups most similar to Immigrants from Portugal are Immigrants from Armenia (18.6%, a difference of 0.080%), Nigerian (18.6%, a difference of 0.28%), Immigrants from Italy (18.7%, a difference of 0.29%), Immigrants from Nigeria (18.7%, a difference of 0.31%), and Eastern European (18.7%, a difference of 0.37%).
DemographicsRating | Rank3 or more Vehicles in Household
Immigrants | Kenya
12.4
/100
|
#211
Poor
18.8%
Panamanians
11.6
/100
|
#212
Poor
18.8%
Immigrants | Cuba
11.6
/100
|
#213
Poor
18.8%
Immigrants | Sierra Leone
10.8
/100
|
#214
Poor
18.7%
Eastern Europeans
10.6
/100
|
#215
Poor
18.7%
Immigrants | Nigeria
10.3
/100
|
#216
Poor
18.7%
Immigrants | Italy
10.2
/100
|
#217
Poor
18.7%
Immigrants | Portugal
8.9
/100
|
#218
Tragic
18.6%
Immigrants | Armenia
8.6
/100
|
#219
Tragic
18.6%
Nigerians
7.9
/100
|
#220
Tragic
18.6%
Immigrants | Poland
7.5
/100
|
#221
Tragic
18.6%
Belizeans
7.3
/100
|
#222
Tragic
18.6%
Immigrants | Czechoslovakia
5.9
/100
|
#223
Tragic
18.5%
Immigrants | Argentina
5.6
/100
|
#224
Tragic
18.5%
Immigrants | Lithuania
5.6
/100
|
#225
Tragic
18.5%