British vs Hispanic or Latino 3 or more Vehicles in Household
COMPARE
British
Hispanic or Latino
3 or more Vehicles in Household
3 or more Vehicles in Household Comparison
British
Hispanics or Latinos
21.9%
3 OR MORE VEHICLES IN HOUSEHOLD
99.9/ 100
METRIC RATING
68th/ 347
METRIC RANK
22.4%
3 OR MORE VEHICLES IN HOUSEHOLD
100.0/ 100
METRIC RATING
56th/ 347
METRIC RANK
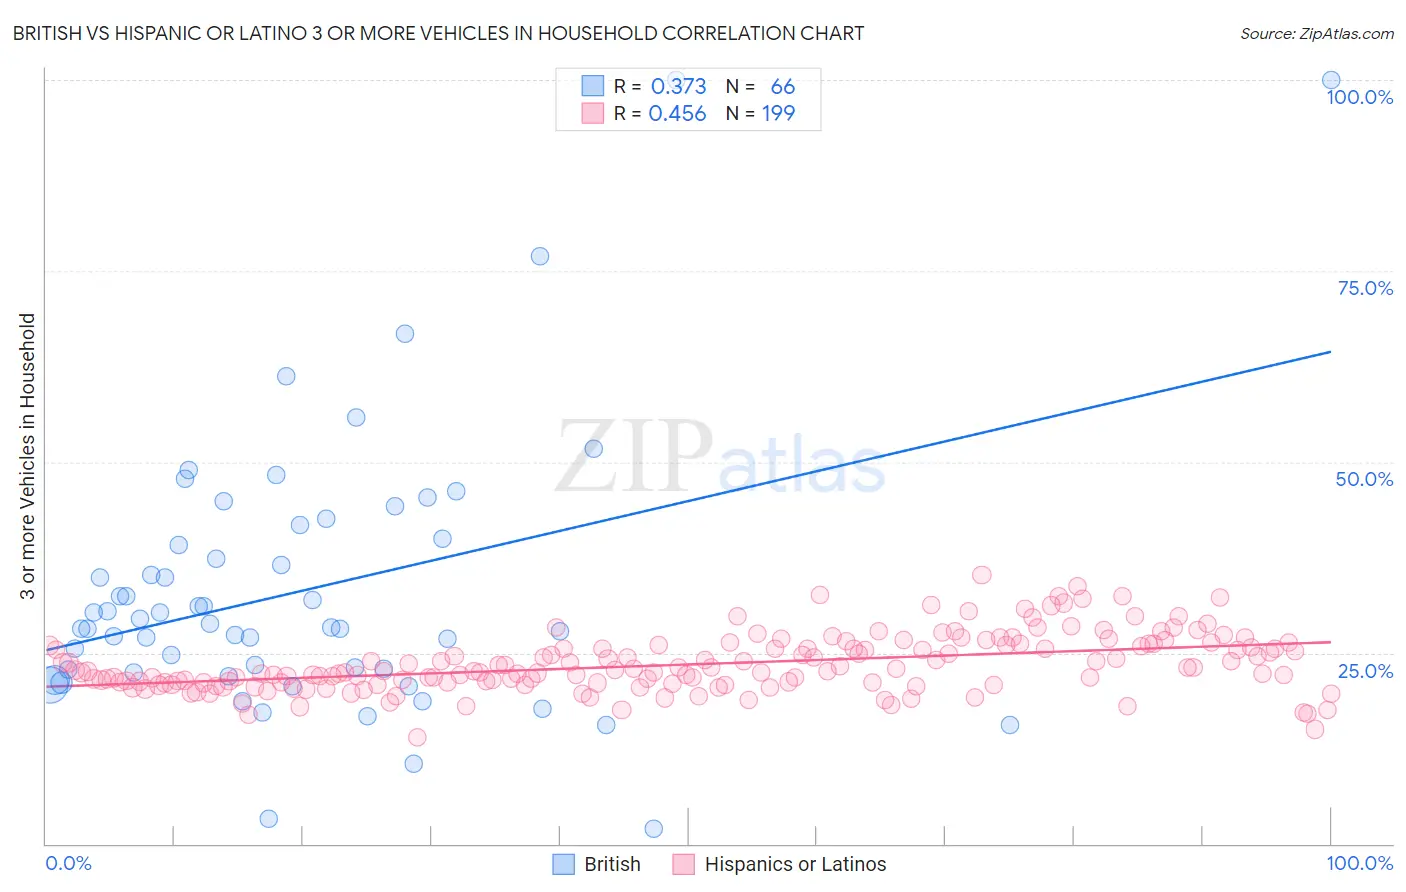
British vs Hispanic or Latino 3 or more Vehicles in Household Correlation Chart
The statistical analysis conducted on geographies consisting of 530,803,931 people shows a mild positive correlation between the proportion of British and percentage of households with 3 or more vehicles available in the United States with a correlation coefficient (R) of 0.373 and weighted average of 21.9%. Similarly, the statistical analysis conducted on geographies consisting of 563,449,459 people shows a moderate positive correlation between the proportion of Hispanics or Latinos and percentage of households with 3 or more vehicles available in the United States with a correlation coefficient (R) of 0.456 and weighted average of 22.4%, a difference of 2.1%.
3 or more Vehicles in Household Correlation Summary
| Measurement | British | Hispanic or Latino |
| Minimum | 1.9% | 13.9% |
| Maximum | 100.0% | 35.2% |
| Range | 98.1% | 21.3% |
| Mean | 33.2% | 23.5% |
| Median | 28.6% | 22.6% |
| Interquartile 25% (IQ1) | 22.5% | 21.1% |
| Interquartile 75% (IQ3) | 40.0% | 25.8% |
| Interquartile Range (IQR) | 17.5% | 4.8% |
| Standard Deviation (Sample) | 18.1% | 3.7% |
| Standard Deviation (Population) | 18.0% | 3.7% |
Demographics Similar to British and Hispanics or Latinos by 3 or more Vehicles in Household
In terms of 3 or more vehicles in household, the demographic groups most similar to British are Creek (21.9%, a difference of 0.030%), Alaskan Athabascan (21.9%, a difference of 0.15%), Bangladeshi (21.9%, a difference of 0.22%), Potawatomi (21.9%, a difference of 0.23%), and Northern European (22.0%, a difference of 0.41%). Similarly, the demographic groups most similar to Hispanics or Latinos are Immigrants from Laos (22.4%, a difference of 0.030%), Pennsylvania German (22.3%, a difference of 0.16%), Spaniard (22.3%, a difference of 0.29%), Navajo (22.3%, a difference of 0.35%), and Crow (22.5%, a difference of 0.40%).
| Demographics | Rating | Rank | 3 or more Vehicles in Household |
| Welsh | 100.0 /100 | #52 | Exceptional 22.6% |
| Czechs | 100.0 /100 | #53 | Exceptional 22.5% |
| Crow | 100.0 /100 | #54 | Exceptional 22.5% |
| Immigrants | Laos | 100.0 /100 | #55 | Exceptional 22.4% |
| Hispanics or Latinos | 100.0 /100 | #56 | Exceptional 22.4% |
| Pennsylvania Germans | 100.0 /100 | #57 | Exceptional 22.3% |
| Spaniards | 100.0 /100 | #58 | Exceptional 22.3% |
| Navajo | 100.0 /100 | #59 | Exceptional 22.3% |
| Finns | 99.9 /100 | #60 | Exceptional 22.3% |
| Bhutanese | 99.9 /100 | #61 | Exceptional 22.2% |
| Fijians | 99.9 /100 | #62 | Exceptional 22.2% |
| Chickasaw | 99.9 /100 | #63 | Exceptional 22.2% |
| Immigrants | Taiwan | 99.9 /100 | #64 | Exceptional 22.1% |
| Pima | 99.9 /100 | #65 | Exceptional 22.0% |
| Northern Europeans | 99.9 /100 | #66 | Exceptional 22.0% |
| Alaskan Athabascans | 99.9 /100 | #67 | Exceptional 21.9% |
| British | 99.9 /100 | #68 | Exceptional 21.9% |
| Creek | 99.9 /100 | #69 | Exceptional 21.9% |
| Bangladeshis | 99.8 /100 | #70 | Exceptional 21.9% |
| Potawatomi | 99.8 /100 | #71 | Exceptional 21.9% |
| Portuguese | 99.8 /100 | #72 | Exceptional 21.8% |