British vs Hawaiian 3 or more Vehicles in Household
COMPARE
British
Hawaiian
3 or more Vehicles in Household
3 or more Vehicles in Household Comparison
British
Hawaiians
21.9%
3 OR MORE VEHICLES IN HOUSEHOLD
99.9/ 100
METRIC RATING
68th/ 347
METRIC RANK
24.3%
3 OR MORE VEHICLES IN HOUSEHOLD
100.0/ 100
METRIC RATING
15th/ 347
METRIC RANK
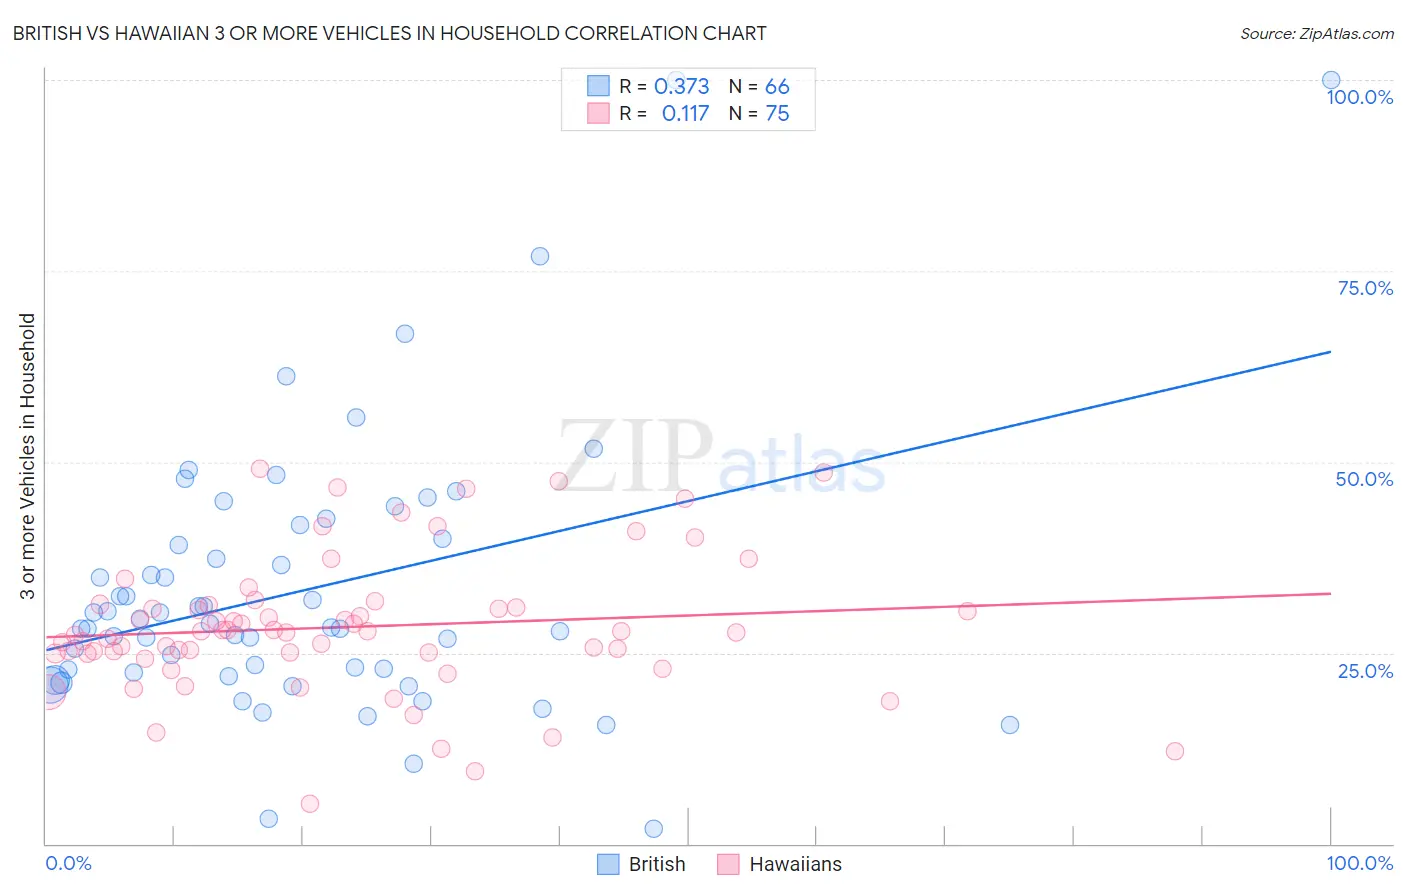
British vs Hawaiian 3 or more Vehicles in Household Correlation Chart
The statistical analysis conducted on geographies consisting of 530,803,931 people shows a mild positive correlation between the proportion of British and percentage of households with 3 or more vehicles available in the United States with a correlation coefficient (R) of 0.373 and weighted average of 21.9%. Similarly, the statistical analysis conducted on geographies consisting of 327,356,471 people shows a poor positive correlation between the proportion of Hawaiians and percentage of households with 3 or more vehicles available in the United States with a correlation coefficient (R) of 0.117 and weighted average of 24.3%, a difference of 10.7%.
3 or more Vehicles in Household Correlation Summary
| Measurement | British | Hawaiian |
| Minimum | 1.9% | 5.3% |
| Maximum | 100.0% | 49.1% |
| Range | 98.1% | 43.8% |
| Mean | 33.2% | 28.4% |
| Median | 28.6% | 27.7% |
| Interquartile 25% (IQ1) | 22.5% | 24.9% |
| Interquartile 75% (IQ3) | 40.0% | 31.3% |
| Interquartile Range (IQR) | 17.5% | 6.4% |
| Standard Deviation (Sample) | 18.1% | 9.0% |
| Standard Deviation (Population) | 18.0% | 8.9% |
Similar Demographics by 3 or more Vehicles in Household
Demographics Similar to British by 3 or more Vehicles in Household
In terms of 3 or more vehicles in household, the demographic groups most similar to British are Creek (21.9%, a difference of 0.030%), Alaskan Athabascan (21.9%, a difference of 0.15%), Bangladeshi (21.9%, a difference of 0.22%), Potawatomi (21.9%, a difference of 0.23%), and Northern European (22.0%, a difference of 0.41%).
| Demographics | Rating | Rank | 3 or more Vehicles in Household |
| Bhutanese | 99.9 /100 | #61 | Exceptional 22.2% |
| Fijians | 99.9 /100 | #62 | Exceptional 22.2% |
| Chickasaw | 99.9 /100 | #63 | Exceptional 22.2% |
| Immigrants | Taiwan | 99.9 /100 | #64 | Exceptional 22.1% |
| Pima | 99.9 /100 | #65 | Exceptional 22.0% |
| Northern Europeans | 99.9 /100 | #66 | Exceptional 22.0% |
| Alaskan Athabascans | 99.9 /100 | #67 | Exceptional 21.9% |
| British | 99.9 /100 | #68 | Exceptional 21.9% |
| Creek | 99.9 /100 | #69 | Exceptional 21.9% |
| Bangladeshis | 99.8 /100 | #70 | Exceptional 21.9% |
| Potawatomi | 99.8 /100 | #71 | Exceptional 21.9% |
| Portuguese | 99.8 /100 | #72 | Exceptional 21.8% |
| Salvadorans | 99.8 /100 | #73 | Exceptional 21.8% |
| Immigrants | Oceania | 99.8 /100 | #74 | Exceptional 21.8% |
| Japanese | 99.8 /100 | #75 | Exceptional 21.8% |
Demographics Similar to Hawaiians by 3 or more Vehicles in Household
In terms of 3 or more vehicles in household, the demographic groups most similar to Hawaiians are Basque (24.3%, a difference of 0.030%), Korean (24.1%, a difference of 0.83%), Immigrants from Mexico (24.6%, a difference of 1.4%), Norwegian (23.9%, a difference of 1.6%), and Chinese (23.9%, a difference of 1.7%).
| Demographics | Rating | Rank | 3 or more Vehicles in Household |
| Samoans | 100.0 /100 | #8 | Exceptional 25.0% |
| Native Hawaiians | 100.0 /100 | #9 | Exceptional 24.9% |
| Nepalese | 100.0 /100 | #10 | Exceptional 24.9% |
| Shoshone | 100.0 /100 | #11 | Exceptional 24.9% |
| Danes | 100.0 /100 | #12 | Exceptional 24.7% |
| Mexicans | 100.0 /100 | #13 | Exceptional 24.7% |
| Immigrants | Mexico | 100.0 /100 | #14 | Exceptional 24.6% |
| Hawaiians | 100.0 /100 | #15 | Exceptional 24.3% |
| Basques | 100.0 /100 | #16 | Exceptional 24.3% |
| Koreans | 100.0 /100 | #17 | Exceptional 24.1% |
| Norwegians | 100.0 /100 | #18 | Exceptional 23.9% |
| Chinese | 100.0 /100 | #19 | Exceptional 23.9% |
| Paiute | 100.0 /100 | #20 | Exceptional 23.8% |
| Immigrants | Vietnam | 100.0 /100 | #21 | Exceptional 23.8% |
| Immigrants | Philippines | 100.0 /100 | #22 | Exceptional 23.8% |