British vs Immigrants from Nicaragua 3 or more Vehicles in Household
COMPARE
British
Immigrants from Nicaragua
3 or more Vehicles in Household
3 or more Vehicles in Household Comparison
British
Immigrants from Nicaragua
21.9%
3 OR MORE VEHICLES IN HOUSEHOLD
99.9/ 100
METRIC RATING
68th/ 347
METRIC RANK
20.2%
3 OR MORE VEHICLES IN HOUSEHOLD
87.1/ 100
METRIC RATING
136th/ 347
METRIC RANK
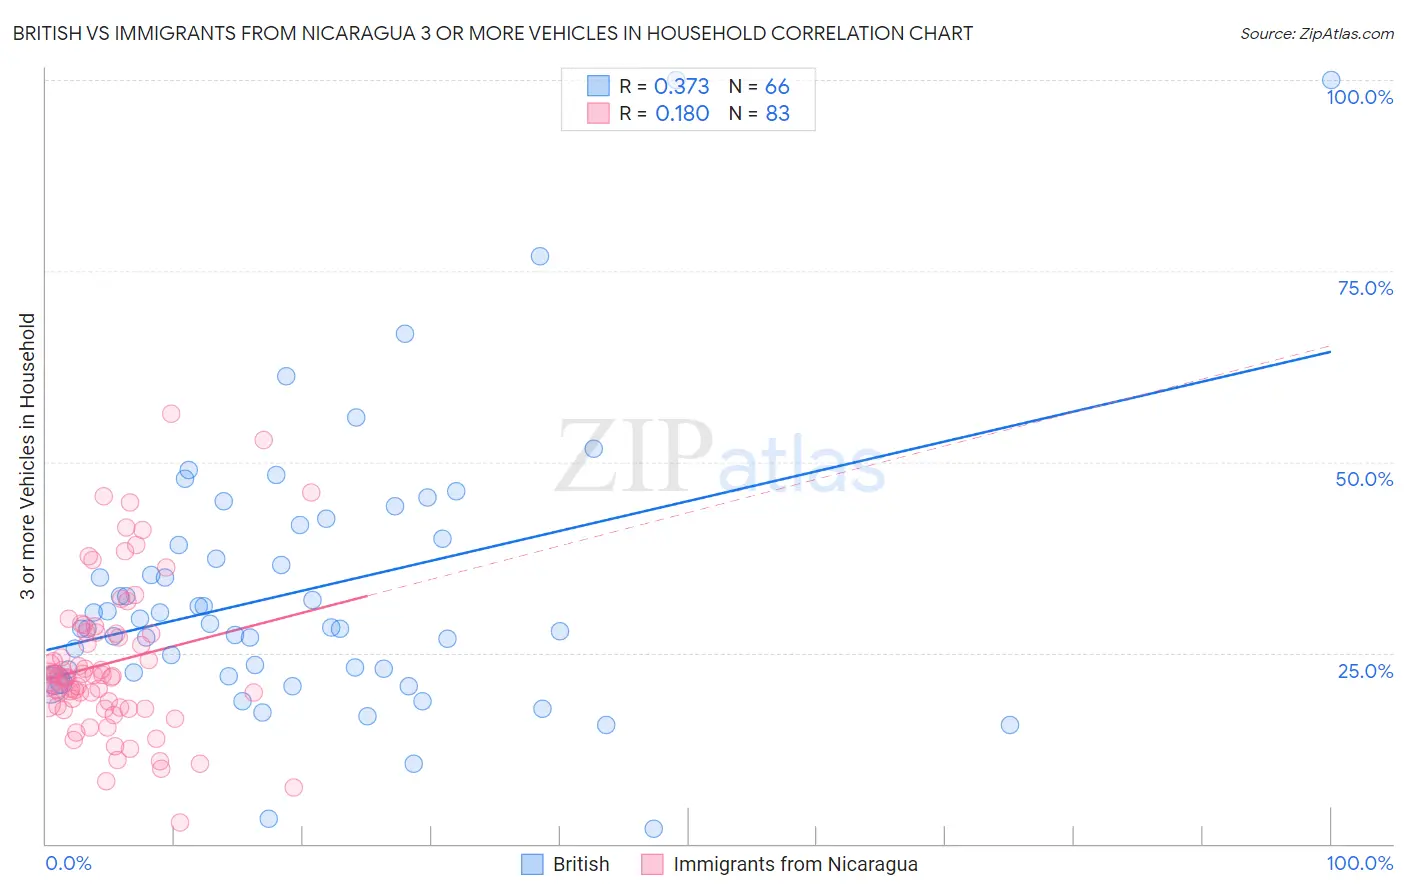
British vs Immigrants from Nicaragua 3 or more Vehicles in Household Correlation Chart
The statistical analysis conducted on geographies consisting of 530,803,931 people shows a mild positive correlation between the proportion of British and percentage of households with 3 or more vehicles available in the United States with a correlation coefficient (R) of 0.373 and weighted average of 21.9%. Similarly, the statistical analysis conducted on geographies consisting of 236,311,792 people shows a poor positive correlation between the proportion of Immigrants from Nicaragua and percentage of households with 3 or more vehicles available in the United States with a correlation coefficient (R) of 0.180 and weighted average of 20.2%, a difference of 8.5%.
3 or more Vehicles in Household Correlation Summary
| Measurement | British | Immigrants from Nicaragua |
| Minimum | 1.9% | 2.8% |
| Maximum | 100.0% | 56.2% |
| Range | 98.1% | 53.4% |
| Mean | 33.2% | 23.7% |
| Median | 28.6% | 21.9% |
| Interquartile 25% (IQ1) | 22.5% | 17.9% |
| Interquartile 75% (IQ3) | 40.0% | 27.6% |
| Interquartile Range (IQR) | 17.5% | 9.8% |
| Standard Deviation (Sample) | 18.1% | 10.0% |
| Standard Deviation (Population) | 18.0% | 9.9% |
Similar Demographics by 3 or more Vehicles in Household
Demographics Similar to British by 3 or more Vehicles in Household
In terms of 3 or more vehicles in household, the demographic groups most similar to British are Creek (21.9%, a difference of 0.030%), Alaskan Athabascan (21.9%, a difference of 0.15%), Bangladeshi (21.9%, a difference of 0.22%), Potawatomi (21.9%, a difference of 0.23%), and Northern European (22.0%, a difference of 0.41%).
| Demographics | Rating | Rank | 3 or more Vehicles in Household |
| Bhutanese | 99.9 /100 | #61 | Exceptional 22.2% |
| Fijians | 99.9 /100 | #62 | Exceptional 22.2% |
| Chickasaw | 99.9 /100 | #63 | Exceptional 22.2% |
| Immigrants | Taiwan | 99.9 /100 | #64 | Exceptional 22.1% |
| Pima | 99.9 /100 | #65 | Exceptional 22.0% |
| Northern Europeans | 99.9 /100 | #66 | Exceptional 22.0% |
| Alaskan Athabascans | 99.9 /100 | #67 | Exceptional 21.9% |
| British | 99.9 /100 | #68 | Exceptional 21.9% |
| Creek | 99.9 /100 | #69 | Exceptional 21.9% |
| Bangladeshis | 99.8 /100 | #70 | Exceptional 21.9% |
| Potawatomi | 99.8 /100 | #71 | Exceptional 21.9% |
| Portuguese | 99.8 /100 | #72 | Exceptional 21.8% |
| Salvadorans | 99.8 /100 | #73 | Exceptional 21.8% |
| Immigrants | Oceania | 99.8 /100 | #74 | Exceptional 21.8% |
| Japanese | 99.8 /100 | #75 | Exceptional 21.8% |
Demographics Similar to Immigrants from Nicaragua by 3 or more Vehicles in Household
In terms of 3 or more vehicles in household, the demographic groups most similar to Immigrants from Nicaragua are Immigrants from Iraq (20.2%, a difference of 0.0%), Immigrants from India (20.2%, a difference of 0.010%), Polish (20.2%, a difference of 0.030%), Immigrants from Canada (20.2%, a difference of 0.12%), and Immigrants from North America (20.2%, a difference of 0.12%).
| Demographics | Rating | Rank | 3 or more Vehicles in Household |
| Zimbabweans | 88.7 /100 | #129 | Excellent 20.3% |
| Greeks | 88.6 /100 | #130 | Excellent 20.3% |
| Immigrants | Asia | 88.1 /100 | #131 | Excellent 20.2% |
| Immigrants | Canada | 87.8 /100 | #132 | Excellent 20.2% |
| Immigrants | North America | 87.8 /100 | #133 | Excellent 20.2% |
| Poles | 87.3 /100 | #134 | Excellent 20.2% |
| Immigrants | India | 87.2 /100 | #135 | Excellent 20.2% |
| Immigrants | Nicaragua | 87.1 /100 | #136 | Excellent 20.2% |
| Immigrants | Iraq | 87.1 /100 | #137 | Excellent 20.2% |
| Aleuts | 86.3 /100 | #138 | Excellent 20.2% |
| Slovenes | 85.5 /100 | #139 | Excellent 20.2% |
| French American Indians | 85.3 /100 | #140 | Excellent 20.1% |
| Ottawa | 84.9 /100 | #141 | Excellent 20.1% |
| Jordanians | 84.4 /100 | #142 | Excellent 20.1% |
| Lithuanians | 84.4 /100 | #143 | Excellent 20.1% |