Zip Codes with the Highest Percentage of Households Heated by Fuel Oil / Kerosene in Utah
RELATED REPORTS & OPTIONS
Fuel Oil Heating
Utah
Compare Zip Codes
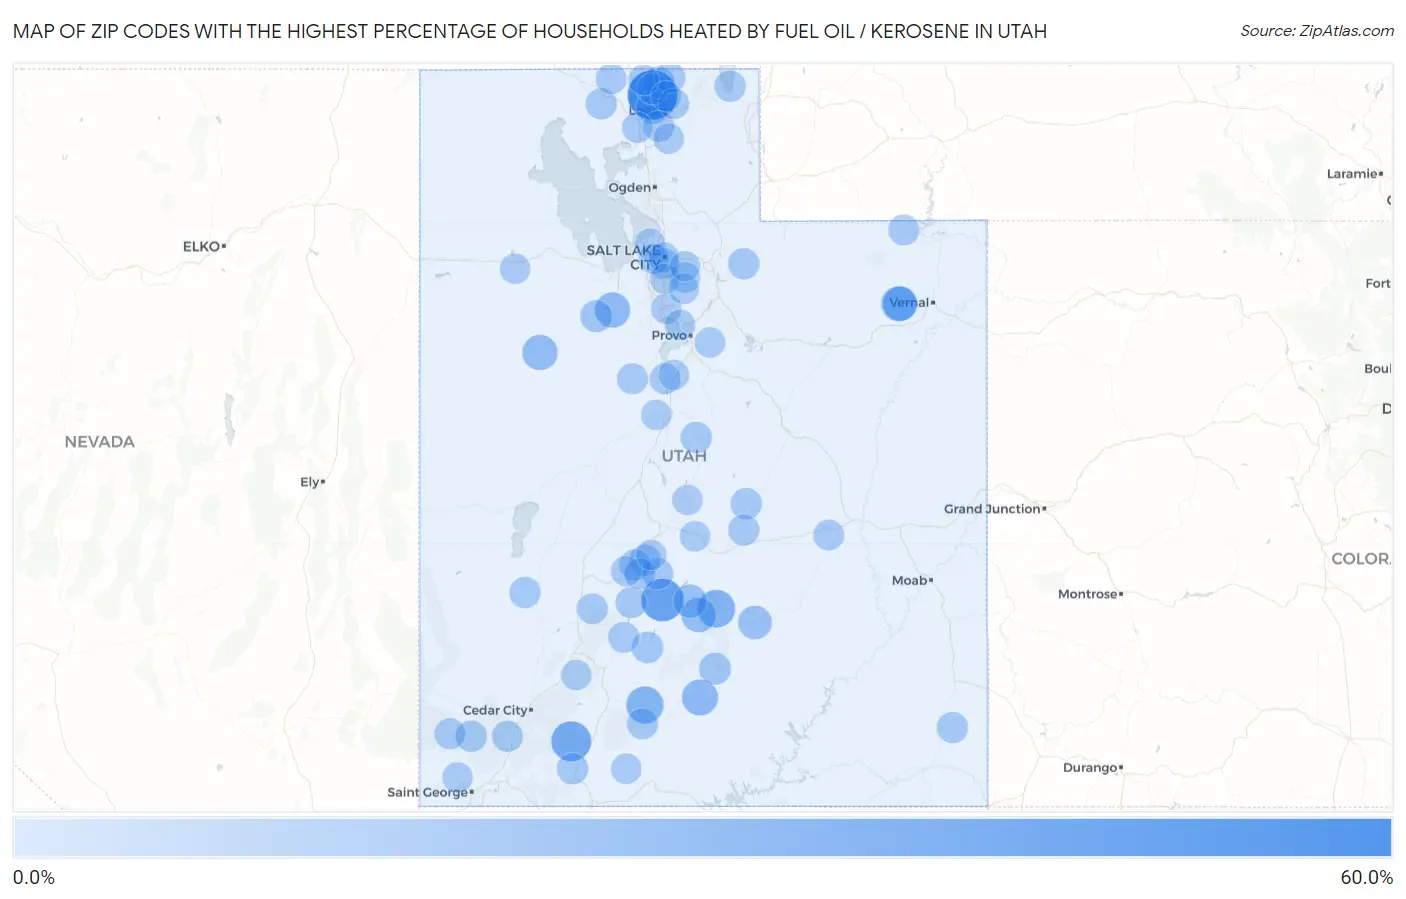
Map of Zip Codes with the Highest Percentage of Households Heated by Fuel Oil / Kerosene in Utah
0.0%
60.0%
Zip Codes with the Highest Percentage of Households Heated by Fuel Oil / Kerosene in Utah
| Zip Code | Fuel Oil Heating | vs State | vs National | |
| 1. | 84304 | 54.8% | 0.10%(+54.7)#1 | 4.2%(+50.6)#1,505 |
| 2. | 84732 | 34.8% | 0.10%(+34.7)#2 | 4.2%(+30.6)#2,975 |
| 3. | 84762 | 27.1% | 0.10%(+27.0)#3 | 4.2%(+22.9)#3,584 |
| 4. | 84749 | 20.8% | 0.10%(+20.7)#4 | 4.2%(+16.6)#4,202 |
| 5. | 84764 | 19.3% | 0.10%(+19.2)#5 | 4.2%(+15.1)#4,371 |
| 6. | 84726 | 15.9% | 0.10%(+15.8)#6 | 4.2%(+11.7)#4,849 |
| 7. | 84071 | 13.8% | 0.10%(+13.7)#7 | 4.2%(+9.60)#5,216 |
| 8. | 84076 | 13.5% | 0.10%(+13.4)#8 | 4.2%(+9.30)#5,265 |
| 9. | 84022 | 13.4% | 0.10%(+13.3)#9 | 4.2%(+9.20)#5,276 |
| 10. | 84715 | 12.0% | 0.10%(+11.9)#10 | 4.2%(+7.80)#5,584 |
| 11. | 84039 | 11.6% | 0.10%(+11.5)#11 | 4.2%(+7.40)#5,687 |
| 12. | 84775 | 9.0% | 0.10%(+8.90)#12 | 4.2%(+4.80)#6,368 |
| 13. | 84747 | 8.6% | 0.10%(+8.50)#13 | 4.2%(+4.40)#6,501 |
| 14. | 84325 | 6.1% | 0.10%(+6.00)#14 | 4.2%(+1.90)#7,545 |
| 15. | 84716 | 4.2% | 0.10%(+4.10)#15 | 4.2%(=0.000)#8,692 |
| 16. | 84069 | 4.2% | 0.10%(+4.10)#16 | 4.2%(=0.000)#8,693 |
| 17. | 84338 | 3.7% | 0.10%(+3.60)#17 | 4.2%(-0.500)#9,092 |
| 18. | 84712 | 3.5% | 0.10%(+3.40)#18 | 4.2%(-0.700)#9,289 |
| 19. | 84327 | 3.0% | 0.10%(+2.90)#19 | 4.2%(-1.20)#9,731 |
| 20. | 84744 | 3.0% | 0.10%(+2.90)#20 | 4.2%(-1.20)#9,746 |
| 21. | 84750 | 2.8% | 0.10%(+2.70)#21 | 4.2%(-1.40)#9,957 |
| 22. | 84523 | 2.7% | 0.10%(+2.60)#22 | 4.2%(-1.50)#10,039 |
| 23. | 84038 | 2.7% | 0.10%(+2.60)#23 | 4.2%(-1.50)#10,077 |
| 24. | 84055 | 2.6% | 0.10%(+2.50)#24 | 4.2%(-1.60)#10,164 |
| 25. | 84722 | 2.6% | 0.10%(+2.50)#25 | 4.2%(-1.60)#10,179 |
| 26. | 84646 | 2.4% | 0.10%(+2.30)#26 | 4.2%(-1.80)#10,395 |
| 27. | 84711 | 2.4% | 0.10%(+2.30)#27 | 4.2%(-1.80)#10,412 |
| 28. | 84758 | 2.4% | 0.10%(+2.30)#28 | 4.2%(-1.80)#10,415 |
| 29. | 84751 | 2.3% | 0.10%(+2.20)#29 | 4.2%(-1.90)#10,522 |
| 30. | 84724 | 2.3% | 0.10%(+2.20)#30 | 4.2%(-1.90)#10,548 |
| 31. | 84316 | 2.2% | 0.10%(+2.10)#31 | 4.2%(-2.00)#10,719 |
| 32. | 84339 | 2.0% | 0.10%(+1.90)#32 | 4.2%(-2.20)#10,927 |
| 33. | 84511 | 2.0% | 0.10%(+1.90)#33 | 4.2%(-2.20)#10,934 |
| 34. | 84720 | 1.8% | 0.10%(+1.70)#34 | 4.2%(-2.40)#11,218 |
| 35. | 84522 | 1.8% | 0.10%(+1.70)#35 | 4.2%(-2.40)#11,330 |
| 36. | 84718 | 1.8% | 0.10%(+1.70)#36 | 4.2%(-2.40)#11,331 |
| 37. | 84754 | 1.6% | 0.10%(+1.50)#37 | 4.2%(-2.60)#11,578 |
| 38. | 84725 | 1.6% | 0.10%(+1.50)#38 | 4.2%(-2.60)#11,626 |
| 39. | 84628 | 1.6% | 0.10%(+1.50)#39 | 4.2%(-2.60)#11,648 |
| 40. | 84046 | 1.6% | 0.10%(+1.50)#40 | 4.2%(-2.60)#11,667 |
| 41. | 84723 | 1.6% | 0.10%(+1.50)#41 | 4.2%(-2.60)#11,670 |
| 42. | 84301 | 1.5% | 0.10%(+1.40)#42 | 4.2%(-2.70)#11,830 |
| 43. | 84633 | 1.4% | 0.10%(+1.30)#43 | 4.2%(-2.80)#12,015 |
| 44. | 84320 | 1.3% | 0.10%(+1.20)#44 | 4.2%(-2.90)#12,169 |
| 45. | 84331 | 1.3% | 0.10%(+1.20)#45 | 4.2%(-2.90)#12,246 |
| 46. | 84525 | 1.1% | 0.10%(+1.00)#46 | 4.2%(-3.10)#12,656 |
| 47. | 84305 | 1.1% | 0.10%(+1.00)#47 | 4.2%(-3.10)#12,660 |
| 48. | 84713 | 1.0% | 0.10%(+0.900)#48 | 4.2%(-3.20)#12,824 |
| 49. | 84341 | 0.90% | 0.10%(+0.800)#49 | 4.2%(-3.30)#12,985 |
| 50. | 84654 | 0.60% | 0.10%(+0.500)#50 | 4.2%(-3.60)#14,183 |
| 51. | 84328 | 0.60% | 0.10%(+0.500)#51 | 4.2%(-3.60)#14,201 |
| 52. | 84739 | 0.60% | 0.10%(+0.500)#52 | 4.2%(-3.60)#14,251 |
| 53. | 84760 | 0.50% | 0.10%(+0.400)#53 | 4.2%(-3.70)#14,672 |
| 54. | 84643 | 0.50% | 0.10%(+0.400)#54 | 4.2%(-3.70)#14,683 |
| 55. | 84648 | 0.40% | 0.10%(+0.300)#55 | 4.2%(-3.80)#15,040 |
| 56. | 84741 | 0.40% | 0.10%(+0.300)#56 | 4.2%(-3.80)#15,052 |
| 57. | 84730 | 0.40% | 0.10%(+0.300)#57 | 4.2%(-3.80)#15,174 |
| 58. | 84116 | 0.30% | 0.10%(+0.200)#58 | 4.2%(-3.90)#15,302 |
| 59. | 84115 | 0.30% | 0.10%(+0.200)#59 | 4.2%(-3.90)#15,371 |
| 60. | 84335 | 0.30% | 0.10%(+0.200)#60 | 4.2%(-3.90)#15,536 |
| 61. | 84043 | 0.20% | 0.10%(+0.100)#61 | 4.2%(-4.00)#15,840 |
| 62. | 84104 | 0.20% | 0.10%(+0.100)#62 | 4.2%(-4.00)#16,224 |
| 63. | 84738 | 0.20% | 0.10%(+0.100)#63 | 4.2%(-4.00)#16,477 |
| 64. | 84101 | 0.20% | 0.10%(+0.100)#64 | 4.2%(-4.00)#16,503 |
| 65. | 84121 | 0.10% | 0.10%(=0.000)#65 | 4.2%(-4.10)#16,978 |
| 66. | 84047 | 0.10% | 0.10%(=0.000)#66 | 4.2%(-4.10)#17,038 |
| 67. | 84663 | 0.10% | 0.10%(=0.000)#67 | 4.2%(-4.10)#17,060 |
| 68. | 84092 | 0.10% | 0.10%(=0.000)#68 | 4.2%(-4.10)#17,237 |
| 69. | 84109 | 0.10% | 0.10%(=0.000)#69 | 4.2%(-4.10)#17,312 |
| 70. | 84655 | 0.10% | 0.10%(=0.000)#70 | 4.2%(-4.10)#17,538 |
| 71. | 84059 | 0.10% | 0.10%(=0.000)#71 | 4.2%(-4.10)#17,548 |
| 72. | 84029 | 0.10% | 0.10%(=0.000)#72 | 4.2%(-4.10)#17,585 |
Common Questions
What are the Top 10 Zip Codes with the Highest Percentage of Households Heated by Fuel Oil / Kerosene in Utah?
Top 10 Zip Codes with the Highest Percentage of Households Heated by Fuel Oil / Kerosene in Utah are:
What zip code has the Highest Percentage of Households Heated by Fuel Oil / Kerosene in Utah?
84304 has the Highest Percentage of Households Heated by Fuel Oil / Kerosene in Utah with 54.8%.
What is the Percentage of Households Heated by Fuel Oil / Kerosene in the State of Utah?
Percentage of Households Heated by Fuel Oil / Kerosene in Utah is 0.10%.
What is the Percentage of Households Heated by Fuel Oil / Kerosene in the United States?
Percentage of Households Heated by Fuel Oil / Kerosene in the United States is 4.2%.