Zip Codes with the Highest Percentage of Population Employed in Office & Administration in Spearfish, SD
RELATED REPORTS & OPTIONS
Office & Administration
Spearfish
Compare Zip Codes
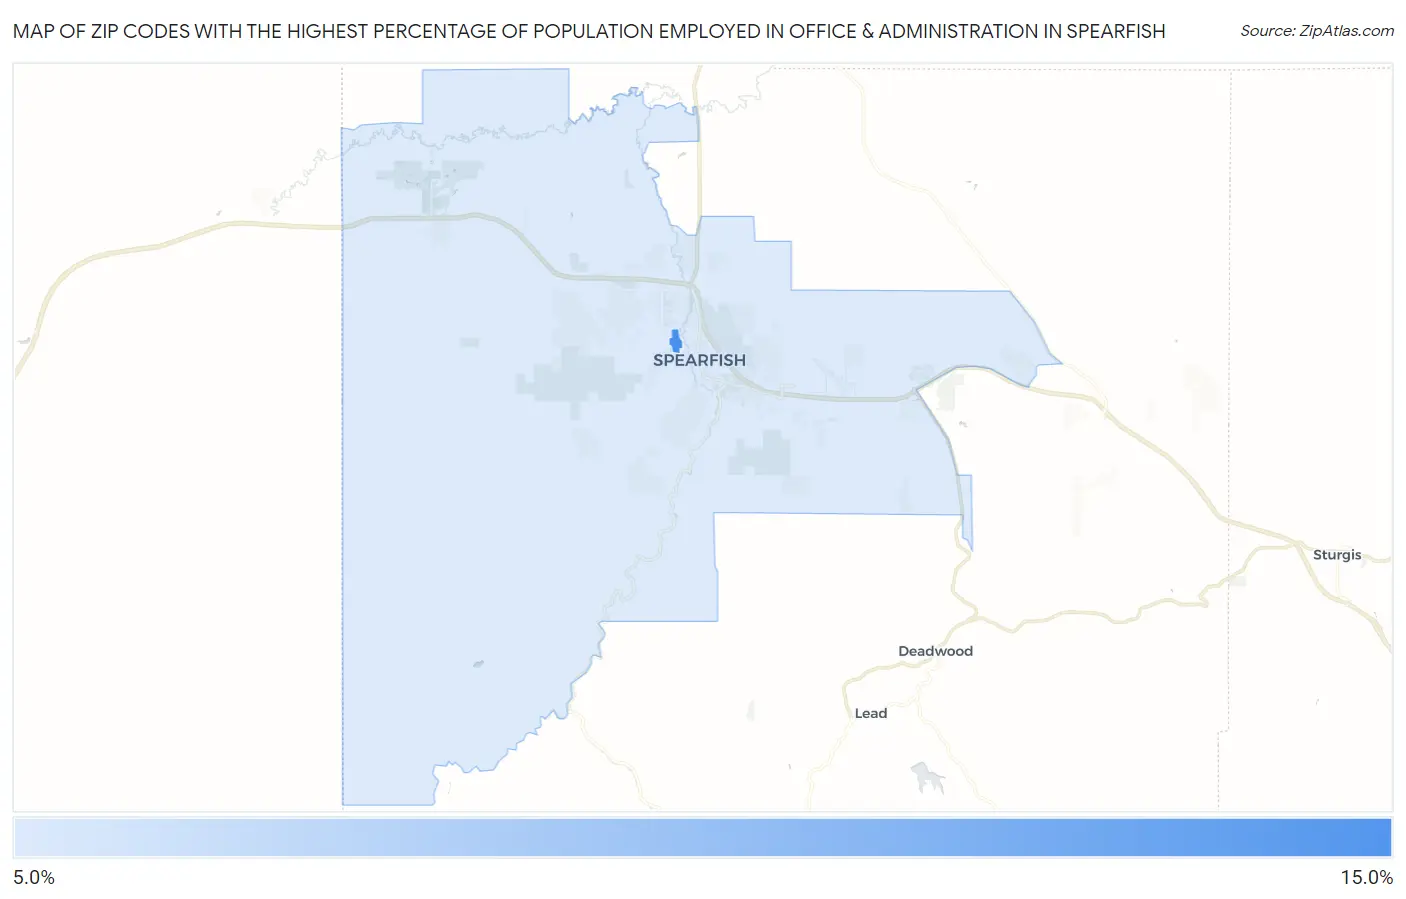
Map of Zip Codes with the Highest Percentage of Population Employed in Office & Administration in Spearfish
9.1%
13.9%
Zip Codes with the Highest Percentage of Population Employed in Office & Administration in Spearfish, SD
| Zip Code | % Employed | vs State | vs National | |
| 1. | 57799 | 13.9% | 10.9%(+3.01)#73 | 10.9%(+3.06)#6,162 |
| 2. | 57783 | 9.1% | 10.9%(-1.83)#190 | 10.9%(-1.78)#20,029 |
1
Common Questions
What are the Top Zip Codes with the Highest Percentage of Population Employed in Office & Administration in Spearfish, SD?
Top Zip Codes with the Highest Percentage of Population Employed in Office & Administration in Spearfish, SD are:
What zip code has the Highest Percentage of Population Employed in Office & Administration in Spearfish, SD?
57799 has the Highest Percentage of Population Employed in Office & Administration in Spearfish, SD with 13.9%.
What is the Percentage of Population Employed in Office & Administration in Spearfish, SD?
Percentage of Population Employed in Office & Administration in Spearfish is 8.9%.
What is the Percentage of Population Employed in Office & Administration in South Dakota?
Percentage of Population Employed in Office & Administration in South Dakota is 10.9%.
What is the Percentage of Population Employed in Office & Administration in the United States?
Percentage of Population Employed in Office & Administration in the United States is 10.9%.