Zip Codes with the Highest Percentage of Population Employed in Computer, Engineering & Science in Montana
RELATED REPORTS & OPTIONS
Computer, Engineering & Science
Montana
Compare Zip Codes
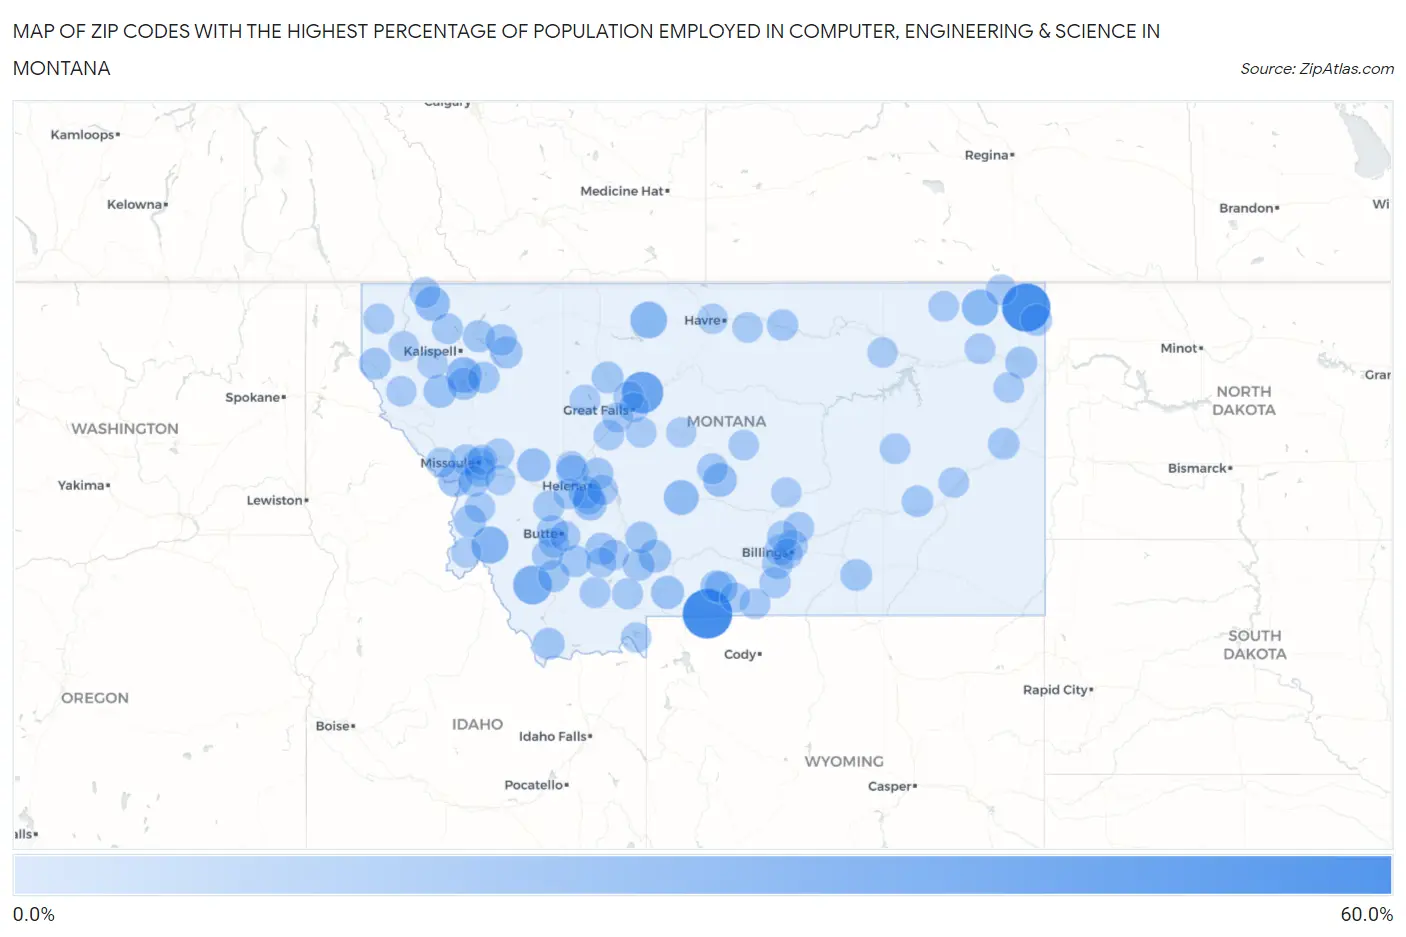
Map of Zip Codes with the Highest Percentage of Population Employed in Computer, Engineering & Science in Montana
0.0%
60.0%
Zip Codes with the Highest Percentage of Population Employed in Computer, Engineering & Science in Montana
| Zip Code | % Employed | vs State | vs National | |
| 1. | 59081 | 56.9% | 5.4%(+51.5)#1 | 6.8%(+50.1)#23 |
| 2. | 59211 | 53.2% | 5.4%(+47.8)#2 | 6.8%(+46.5)#31 |
| 3. | 59440 | 34.8% | 5.4%(+29.4)#3 | 6.8%(+28.1)#133 |
| 4. | 59746 | 26.9% | 5.4%(+21.5)#4 | 6.8%(+20.2)#231 |
| 5. | 59871 | 22.5% | 5.4%(+17.1)#5 | 6.8%(+15.7)#372 |
| 6. | 59522 | 21.4% | 5.4%(+16.0)#6 | 6.8%(+14.7)#409 |
| 7. | 59222 | 20.2% | 5.4%(+14.8)#7 | 6.8%(+13.4)#493 |
| 8. | 59931 | 18.4% | 5.4%(+13.0)#8 | 6.8%(+11.6)#640 |
| 9. | 59053 | 16.8% | 5.4%(+11.4)#9 | 6.8%(+10.0)#840 |
| 10. | 59918 | 16.3% | 5.4%(+10.9)#10 | 6.8%(+9.53)#915 |
| 11. | 59847 | 13.8% | 5.4%(+8.39)#11 | 6.8%(+7.03)#1,400 |
| 12. | 59453 | 13.5% | 5.4%(+8.12)#12 | 6.8%(+6.77)#1,464 |
| 13. | 59638 | 13.1% | 5.4%(+7.74)#13 | 6.8%(+6.38)#1,589 |
| 14. | 59843 | 12.5% | 5.4%(+7.09)#14 | 6.8%(+5.74)#1,820 |
| 15. | 59848 | 12.0% | 5.4%(+6.59)#15 | 6.8%(+5.24)#2,035 |
| 16. | 59065 | 11.9% | 5.4%(+6.50)#16 | 6.8%(+5.14)#2,083 |
| 17. | 59715 | 11.0% | 5.4%(+5.64)#17 | 6.8%(+4.28)#2,544 |
| 18. | 59028 | 10.6% | 5.4%(+5.18)#18 | 6.8%(+3.82)#2,804 |
| 19. | 59601 | 10.4% | 5.4%(+5.04)#19 | 6.8%(+3.68)#2,904 |
| 20. | 59910 | 10.3% | 5.4%(+4.87)#20 | 6.8%(+3.52)#3,005 |
| 21. | 59640 | 9.8% | 5.4%(+4.35)#21 | 6.8%(+2.99)#3,403 |
| 22. | 59840 | 9.7% | 5.4%(+4.25)#22 | 6.8%(+2.89)#3,476 |
| 23. | 59721 | 9.3% | 5.4%(+3.92)#23 | 6.8%(+2.57)#3,753 |
| 24. | 59936 | 9.3% | 5.4%(+3.91)#24 | 6.8%(+2.56)#3,764 |
| 25. | 59218 | 9.1% | 5.4%(+3.65)#25 | 6.8%(+2.29)#4,010 |
| 26. | 59634 | 9.0% | 5.4%(+3.62)#26 | 6.8%(+2.26)#4,037 |
| 27. | 59926 | 8.9% | 5.4%(+3.48)#27 | 6.8%(+2.12)#4,184 |
| 28. | 59718 | 8.7% | 5.4%(+3.31)#28 | 6.8%(+1.95)#4,346 |
| 29. | 59031 | 8.6% | 5.4%(+3.21)#29 | 6.8%(+1.86)#4,455 |
| 30. | 59714 | 8.6% | 5.4%(+3.16)#30 | 6.8%(+1.81)#4,528 |
| 31. | 59602 | 8.5% | 5.4%(+3.11)#31 | 6.8%(+1.76)#4,587 |
| 32. | 59853 | 8.4% | 5.4%(+3.03)#32 | 6.8%(+1.67)#4,674 |
| 33. | 59801 | 8.4% | 5.4%(+2.98)#33 | 6.8%(+1.62)#4,727 |
| 34. | 59433 | 8.4% | 5.4%(+2.96)#34 | 6.8%(+1.61)#4,744 |
| 35. | 59751 | 8.3% | 5.4%(+2.92)#35 | 6.8%(+1.57)#4,808 |
| 36. | 59724 | 8.3% | 5.4%(+2.92)#36 | 6.8%(+1.57)#4,816 |
| 37. | 59219 | 8.2% | 5.4%(+2.77)#37 | 6.8%(+1.42)#5,021 |
| 38. | 59732 | 8.1% | 5.4%(+2.68)#38 | 6.8%(+1.32)#5,154 |
| 39. | 59748 | 7.8% | 5.4%(+2.40)#39 | 6.8%(+1.05)#5,526 |
| 40. | 59061 | 7.8% | 5.4%(+2.40)#40 | 6.8%(+1.05)#5,530 |
| 41. | 59911 | 7.7% | 5.4%(+2.31)#41 | 6.8%(+0.955)#5,662 |
| 42. | 59330 | 7.7% | 5.4%(+2.27)#42 | 6.8%(+0.913)#5,711 |
| 43. | 59916 | 7.5% | 5.4%(+2.14)#43 | 6.8%(+0.782)#5,921 |
| 44. | 59347 | 7.5% | 5.4%(+2.12)#44 | 6.8%(+0.762)#5,956 |
| 45. | 59526 | 7.2% | 5.4%(+1.81)#45 | 6.8%(+0.457)#6,420 |
| 46. | 59804 | 7.2% | 5.4%(+1.76)#46 | 6.8%(+0.400)#6,510 |
| 47. | 59029 | 7.0% | 5.4%(+1.55)#47 | 6.8%(+0.194)#6,873 |
| 48. | 59755 | 6.6% | 5.4%(+1.15)#48 | 6.8%(-0.207)#7,636 |
| 49. | 59722 | 6.5% | 5.4%(+1.10)#49 | 6.8%(-0.259)#7,726 |
| 50. | 59727 | 6.5% | 5.4%(+1.08)#50 | 6.8%(-0.271)#7,753 |
| 51. | 59044 | 6.4% | 5.4%(+0.961)#51 | 6.8%(-0.395)#7,987 |
| 52. | 59803 | 6.3% | 5.4%(+0.871)#52 | 6.8%(-0.485)#8,178 |
| 53. | 59079 | 6.2% | 5.4%(+0.793)#53 | 6.8%(-0.563)#8,333 |
| 54. | 59917 | 6.2% | 5.4%(+0.765)#54 | 6.8%(-0.591)#8,412 |
| 55. | 59833 | 6.1% | 5.4%(+0.734)#55 | 6.8%(-0.621)#8,477 |
| 56. | 59716 | 6.1% | 5.4%(+0.730)#56 | 6.8%(-0.625)#8,490 |
| 57. | 59106 | 6.1% | 5.4%(+0.692)#57 | 6.8%(-0.664)#8,592 |
| 58. | 59937 | 6.1% | 5.4%(+0.666)#58 | 6.8%(-0.690)#8,654 |
| 59. | 59418 | 6.1% | 5.4%(+0.652)#59 | 6.8%(-0.704)#8,687 |
| 60. | 59728 | 5.9% | 5.4%(+0.532)#60 | 6.8%(-0.824)#8,974 |
| 61. | 59007 | 5.9% | 5.4%(+0.532)#61 | 6.8%(-0.824)#8,975 |
| 62. | 59252 | 5.9% | 5.4%(+0.473)#62 | 6.8%(-0.882)#9,118 |
| 63. | 59255 | 5.8% | 5.4%(+0.356)#63 | 6.8%(-1.00)#9,381 |
| 64. | 59436 | 5.7% | 5.4%(+0.305)#64 | 6.8%(-1.05)#9,519 |
| 65. | 59105 | 5.6% | 5.4%(+0.225)#65 | 6.8%(-1.13)#9,712 |
| 66. | 59935 | 5.6% | 5.4%(+0.185)#66 | 6.8%(-1.17)#9,816 |
| 67. | 59322 | 5.6% | 5.4%(+0.147)#67 | 6.8%(-1.21)#9,931 |
| 68. | 59002 | 5.5% | 5.4%(+0.085)#68 | 6.8%(-1.27)#10,087 |
| 69. | 59828 | 5.5% | 5.4%(+0.084)#69 | 6.8%(-1.27)#10,092 |
| 70. | 59102 | 5.5% | 5.4%(+0.065)#70 | 6.8%(-1.29)#10,133 |
| 71. | 59243 | 5.4% | 5.4%(+0.021)#71 | 6.8%(-1.33)#10,243 |
| 72. | 59750 | 5.4% | 5.4%(+0.015)#72 | 6.8%(-1.34)#10,261 |
| 73. | 59635 | 5.4% | 5.4%(+0.009)#73 | 6.8%(-1.35)#10,279 |
| 74. | 59338 | 5.3% | 5.4%(-0.076)#74 | 6.8%(-1.43)#10,499 |
| 75. | 59480 | 5.3% | 5.4%(-0.146)#75 | 6.8%(-1.50)#10,659 |
| 76. | 59760 | 5.3% | 5.4%(-0.146)#76 | 6.8%(-1.50)#10,663 |
| 77. | 59253 | 5.3% | 5.4%(-0.146)#77 | 6.8%(-1.50)#10,666 |
| 78. | 59873 | 5.3% | 5.4%(-0.152)#78 | 6.8%(-1.51)#10,681 |
| 79. | 59701 | 5.2% | 5.4%(-0.227)#79 | 6.8%(-1.58)#10,864 |
| 80. | 59523 | 5.2% | 5.4%(-0.232)#80 | 6.8%(-1.59)#10,875 |
| 81. | 59421 | 5.1% | 5.4%(-0.269)#81 | 6.8%(-1.62)#10,972 |
| 82. | 59457 | 5.1% | 5.4%(-0.317)#82 | 6.8%(-1.67)#11,113 |
| 83. | 59823 | 5.1% | 5.4%(-0.344)#83 | 6.8%(-1.70)#11,192 |
| 84. | 59758 | 5.0% | 5.4%(-0.378)#84 | 6.8%(-1.73)#11,270 |
| 85. | 59404 | 5.0% | 5.4%(-0.379)#85 | 6.8%(-1.73)#11,272 |
| 86. | 59802 | 5.0% | 5.4%(-0.391)#86 | 6.8%(-1.75)#11,310 |
| 87. | 59485 | 5.0% | 5.4%(-0.393)#87 | 6.8%(-1.75)#11,329 |
| 88. | 59735 | 4.9% | 5.4%(-0.479)#88 | 6.8%(-1.84)#11,569 |
| 89. | 59923 | 4.9% | 5.4%(-0.544)#89 | 6.8%(-1.90)#11,760 |
| 90. | 59925 | 4.8% | 5.4%(-0.628)#90 | 6.8%(-1.98)#11,993 |
| 91. | 59633 | 4.6% | 5.4%(-0.785)#91 | 6.8%(-2.14)#12,421 |
| 92. | 59230 | 4.6% | 5.4%(-0.795)#92 | 6.8%(-2.15)#12,454 |
| 93. | 59825 | 4.6% | 5.4%(-0.798)#93 | 6.8%(-2.15)#12,461 |
| 94. | 59829 | 4.6% | 5.4%(-0.858)#94 | 6.8%(-2.21)#12,656 |
| 95. | 59068 | 4.5% | 5.4%(-0.939)#95 | 6.8%(-2.29)#12,909 |
| 96. | 59072 | 4.5% | 5.4%(-0.946)#96 | 6.8%(-2.30)#12,939 |
| 97. | 59414 | 4.4% | 5.4%(-0.972)#97 | 6.8%(-2.33)#13,046 |
| 98. | 59501 | 4.4% | 5.4%(-0.981)#98 | 6.8%(-2.34)#13,079 |
| 99. | 59820 | 4.4% | 5.4%(-0.985)#99 | 6.8%(-2.34)#13,090 |
| 100. | 59447 | 4.4% | 5.4%(-1.01)#100 | 6.8%(-2.36)#13,157 |
Common Questions
What are the Top 10 Zip Codes with the Highest Percentage of Population Employed in Computer, Engineering & Science in Montana?
Top 10 Zip Codes with the Highest Percentage of Population Employed in Computer, Engineering & Science in Montana are:
What zip code has the Highest Percentage of Population Employed in Computer, Engineering & Science in Montana?
59081 has the Highest Percentage of Population Employed in Computer, Engineering & Science in Montana with 56.9%.
What is the Percentage of Population Employed in Computer, Engineering & Science in the State of Montana?
Percentage of Population Employed in Computer, Engineering & Science in Montana is 5.4%.
What is the Percentage of Population Employed in Computer, Engineering & Science in the United States?
Percentage of Population Employed in Computer, Engineering & Science in the United States is 6.8%.