Zip Codes with the Highest Percentage of Population Employed in Computer, Engineering & Science in Billings, MT
RELATED REPORTS & OPTIONS
Computer, Engineering & Science
Billings
Compare Zip Codes
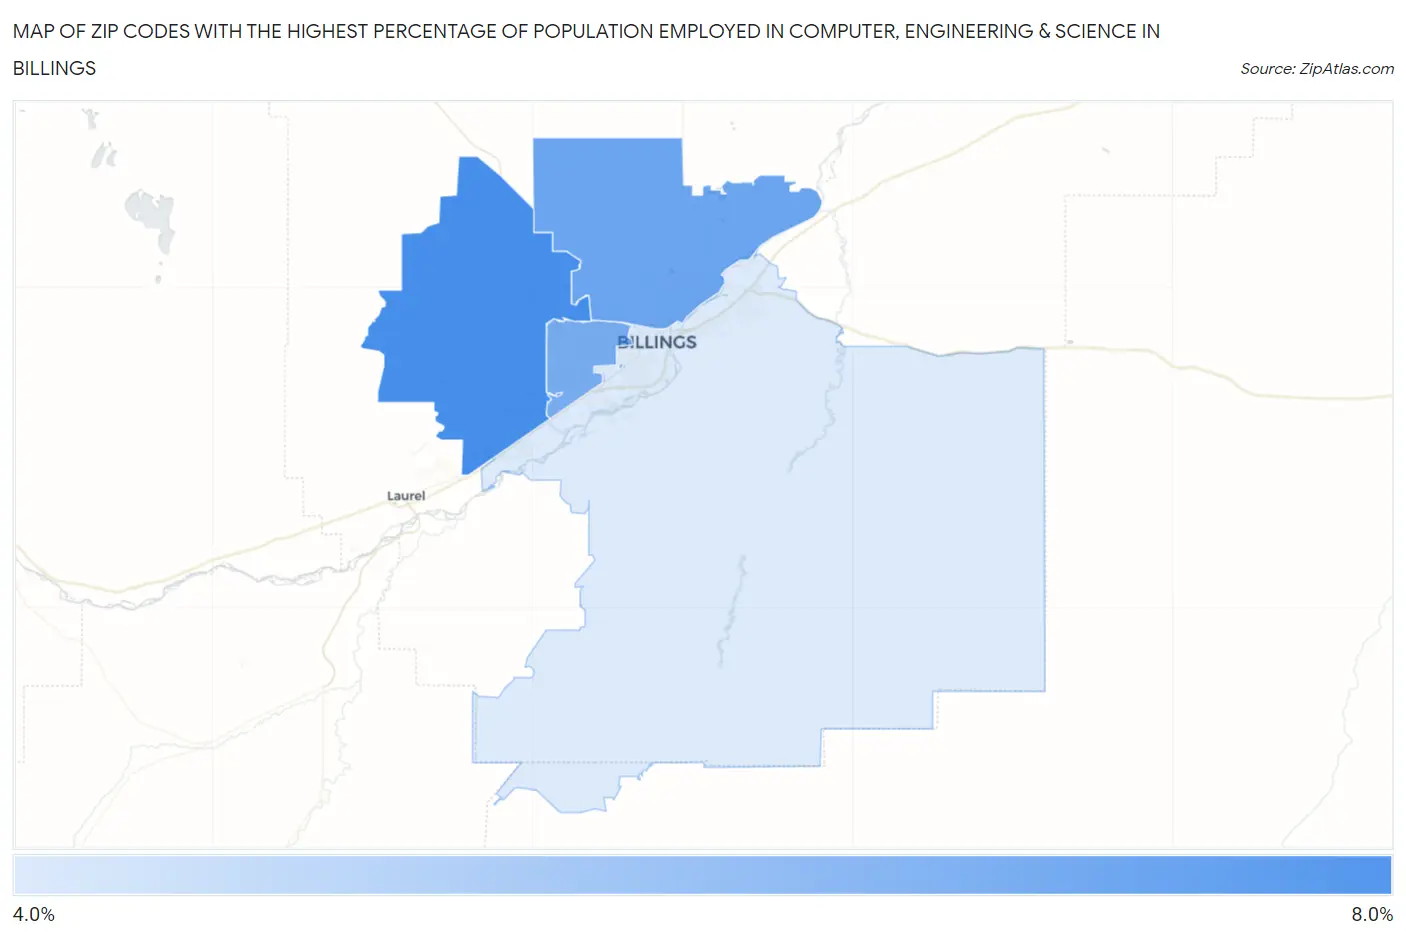
Map of Zip Codes with the Highest Percentage of Population Employed in Computer, Engineering & Science in Billings
4.2%
6.1%
Zip Codes with the Highest Percentage of Population Employed in Computer, Engineering & Science in Billings, MT
| Zip Code | % Employed | vs State | vs National | |
| 1. | 59106 | 6.1% | 5.4%(+0.692)#57 | 6.8%(-0.664)#8,592 |
| 2. | 59105 | 5.6% | 5.4%(+0.225)#65 | 6.8%(-1.13)#9,712 |
| 3. | 59102 | 5.5% | 5.4%(+0.065)#70 | 6.8%(-1.29)#10,133 |
| 4. | 59101 | 4.2% | 5.4%(-1.22)#102 | 6.8%(-2.57)#13,875 |
1
Common Questions
What are the Top 3 Zip Codes with the Highest Percentage of Population Employed in Computer, Engineering & Science in Billings, MT?
Top 3 Zip Codes with the Highest Percentage of Population Employed in Computer, Engineering & Science in Billings, MT are:
What zip code has the Highest Percentage of Population Employed in Computer, Engineering & Science in Billings, MT?
59106 has the Highest Percentage of Population Employed in Computer, Engineering & Science in Billings, MT with 6.1%.
What is the Percentage of Population Employed in Computer, Engineering & Science in Billings, MT?
Percentage of Population Employed in Computer, Engineering & Science in Billings is 5.2%.
What is the Percentage of Population Employed in Computer, Engineering & Science in Montana?
Percentage of Population Employed in Computer, Engineering & Science in Montana is 5.4%.
What is the Percentage of Population Employed in Computer, Engineering & Science in the United States?
Percentage of Population Employed in Computer, Engineering & Science in the United States is 6.8%.