Parker School, MT Map & Demographics
Parker School Map
Parker School Overview
$11,550
PER CAPITA INCOME
$14,519
AVG FAMILY INCOME
0.42
INEQUALITY / GINI INDEX
387
TOTAL POPULATION
247
MALE POPULATION
140
FEMALE POPULATION
176.43
MALES / 100 FEMALES
56.68
FEMALES / 100 MALES
24.6
MEDIAN AGE
3.1
AVG FAMILY SIZE
3.3
AVG HOUSEHOLD SIZE
72
LABOR FORCE [ PEOPLE ]
26.3%
PERCENT IN LABOR FORCE
Income in Parker School
Income Overview in Parker School
| Characteristic | Number | Measure |
| Per Capita Income | 387 | $11,550 |
| Median Family Income | 118 | $14,519 |
| Mean Family Income | 118 | $29,871 |
| Median Household Income | 118 | $0 |
| Mean Household Income | 118 | $37,468 |
| Income Deficit | 118 | $0 |
| Wage / Income Gap (%) | 387 | 0.00% |
| Wage / Income Gap ($) | 387 | 100.00¢ per $1 |
| Gini / Inequality Index | 387 | 0.42 |
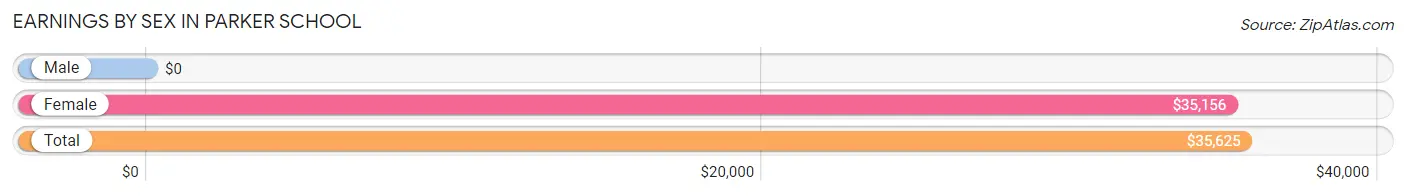
Earnings by Sex in Parker School
| Sex | Number | Average Earnings |
| Male | 53 (49.1%) | $0 |
| Female | 55 (50.9%) | $35,156 |
| Total | 108 (100.0%) | $35,625 |
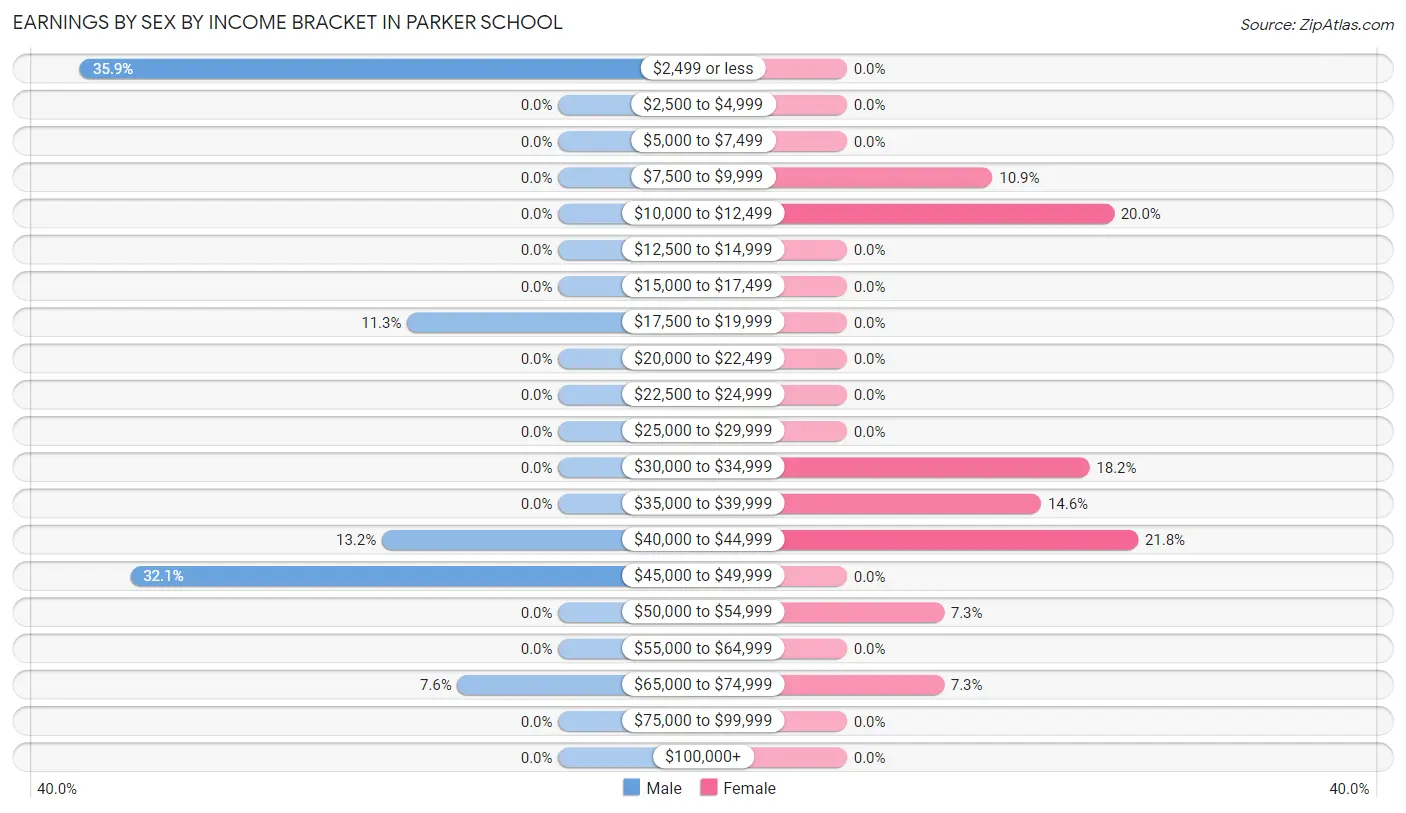
Earnings by Sex by Income Bracket in Parker School
The most common earnings brackets in Parker School are $2,499 or less for men (19 | 35.8%) and $40,000 to $44,999 for women (12 | 21.8%).
| Income | Male | Female |
| $2,499 or less | 19 (35.8%) | 0 (0.0%) |
| $2,500 to $4,999 | 0 (0.0%) | 0 (0.0%) |
| $5,000 to $7,499 | 0 (0.0%) | 0 (0.0%) |
| $7,500 to $9,999 | 0 (0.0%) | 6 (10.9%) |
| $10,000 to $12,499 | 0 (0.0%) | 11 (20.0%) |
| $12,500 to $14,999 | 0 (0.0%) | 0 (0.0%) |
| $15,000 to $17,499 | 0 (0.0%) | 0 (0.0%) |
| $17,500 to $19,999 | 6 (11.3%) | 0 (0.0%) |
| $20,000 to $22,499 | 0 (0.0%) | 0 (0.0%) |
| $22,500 to $24,999 | 0 (0.0%) | 0 (0.0%) |
| $25,000 to $29,999 | 0 (0.0%) | 0 (0.0%) |
| $30,000 to $34,999 | 0 (0.0%) | 10 (18.2%) |
| $35,000 to $39,999 | 0 (0.0%) | 8 (14.5%) |
| $40,000 to $44,999 | 7 (13.2%) | 12 (21.8%) |
| $45,000 to $49,999 | 17 (32.1%) | 0 (0.0%) |
| $50,000 to $54,999 | 0 (0.0%) | 4 (7.3%) |
| $55,000 to $64,999 | 0 (0.0%) | 0 (0.0%) |
| $65,000 to $74,999 | 4 (7.5%) | 4 (7.3%) |
| $75,000 to $99,999 | 0 (0.0%) | 0 (0.0%) |
| $100,000+ | 0 (0.0%) | 0 (0.0%) |
| Total | 53 (100.0%) | 55 (100.0%) |
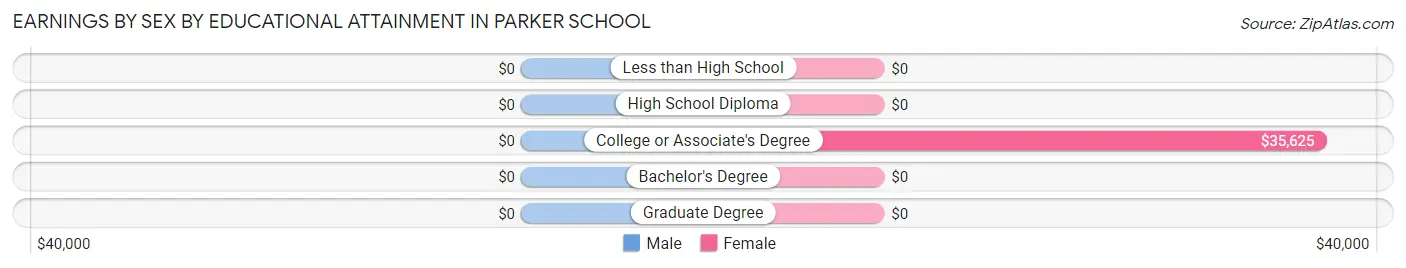
Earnings by Sex by Educational Attainment in Parker School
| Educational Attainment | Male Income | Female Income |
| Less than High School | - | - |
| High School Diploma | - | - |
| College or Associate's Degree | - | - |
| Bachelor's Degree | - | - |
| Graduate Degree | - | - |
| Total | $46,029 | $40,417 |
Family Income in Parker School
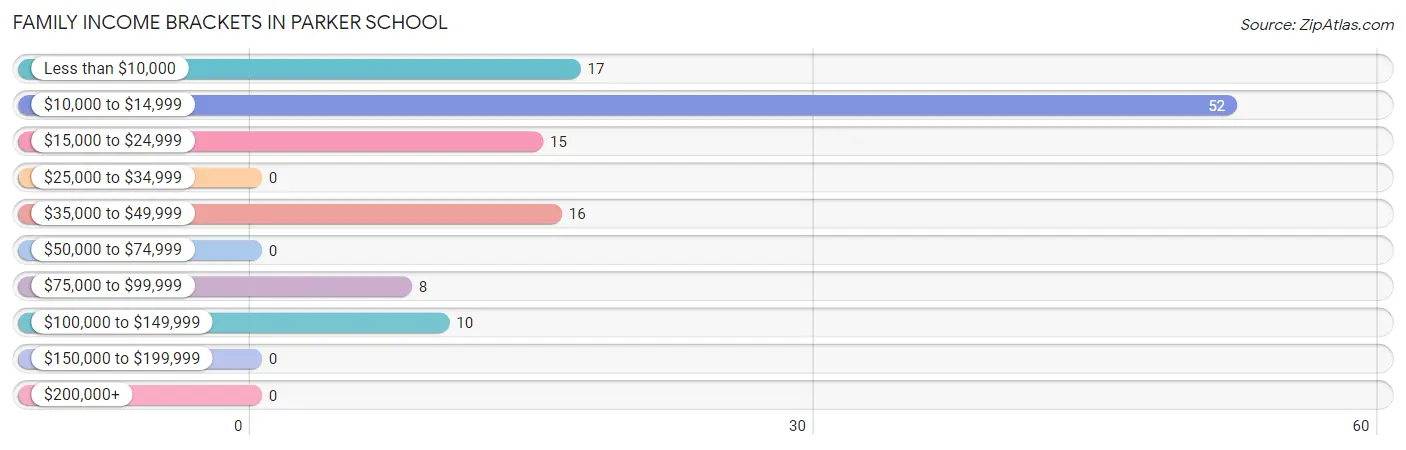
Family Income Brackets in Parker School
According to the Parker School family income data, there are 52 families falling into the $10,000 to $14,999 income range, which is the most common income bracket and makes up 44.1% of all families.
| Income Bracket | # Families | % Families |
| Less than $10,000 | 17 | 14.4% |
| $10,000 to $14,999 | 52 | 44.1% |
| $15,000 to $24,999 | 15 | 12.7% |
| $25,000 to $34,999 | 0 | 0.0% |
| $35,000 to $49,999 | 16 | 13.6% |
| $50,000 to $74,999 | 0 | 0.0% |
| $75,000 to $99,999 | 8 | 6.8% |
| $100,000 to $149,999 | 10 | 8.5% |
| $150,000 to $199,999 | 0 | 0.0% |
| $200,000+ | 0 | 0.0% |
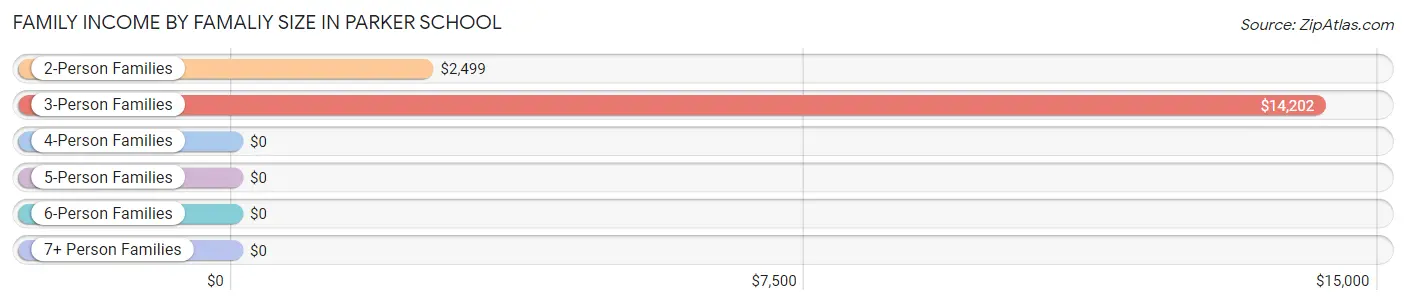
Family Income by Famaliy Size in Parker School
3-person families (64 | 54.2%) account for the highest median family income in Parker School with $14,202 per family, while 3-person families (64 | 54.2%) have the highest median income of $4,734 per family member.
| Income Bracket | # Families | Median Income |
| 2-Person Families | 29 (24.6%) | $2,499 |
| 3-Person Families | 64 (54.2%) | $14,202 |
| 4-Person Families | 9 (7.6%) | $0 |
| 5-Person Families | 4 (3.4%) | $0 |
| 6-Person Families | 12 (10.2%) | $0 |
| 7+ Person Families | 0 (0.0%) | $0 |
| Total | 118 (100.0%) | $14,519 |
Family Income by Number of Earners in Parker School
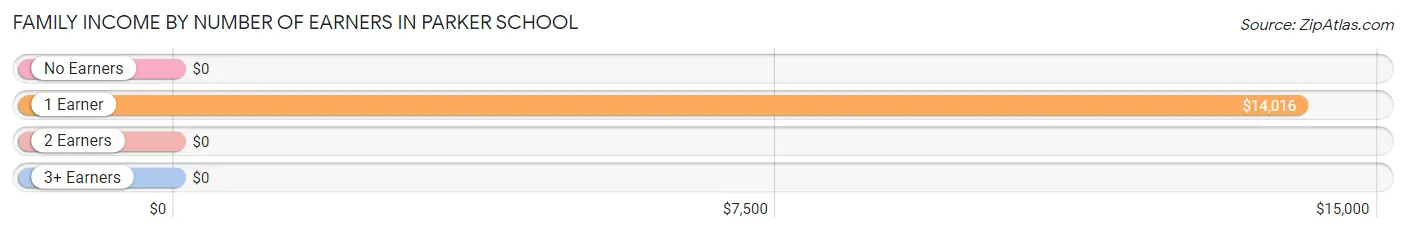
| Number of Earners | # Families | Median Income |
| No Earners | 37 (31.4%) | $0 |
| 1 Earner | 57 (48.3%) | $14,016 |
| 2 Earners | 18 (15.2%) | $0 |
| 3+ Earners | 6 (5.1%) | $0 |
| Total | 118 (100.0%) | $14,519 |
Household Income in Parker School
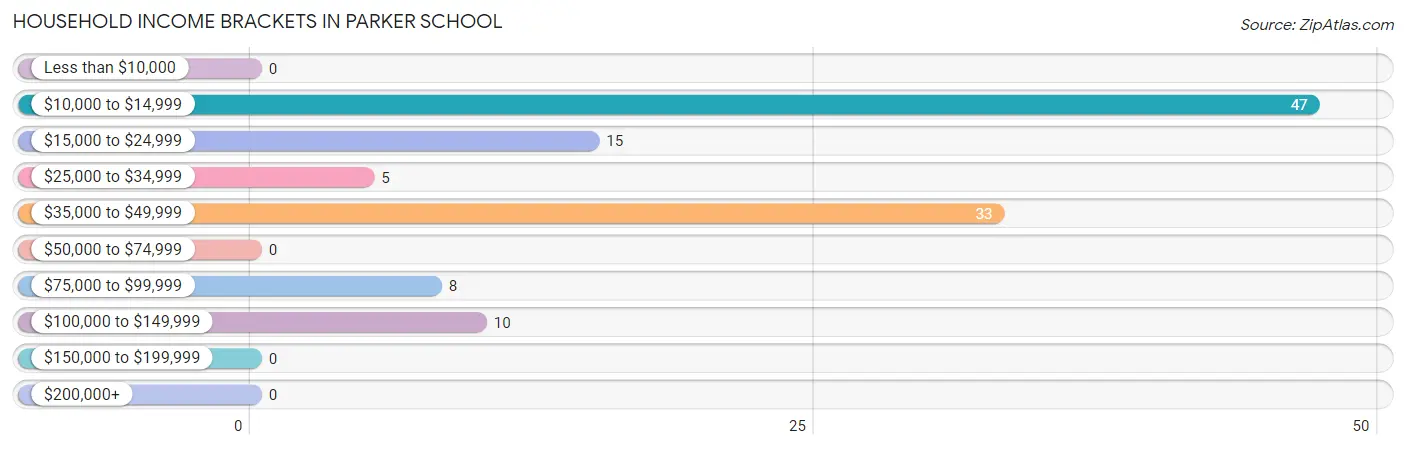
Household Income Brackets in Parker School
With 47 households falling in the category, the $10,000 to $14,999 income range is the most frequent in Parker School, accounting for 39.8% of all households.
| Income Bracket | # Households | % Households |
| Less than $10,000 | 0 | 0.0% |
| $10,000 to $14,999 | 47 | 39.8% |
| $15,000 to $24,999 | 15 | 12.7% |
| $25,000 to $34,999 | 5 | 4.2% |
| $35,000 to $49,999 | 33 | 28.0% |
| $50,000 to $74,999 | 0 | 0.0% |
| $75,000 to $99,999 | 8 | 6.8% |
| $100,000 to $149,999 | 10 | 8.5% |
| $150,000 to $199,999 | 0 | 0.0% |
| $200,000+ | 0 | 0.0% |
Household Income by Householder Age in Parker School
The median household income in Parker School is $0, with the highest median household income of $45,588 found in the 45 to 64 years age bracket for the primary householder. A total of 54 households (45.8%) fall into this category.
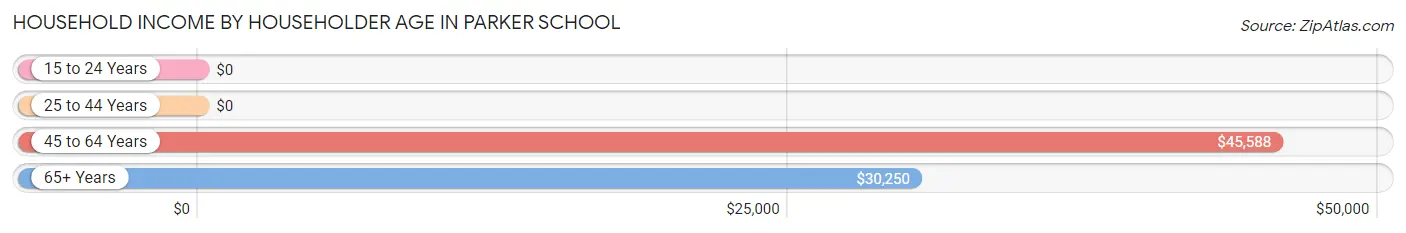
| Income Bracket | # Households | Median Income |
| 15 to 24 Years | 0 (0.0%) | $0 |
| 25 to 44 Years | 47 (39.8%) | $0 |
| 45 to 64 Years | 54 (45.8%) | $45,588 |
| 65+ Years | 17 (14.4%) | $30,250 |
| Total | 118 (100.0%) | $0 |
Poverty in Parker School
Income Below Poverty by Sex and Age in Parker School
With 59.1% poverty level for males and 17.9% for females among the residents of Parker School, 15 year old males and 6 to 11 year old females are the most vulnerable to poverty, with 18 males (100.0%) and 6 females (54.5%) in their respective age groups living below the poverty level.
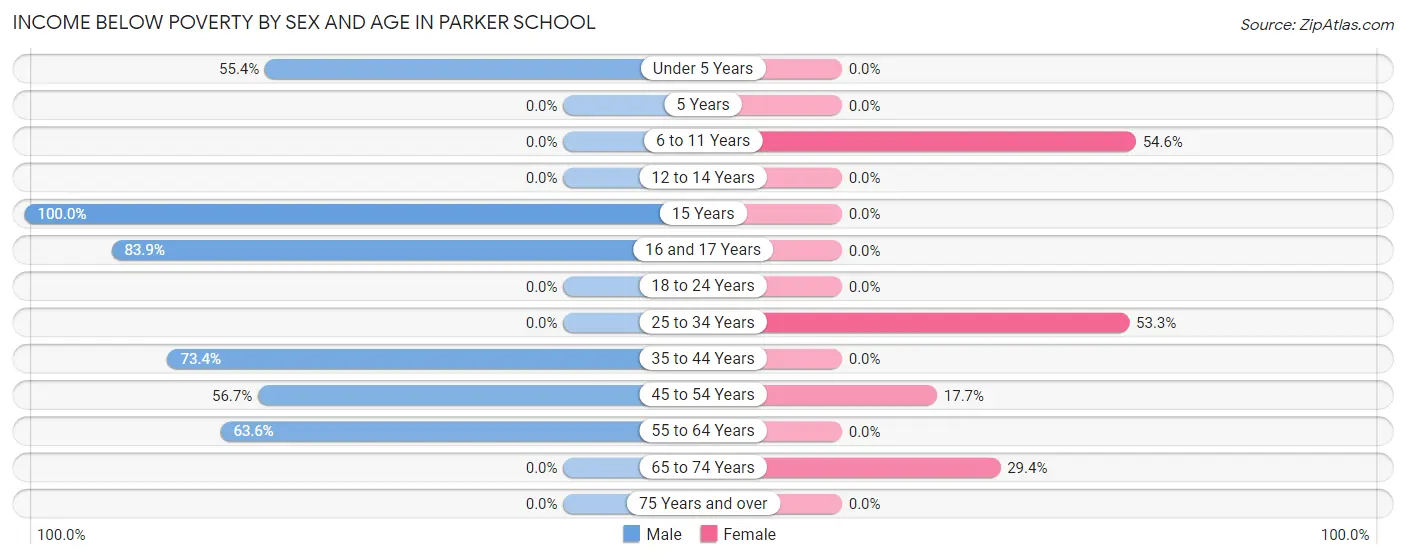
| Age Bracket | Male | Female |
| Under 5 Years | 31 (55.4%) | 0 (0.0%) |
| 5 Years | 0 (0.0%) | 0 (0.0%) |
| 6 to 11 Years | 0 (0.0%) | 6 (54.5%) |
| 12 to 14 Years | 0 (0.0%) | 0 (0.0%) |
| 15 Years | 18 (100.0%) | 0 (0.0%) |
| 16 and 17 Years | 26 (83.9%) | 0 (0.0%) |
| 18 to 24 Years | 0 (0.0%) | 0 (0.0%) |
| 25 to 34 Years | 0 (0.0%) | 8 (53.3%) |
| 35 to 44 Years | 47 (73.4%) | 0 (0.0%) |
| 45 to 54 Years | 17 (56.7%) | 6 (17.6%) |
| 55 to 64 Years | 7 (63.6%) | 0 (0.0%) |
| 65 to 74 Years | 0 (0.0%) | 5 (29.4%) |
| 75 Years and over | 0 (0.0%) | 0 (0.0%) |
| Total | 146 (59.1%) | 25 (17.9%) |
Income Above Poverty by Sex and Age in Parker School
According to the poverty statistics in Parker School, males aged 6 to 11 years and females aged under 5 years are the age groups that are most secure financially, with 100.0% of males and 100.0% of females in these age groups living above the poverty line.
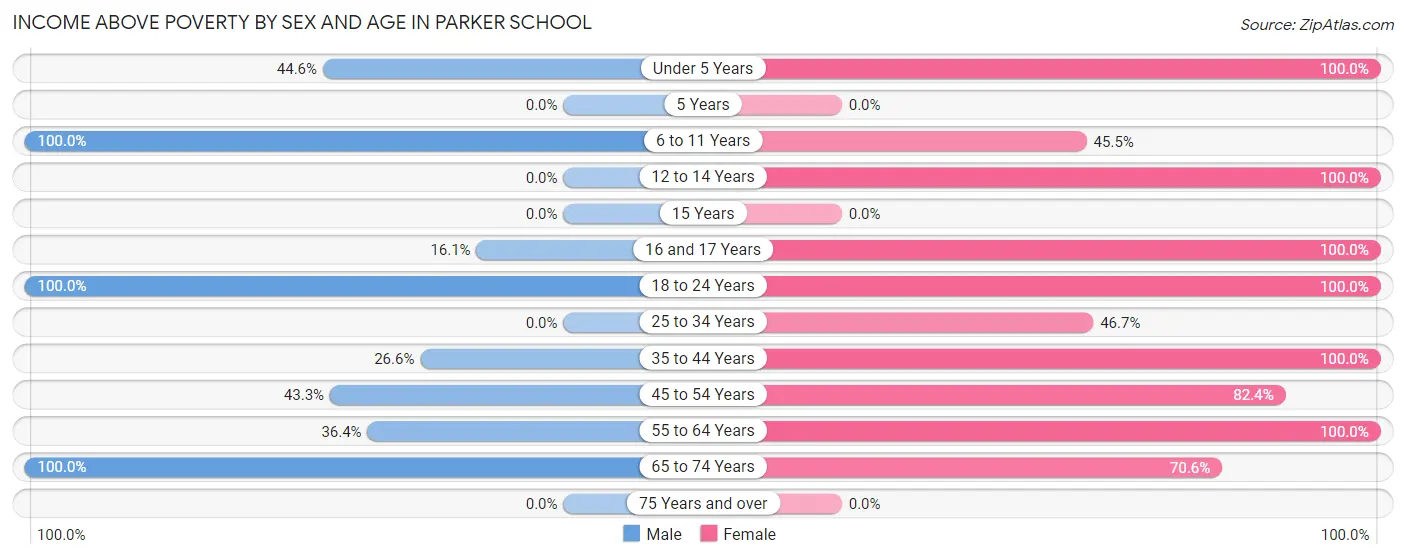
| Age Bracket | Male | Female |
| Under 5 Years | 25 (44.6%) | 8 (100.0%) |
| 5 Years | 0 (0.0%) | 0 (0.0%) |
| 6 to 11 Years | 15 (100.0%) | 5 (45.5%) |
| 12 to 14 Years | 0 (0.0%) | 5 (100.0%) |
| 15 Years | 0 (0.0%) | 0 (0.0%) |
| 16 and 17 Years | 5 (16.1%) | 17 (100.0%) |
| 18 to 24 Years | 14 (100.0%) | 23 (100.0%) |
| 25 to 34 Years | 0 (0.0%) | 7 (46.7%) |
| 35 to 44 Years | 17 (26.6%) | 4 (100.0%) |
| 45 to 54 Years | 13 (43.3%) | 28 (82.4%) |
| 55 to 64 Years | 4 (36.4%) | 6 (100.0%) |
| 65 to 74 Years | 8 (100.0%) | 12 (70.6%) |
| 75 Years and over | 0 (0.0%) | 0 (0.0%) |
| Total | 101 (40.9%) | 115 (82.1%) |
Income Below Poverty Among Married-Couple Families in Parker School
The poverty statistics for married-couple families in Parker School show that 22.6% or 7 of the total 31 families live below the poverty line. Families with 1 or 2 children have the highest poverty rate of 41.2%, comprising of 7 families. On the other hand, families with no children have the lowest poverty rate of 0.0%, which includes 0 families.
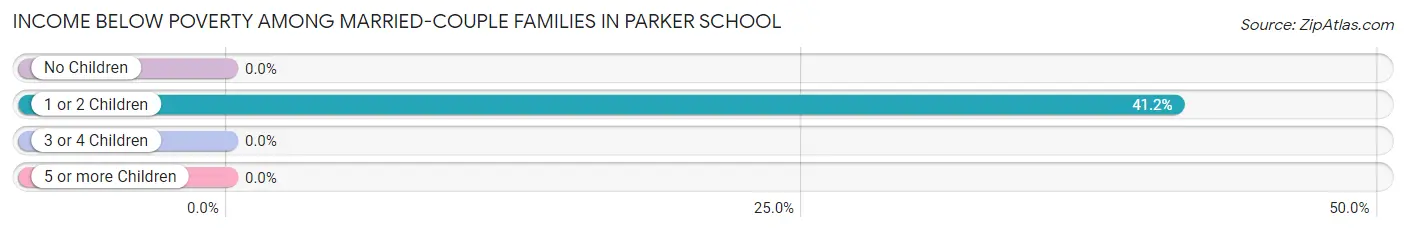
| Children | Above Poverty | Below Poverty |
| No Children | 14 (100.0%) | 0 (0.0%) |
| 1 or 2 Children | 10 (58.8%) | 7 (41.2%) |
| 3 or 4 Children | 0 (0.0%) | 0 (0.0%) |
| 5 or more Children | 0 (0.0%) | 0 (0.0%) |
| Total | 24 (77.4%) | 7 (22.6%) |
Income Below Poverty Among Single-Parent Households in Parker School
According to the poverty data in Parker School, 100.0% or 64 single-father households and 21.7% or 5 single-mother households are living below the poverty line. Among single-father households, those with 1 or 2 children have the highest poverty rate, with 64 households (100.0%) experiencing poverty. Likewise, among single-mother households, those with 1 or 2 children have the highest poverty rate, with 5 households (29.4%) falling below the poverty line.
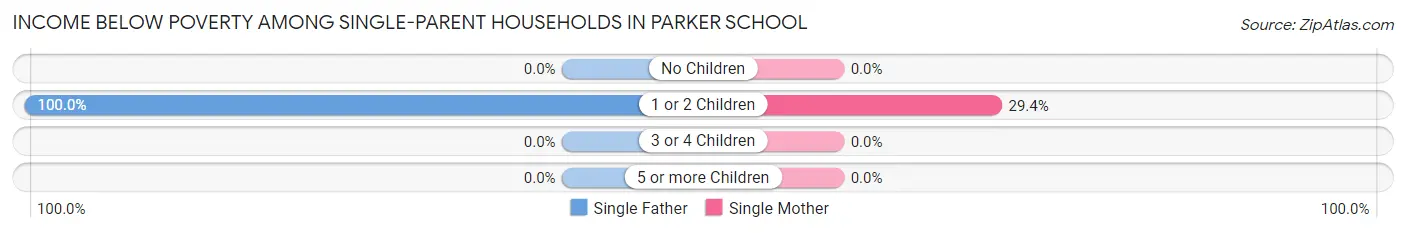
| Children | Single Father | Single Mother |
| No Children | 0 (0.0%) | 0 (0.0%) |
| 1 or 2 Children | 64 (100.0%) | 5 (29.4%) |
| 3 or 4 Children | 0 (0.0%) | 0 (0.0%) |
| 5 or more Children | 0 (0.0%) | 0 (0.0%) |
| Total | 64 (100.0%) | 5 (21.7%) |
Income Below Poverty Among Married-Couple vs Single-Parent Households in Parker School
The poverty data for Parker School shows that 7 of the married-couple family households (22.6%) and 69 of the single-parent households (79.3%) are living below the poverty level. Within the married-couple family households, those with 1 or 2 children have the highest poverty rate, with 7 households (41.2%) falling below the poverty line. Among the single-parent households, those with 1 or 2 children have the highest poverty rate, with 69 household (85.2%) living below poverty.
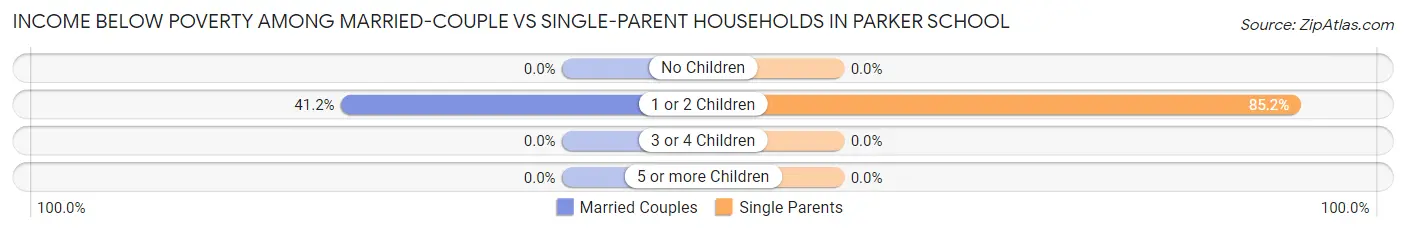
| Children | Married-Couple Families | Single-Parent Households |
| No Children | 0 (0.0%) | 0 (0.0%) |
| 1 or 2 Children | 7 (41.2%) | 69 (85.2%) |
| 3 or 4 Children | 0 (0.0%) | 0 (0.0%) |
| 5 or more Children | 0 (0.0%) | 0 (0.0%) |
| Total | 7 (22.6%) | 69 (79.3%) |
Race in Parker School
The most populous races in Parker School are Native / Alaskan (268 | 69.3%), Two or more Races (111 | 28.7%), and White / Caucasian (8 | 2.1%).
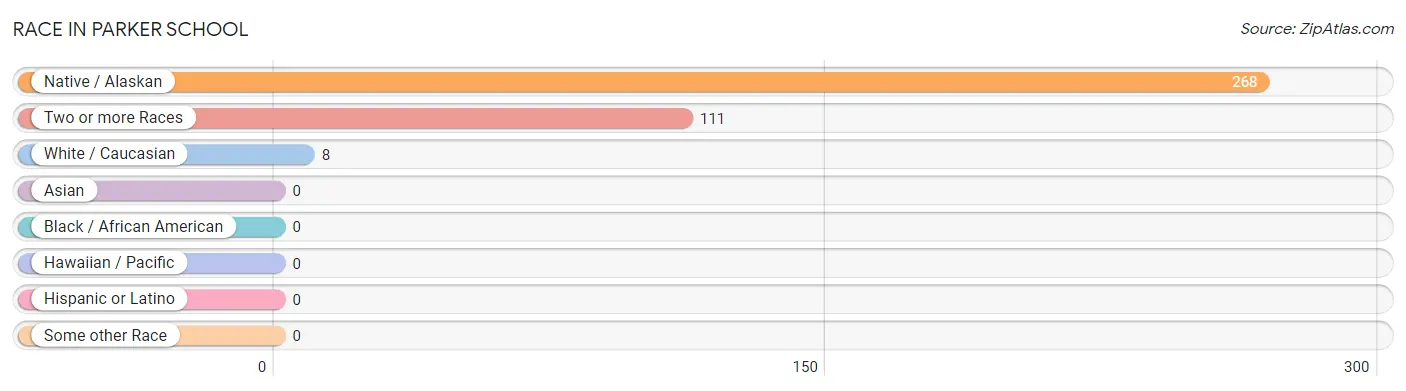
| Race | # Population | % Population |
| Asian | 0 | 0.0% |
| Black / African American | 0 | 0.0% |
| Hawaiian / Pacific | 0 | 0.0% |
| Hispanic or Latino | 0 | 0.0% |
| Native / Alaskan | 268 | 69.3% |
| White / Caucasian | 8 | 2.1% |
| Two or more Races | 111 | 28.7% |
| Some other Race | 0 | 0.0% |
| Total | 387 | 100.0% |
Ancestry in Parker School
The most populous ancestries reported in Parker School are Cree (53 | 13.7%), Irish (18 | 4.6%), English (17 | 4.4%), German (17 | 4.4%), and Ute (13 | 3.4%), together accounting for 30.5% of all Parker School residents.
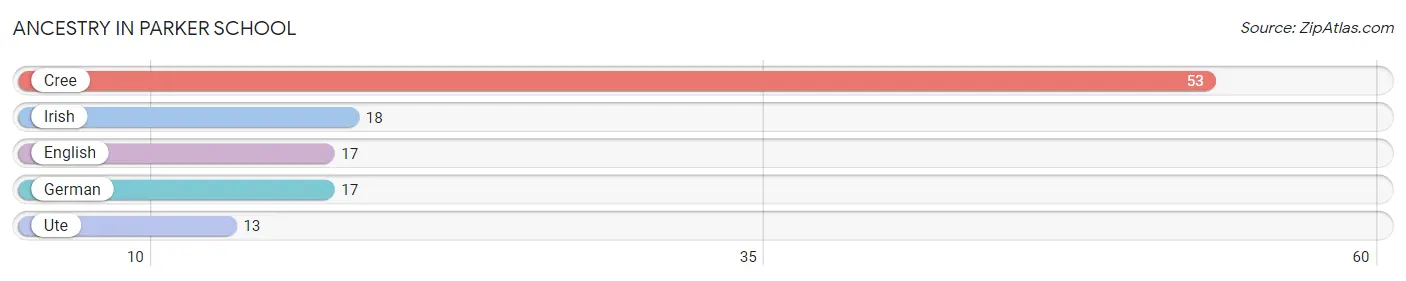
| Ancestry | # Population | % Population |
| Cree | 53 | 13.7% |
| English | 17 | 4.4% |
| German | 17 | 4.4% |
| Irish | 18 | 4.6% |
| Ute | 13 | 3.4% | View All 5 Rows |
Immigrants in Parker School
The most numerous immigrant groups reported in Parker School came from , and Canada (4 | 1.0%), together accounting for 1.0% of all Parker School residents.

| Immigration Origin | # Population | % Population |
| Canada | 4 | 1.0% | View All 1 Rows |
Sex and Age in Parker School
Sex and Age in Parker School
The most populous age groups in Parker School are 40 to 44 Years (64 | 25.9%) for men and 45 to 49 Years (24 | 17.1%) for women.
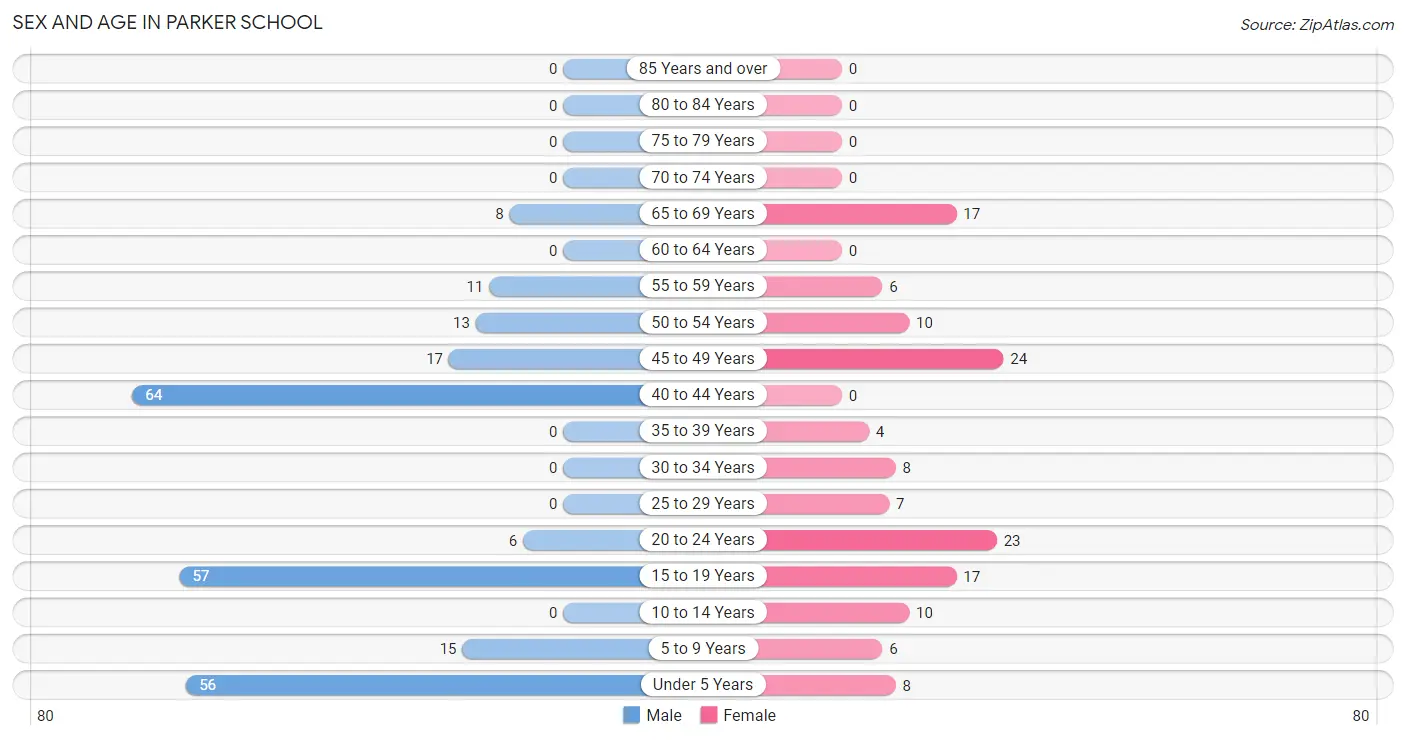
| Age Bracket | Male | Female |
| Under 5 Years | 56 (22.7%) | 8 (5.7%) |
| 5 to 9 Years | 15 (6.1%) | 6 (4.3%) |
| 10 to 14 Years | 0 (0.0%) | 10 (7.1%) |
| 15 to 19 Years | 57 (23.1%) | 17 (12.1%) |
| 20 to 24 Years | 6 (2.4%) | 23 (16.4%) |
| 25 to 29 Years | 0 (0.0%) | 7 (5.0%) |
| 30 to 34 Years | 0 (0.0%) | 8 (5.7%) |
| 35 to 39 Years | 0 (0.0%) | 4 (2.9%) |
| 40 to 44 Years | 64 (25.9%) | 0 (0.0%) |
| 45 to 49 Years | 17 (6.9%) | 24 (17.1%) |
| 50 to 54 Years | 13 (5.3%) | 10 (7.1%) |
| 55 to 59 Years | 11 (4.4%) | 6 (4.3%) |
| 60 to 64 Years | 0 (0.0%) | 0 (0.0%) |
| 65 to 69 Years | 8 (3.2%) | 17 (12.1%) |
| 70 to 74 Years | 0 (0.0%) | 0 (0.0%) |
| 75 to 79 Years | 0 (0.0%) | 0 (0.0%) |
| 80 to 84 Years | 0 (0.0%) | 0 (0.0%) |
| 85 Years and over | 0 (0.0%) | 0 (0.0%) |
| Total | 247 (100.0%) | 140 (100.0%) |
Families and Households in Parker School
Median Family Size in Parker School
The median family size in Parker School is 3.07 persons per family, with single female/mother families (23 | 19.5%) accounting for the largest median family size of 5.35 persons per family. On the other hand, single male/father families (64 | 54.2%) represent the smallest median family size with 1.86 persons per family.
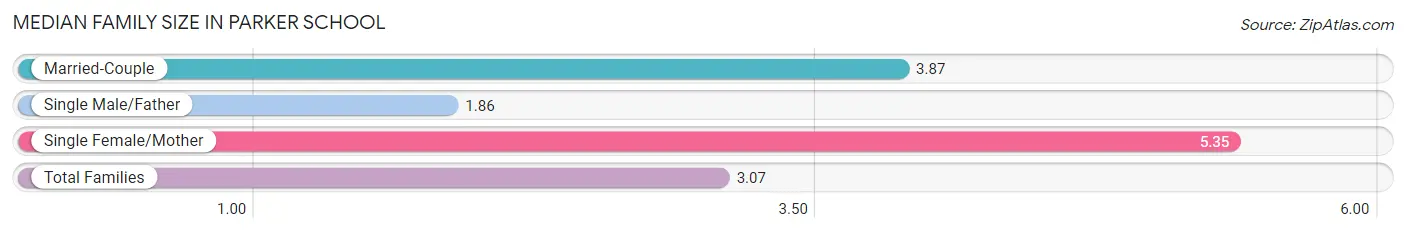
| Family Type | # Families | Family Size |
| Married-Couple | 31 (26.3%) | 3.87 |
| Single Male/Father | 64 (54.2%) | 1.86 |
| Single Female/Mother | 23 (19.5%) | 5.35 |
| Total Families | 118 (100.0%) | 3.07 |
Median Household Size in Parker School
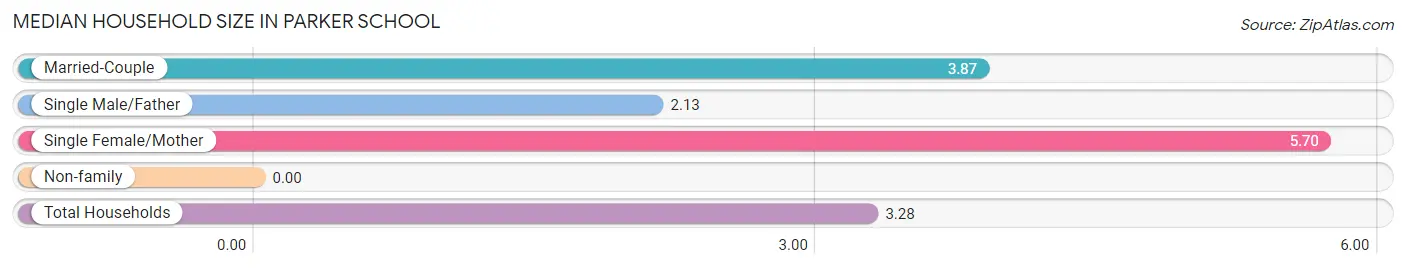
| Household Type | # Households | Household Size |
| Married-Couple | 31 (26.3%) | 3.87 |
| Single Male/Father | 64 (54.2%) | 2.13 |
| Single Female/Mother | 23 (19.5%) | 5.70 |
| Non-family | 0 (0.0%) | - |
| Total Households | 118 (100.0%) | 3.28 |
Household Size by Marriage Status in Parker School
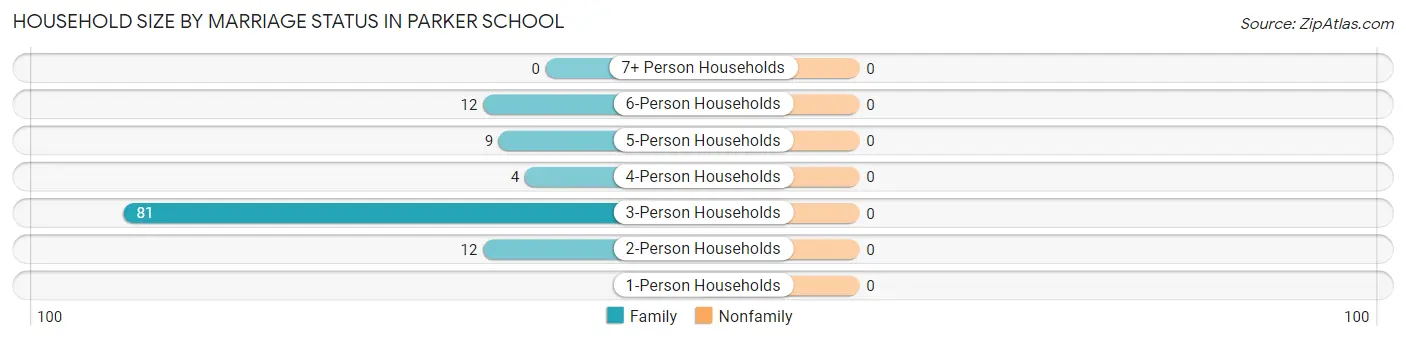
| Household Size | Family Households | Nonfamily Households |
| 1-Person Households | - | 0 (0.0%) |
| 2-Person Households | 12 (10.2%) | 0 (0.0%) |
| 3-Person Households | 81 (68.6%) | 0 (0.0%) |
| 4-Person Households | 4 (3.4%) | 0 (0.0%) |
| 5-Person Households | 9 (7.6%) | 0 (0.0%) |
| 6-Person Households | 12 (10.2%) | 0 (0.0%) |
| 7+ Person Households | 0 (0.0%) | 0 (0.0%) |
| Total | 118 (100.0%) | 0 (0.0%) |
Female Fertility in Parker School
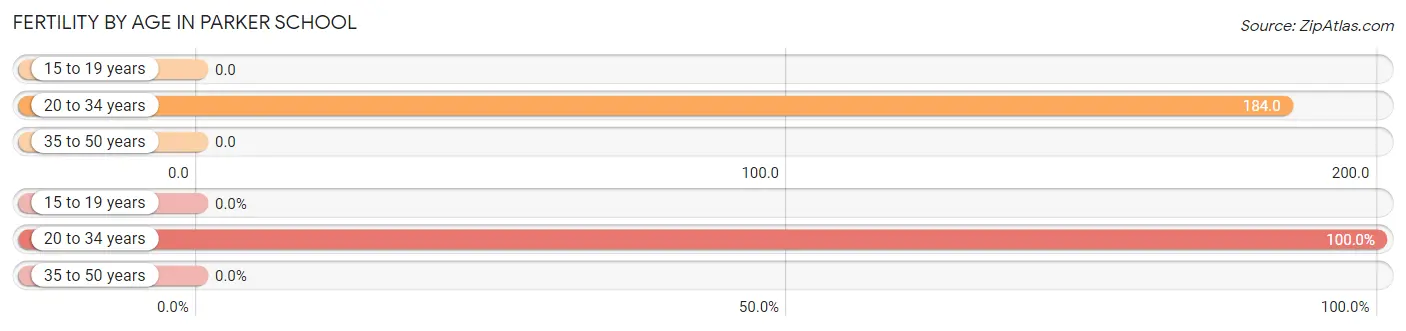
Fertility by Age in Parker School
Average fertility rate in Parker School is 84.0 births per 1,000 women. Women in the age bracket of 20 to 34 years have the highest fertility rate with 184.0 births per 1,000 women. Women in the age bracket of 20 to 34 years acount for 100.0% of all women with births.
| Age Bracket | Women with Births | Births / 1,000 Women |
| 15 to 19 years | 0 (0.0%) | 0.0 |
| 20 to 34 years | 7 (100.0%) | 184.0 |
| 35 to 50 years | 0 (0.0%) | 0.0 |
| Total | 7 (100.0%) | 84.0 |
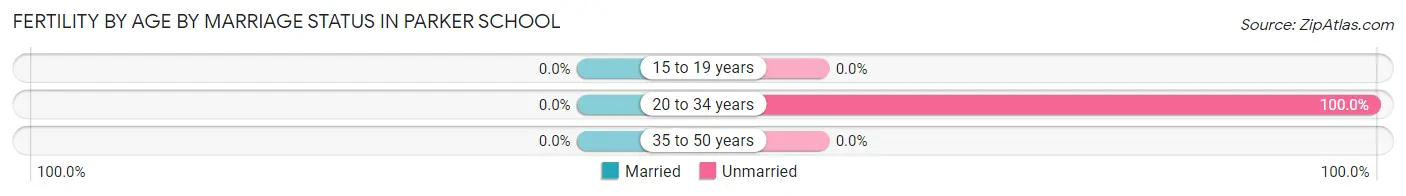
Fertility by Age by Marriage Status in Parker School
| Age Bracket | Married | Unmarried |
| 15 to 19 years | 0 (0.0%) | 0 (0.0%) |
| 20 to 34 years | 0 (0.0%) | 7 (100.0%) |
| 35 to 50 years | 0 (0.0%) | 0 (0.0%) |
| Total | 0 (0.0%) | 7 (100.0%) |
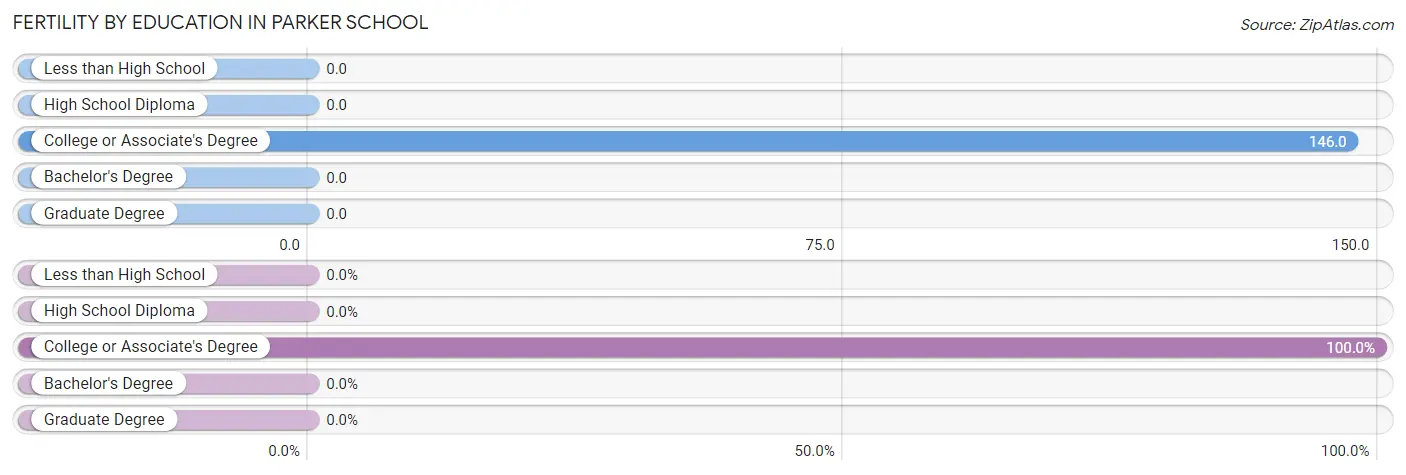
Fertility by Education in Parker School
| Educational Attainment | Women with Births | Births / 1,000 Women |
| Less than High School | 0 (0.0%) | 0.0 |
| High School Diploma | 0 (0.0%) | 0.0 |
| College or Associate's Degree | 7 (100.0%) | 146.0 |
| Bachelor's Degree | 0 (0.0%) | 0.0 |
| Graduate Degree | 0 (0.0%) | 0.0 |
| Total | 7 (100.0%) | 84.0 |
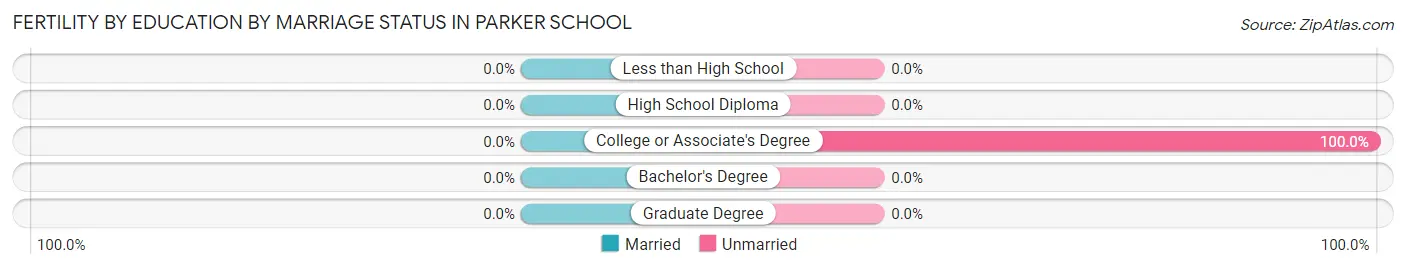
Fertility by Education by Marriage Status in Parker School
| Educational Attainment | Married | Unmarried |
| Less than High School | 0 (0.0%) | 0 (0.0%) |
| High School Diploma | 0 (0.0%) | 0 (0.0%) |
| College or Associate's Degree | 0 (0.0%) | 7 (100.0%) |
| Bachelor's Degree | 0 (0.0%) | 0 (0.0%) |
| Graduate Degree | 0 (0.0%) | 0 (0.0%) |
| Total | 0 (0.0%) | 7 (100.0%) |
Employment Characteristics in Parker School
Employment by Class of Employer in Parker School
Among the 72 employed individuals in Parker School, private company employees (33 | 45.8%), local government employees (32 | 44.4%), and not-for-profit organizations (7 | 9.7%) make up the most common classes of employment.
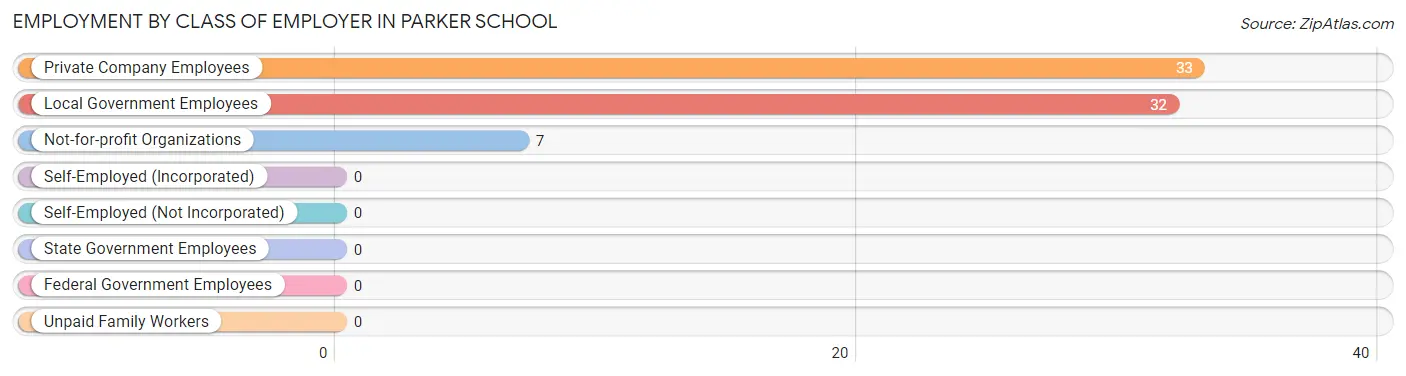
| Employer Class | # Employees | % Employees |
| Private Company Employees | 33 | 45.8% |
| Self-Employed (Incorporated) | 0 | 0.0% |
| Self-Employed (Not Incorporated) | 0 | 0.0% |
| Not-for-profit Organizations | 7 | 9.7% |
| Local Government Employees | 32 | 44.4% |
| State Government Employees | 0 | 0.0% |
| Federal Government Employees | 0 | 0.0% |
| Unpaid Family Workers | 0 | 0.0% |
| Total | 72 | 100.0% |
Employment Status by Age in Parker School
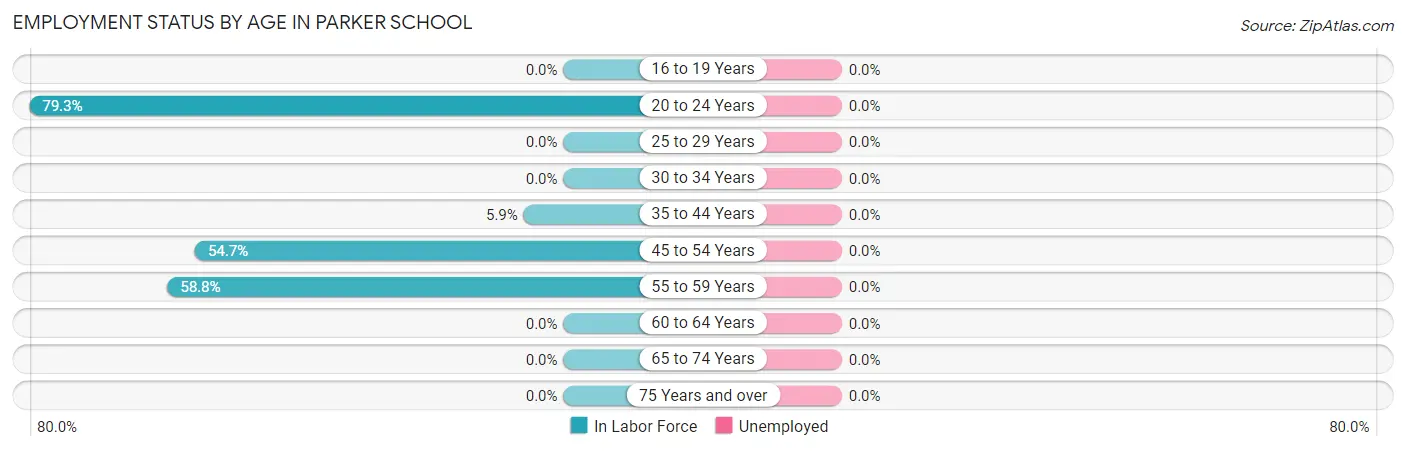
| Age Bracket | In Labor Force | Unemployed |
| 16 to 19 Years | 0 (0.0%) | 0 (0.0%) |
| 20 to 24 Years | 23 (79.3%) | 0 (0.0%) |
| 25 to 29 Years | 0 (0.0%) | 0 (0.0%) |
| 30 to 34 Years | 0 (0.0%) | 0 (0.0%) |
| 35 to 44 Years | 4 (5.9%) | 0 (0.0%) |
| 45 to 54 Years | 35 (54.7%) | 0 (0.0%) |
| 55 to 59 Years | 10 (58.8%) | 0 (0.0%) |
| 60 to 64 Years | 0 (0.0%) | 0 (0.0%) |
| 65 to 74 Years | 0 (0.0%) | 0 (0.0%) |
| 75 Years and over | 0 (0.0%) | 0 (0.0%) |
| Total | 72 (26.3%) | 0 (0.0%) |
Employment Status by Educational Attainment in Parker School
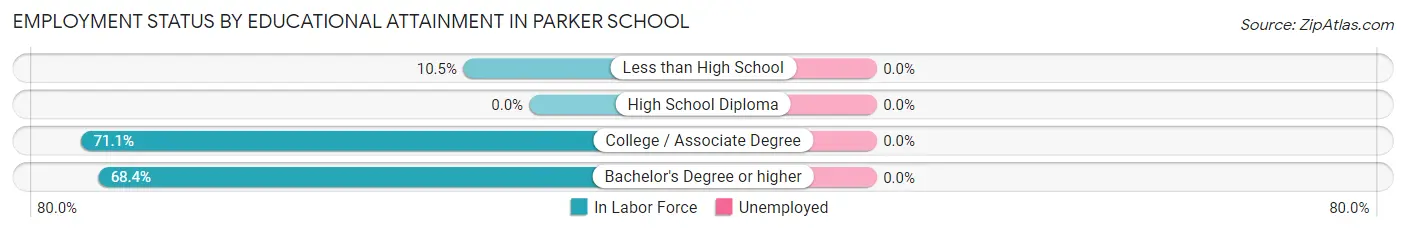
| Educational Attainment | In Labor Force | Unemployed |
| Less than High School | 4 (10.5%) | 0 (0.0%) |
| High School Diploma | 0 (0.0%) | 0 (0.0%) |
| College / Associate Degree | 32 (71.1%) | 0 (0.0%) |
| Bachelor's Degree or higher | 13 (68.4%) | 0 (0.0%) |
| Total | 49 (29.9%) | 0 (0.0%) |
Employment Occupations by Sex in Parker School
Management, Business, Science and Arts Occupations
The most common Management, Business, Science and Arts occupations in Parker School are Management (13 | 18.1%), Community & Social Service (6 | 8.3%), Education, Arts & Media (6 | 8.3%), Computers, Engineering & Science (4 | 5.6%), and Computers & Mathematics (4 | 5.6%).
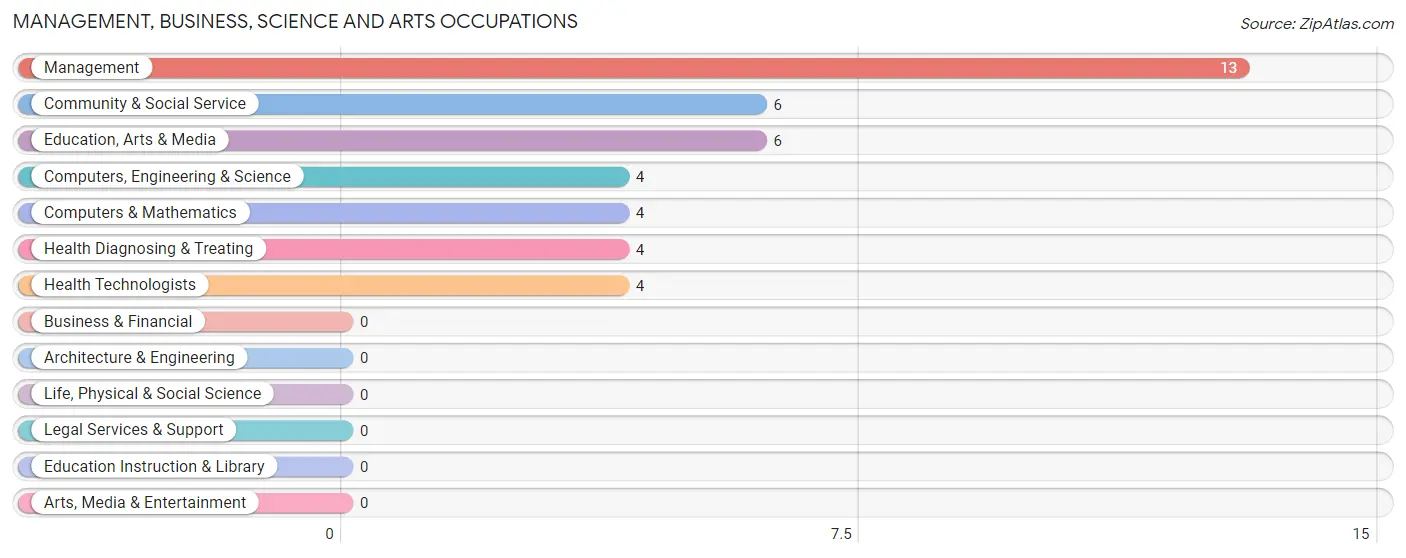
Management, Business, Science and Arts Occupations by Sex
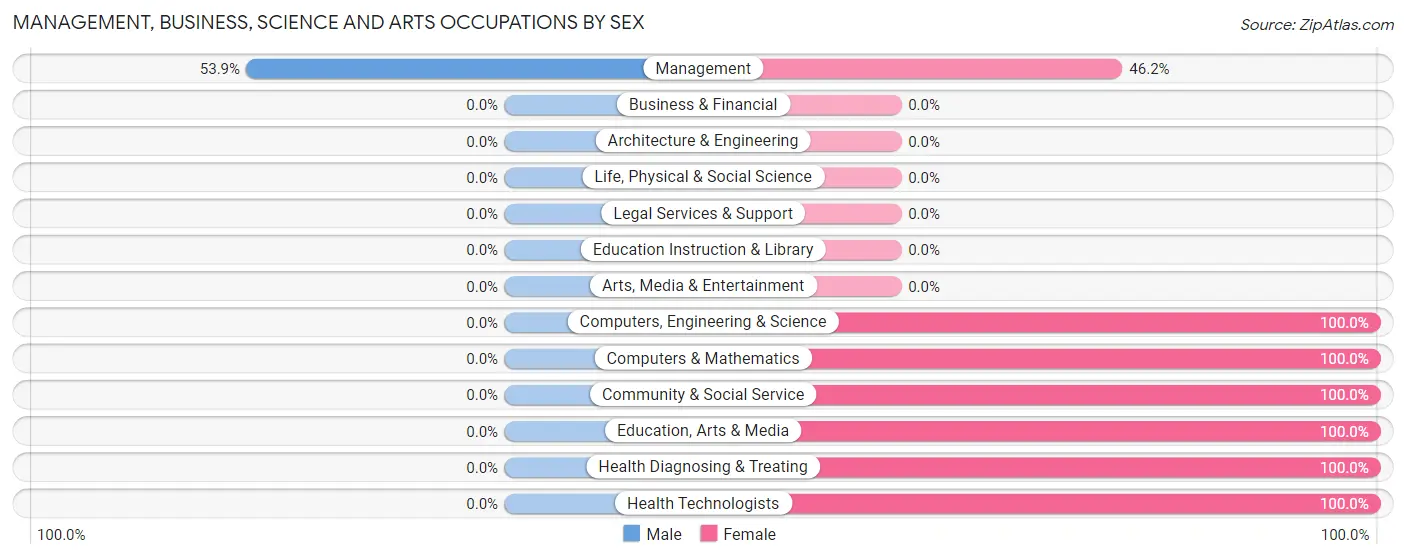
| Occupation | Male | Female |
| Management | 7 (53.8%) | 6 (46.2%) |
| Business & Financial | 0 (0.0%) | 0 (0.0%) |
| Computers, Engineering & Science | 0 (0.0%) | 4 (100.0%) |
| Computers & Mathematics | 0 (0.0%) | 4 (100.0%) |
| Architecture & Engineering | 0 (0.0%) | 0 (0.0%) |
| Life, Physical & Social Science | 0 (0.0%) | 0 (0.0%) |
| Community & Social Service | 0 (0.0%) | 6 (100.0%) |
| Education, Arts & Media | 0 (0.0%) | 6 (100.0%) |
| Legal Services & Support | 0 (0.0%) | 0 (0.0%) |
| Education Instruction & Library | 0 (0.0%) | 0 (0.0%) |
| Arts, Media & Entertainment | 0 (0.0%) | 0 (0.0%) |
| Health Diagnosing & Treating | 0 (0.0%) | 4 (100.0%) |
| Health Technologists | 0 (0.0%) | 4 (100.0%) |
| Total (Category) | 7 (25.9%) | 20 (74.1%) |
| Total (Overall) | 17 (23.6%) | 55 (76.4%) |
Services Occupations
The most common Services occupations in Parker School are Cleaning & Maintenance (8 | 11.1%), and Personal Care & Service (4 | 5.6%).
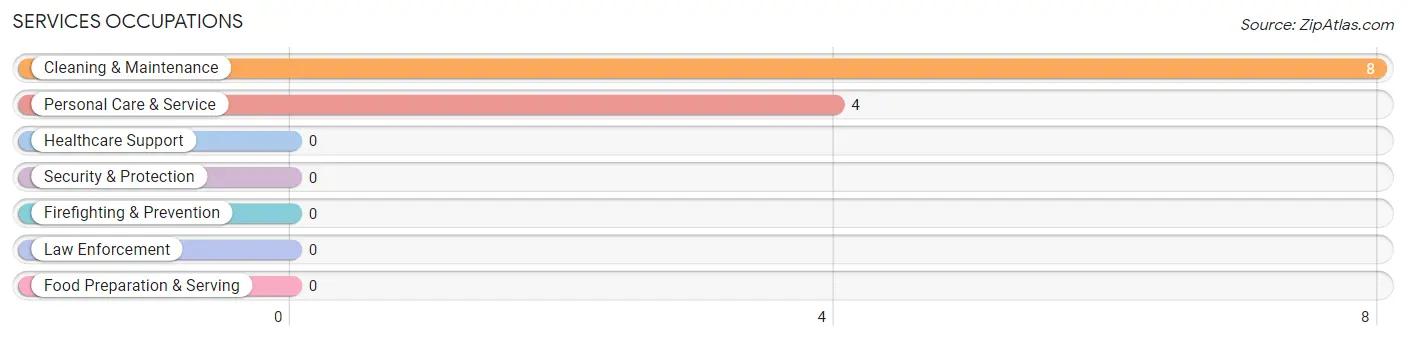
Services Occupations by Sex
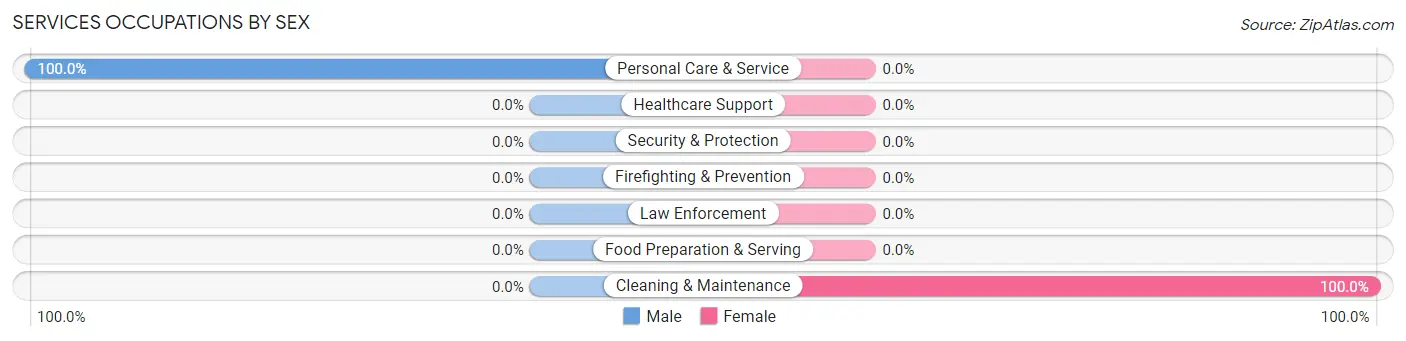
| Occupation | Male | Female |
| Healthcare Support | 0 (0.0%) | 0 (0.0%) |
| Security & Protection | 0 (0.0%) | 0 (0.0%) |
| Firefighting & Prevention | 0 (0.0%) | 0 (0.0%) |
| Law Enforcement | 0 (0.0%) | 0 (0.0%) |
| Food Preparation & Serving | 0 (0.0%) | 0 (0.0%) |
| Cleaning & Maintenance | 0 (0.0%) | 8 (100.0%) |
| Personal Care & Service | 4 (100.0%) | 0 (0.0%) |
| Total (Category) | 4 (33.3%) | 8 (66.7%) |
| Total (Overall) | 17 (23.6%) | 55 (76.4%) |
Sales and Office Occupations
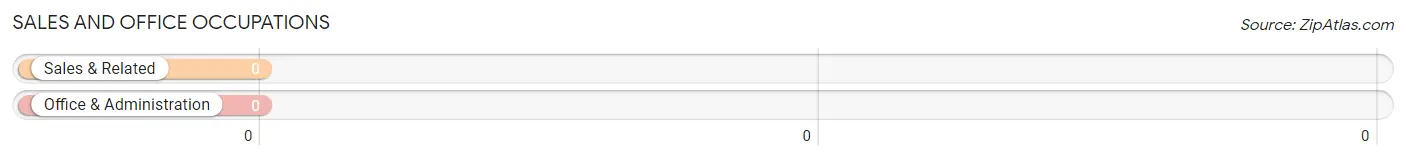
Sales and Office Occupations by Sex
| Occupation | Male | Female |
| Sales & Related | 0 (0.0%) | 0 (0.0%) |
| Office & Administration | 0 (0.0%) | 0 (0.0%) |
| Total (Category) | 0 (0.0%) | 0 (0.0%) |
| Total (Overall) | 17 (23.6%) | 55 (76.4%) |
Natural Resources, Construction and Maintenance Occupations
The most common Natural Resources, Construction and Maintenance occupations in Parker School are , and Installation, Maintenance & Repair (6 | 8.3%).
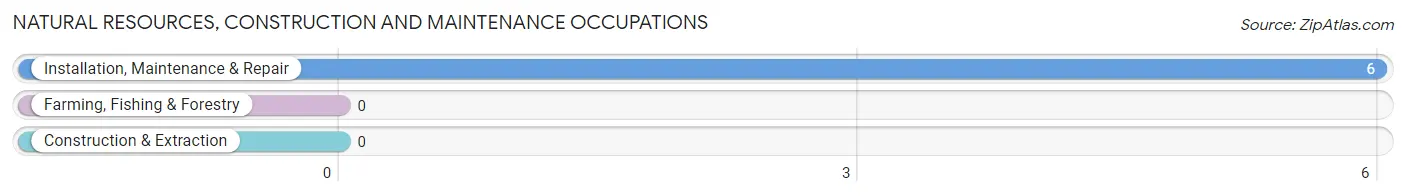
Natural Resources, Construction and Maintenance Occupations by Sex
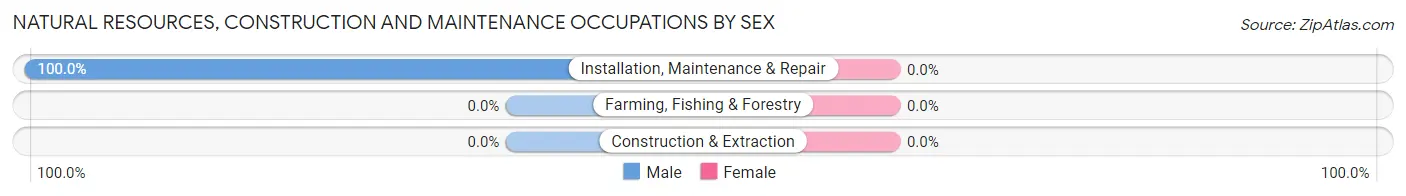
| Occupation | Male | Female |
| Farming, Fishing & Forestry | 0 (0.0%) | 0 (0.0%) |
| Construction & Extraction | 0 (0.0%) | 0 (0.0%) |
| Installation, Maintenance & Repair | 6 (100.0%) | 0 (0.0%) |
| Total (Category) | 6 (100.0%) | 0 (0.0%) |
| Total (Overall) | 17 (23.6%) | 55 (76.4%) |
Production, Transportation and Moving Occupations
The most common Production, Transportation and Moving occupations in Parker School are , and Material Moving (27 | 37.5%).
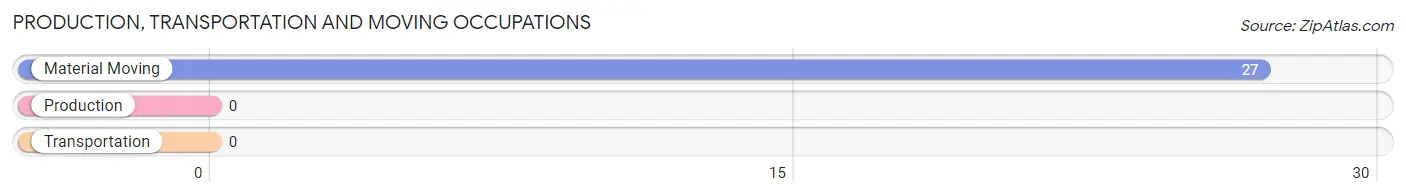
Production, Transportation and Moving Occupations by Sex
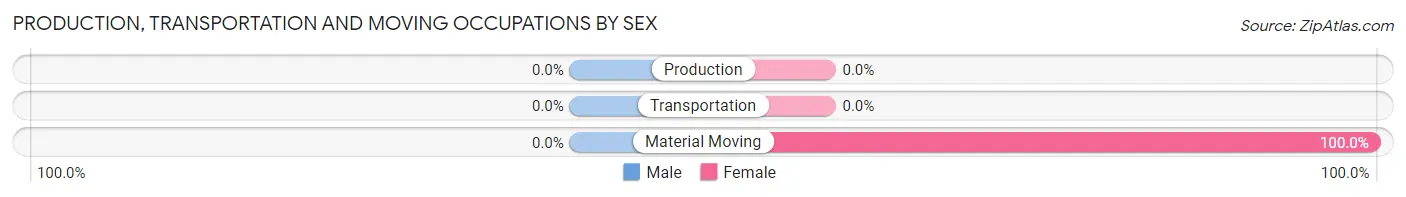
| Occupation | Male | Female |
| Production | 0 (0.0%) | 0 (0.0%) |
| Transportation | 0 (0.0%) | 0 (0.0%) |
| Material Moving | 0 (0.0%) | 27 (100.0%) |
| Total (Category) | 0 (0.0%) | 27 (100.0%) |
| Total (Overall) | 17 (23.6%) | 55 (76.4%) |
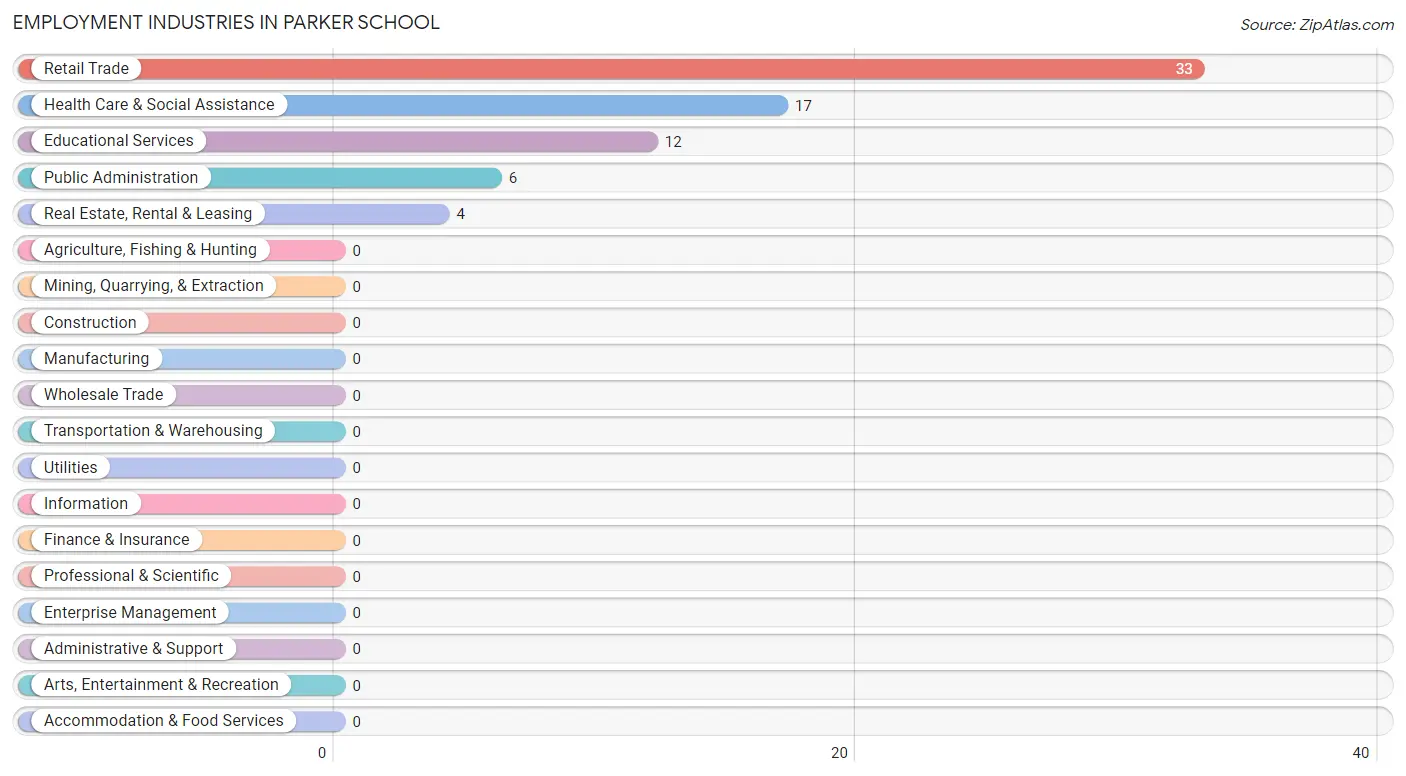
Employment Industries by Sex in Parker School
Employment Industries in Parker School
The major employment industries in Parker School include Retail Trade (33 | 45.8%), Health Care & Social Assistance (17 | 23.6%), Educational Services (12 | 16.7%), Public Administration (6 | 8.3%), and Real Estate, Rental & Leasing (4 | 5.6%).
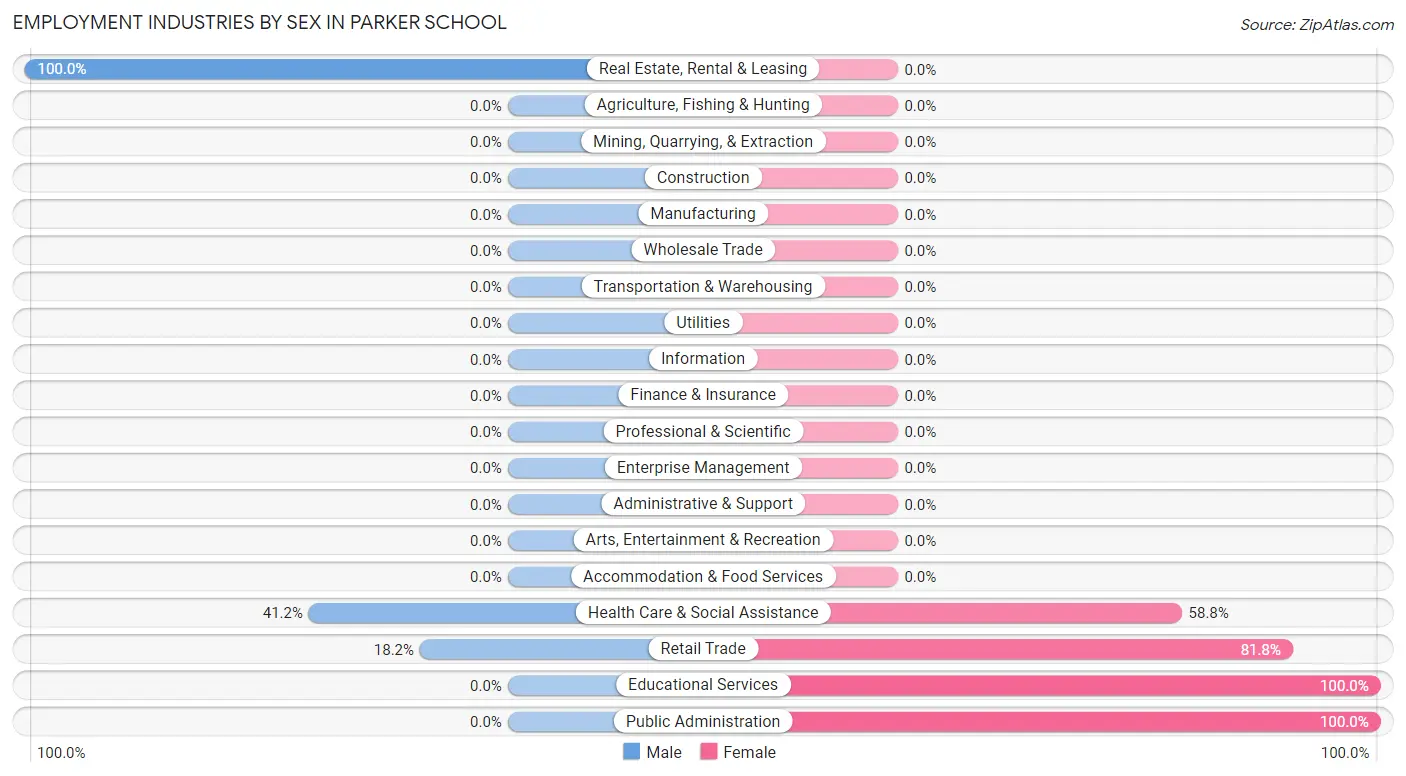
Employment Industries by Sex in Parker School
The Parker School industries that see more men than women are Real Estate, Rental & Leasing (100.0%), Health Care & Social Assistance (41.2%), and Retail Trade (18.2%), whereas the industries that tend to have a higher number of women are Educational Services (100.0%), Public Administration (100.0%), and Retail Trade (81.8%).
| Industry | Male | Female |
| Agriculture, Fishing & Hunting | 0 (0.0%) | 0 (0.0%) |
| Mining, Quarrying, & Extraction | 0 (0.0%) | 0 (0.0%) |
| Construction | 0 (0.0%) | 0 (0.0%) |
| Manufacturing | 0 (0.0%) | 0 (0.0%) |
| Wholesale Trade | 0 (0.0%) | 0 (0.0%) |
| Retail Trade | 6 (18.2%) | 27 (81.8%) |
| Transportation & Warehousing | 0 (0.0%) | 0 (0.0%) |
| Utilities | 0 (0.0%) | 0 (0.0%) |
| Information | 0 (0.0%) | 0 (0.0%) |
| Finance & Insurance | 0 (0.0%) | 0 (0.0%) |
| Real Estate, Rental & Leasing | 4 (100.0%) | 0 (0.0%) |
| Professional & Scientific | 0 (0.0%) | 0 (0.0%) |
| Enterprise Management | 0 (0.0%) | 0 (0.0%) |
| Administrative & Support | 0 (0.0%) | 0 (0.0%) |
| Educational Services | 0 (0.0%) | 12 (100.0%) |
| Health Care & Social Assistance | 7 (41.2%) | 10 (58.8%) |
| Arts, Entertainment & Recreation | 0 (0.0%) | 0 (0.0%) |
| Accommodation & Food Services | 0 (0.0%) | 0 (0.0%) |
| Public Administration | 0 (0.0%) | 6 (100.0%) |
| Total | 17 (23.6%) | 55 (76.4%) |
Education in Parker School
School Enrollment in Parker School
The most common levels of schooling among the 171 students in Parker School are high school (77 | 45.0%), college / undergraduate (37 | 21.6%), and nursery / preschool (21 | 12.3%).
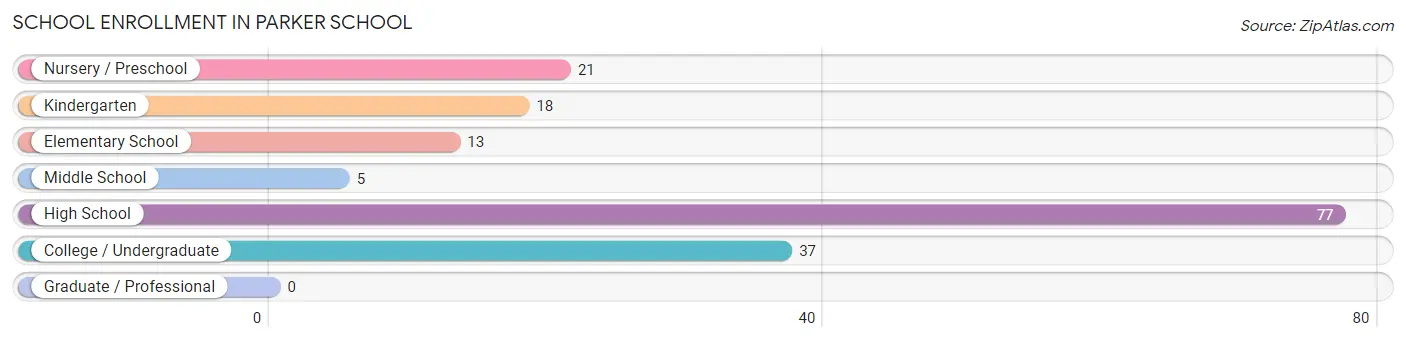
| School Level | # Students | % Students |
| Nursery / Preschool | 21 | 12.3% |
| Kindergarten | 18 | 10.5% |
| Elementary School | 13 | 7.6% |
| Middle School | 5 | 2.9% |
| High School | 77 | 45.0% |
| College / Undergraduate | 37 | 21.6% |
| Graduate / Professional | 0 | 0.0% |
| Total | 171 | 100.0% |
School Enrollment by Age by Funding Source in Parker School
Out of a total of 171 students who are enrolled in schools in Parker School, 42 (24.6%) attend a private institution, while the remaining 129 (75.4%) are enrolled in public schools. The age group of 3 to 4 year olds has the highest likelihood of being enrolled in private schools, with 31 (100.0% in the age bracket) enrolled. Conversely, the age group of 5 to 9 year old has the lowest likelihood of being enrolled in a private school, with 21 (100.0% in the age bracket) attending a public institution.
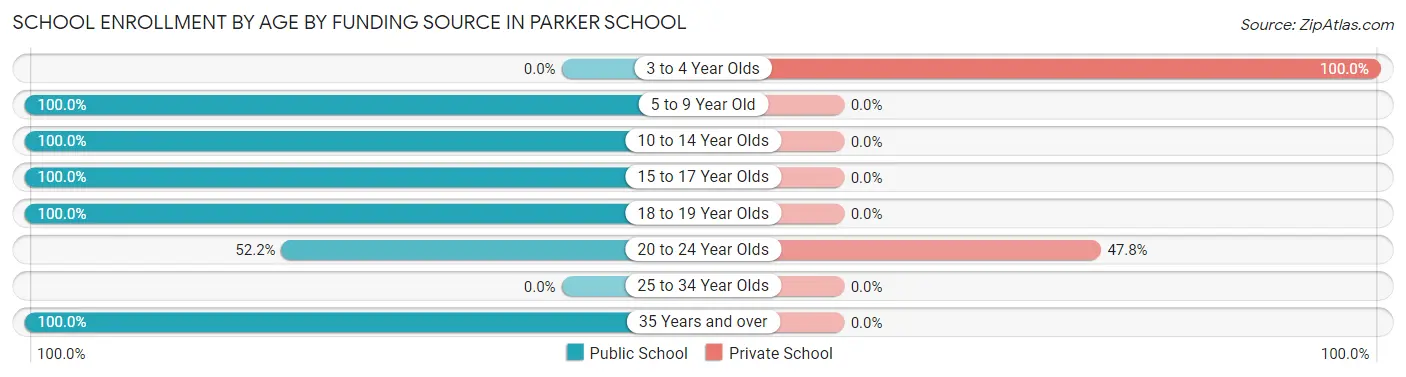
| Age Bracket | Public School | Private School |
| 3 to 4 Year Olds | 0 (0.0%) | 31 (100.0%) |
| 5 to 9 Year Old | 21 (100.0%) | 0 (0.0%) |
| 10 to 14 Year Olds | 10 (100.0%) | 0 (0.0%) |
| 15 to 17 Year Olds | 66 (100.0%) | 0 (0.0%) |
| 18 to 19 Year Olds | 8 (100.0%) | 0 (0.0%) |
| 20 to 24 Year Olds | 12 (52.2%) | 11 (47.8%) |
| 25 to 34 Year Olds | 0 (0.0%) | 0 (0.0%) |
| 35 Years and over | 12 (100.0%) | 0 (0.0%) |
| Total | 129 (75.4%) | 42 (24.6%) |
Educational Attainment by Field of Study in Parker School
Computers & mathematics (6 | 31.6%), education (6 | 31.6%), business (4 | 21.0%), and arts & humanities (3 | 15.8%) are the most common fields of study among 19 individuals in Parker School who have obtained a bachelor's degree or higher.
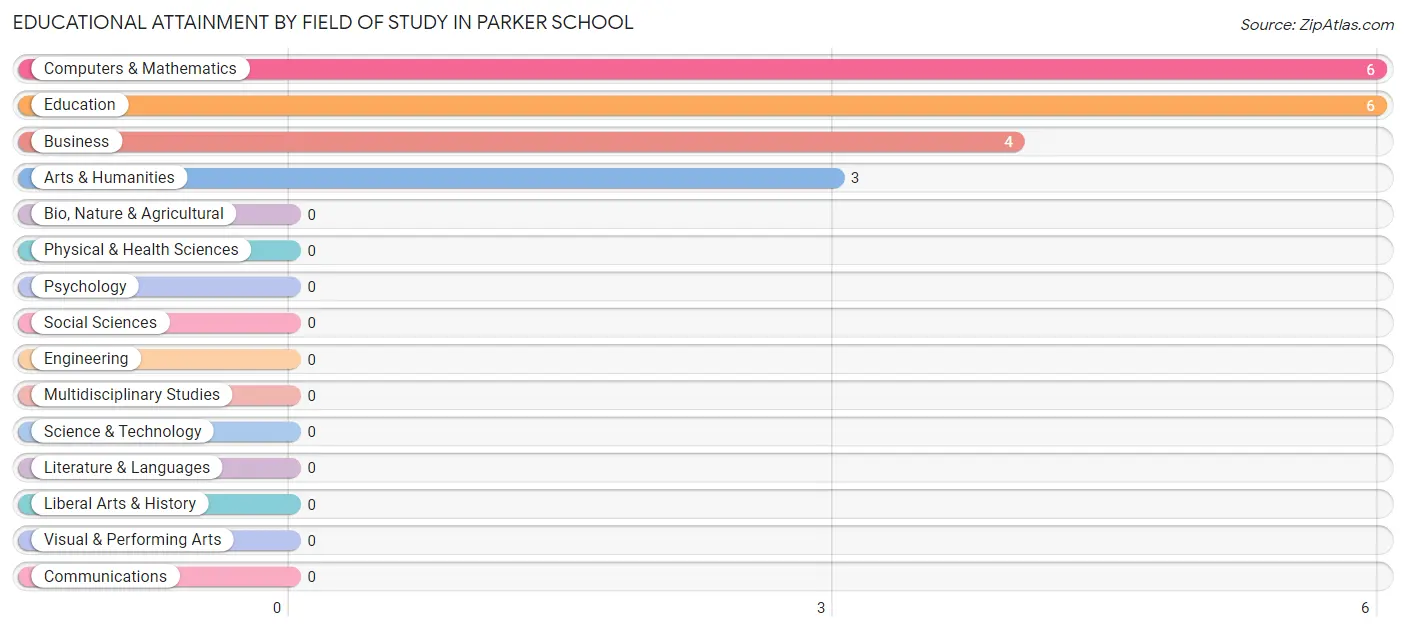
| Field of Study | # Graduates | % Graduates |
| Computers & Mathematics | 6 | 31.6% |
| Bio, Nature & Agricultural | 0 | 0.0% |
| Physical & Health Sciences | 0 | 0.0% |
| Psychology | 0 | 0.0% |
| Social Sciences | 0 | 0.0% |
| Engineering | 0 | 0.0% |
| Multidisciplinary Studies | 0 | 0.0% |
| Science & Technology | 0 | 0.0% |
| Business | 4 | 21.0% |
| Education | 6 | 31.6% |
| Literature & Languages | 0 | 0.0% |
| Liberal Arts & History | 0 | 0.0% |
| Visual & Performing Arts | 0 | 0.0% |
| Communications | 0 | 0.0% |
| Arts & Humanities | 3 | 15.8% |
| Total | 19 | 100.0% |
Transportation & Commute in Parker School
Vehicle Availability by Sex in Parker School
The most prevalent vehicle ownership categories in Parker School are males with 2 vehicles (9, accounting for 52.9%) and females with 2 vehicles (22, making up 16.4%).
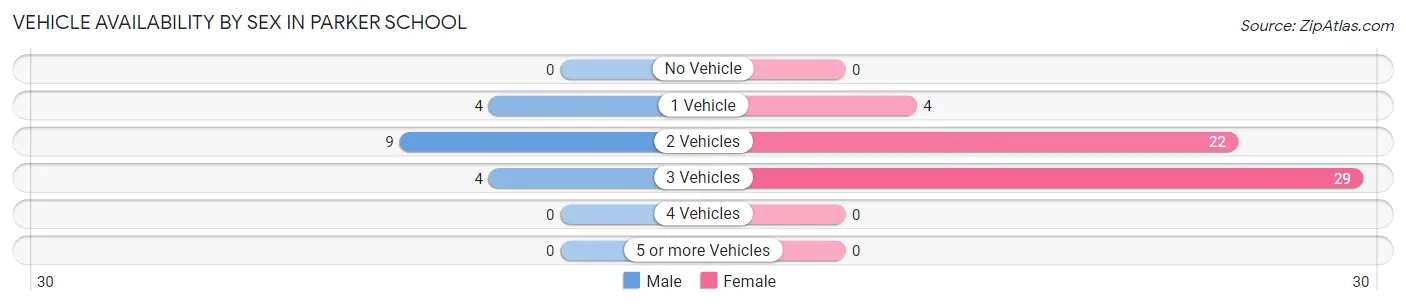
| Vehicles Available | Male | Female |
| No Vehicle | 0 (0.0%) | 0 (0.0%) |
| 1 Vehicle | 4 (23.5%) | 4 (7.3%) |
| 2 Vehicles | 9 (52.9%) | 22 (40.0%) |
| 3 Vehicles | 4 (23.5%) | 29 (52.7%) |
| 4 Vehicles | 0 (0.0%) | 0 (0.0%) |
| 5 or more Vehicles | 0 (0.0%) | 0 (0.0%) |
| Total | 17 (100.0%) | 55 (100.0%) |
Commute Time in Parker School
The most frequently occuring commute durations in Parker School are 15 to 19 minutes (31 commuters, 45.6%), 25 to 29 minutes (18 commuters, 26.5%), and 20 to 24 minutes (10 commuters, 14.7%).
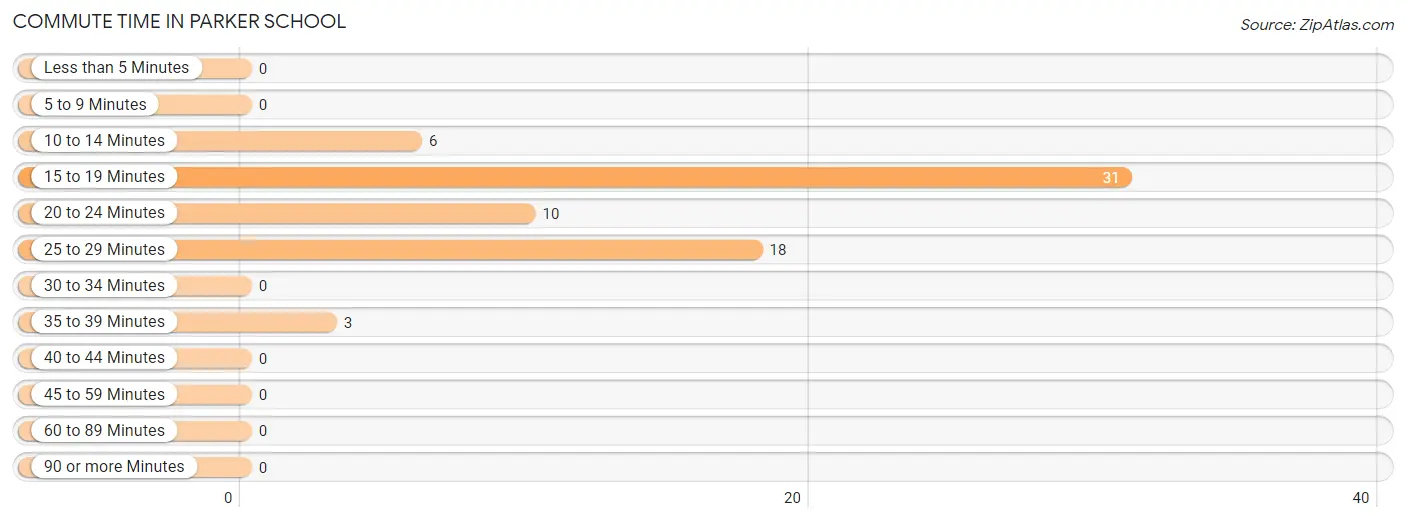
| Commute Time | # Commuters | % Commuters |
| Less than 5 Minutes | 0 | 0.0% |
| 5 to 9 Minutes | 0 | 0.0% |
| 10 to 14 Minutes | 6 | 8.8% |
| 15 to 19 Minutes | 31 | 45.6% |
| 20 to 24 Minutes | 10 | 14.7% |
| 25 to 29 Minutes | 18 | 26.5% |
| 30 to 34 Minutes | 0 | 0.0% |
| 35 to 39 Minutes | 3 | 4.4% |
| 40 to 44 Minutes | 0 | 0.0% |
| 45 to 59 Minutes | 0 | 0.0% |
| 60 to 89 Minutes | 0 | 0.0% |
| 90 or more Minutes | 0 | 0.0% |
Commute Time by Sex in Parker School
The most common commute times in Parker School are 10 to 14 minutes (6 commuters, 35.3%) for males and 15 to 19 minutes (27 commuters, 52.9%) for females.
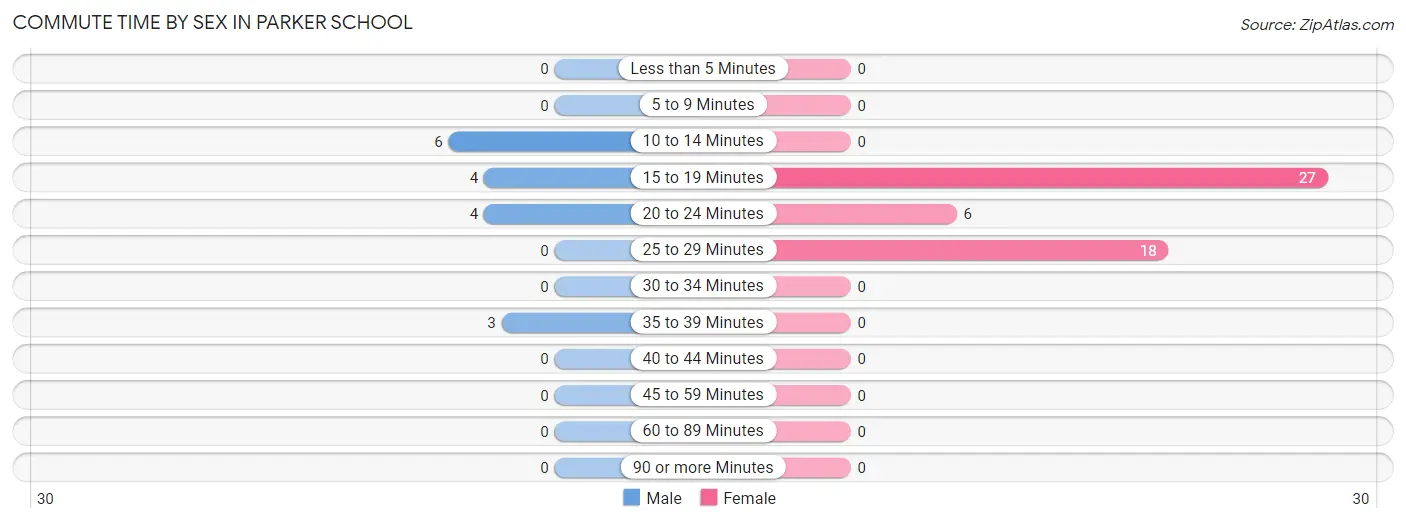
| Commute Time | Male | Female |
| Less than 5 Minutes | 0 (0.0%) | 0 (0.0%) |
| 5 to 9 Minutes | 0 (0.0%) | 0 (0.0%) |
| 10 to 14 Minutes | 6 (35.3%) | 0 (0.0%) |
| 15 to 19 Minutes | 4 (23.5%) | 27 (52.9%) |
| 20 to 24 Minutes | 4 (23.5%) | 6 (11.8%) |
| 25 to 29 Minutes | 0 (0.0%) | 18 (35.3%) |
| 30 to 34 Minutes | 0 (0.0%) | 0 (0.0%) |
| 35 to 39 Minutes | 3 (17.6%) | 0 (0.0%) |
| 40 to 44 Minutes | 0 (0.0%) | 0 (0.0%) |
| 45 to 59 Minutes | 0 (0.0%) | 0 (0.0%) |
| 60 to 89 Minutes | 0 (0.0%) | 0 (0.0%) |
| 90 or more Minutes | 0 (0.0%) | 0 (0.0%) |
Time of Departure to Work by Sex in Parker School
The most frequent times of departure to work in Parker School are 8:00 AM to 8:29 AM (13, 76.5%) for males and 7:30 AM to 7:59 AM (18, 35.3%) for females.
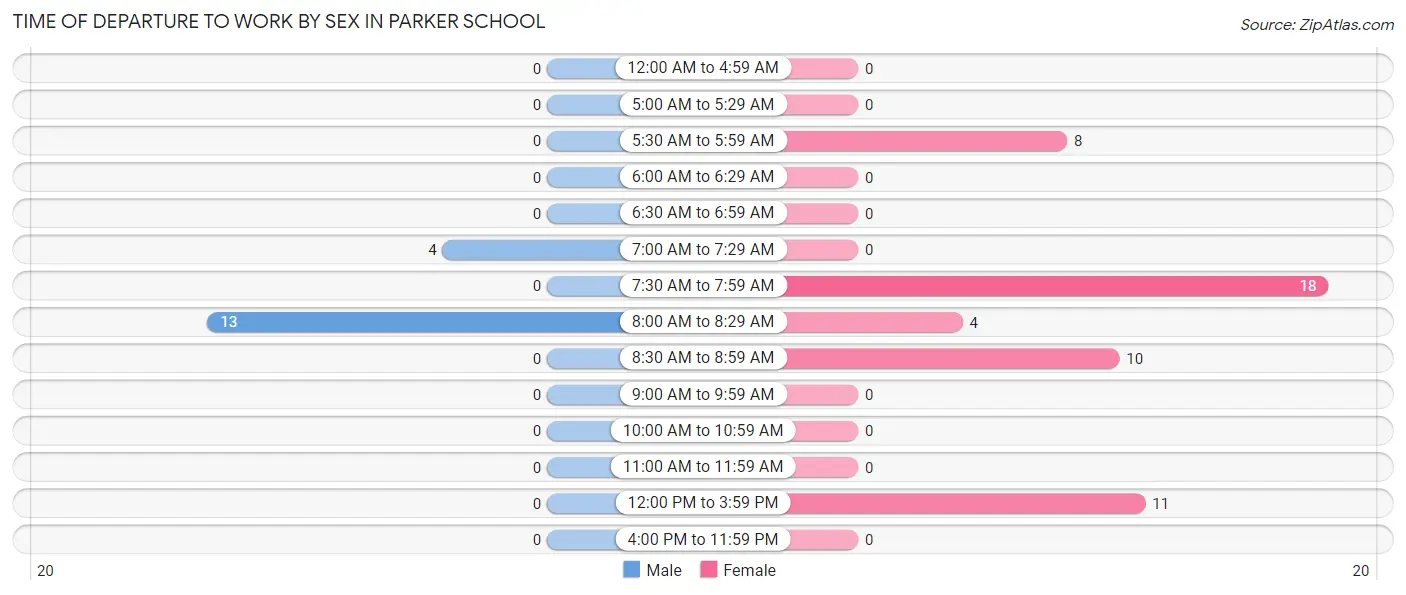
| Time of Departure | Male | Female |
| 12:00 AM to 4:59 AM | 0 (0.0%) | 0 (0.0%) |
| 5:00 AM to 5:29 AM | 0 (0.0%) | 0 (0.0%) |
| 5:30 AM to 5:59 AM | 0 (0.0%) | 8 (15.7%) |
| 6:00 AM to 6:29 AM | 0 (0.0%) | 0 (0.0%) |
| 6:30 AM to 6:59 AM | 0 (0.0%) | 0 (0.0%) |
| 7:00 AM to 7:29 AM | 4 (23.5%) | 0 (0.0%) |
| 7:30 AM to 7:59 AM | 0 (0.0%) | 18 (35.3%) |
| 8:00 AM to 8:29 AM | 13 (76.5%) | 4 (7.8%) |
| 8:30 AM to 8:59 AM | 0 (0.0%) | 10 (19.6%) |
| 9:00 AM to 9:59 AM | 0 (0.0%) | 0 (0.0%) |
| 10:00 AM to 10:59 AM | 0 (0.0%) | 0 (0.0%) |
| 11:00 AM to 11:59 AM | 0 (0.0%) | 0 (0.0%) |
| 12:00 PM to 3:59 PM | 0 (0.0%) | 11 (21.6%) |
| 4:00 PM to 11:59 PM | 0 (0.0%) | 0 (0.0%) |
| Total | 17 (100.0%) | 51 (100.0%) |
Housing Occupancy in Parker School
Occupancy by Ownership in Parker School
Of the total 118 dwellings in Parker School, owner-occupied units account for 102 (86.4%), while renter-occupied units make up 16 (13.6%).
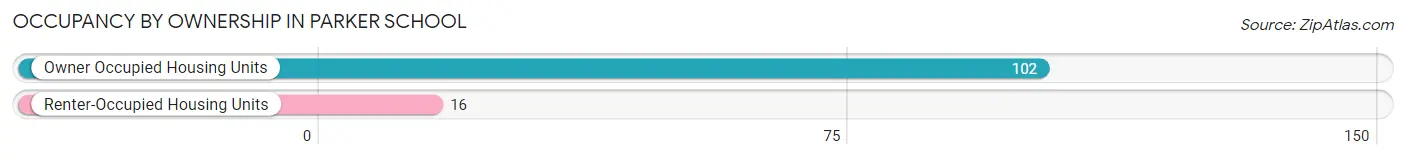
| Occupancy | # Housing Units | % Housing Units |
| Owner Occupied Housing Units | 102 | 86.4% |
| Renter-Occupied Housing Units | 16 | 13.6% |
| Total Occupied Housing Units | 118 | 100.0% |
Occupancy by Household Size in Parker School
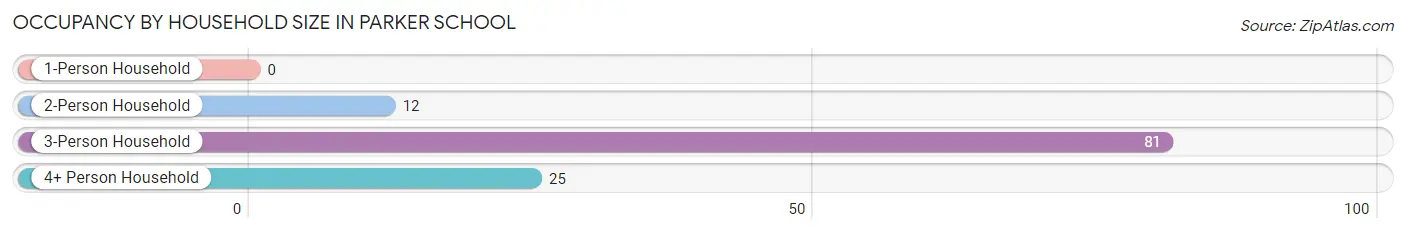
| Household Size | # Housing Units | % Housing Units |
| 1-Person Household | 0 | 0.0% |
| 2-Person Household | 12 | 10.2% |
| 3-Person Household | 81 | 68.6% |
| 4+ Person Household | 25 | 21.2% |
| Total Housing Units | 118 | 100.0% |
Occupancy by Ownership by Household Size in Parker School
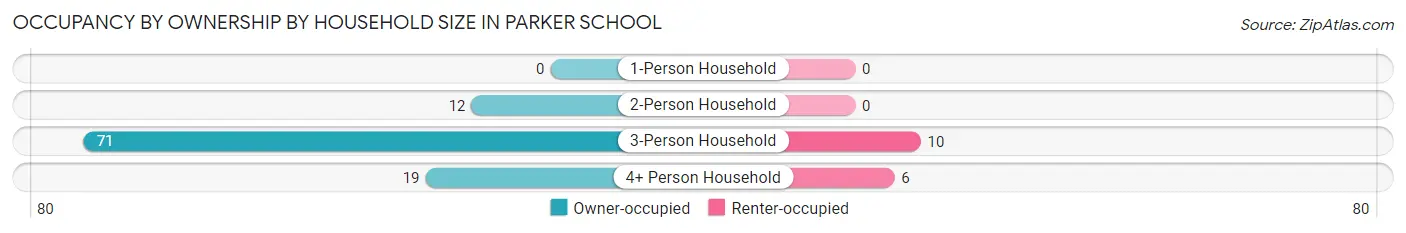
| Household Size | Owner-occupied | Renter-occupied |
| 1-Person Household | 0 (0.0%) | 0 (0.0%) |
| 2-Person Household | 12 (100.0%) | 0 (0.0%) |
| 3-Person Household | 71 (87.6%) | 10 (12.3%) |
| 4+ Person Household | 19 (76.0%) | 6 (24.0%) |
| Total Housing Units | 102 (86.4%) | 16 (13.6%) |
Occupancy by Educational Attainment in Parker School
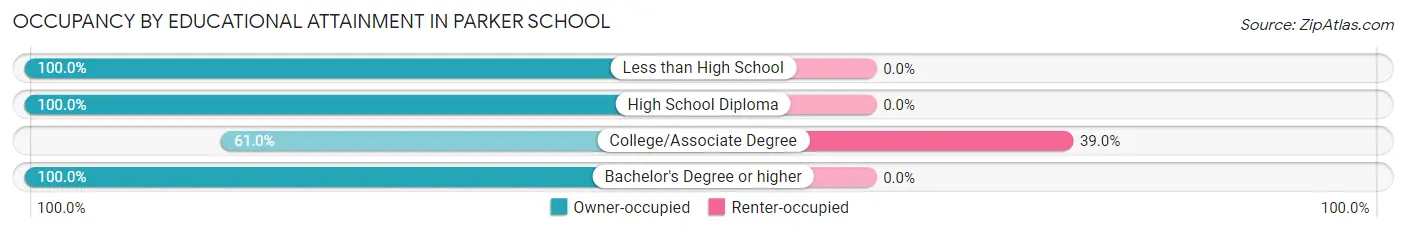
| Household Size | Owner-occupied | Renter-occupied |
| Less than High School | 17 (100.0%) | 0 (0.0%) |
| High School Diploma | 54 (100.0%) | 0 (0.0%) |
| College/Associate Degree | 25 (61.0%) | 16 (39.0%) |
| Bachelor's Degree or higher | 6 (100.0%) | 0 (0.0%) |
Occupancy by Age of Householder in Parker School
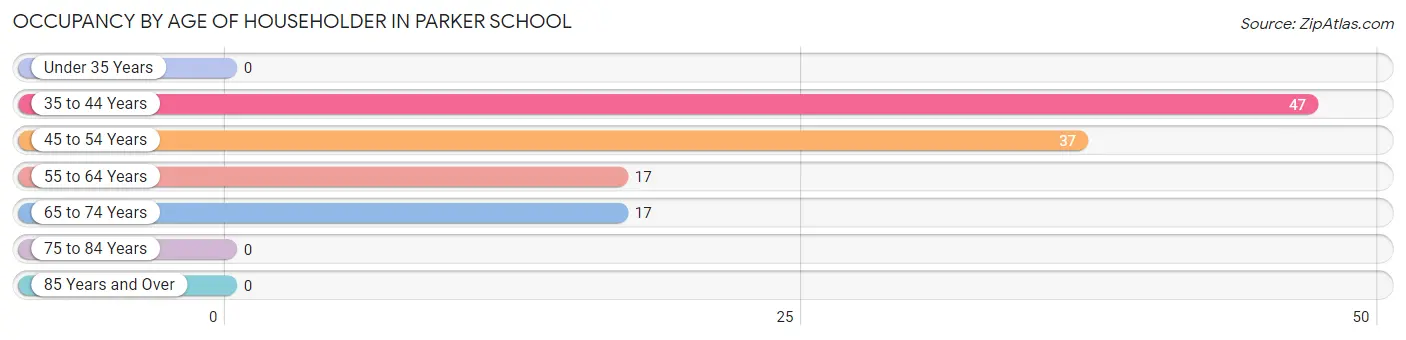
| Age Bracket | # Households | % Households |
| Under 35 Years | 0 | 0.0% |
| 35 to 44 Years | 47 | 39.8% |
| 45 to 54 Years | 37 | 31.4% |
| 55 to 64 Years | 17 | 14.4% |
| 65 to 74 Years | 17 | 14.4% |
| 75 to 84 Years | 0 | 0.0% |
| 85 Years and Over | 0 | 0.0% |
| Total | 118 | 100.0% |
Housing Finances in Parker School
Median Income by Occupancy in Parker School
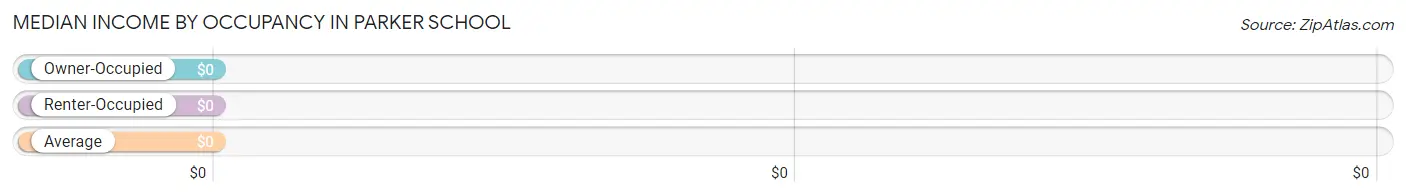
| Occupancy Type | # Households | Median Income |
| Owner-Occupied | 102 (86.4%) | $0 |
| Renter-Occupied | 16 (13.6%) | $0 |
| Average | 118 (100.0%) | $0 |
Occupancy by Householder Income Bracket in Parker School
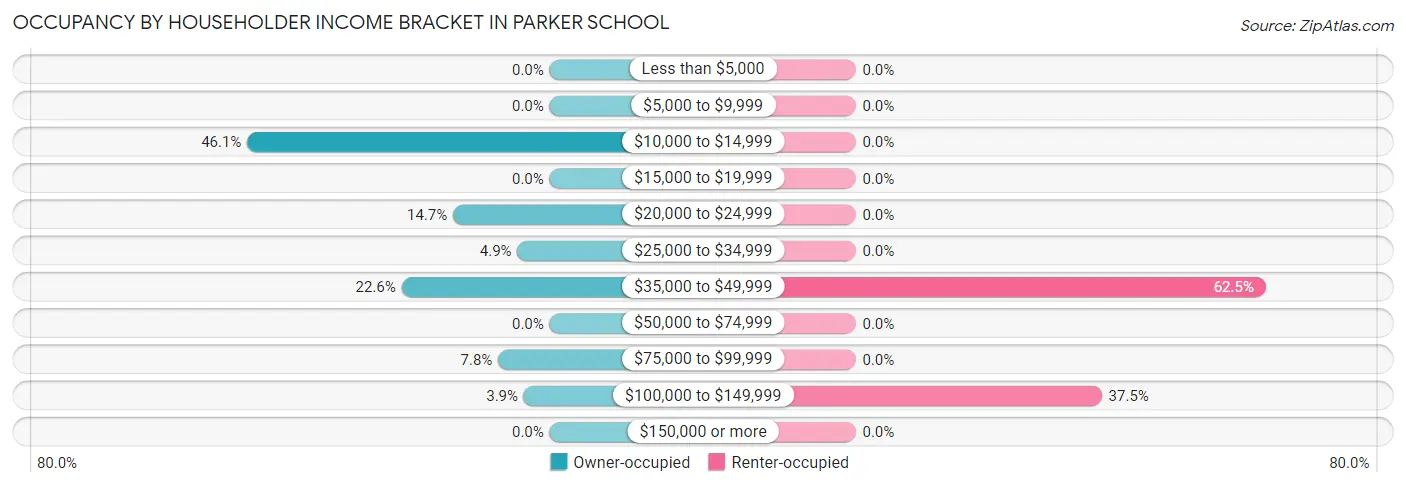
| Income Bracket | Owner-occupied | Renter-occupied |
| Less than $5,000 | 0 (0.0%) | 0 (0.0%) |
| $5,000 to $9,999 | 0 (0.0%) | 0 (0.0%) |
| $10,000 to $14,999 | 47 (46.1%) | 0 (0.0%) |
| $15,000 to $19,999 | 0 (0.0%) | 0 (0.0%) |
| $20,000 to $24,999 | 15 (14.7%) | 0 (0.0%) |
| $25,000 to $34,999 | 5 (4.9%) | 0 (0.0%) |
| $35,000 to $49,999 | 23 (22.6%) | 10 (62.5%) |
| $50,000 to $74,999 | 0 (0.0%) | 0 (0.0%) |
| $75,000 to $99,999 | 8 (7.8%) | 0 (0.0%) |
| $100,000 to $149,999 | 4 (3.9%) | 6 (37.5%) |
| $150,000 or more | 0 (0.0%) | 0 (0.0%) |
| Total | 102 (100.0%) | 16 (100.0%) |
Monthly Housing Cost Tiers in Parker School
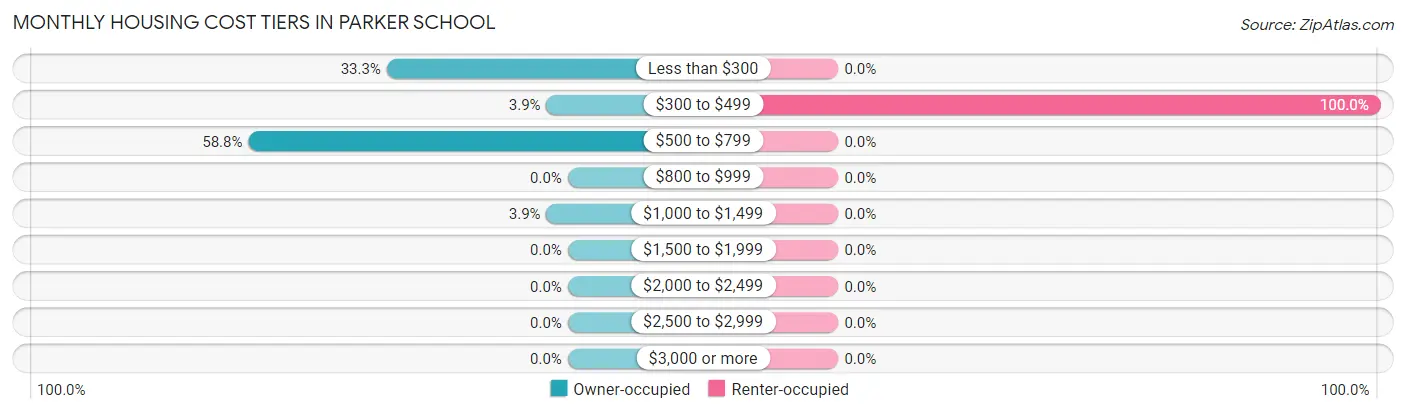
| Monthly Cost | Owner-occupied | Renter-occupied |
| Less than $300 | 34 (33.3%) | 0 (0.0%) |
| $300 to $499 | 4 (3.9%) | 16 (100.0%) |
| $500 to $799 | 60 (58.8%) | 0 (0.0%) |
| $800 to $999 | 0 (0.0%) | 0 (0.0%) |
| $1,000 to $1,499 | 4 (3.9%) | 0 (0.0%) |
| $1,500 to $1,999 | 0 (0.0%) | 0 (0.0%) |
| $2,000 to $2,499 | 0 (0.0%) | 0 (0.0%) |
| $2,500 to $2,999 | 0 (0.0%) | 0 (0.0%) |
| $3,000 or more | 0 (0.0%) | 0 (0.0%) |
| Total | 102 (100.0%) | 16 (100.0%) |
Physical Housing Characteristics in Parker School
Housing Structures in Parker School
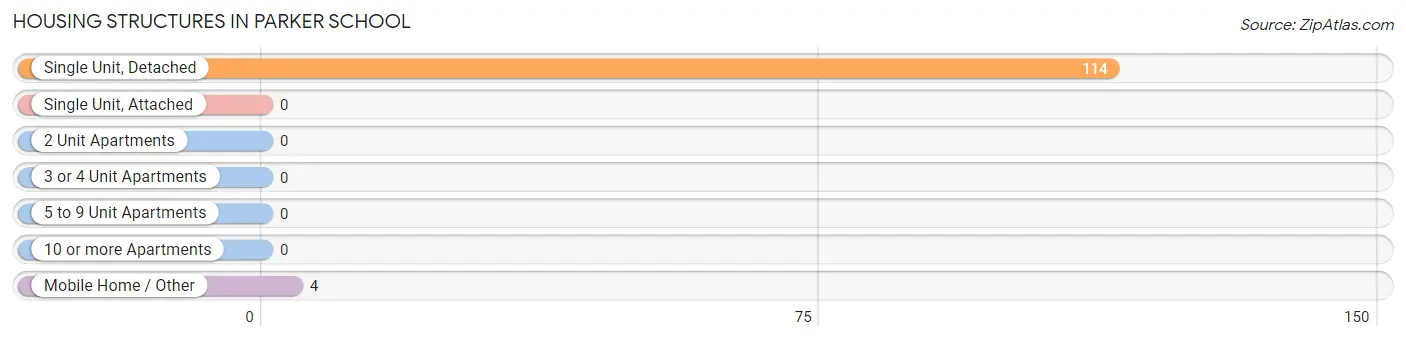
| Structure Type | # Housing Units | % Housing Units |
| Single Unit, Detached | 114 | 96.6% |
| Single Unit, Attached | 0 | 0.0% |
| 2 Unit Apartments | 0 | 0.0% |
| 3 or 4 Unit Apartments | 0 | 0.0% |
| 5 to 9 Unit Apartments | 0 | 0.0% |
| 10 or more Apartments | 0 | 0.0% |
| Mobile Home / Other | 4 | 3.4% |
| Total | 118 | 100.0% |
Housing Structures by Occupancy in Parker School
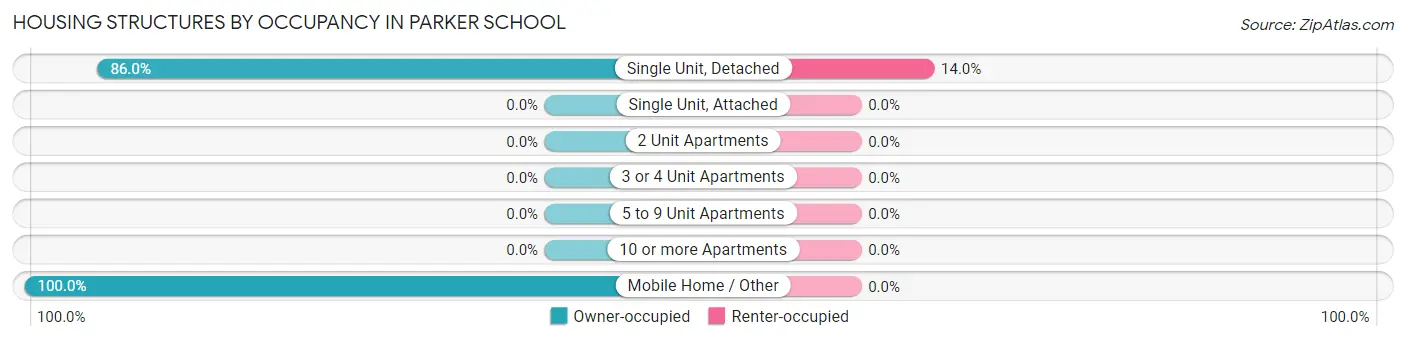
| Structure Type | Owner-occupied | Renter-occupied |
| Single Unit, Detached | 98 (86.0%) | 16 (14.0%) |
| Single Unit, Attached | 0 (0.0%) | 0 (0.0%) |
| 2 Unit Apartments | 0 (0.0%) | 0 (0.0%) |
| 3 or 4 Unit Apartments | 0 (0.0%) | 0 (0.0%) |
| 5 to 9 Unit Apartments | 0 (0.0%) | 0 (0.0%) |
| 10 or more Apartments | 0 (0.0%) | 0 (0.0%) |
| Mobile Home / Other | 4 (100.0%) | 0 (0.0%) |
| Total | 102 (86.4%) | 16 (13.6%) |
Housing Structures by Number of Rooms in Parker School
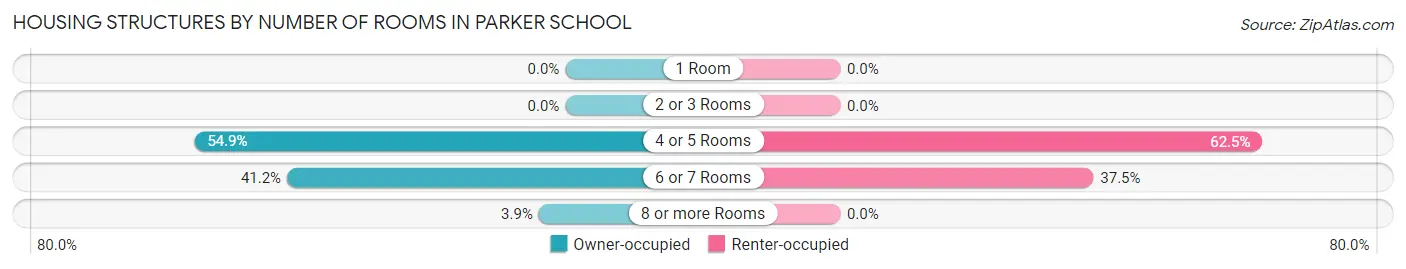
| Number of Rooms | Owner-occupied | Renter-occupied |
| 1 Room | 0 (0.0%) | 0 (0.0%) |
| 2 or 3 Rooms | 0 (0.0%) | 0 (0.0%) |
| 4 or 5 Rooms | 56 (54.9%) | 10 (62.5%) |
| 6 or 7 Rooms | 42 (41.2%) | 6 (37.5%) |
| 8 or more Rooms | 4 (3.9%) | 0 (0.0%) |
| Total | 102 (100.0%) | 16 (100.0%) |
Housing Structure by Heating Type in Parker School
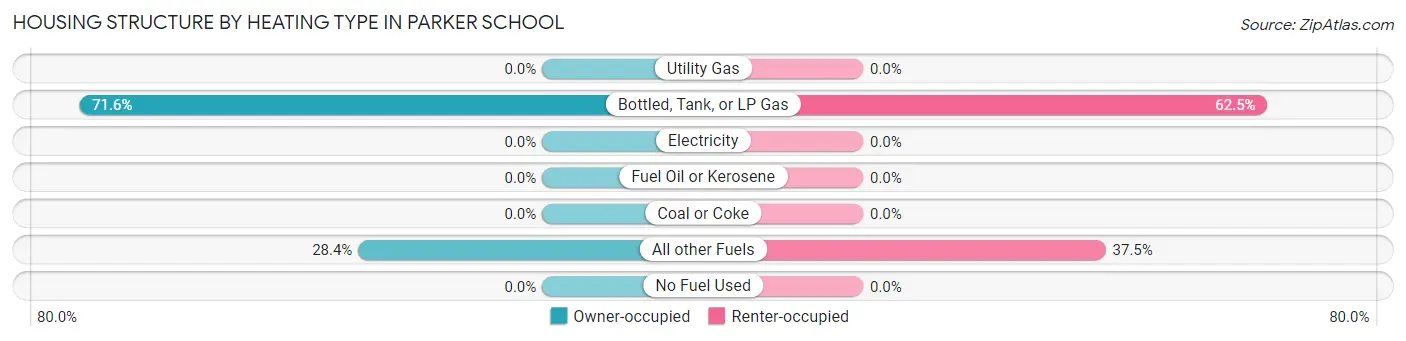
| Heating Type | Owner-occupied | Renter-occupied |
| Utility Gas | 0 (0.0%) | 0 (0.0%) |
| Bottled, Tank, or LP Gas | 73 (71.6%) | 10 (62.5%) |
| Electricity | 0 (0.0%) | 0 (0.0%) |
| Fuel Oil or Kerosene | 0 (0.0%) | 0 (0.0%) |
| Coal or Coke | 0 (0.0%) | 0 (0.0%) |
| All other Fuels | 29 (28.4%) | 6 (37.5%) |
| No Fuel Used | 0 (0.0%) | 0 (0.0%) |
| Total | 102 (100.0%) | 16 (100.0%) |
Household Vehicle Usage in Parker School
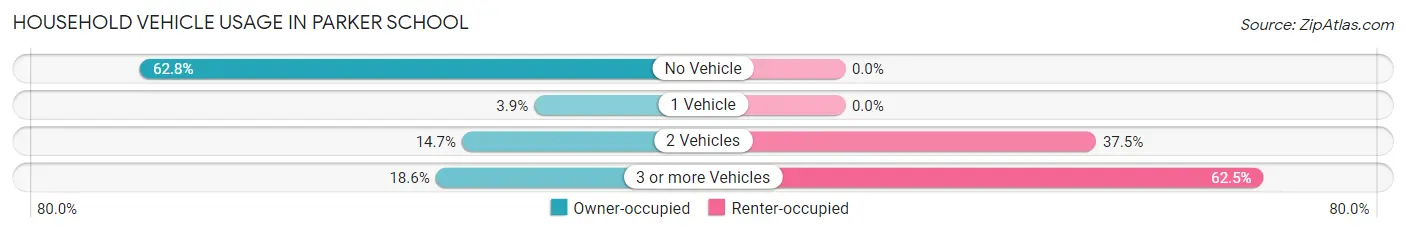
| Vehicles per Household | Owner-occupied | Renter-occupied |
| No Vehicle | 64 (62.7%) | 0 (0.0%) |
| 1 Vehicle | 4 (3.9%) | 0 (0.0%) |
| 2 Vehicles | 15 (14.7%) | 6 (37.5%) |
| 3 or more Vehicles | 19 (18.6%) | 10 (62.5%) |
| Total | 102 (100.0%) | 16 (100.0%) |
Real Estate & Mortgages in Parker School
Real Estate and Mortgage Overview in Parker School
| Characteristic | Without Mortgage | With Mortgage |
| Housing Units | 98 | 4 |
| Median Property Value | $176,000 | $0 |
| Median Household Income | $20,714 | $0 |
| Monthly Housing Costs | $585 | $0 |
| Real Estate Taxes | - | - |
Property Value by Mortgage Status in Parker School
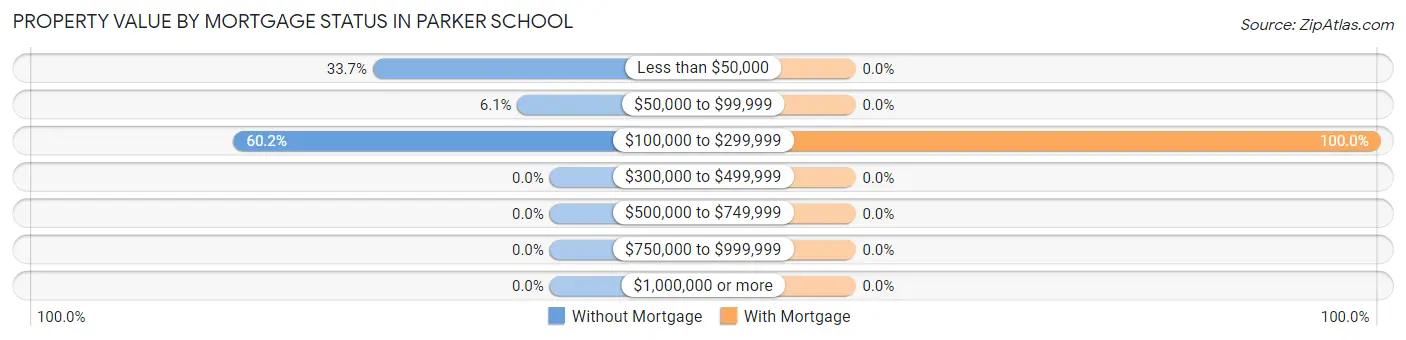
| Property Value | Without Mortgage | With Mortgage |
| Less than $50,000 | 33 (33.7%) | 0 (0.0%) |
| $50,000 to $99,999 | 6 (6.1%) | 0 (0.0%) |
| $100,000 to $299,999 | 59 (60.2%) | 4 (100.0%) |
| $300,000 to $499,999 | 0 (0.0%) | 0 (0.0%) |
| $500,000 to $749,999 | 0 (0.0%) | 0 (0.0%) |
| $750,000 to $999,999 | 0 (0.0%) | 0 (0.0%) |
| $1,000,000 or more | 0 (0.0%) | 0 (0.0%) |
| Total | 98 (100.0%) | 4 (100.0%) |
Household Income by Mortgage Status in Parker School
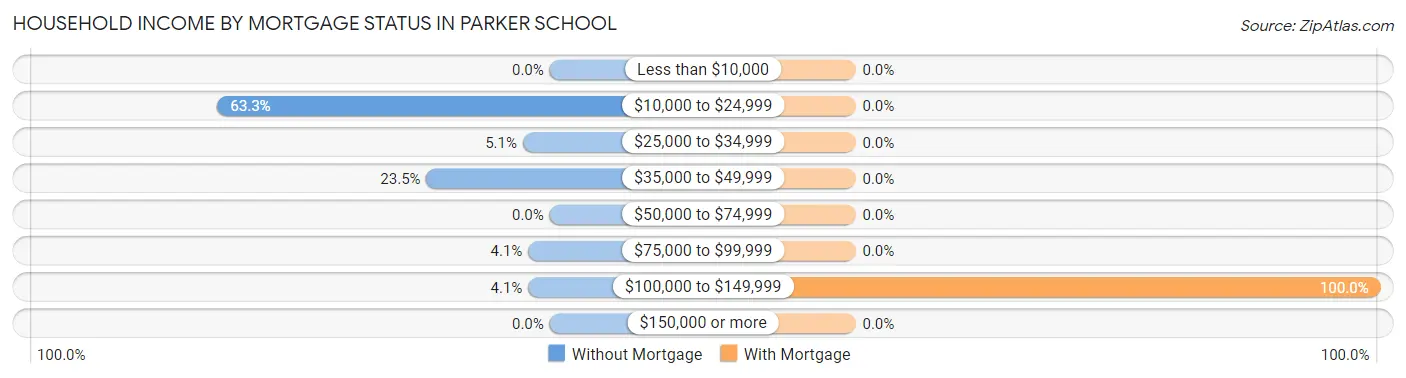
| Household Income | Without Mortgage | With Mortgage |
| Less than $10,000 | 0 (0.0%) | 0 (0.0%) |
| $10,000 to $24,999 | 62 (63.3%) | 0 (0.0%) |
| $25,000 to $34,999 | 5 (5.1%) | 0 (0.0%) |
| $35,000 to $49,999 | 23 (23.5%) | 0 (0.0%) |
| $50,000 to $74,999 | 0 (0.0%) | 0 (0.0%) |
| $75,000 to $99,999 | 4 (4.1%) | 0 (0.0%) |
| $100,000 to $149,999 | 4 (4.1%) | 4 (100.0%) |
| $150,000 or more | 0 (0.0%) | 0 (0.0%) |
| Total | 98 (100.0%) | 4 (100.0%) |
Property Value to Household Income Ratio in Parker School
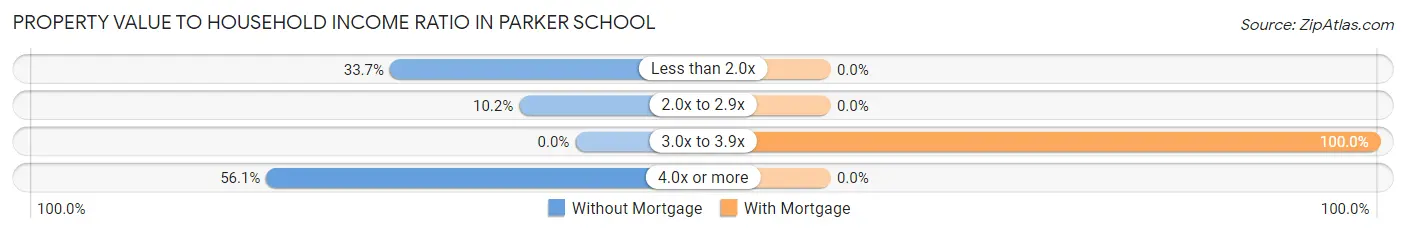
| Value-to-Income Ratio | Without Mortgage | With Mortgage |
| Less than 2.0x | 33 (33.7%) | 0 (0.0%) |
| 2.0x to 2.9x | 10 (10.2%) | 0 (0.0%) |
| 3.0x to 3.9x | 0 (0.0%) | 4 (100.0%) |
| 4.0x or more | 55 (56.1%) | 0 (0.0%) |
| Total | 98 (100.0%) | 4 (100.0%) |
Real Estate Taxes by Mortgage Status in Parker School
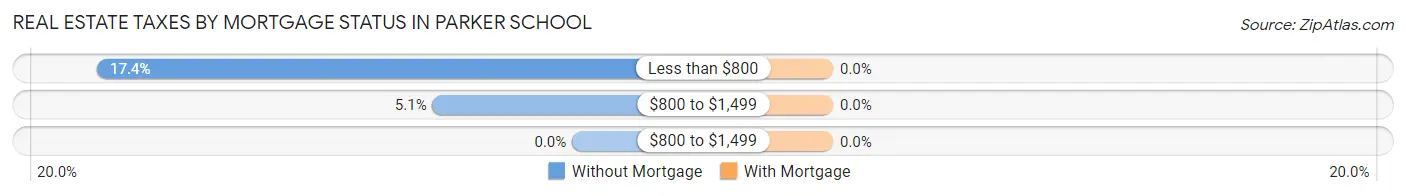
| Property Taxes | Without Mortgage | With Mortgage |
| Less than $800 | 17 (17.3%) | 0 (0.0%) |
| $800 to $1,499 | 5 (5.1%) | 0 (0.0%) |
| $800 to $1,499 | 0 (0.0%) | 0 (0.0%) |
| Total | 98 (100.0%) | 4 (100.0%) |
Health & Disability in Parker School
Health Insurance Coverage by Age in Parker School
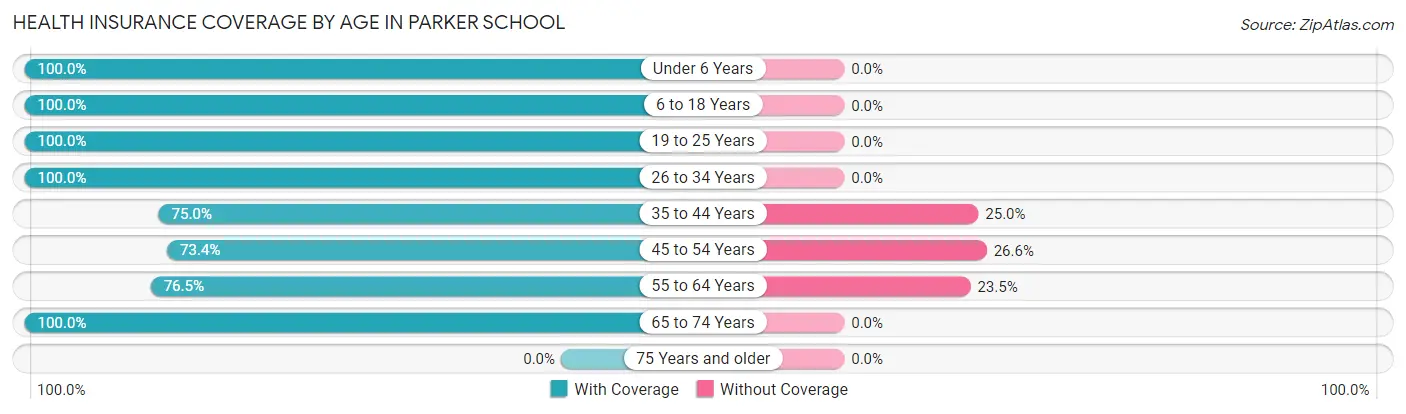
| Age Bracket | With Coverage | Without Coverage |
| Under 6 Years | 64 (100.0%) | 0 (0.0%) |
| 6 to 18 Years | 105 (100.0%) | 0 (0.0%) |
| 19 to 25 Years | 29 (100.0%) | 0 (0.0%) |
| 26 to 34 Years | 15 (100.0%) | 0 (0.0%) |
| 35 to 44 Years | 51 (75.0%) | 17 (25.0%) |
| 45 to 54 Years | 47 (73.4%) | 17 (26.6%) |
| 55 to 64 Years | 13 (76.5%) | 4 (23.5%) |
| 65 to 74 Years | 25 (100.0%) | 0 (0.0%) |
| 75 Years and older | 0 (0.0%) | 0 (0.0%) |
| Total | 349 (90.2%) | 38 (9.8%) |
Health Insurance Coverage by Citizenship Status in Parker School
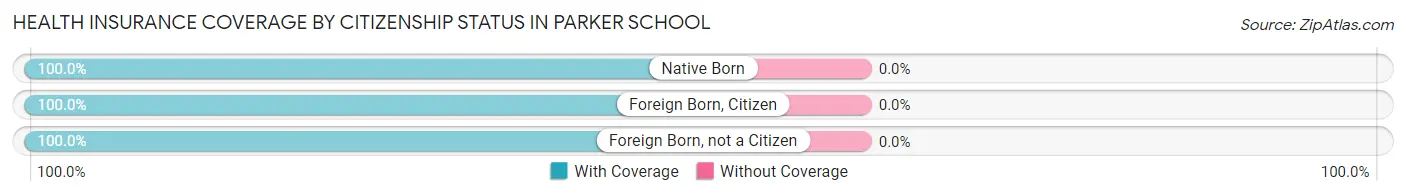
| Citizenship Status | With Coverage | Without Coverage |
| Native Born | 64 (100.0%) | 0 (0.0%) |
| Foreign Born, Citizen | 105 (100.0%) | 0 (0.0%) |
| Foreign Born, not a Citizen | 29 (100.0%) | 0 (0.0%) |
Health Insurance Coverage by Household Income in Parker School
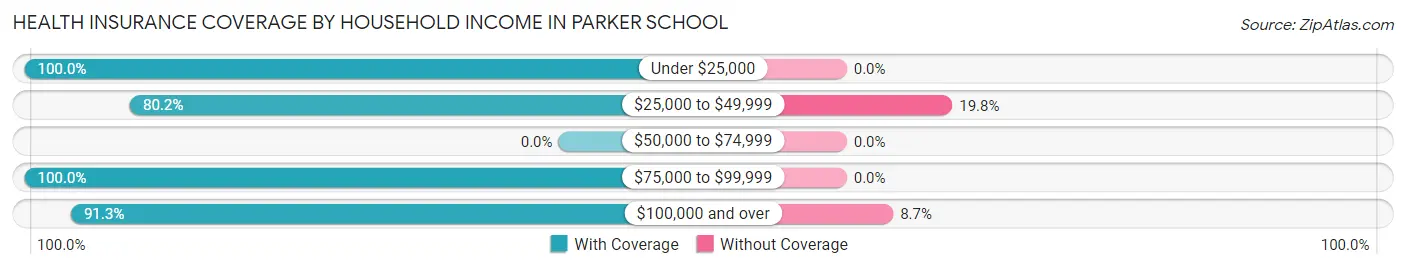
| Household Income | With Coverage | Without Coverage |
| Under $25,000 | 122 (100.0%) | 0 (0.0%) |
| $25,000 to $49,999 | 138 (80.2%) | 34 (19.8%) |
| $50,000 to $74,999 | 0 (0.0%) | 0 (0.0%) |
| $75,000 to $99,999 | 47 (100.0%) | 0 (0.0%) |
| $100,000 and over | 42 (91.3%) | 4 (8.7%) |
Public vs Private Health Insurance Coverage by Age in Parker School
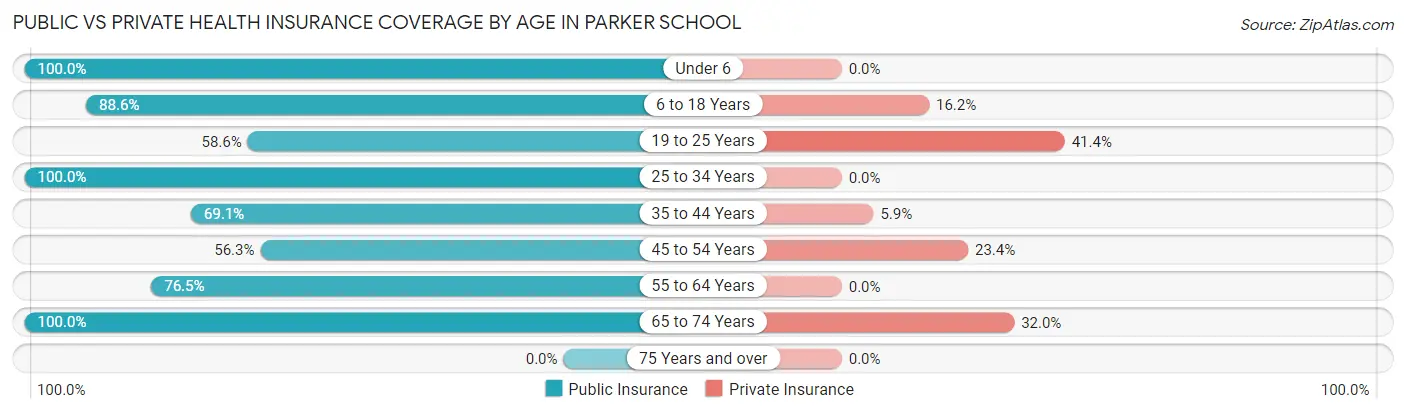
| Age Bracket | Public Insurance | Private Insurance |
| Under 6 | 64 (100.0%) | 0 (0.0%) |
| 6 to 18 Years | 93 (88.6%) | 17 (16.2%) |
| 19 to 25 Years | 17 (58.6%) | 12 (41.4%) |
| 25 to 34 Years | 15 (100.0%) | 0 (0.0%) |
| 35 to 44 Years | 47 (69.1%) | 4 (5.9%) |
| 45 to 54 Years | 36 (56.2%) | 15 (23.4%) |
| 55 to 64 Years | 13 (76.5%) | 0 (0.0%) |
| 65 to 74 Years | 25 (100.0%) | 8 (32.0%) |
| 75 Years and over | 0 (0.0%) | 0 (0.0%) |
| Total | 310 (80.1%) | 56 (14.5%) |
Disability Status by Sex by Age in Parker School
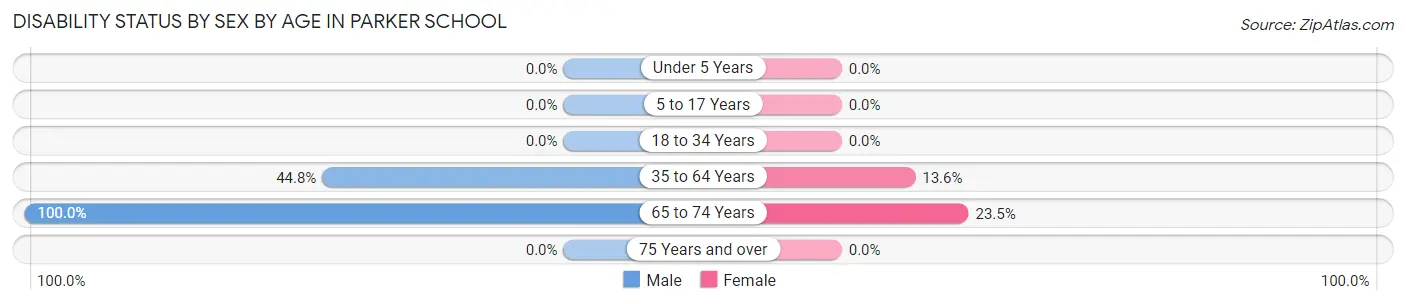
| Age Bracket | Male | Female |
| Under 5 Years | 0 (0.0%) | 0 (0.0%) |
| 5 to 17 Years | 0 (0.0%) | 0 (0.0%) |
| 18 to 34 Years | 0 (0.0%) | 0 (0.0%) |
| 35 to 64 Years | 47 (44.8%) | 6 (13.6%) |
| 65 to 74 Years | 8 (100.0%) | 4 (23.5%) |
| 75 Years and over | 0 (0.0%) | 0 (0.0%) |
Disability Class by Sex by Age in Parker School
Disability Class: Hearing Difficulty
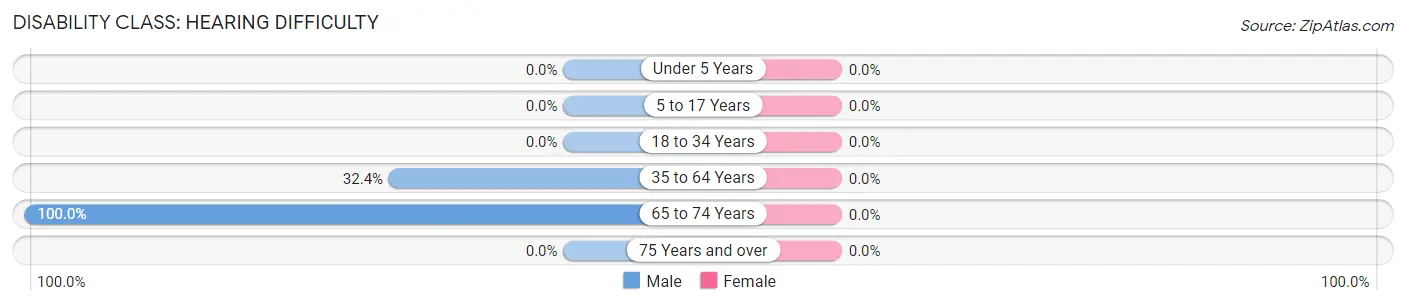
| Age Bracket | Male | Female |
| Under 5 Years | 0 (0.0%) | 0 (0.0%) |
| 5 to 17 Years | 0 (0.0%) | 0 (0.0%) |
| 18 to 34 Years | 0 (0.0%) | 0 (0.0%) |
| 35 to 64 Years | 34 (32.4%) | 0 (0.0%) |
| 65 to 74 Years | 8 (100.0%) | 0 (0.0%) |
| 75 Years and over | 0 (0.0%) | 0 (0.0%) |
Disability Class: Vision Difficulty
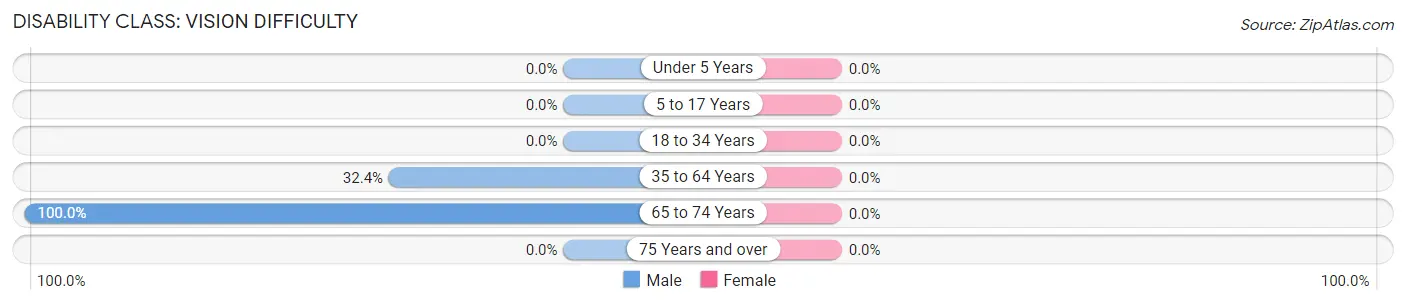
| Age Bracket | Male | Female |
| Under 5 Years | 0 (0.0%) | 0 (0.0%) |
| 5 to 17 Years | 0 (0.0%) | 0 (0.0%) |
| 18 to 34 Years | 0 (0.0%) | 0 (0.0%) |
| 35 to 64 Years | 34 (32.4%) | 0 (0.0%) |
| 65 to 74 Years | 8 (100.0%) | 0 (0.0%) |
| 75 Years and over | 0 (0.0%) | 0 (0.0%) |
Disability Class: Cognitive Difficulty
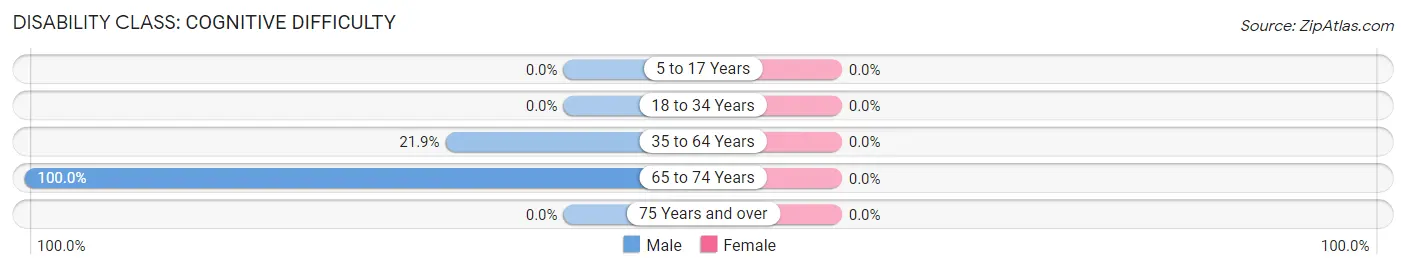
| Age Bracket | Male | Female |
| 5 to 17 Years | 0 (0.0%) | 0 (0.0%) |
| 18 to 34 Years | 0 (0.0%) | 0 (0.0%) |
| 35 to 64 Years | 23 (21.9%) | 0 (0.0%) |
| 65 to 74 Years | 8 (100.0%) | 0 (0.0%) |
| 75 Years and over | 0 (0.0%) | 0 (0.0%) |
Disability Class: Ambulatory Difficulty
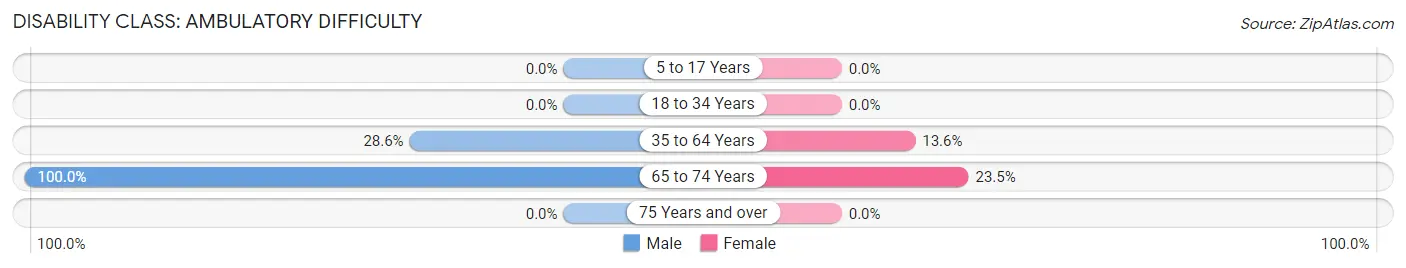
| Age Bracket | Male | Female |
| 5 to 17 Years | 0 (0.0%) | 0 (0.0%) |
| 18 to 34 Years | 0 (0.0%) | 0 (0.0%) |
| 35 to 64 Years | 30 (28.6%) | 6 (13.6%) |
| 65 to 74 Years | 8 (100.0%) | 4 (23.5%) |
| 75 Years and over | 0 (0.0%) | 0 (0.0%) |
Disability Class: Self-Care Difficulty
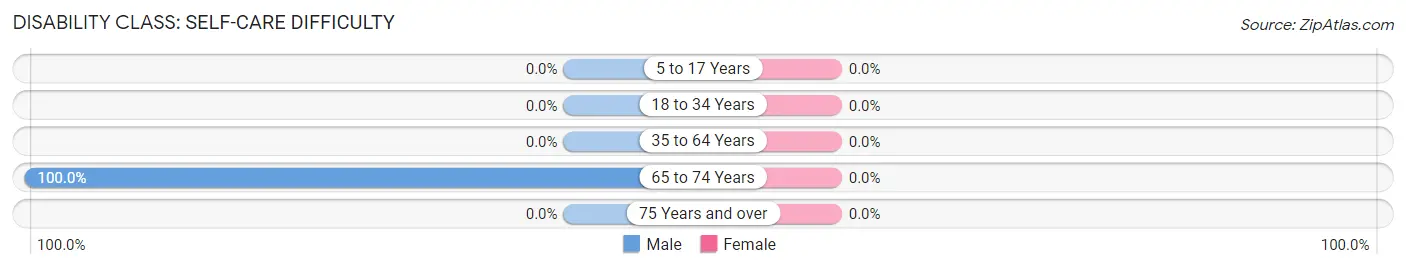
| Age Bracket | Male | Female |
| 5 to 17 Years | 0 (0.0%) | 0 (0.0%) |
| 18 to 34 Years | 0 (0.0%) | 0 (0.0%) |
| 35 to 64 Years | 0 (0.0%) | 0 (0.0%) |
| 65 to 74 Years | 8 (100.0%) | 0 (0.0%) |
| 75 Years and over | 0 (0.0%) | 0 (0.0%) |
Technology Access in Parker School
Computing Device Access in Parker School
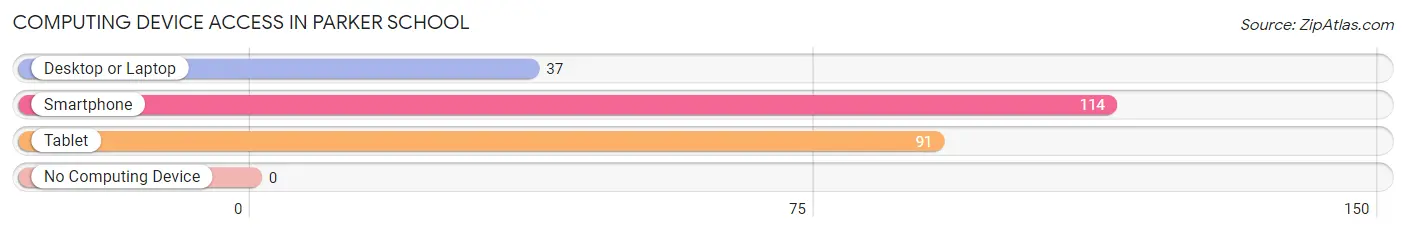
| Device Type | # Households | % Households |
| Desktop or Laptop | 37 | 31.4% |
| Smartphone | 114 | 96.6% |
| Tablet | 91 | 77.1% |
| No Computing Device | 0 | 0.0% |
| Total | 118 | 100.0% |
Internet Access in Parker School
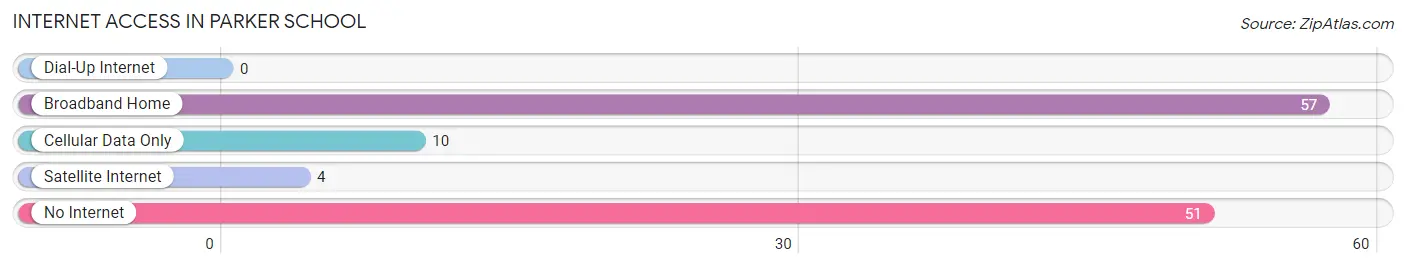
| Internet Type | # Households | % Households |
| Dial-Up Internet | 0 | 0.0% |
| Broadband Home | 57 | 48.3% |
| Cellular Data Only | 10 | 8.5% |
| Satellite Internet | 4 | 3.4% |
| No Internet | 51 | 43.2% |
| Total | 118 | 100.0% |
Parker School Summary
Parker School is a small, rural K-12 school located in the town of Parker, Montana. The school is part of the larger Parker School District, which serves the surrounding area. The school has a long history of providing quality education to its students, and has been a cornerstone of the community for over a century.
Geography
Parker School is located in the town of Parker, Montana, which is situated in the southeastern corner of the state. The town is located in the foothills of the Rocky Mountains, and is surrounded by rolling hills and grasslands. The area is known for its beautiful scenery and abundant wildlife. The town is located approximately 30 miles from the nearest major city, Billings, Montana.
The school is located on the main street of the town, and is surrounded by residential neighborhoods. The school is within walking distance of the town’s main shopping district, and is close to several parks and recreational areas.
History
Parker School was founded in 1891, and has been providing quality education to the community ever since. The school was originally a one-room schoolhouse, and was the only school in the area for many years. Over the years, the school has grown and expanded, and now serves students from kindergarten through twelfth grade.
The school has a long history of providing a quality education to its students. The school has been recognized for its academic excellence, and has been awarded numerous awards and accolades over the years. The school has also been a leader in the community, and has been involved in numerous community service projects.
Economy
The economy of Parker, Montana is largely based on agriculture and tourism. The town is home to several farms and ranches, and the surrounding area is known for its beautiful scenery and abundant wildlife. The town is also home to several tourist attractions, including the nearby Yellowstone National Park.
The town is also home to several small businesses, including restaurants, shops, and other services. The town is also home to several manufacturing companies, which provide jobs to the local population.
Demographics
As of the 2010 census, the population of Parker, Montana was 1,845. The town is predominantly white, with a small percentage of African American, Hispanic, and Native American residents. The median household income in the town is $41,000, and the median age is 37.
Conclusion
Parker School is a small, rural K-12 school located in the town of Parker, Montana. The school has a long history of providing quality education to its students, and has been a cornerstone of the community for over a century. The town is largely based on agriculture and tourism, and is home to several small businesses. The population of the town is predominantly white, with a small percentage of African American, Hispanic, and Native American residents. The school has been recognized for its academic excellence, and has been involved in numerous community service projects.
Common Questions
What is Per Capita Income in Parker School?
Per Capita income in Parker School is $11,550.
What is the Median Family Income in Parker School?
Median Family Income in Parker School is $14,519.
What is Inequality or Gini Index in Parker School?
Inequality or Gini Index in Parker School is 0.42.
What is the Total Population of Parker School?
Total Population of Parker School is 387.
What is the Total Male Population of Parker School?
Total Male Population of Parker School is 247.
What is the Total Female Population of Parker School?
Total Female Population of Parker School is 140.
What is the Ratio of Males per 100 Females in Parker School?
There are 176.43 Males per 100 Females in Parker School.
What is the Ratio of Females per 100 Males in Parker School?
There are 56.68 Females per 100 Males in Parker School.
What is the Median Population Age in Parker School?
Median Population Age in Parker School is 24.6 Years.
What is the Average Family Size in Parker School
Average Family Size in Parker School is 3.1 People.
What is the Average Household Size in Parker School
Average Household Size in Parker School is 3.3 People.
How Large is the Labor Force in Parker School?
There are 72 People in the Labor Forcein in Parker School.
What is the Percentage of People in the Labor Force in Parker School?
26.3% of People are in the Labor Force in Parker School.