Saddle Butte, MT Map & Demographics
Saddle Butte Map
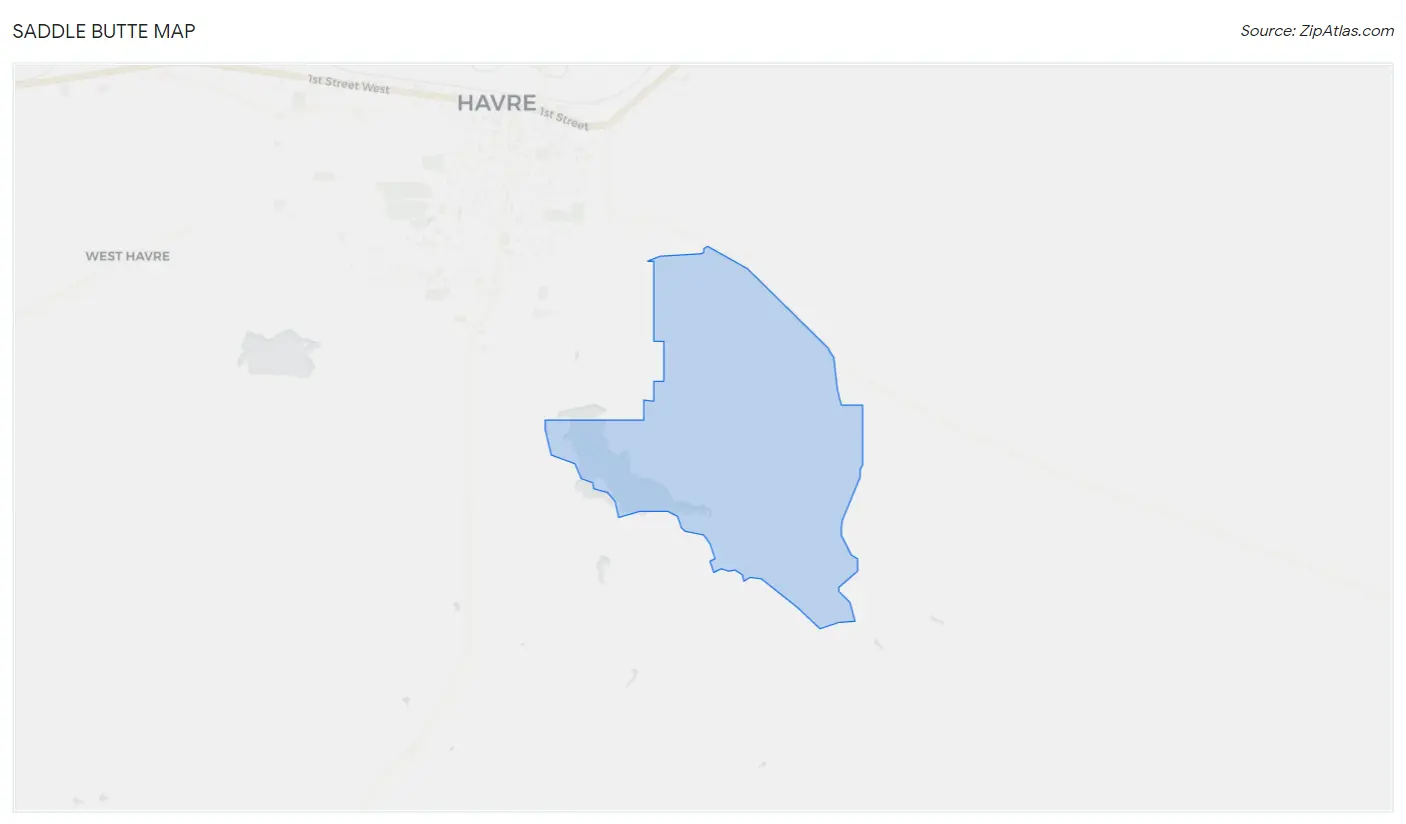
Saddle Butte Overview
$31,228
PER CAPITA INCOME
$83,359
AVG HOUSEHOLD INCOME
0.40
INEQUALITY / GINI INDEX
180
TOTAL POPULATION
90
MALE POPULATION
90
FEMALE POPULATION
100.00
MALES / 100 FEMALES
100.00
FEMALES / 100 MALES
35.6
MEDIAN AGE
3.5
AVG FAMILY SIZE
2.9
AVG HOUSEHOLD SIZE
99
LABOR FORCE [ PEOPLE ]
72.8%
PERCENT IN LABOR FORCE
14.1%
UNEMPLOYMENT RATE
Income in Saddle Butte
Income Overview in Saddle Butte
| Characteristic | Number | Measure |
| Per Capita Income | 180 | $31,228 |
| Median Family Income | 47 | $0 |
| Mean Family Income | 47 | $123,409 |
| Median Household Income | 63 | $83,359 |
| Mean Household Income | 63 | $96,986 |
| Income Deficit | 47 | $0 |
| Wage / Income Gap (%) | 180 | 0.00% |
| Wage / Income Gap ($) | 180 | 100.00¢ per $1 |
| Gini / Inequality Index | 180 | 0.40 |
Earnings by Sex in Saddle Butte
| Sex | Number | Average Earnings |
| Male | 48 (46.6%) | $0 |
| Female | 55 (53.4%) | $0 |
| Total | 103 (100.0%) | $0 |
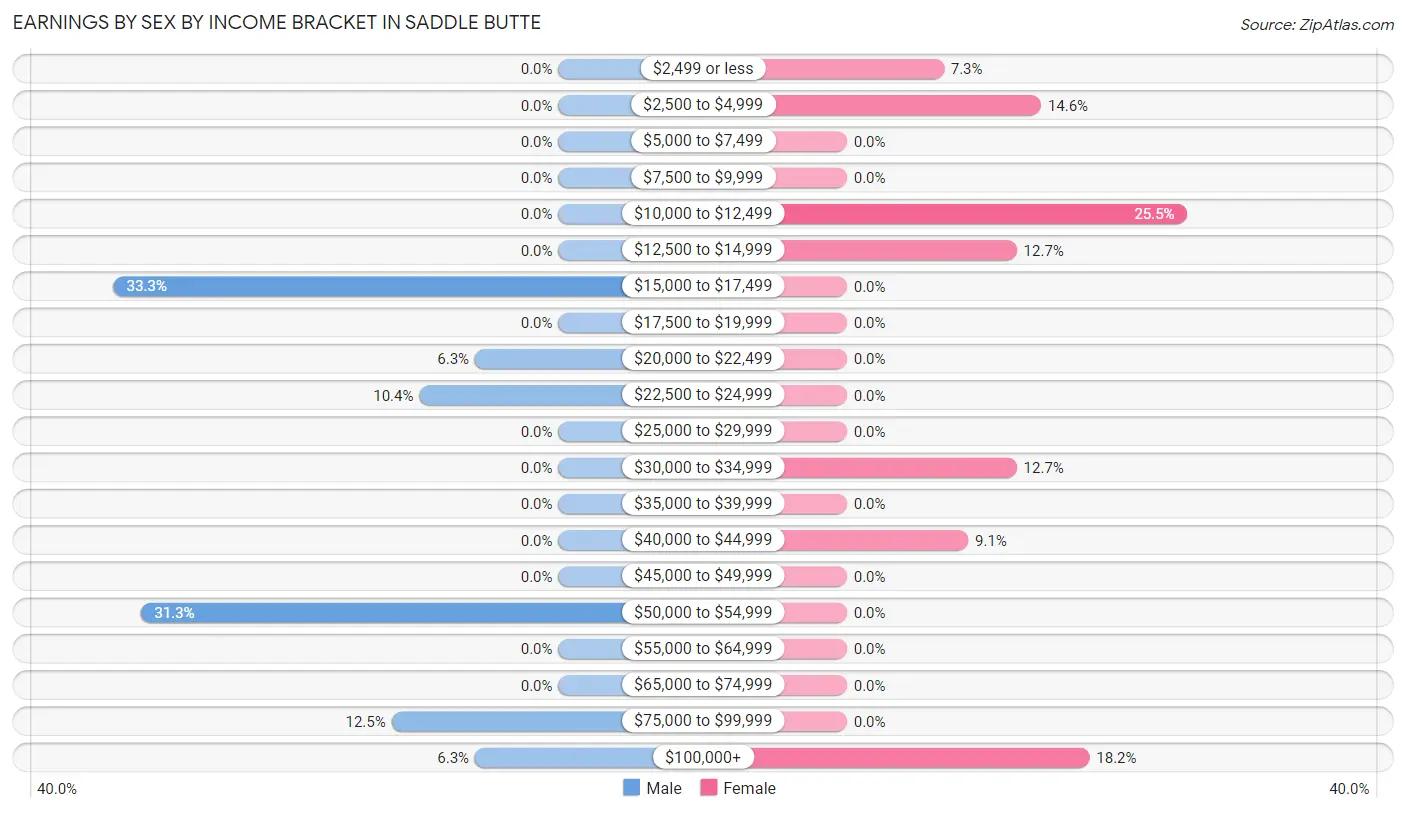
Earnings by Sex by Income Bracket in Saddle Butte
The most common earnings brackets in Saddle Butte are $15,000 to $17,499 for men (16 | 33.3%) and $10,000 to $12,499 for women (14 | 25.5%).
| Income | Male | Female |
| $2,499 or less | 0 (0.0%) | 4 (7.3%) |
| $2,500 to $4,999 | 0 (0.0%) | 8 (14.5%) |
| $5,000 to $7,499 | 0 (0.0%) | 0 (0.0%) |
| $7,500 to $9,999 | 0 (0.0%) | 0 (0.0%) |
| $10,000 to $12,499 | 0 (0.0%) | 14 (25.5%) |
| $12,500 to $14,999 | 0 (0.0%) | 7 (12.7%) |
| $15,000 to $17,499 | 16 (33.3%) | 0 (0.0%) |
| $17,500 to $19,999 | 0 (0.0%) | 0 (0.0%) |
| $20,000 to $22,499 | 3 (6.2%) | 0 (0.0%) |
| $22,500 to $24,999 | 5 (10.4%) | 0 (0.0%) |
| $25,000 to $29,999 | 0 (0.0%) | 0 (0.0%) |
| $30,000 to $34,999 | 0 (0.0%) | 7 (12.7%) |
| $35,000 to $39,999 | 0 (0.0%) | 0 (0.0%) |
| $40,000 to $44,999 | 0 (0.0%) | 5 (9.1%) |
| $45,000 to $49,999 | 0 (0.0%) | 0 (0.0%) |
| $50,000 to $54,999 | 15 (31.2%) | 0 (0.0%) |
| $55,000 to $64,999 | 0 (0.0%) | 0 (0.0%) |
| $65,000 to $74,999 | 0 (0.0%) | 0 (0.0%) |
| $75,000 to $99,999 | 6 (12.5%) | 0 (0.0%) |
| $100,000+ | 3 (6.2%) | 10 (18.2%) |
| Total | 48 (100.0%) | 55 (100.0%) |
Earnings by Sex by Educational Attainment in Saddle Butte
| Educational Attainment | Male Income | Female Income |
| Less than High School | - | - |
| High School Diploma | - | - |
| College or Associate's Degree | - | - |
| Bachelor's Degree | - | - |
| Graduate Degree | - | - |
| Total | $50,667 | $0 |
Family Income in Saddle Butte
Family Income Brackets in Saddle Butte
According to the Saddle Butte family income data, there are 16 families falling into the $75,000 to $99,999 income range, which is the most common income bracket and makes up 34.0% of all families.
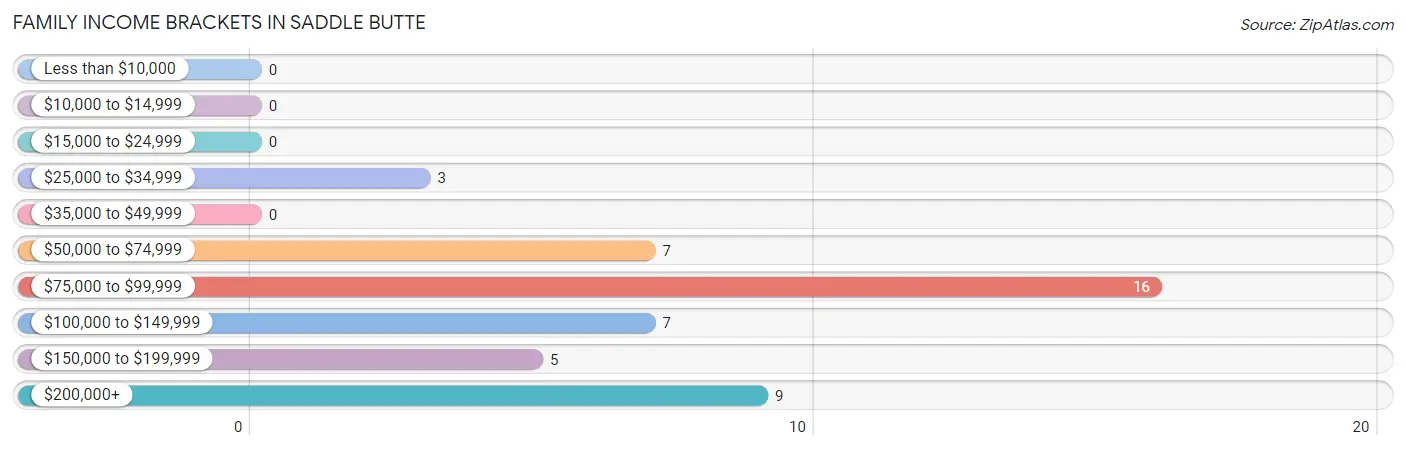
| Income Bracket | # Families | % Families |
| Less than $10,000 | 0 | 0.0% |
| $10,000 to $14,999 | 0 | 0.0% |
| $15,000 to $24,999 | 0 | 0.0% |
| $25,000 to $34,999 | 3 | 6.4% |
| $35,000 to $49,999 | 0 | 0.0% |
| $50,000 to $74,999 | 7 | 14.9% |
| $75,000 to $99,999 | 16 | 34.0% |
| $100,000 to $149,999 | 7 | 14.9% |
| $150,000 to $199,999 | 5 | 10.6% |
| $200,000+ | 9 | 19.1% |
Family Income by Famaliy Size in Saddle Butte
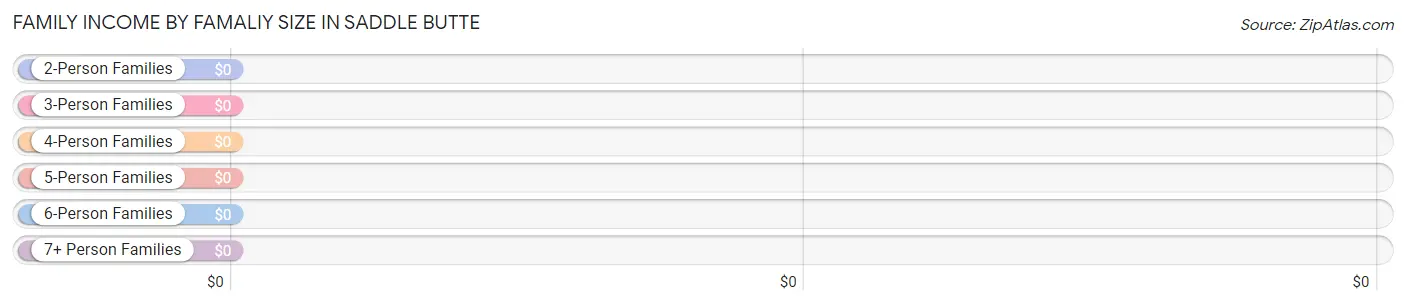
| Income Bracket | # Families | Median Income |
| 2-Person Families | 19 (40.4%) | $0 |
| 3-Person Families | 0 (0.0%) | $0 |
| 4-Person Families | 16 (34.0%) | $0 |
| 5-Person Families | 7 (14.9%) | $0 |
| 6-Person Families | 5 (10.6%) | $0 |
| 7+ Person Families | 0 (0.0%) | $0 |
| Total | 47 (100.0%) | $0 |
Family Income by Number of Earners in Saddle Butte
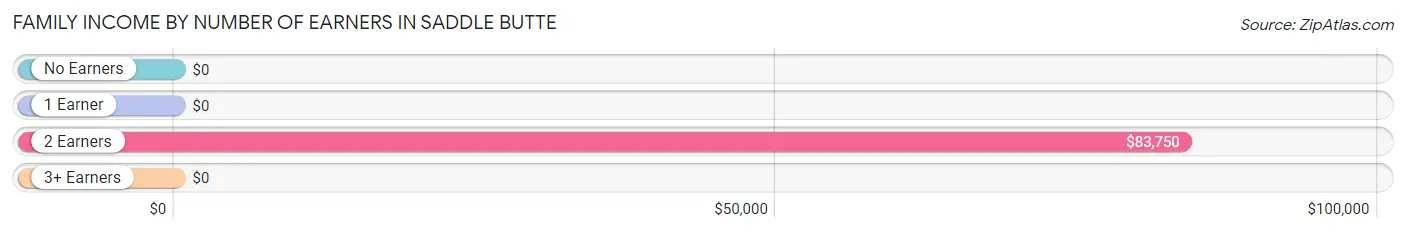
| Number of Earners | # Families | Median Income |
| No Earners | 3 (6.4%) | $0 |
| 1 Earner | 0 (0.0%) | $0 |
| 2 Earners | 30 (63.8%) | $83,750 |
| 3+ Earners | 14 (29.8%) | $0 |
| Total | 47 (100.0%) | $0 |
Household Income in Saddle Butte
Household Income Brackets in Saddle Butte
With 16 households falling in the category, the $15,000 to $24,999 income range is the most frequent in Saddle Butte, accounting for 25.4% of all households.
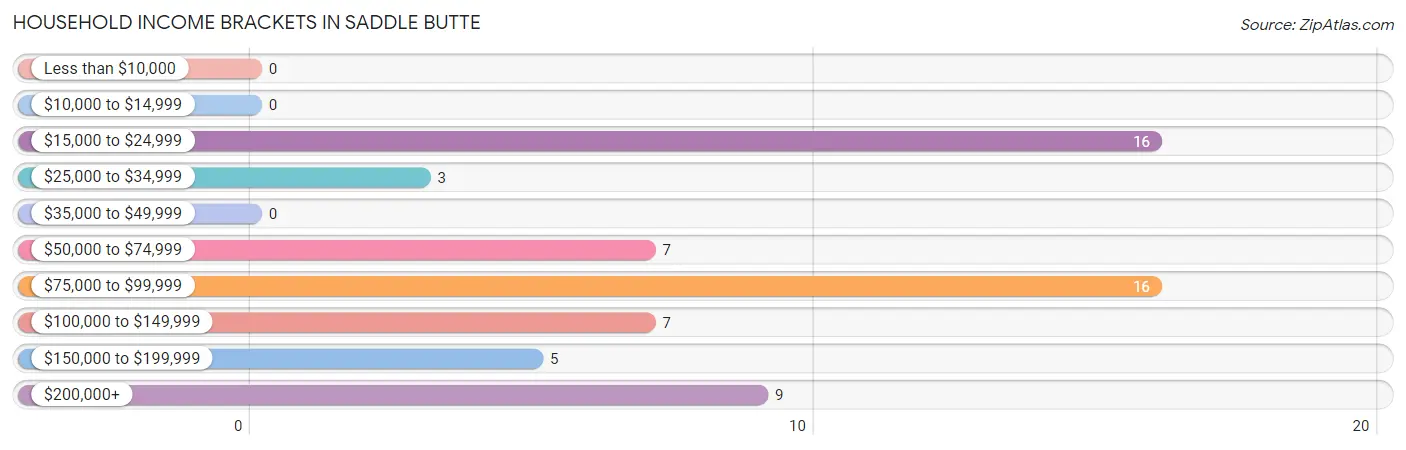
| Income Bracket | # Households | % Households |
| Less than $10,000 | 0 | 0.0% |
| $10,000 to $14,999 | 0 | 0.0% |
| $15,000 to $24,999 | 16 | 25.4% |
| $25,000 to $34,999 | 3 | 4.8% |
| $35,000 to $49,999 | 0 | 0.0% |
| $50,000 to $74,999 | 7 | 11.1% |
| $75,000 to $99,999 | 16 | 25.4% |
| $100,000 to $149,999 | 7 | 11.1% |
| $150,000 to $199,999 | 5 | 7.9% |
| $200,000+ | 9 | 14.3% |
Household Income by Householder Age in Saddle Butte
| Income Bracket | # Households | Median Income |
| 15 to 24 Years | 0 (0.0%) | $0 |
| 25 to 44 Years | 30 (47.6%) | $0 |
| 45 to 64 Years | 14 (22.2%) | $0 |
| 65+ Years | 19 (30.2%) | $0 |
| Total | 63 (100.0%) | $83,359 |
Poverty in Saddle Butte
Income Below Poverty by Sex and Age in Saddle Butte
| Age Bracket | Male | Female |
| Under 5 Years | 0 (0.0%) | 0 (0.0%) |
| 5 Years | 0 (0.0%) | 0 (0.0%) |
| 6 to 11 Years | 0 (0.0%) | 0 (0.0%) |
| 12 to 14 Years | 0 (0.0%) | 0 (0.0%) |
| 15 Years | 0 (0.0%) | 0 (0.0%) |
| 16 and 17 Years | 0 (0.0%) | 0 (0.0%) |
| 18 to 24 Years | 0 (0.0%) | 0 (0.0%) |
| 25 to 34 Years | 0 (0.0%) | 0 (0.0%) |
| 35 to 44 Years | 0 (0.0%) | 0 (0.0%) |
| 45 to 54 Years | 0 (0.0%) | 0 (0.0%) |
| 55 to 64 Years | 0 (0.0%) | 0 (0.0%) |
| 65 to 74 Years | 0 (0.0%) | 0 (0.0%) |
| 75 Years and over | 0 (0.0%) | 0 (0.0%) |
| Total | 0 (0.0%) | 0 (0.0%) |
Income Above Poverty by Sex and Age in Saddle Butte
According to the poverty statistics in Saddle Butte, males aged 6 to 11 years and females aged 6 to 11 years are the age groups that are most secure financially, with 100.0% of males and 100.0% of females in these age groups living above the poverty line.
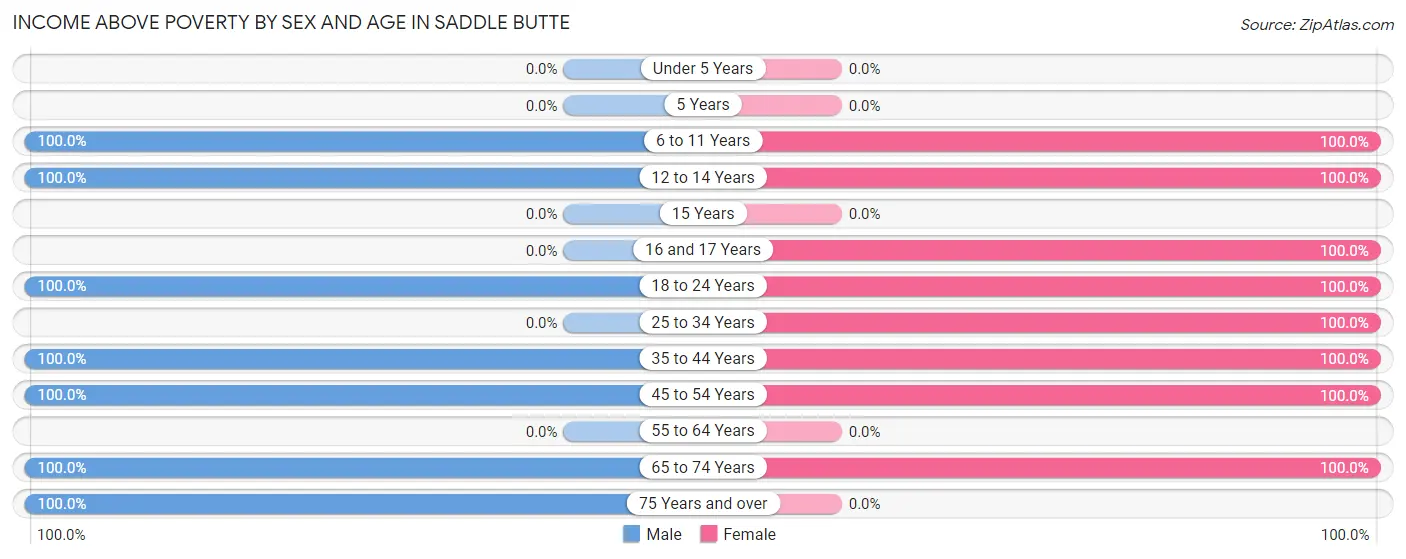
| Age Bracket | Male | Female |
| Under 5 Years | 0 (0.0%) | 0 (0.0%) |
| 5 Years | 0 (0.0%) | 0 (0.0%) |
| 6 to 11 Years | 19 (100.0%) | 4 (100.0%) |
| 12 to 14 Years | 16 (100.0%) | 5 (100.0%) |
| 15 Years | 0 (0.0%) | 0 (0.0%) |
| 16 and 17 Years | 0 (0.0%) | 10 (100.0%) |
| 18 to 24 Years | 8 (100.0%) | 8 (100.0%) |
| 25 to 34 Years | 0 (0.0%) | 16 (100.0%) |
| 35 to 44 Years | 9 (100.0%) | 14 (100.0%) |
| 45 to 54 Years | 15 (100.0%) | 15 (100.0%) |
| 55 to 64 Years | 0 (0.0%) | 0 (0.0%) |
| 65 to 74 Years | 19 (100.0%) | 18 (100.0%) |
| 75 Years and over | 4 (100.0%) | 0 (0.0%) |
| Total | 90 (100.0%) | 90 (100.0%) |
Income Below Poverty Among Married-Couple Families in Saddle Butte
| Children | Above Poverty | Below Poverty |
| No Children | 28 (100.0%) | 0 (0.0%) |
| 1 or 2 Children | 12 (100.0%) | 0 (0.0%) |
| 3 or 4 Children | 7 (100.0%) | 0 (0.0%) |
| 5 or more Children | 0 (0.0%) | 0 (0.0%) |
| Total | 47 (100.0%) | 0 (0.0%) |
Income Below Poverty Among Single-Parent Households in Saddle Butte
| Children | Single Father | Single Mother |
| No Children | 0 (0.0%) | 0 (0.0%) |
| 1 or 2 Children | 0 (0.0%) | 0 (0.0%) |
| 3 or 4 Children | 0 (0.0%) | 0 (0.0%) |
| 5 or more Children | 0 (0.0%) | 0 (0.0%) |
| Total | 0 (0.0%) | 0 (0.0%) |
Income Below Poverty Among Married-Couple vs Single-Parent Households in Saddle Butte
| Children | Married-Couple Families | Single-Parent Households |
| No Children | 0 (0.0%) | 0 (0.0%) |
| 1 or 2 Children | 0 (0.0%) | 0 (0.0%) |
| 3 or 4 Children | 0 (0.0%) | 0 (0.0%) |
| 5 or more Children | 0 (0.0%) | 0 (0.0%) |
| Total | 0 (0.0%) | 0 (0.0%) |
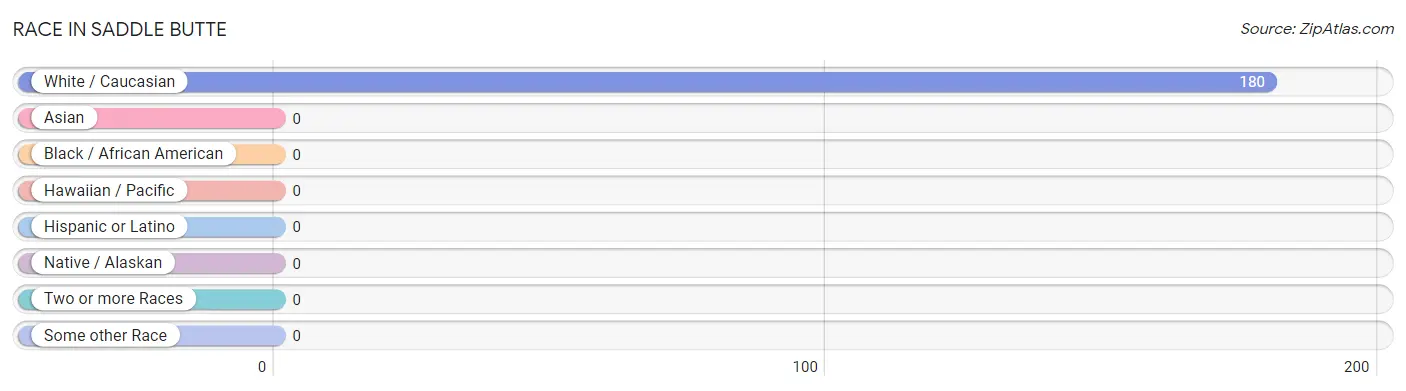
Race in Saddle Butte
The most populous races in Saddle Butte are , and White / Caucasian (180 | 100.0%).
| Race | # Population | % Population |
| Asian | 0 | 0.0% |
| Black / African American | 0 | 0.0% |
| Hawaiian / Pacific | 0 | 0.0% |
| Hispanic or Latino | 0 | 0.0% |
| Native / Alaskan | 0 | 0.0% |
| White / Caucasian | 180 | 100.0% |
| Two or more Races | 0 | 0.0% |
| Some other Race | 0 | 0.0% |
| Total | 180 | 100.0% |
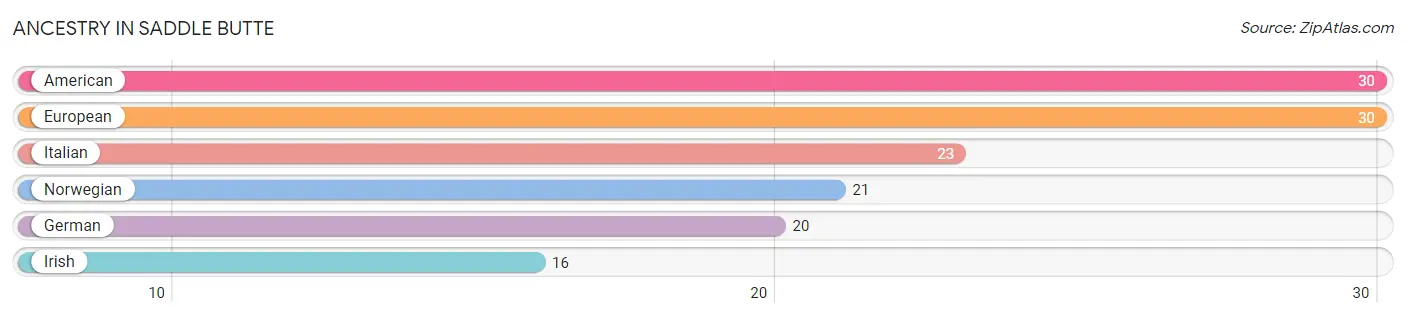
Ancestry in Saddle Butte
The most populous ancestries reported in Saddle Butte are American (30 | 16.7%), European (30 | 16.7%), Italian (23 | 12.8%), Norwegian (21 | 11.7%), and German (20 | 11.1%), together accounting for 68.9% of all Saddle Butte residents.
| Ancestry | # Population | % Population |
| American | 30 | 16.7% |
| European | 30 | 16.7% |
| German | 20 | 11.1% |
| Irish | 16 | 8.9% |
| Italian | 23 | 12.8% |
| Norwegian | 21 | 11.7% | View All 6 Rows |
Immigrants in Saddle Butte

| Immigration Origin | # Population | % Population | View All 0 Rows |
Sex and Age in Saddle Butte
Sex and Age in Saddle Butte
The most populous age groups in Saddle Butte are 5 to 9 Years (19 | 21.1%) for men and 15 to 19 Years (18 | 20.0%) for women.
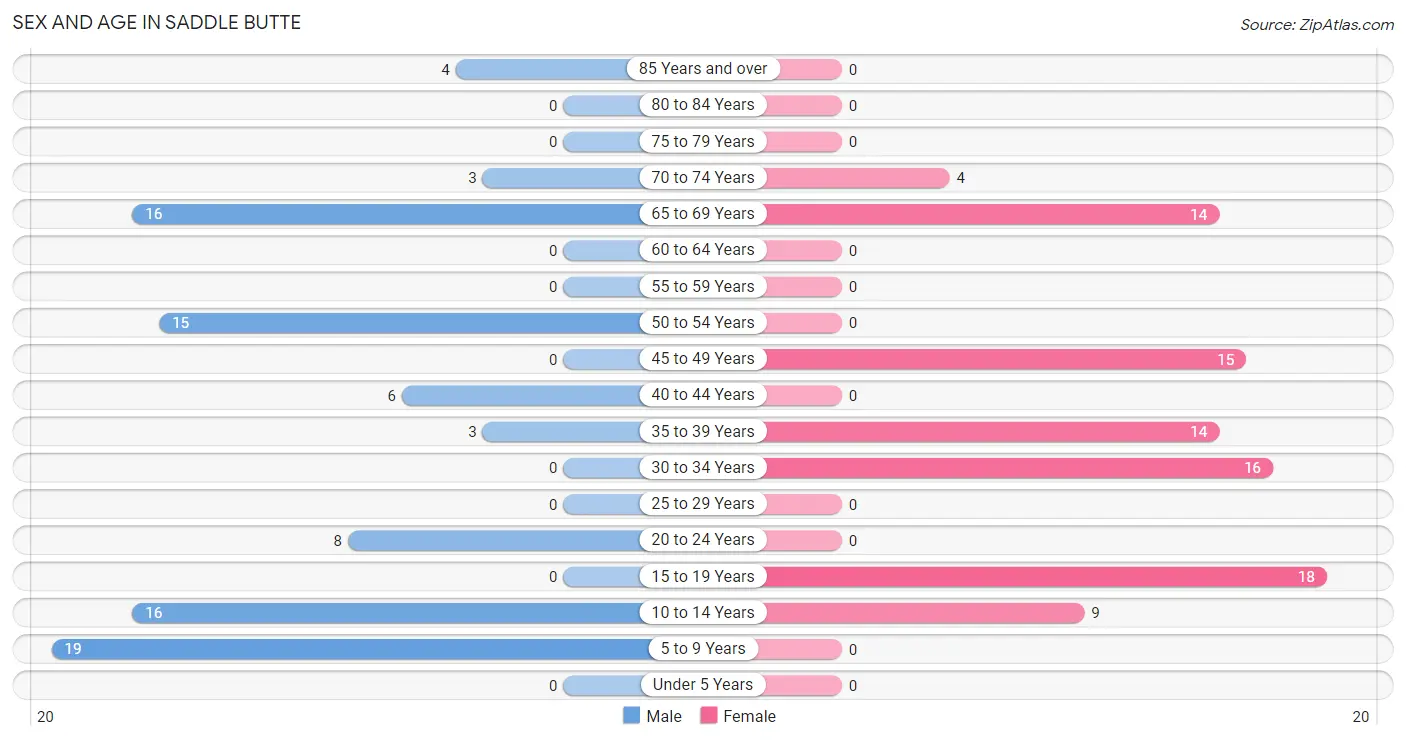
| Age Bracket | Male | Female |
| Under 5 Years | 0 (0.0%) | 0 (0.0%) |
| 5 to 9 Years | 19 (21.1%) | 0 (0.0%) |
| 10 to 14 Years | 16 (17.8%) | 9 (10.0%) |
| 15 to 19 Years | 0 (0.0%) | 18 (20.0%) |
| 20 to 24 Years | 8 (8.9%) | 0 (0.0%) |
| 25 to 29 Years | 0 (0.0%) | 0 (0.0%) |
| 30 to 34 Years | 0 (0.0%) | 16 (17.8%) |
| 35 to 39 Years | 3 (3.3%) | 14 (15.6%) |
| 40 to 44 Years | 6 (6.7%) | 0 (0.0%) |
| 45 to 49 Years | 0 (0.0%) | 15 (16.7%) |
| 50 to 54 Years | 15 (16.7%) | 0 (0.0%) |
| 55 to 59 Years | 0 (0.0%) | 0 (0.0%) |
| 60 to 64 Years | 0 (0.0%) | 0 (0.0%) |
| 65 to 69 Years | 16 (17.8%) | 14 (15.6%) |
| 70 to 74 Years | 3 (3.3%) | 4 (4.4%) |
| 75 to 79 Years | 0 (0.0%) | 0 (0.0%) |
| 80 to 84 Years | 0 (0.0%) | 0 (0.0%) |
| 85 Years and over | 4 (4.4%) | 0 (0.0%) |
| Total | 90 (100.0%) | 90 (100.0%) |
Families and Households in Saddle Butte
Median Family Size in Saddle Butte
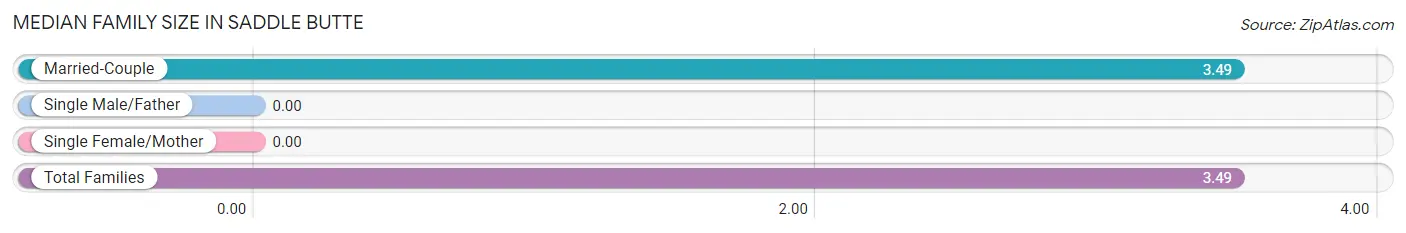
| Family Type | # Families | Family Size |
| Married-Couple | 47 (100.0%) | 3.49 |
| Single Male/Father | 0 (0.0%) | - |
| Single Female/Mother | 0 (0.0%) | - |
| Total Families | 47 (100.0%) | 3.49 |
Median Household Size in Saddle Butte
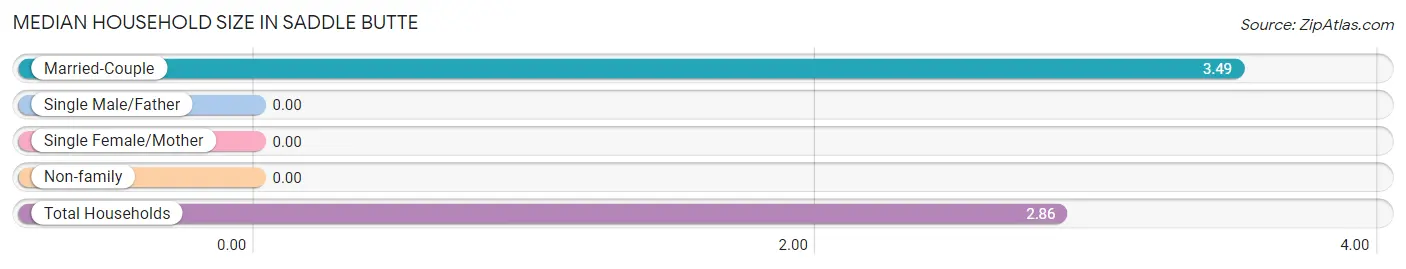
| Household Type | # Households | Household Size |
| Married-Couple | 47 (74.6%) | 3.49 |
| Single Male/Father | 0 (0.0%) | - |
| Single Female/Mother | 0 (0.0%) | - |
| Non-family | 16 (25.4%) | - |
| Total Households | 63 (100.0%) | 2.86 |
Household Size by Marriage Status in Saddle Butte
Out of a total of 63 households in Saddle Butte, 47 (74.6%) are family households, while 16 (25.4%) are nonfamily households. The most numerous type of family households are 2-person households, comprising 19, and the most common type of nonfamily households are 1-person households, comprising 16.

| Household Size | Family Households | Nonfamily Households |
| 1-Person Households | - | 16 (25.4%) |
| 2-Person Households | 19 (30.2%) | 0 (0.0%) |
| 3-Person Households | 0 (0.0%) | 0 (0.0%) |
| 4-Person Households | 16 (25.4%) | 0 (0.0%) |
| 5-Person Households | 7 (11.1%) | 0 (0.0%) |
| 6-Person Households | 5 (7.9%) | 0 (0.0%) |
| 7+ Person Households | 0 (0.0%) | 0 (0.0%) |
| Total | 47 (74.6%) | 16 (25.4%) |
Female Fertility in Saddle Butte
Fertility by Age in Saddle Butte
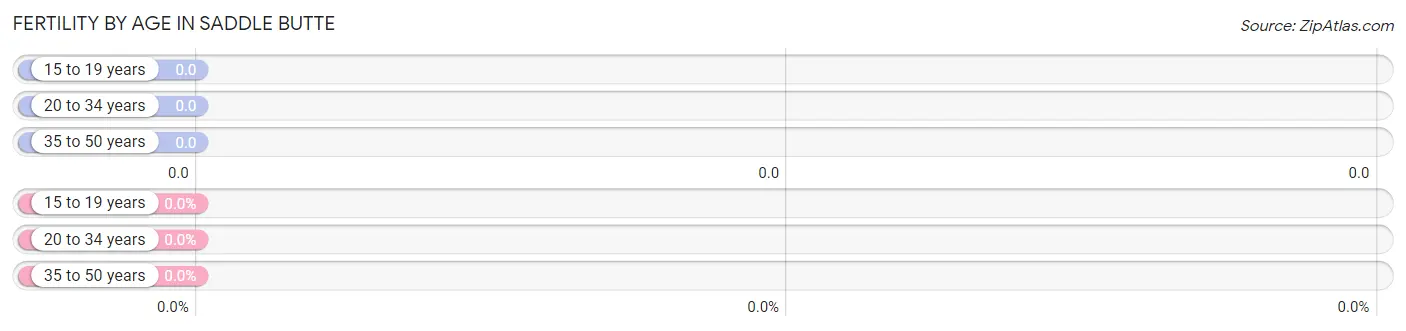
| Age Bracket | Women with Births | Births / 1,000 Women |
| 15 to 19 years | 0 (0.0%) | 0.0 |
| 20 to 34 years | 0 (0.0%) | 0.0 |
| 35 to 50 years | 0 (0.0%) | 0.0 |
| Total | 0 (0.0%) | 0.0 |
Fertility by Age by Marriage Status in Saddle Butte
| Age Bracket | Married | Unmarried |
| 15 to 19 years | 0 (0.0%) | 0 (0.0%) |
| 20 to 34 years | 0 (0.0%) | 0 (0.0%) |
| 35 to 50 years | 0 (0.0%) | 0 (0.0%) |
| Total | 0 (0.0%) | 0 (0.0%) |
Fertility by Education in Saddle Butte
| Educational Attainment | Women with Births | Births / 1,000 Women |
| Less than High School | 0 (0.0%) | 0.0 |
| High School Diploma | 0 (0.0%) | 0.0 |
| College or Associate's Degree | 0 (0.0%) | 0.0 |
| Bachelor's Degree | 0 (0.0%) | 0.0 |
| Graduate Degree | 0 (0.0%) | 0.0 |
| Total | 0 (0.0%) | 0.0 |
Fertility by Education by Marriage Status in Saddle Butte
| Educational Attainment | Married | Unmarried |
| Less than High School | 0 (0.0%) | 0 (0.0%) |
| High School Diploma | 0 (0.0%) | 0 (0.0%) |
| College or Associate's Degree | 0 (0.0%) | 0 (0.0%) |
| Bachelor's Degree | 0 (0.0%) | 0 (0.0%) |
| Graduate Degree | 0 (0.0%) | 0 (0.0%) |
| Total | 0 (0.0%) | 0 (0.0%) |
Employment Characteristics in Saddle Butte
Employment by Class of Employer in Saddle Butte
Among the 85 employed individuals in Saddle Butte, private company employees (40 | 47.1%), not-for-profit organizations (20 | 23.5%), and self-employed (not incorporated) (16 | 18.8%) make up the most common classes of employment.
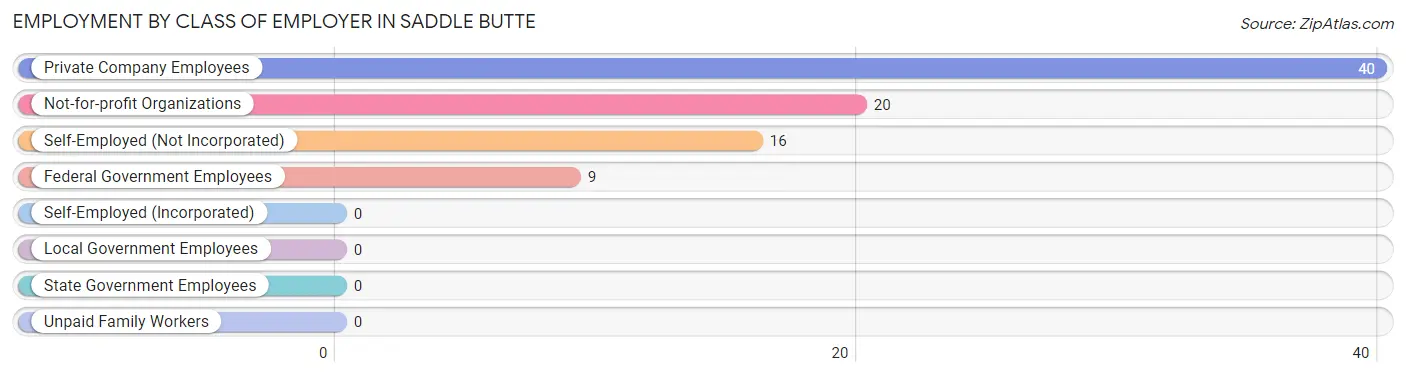
| Employer Class | # Employees | % Employees |
| Private Company Employees | 40 | 47.1% |
| Self-Employed (Incorporated) | 0 | 0.0% |
| Self-Employed (Not Incorporated) | 16 | 18.8% |
| Not-for-profit Organizations | 20 | 23.5% |
| Local Government Employees | 0 | 0.0% |
| State Government Employees | 0 | 0.0% |
| Federal Government Employees | 9 | 10.6% |
| Unpaid Family Workers | 0 | 0.0% |
| Total | 85 | 100.0% |
Employment Status by Age in Saddle Butte
According to the labor force statistics for Saddle Butte, out of the total population over 16 years of age (136), 72.8% or 99 individuals are in the labor force, with 14.1% or 14 of them unemployed. The age group with the highest labor force participation rate is 20 to 24 years, with 100.0% or 8 individuals in the labor force. Within the labor force, the 65 to 74 years age range has the highest percentage of unemployed individuals, with 46.7% or 14 of them being unemployed.
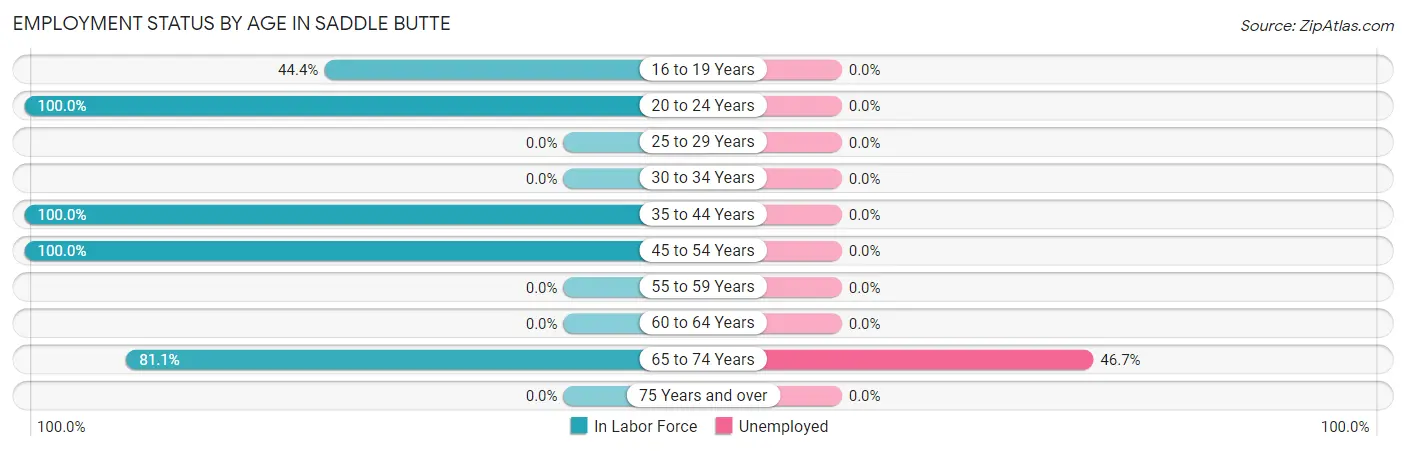
| Age Bracket | In Labor Force | Unemployed |
| 16 to 19 Years | 8 (44.4%) | 0 (0.0%) |
| 20 to 24 Years | 8 (100.0%) | 0 (0.0%) |
| 25 to 29 Years | 0 (0.0%) | 0 (0.0%) |
| 30 to 34 Years | 0 (0.0%) | 0 (0.0%) |
| 35 to 44 Years | 23 (100.0%) | 0 (0.0%) |
| 45 to 54 Years | 30 (100.0%) | 0 (0.0%) |
| 55 to 59 Years | 0 (0.0%) | 0 (0.0%) |
| 60 to 64 Years | 0 (0.0%) | 0 (0.0%) |
| 65 to 74 Years | 30 (81.1%) | 14 (46.7%) |
| 75 Years and over | 0 (0.0%) | 0 (0.0%) |
| Total | 99 (72.8%) | 14 (14.1%) |
Employment Status by Educational Attainment in Saddle Butte
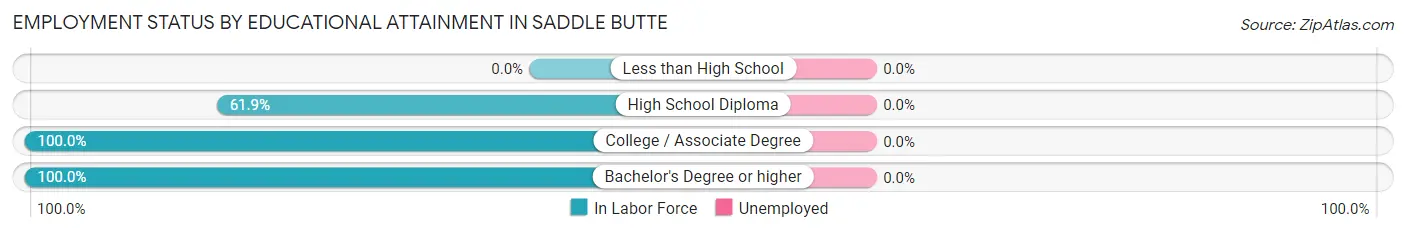
| Educational Attainment | In Labor Force | Unemployed |
| Less than High School | 0 (0.0%) | 0 (0.0%) |
| High School Diploma | 26 (61.9%) | 0 (0.0%) |
| College / Associate Degree | 19 (100.0%) | 0 (0.0%) |
| Bachelor's Degree or higher | 8 (100.0%) | 0 (0.0%) |
| Total | 53 (76.8%) | 0 (0.0%) |
Employment Occupations by Sex in Saddle Butte
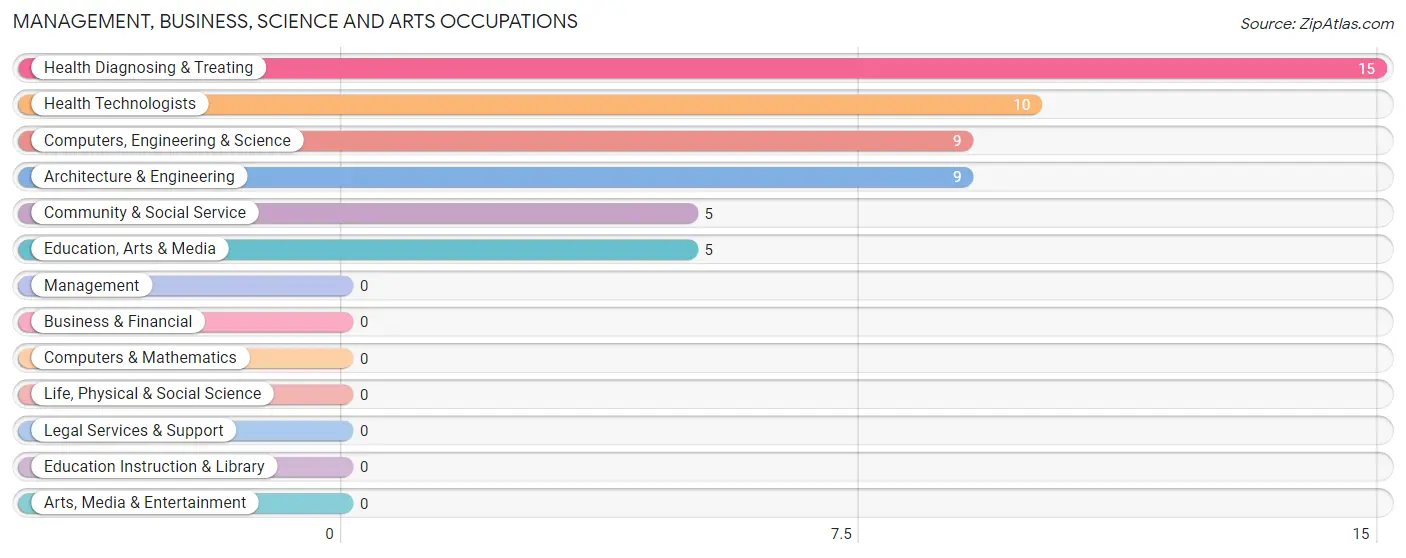
Management, Business, Science and Arts Occupations
The most common Management, Business, Science and Arts occupations in Saddle Butte are Health Diagnosing & Treating (15 | 17.6%), Health Technologists (10 | 11.8%), Computers, Engineering & Science (9 | 10.6%), Architecture & Engineering (9 | 10.6%), and Community & Social Service (5 | 5.9%).
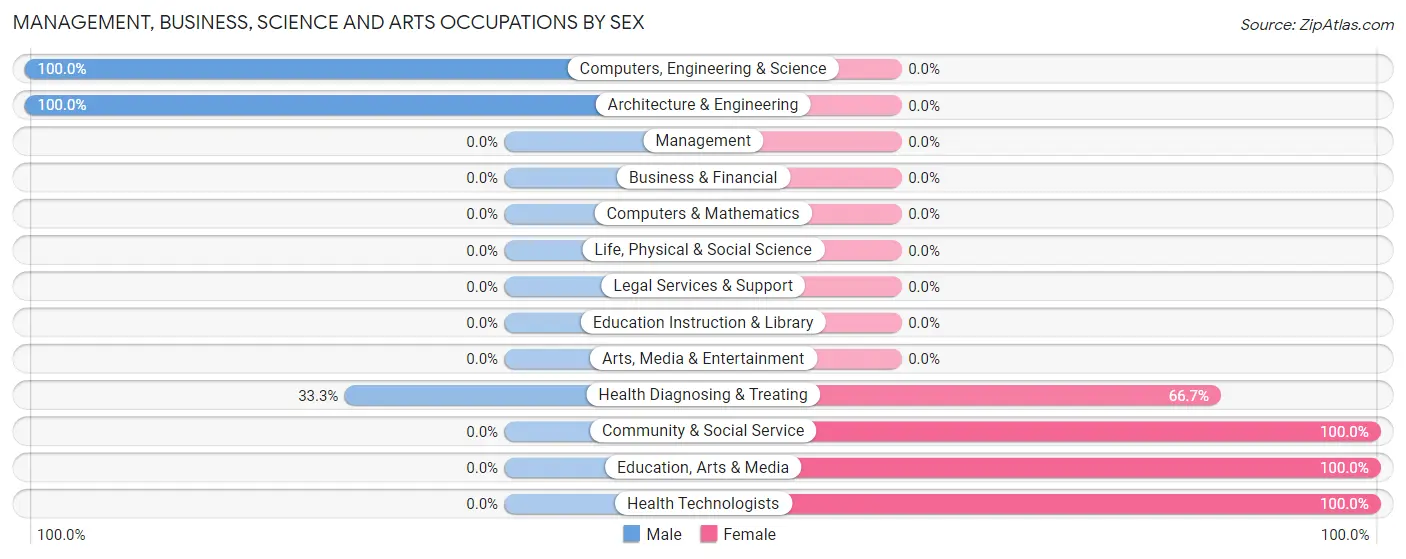
Management, Business, Science and Arts Occupations by Sex
Within the Management, Business, Science and Arts occupations in Saddle Butte, the most male-oriented occupations are Computers, Engineering & Science (100.0%), Architecture & Engineering (100.0%), and Health Diagnosing & Treating (33.3%), while the most female-oriented occupations are Community & Social Service (100.0%), Education, Arts & Media (100.0%), and Health Technologists (100.0%).
| Occupation | Male | Female |
| Management | 0 (0.0%) | 0 (0.0%) |
| Business & Financial | 0 (0.0%) | 0 (0.0%) |
| Computers, Engineering & Science | 9 (100.0%) | 0 (0.0%) |
| Computers & Mathematics | 0 (0.0%) | 0 (0.0%) |
| Architecture & Engineering | 9 (100.0%) | 0 (0.0%) |
| Life, Physical & Social Science | 0 (0.0%) | 0 (0.0%) |
| Community & Social Service | 0 (0.0%) | 5 (100.0%) |
| Education, Arts & Media | 0 (0.0%) | 5 (100.0%) |
| Legal Services & Support | 0 (0.0%) | 0 (0.0%) |
| Education Instruction & Library | 0 (0.0%) | 0 (0.0%) |
| Arts, Media & Entertainment | 0 (0.0%) | 0 (0.0%) |
| Health Diagnosing & Treating | 5 (33.3%) | 10 (66.7%) |
| Health Technologists | 0 (0.0%) | 10 (100.0%) |
| Total (Category) | 14 (48.3%) | 15 (51.7%) |
| Total (Overall) | 48 (56.5%) | 37 (43.5%) |
Services Occupations
The most common Services occupations in Saddle Butte are Healthcare Support (8 | 9.4%), and Food Preparation & Serving (7 | 8.2%).
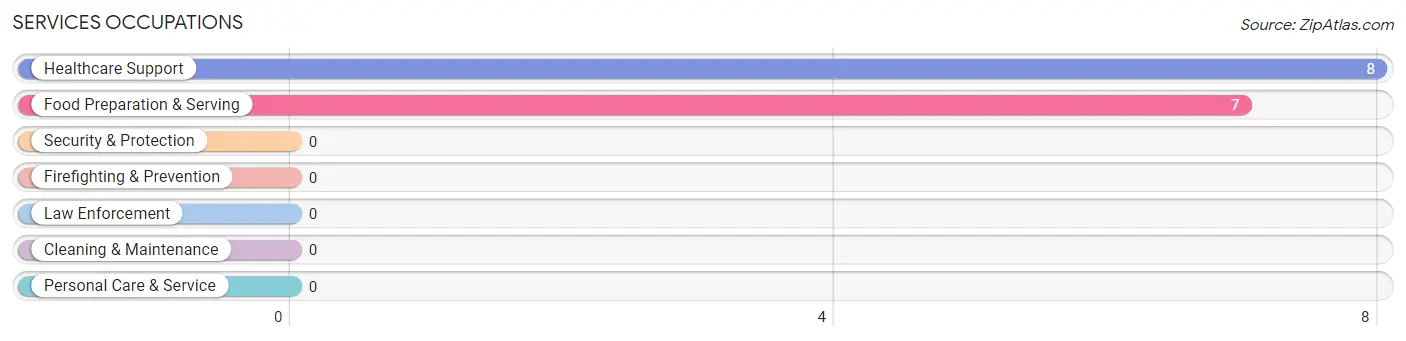
Services Occupations by Sex
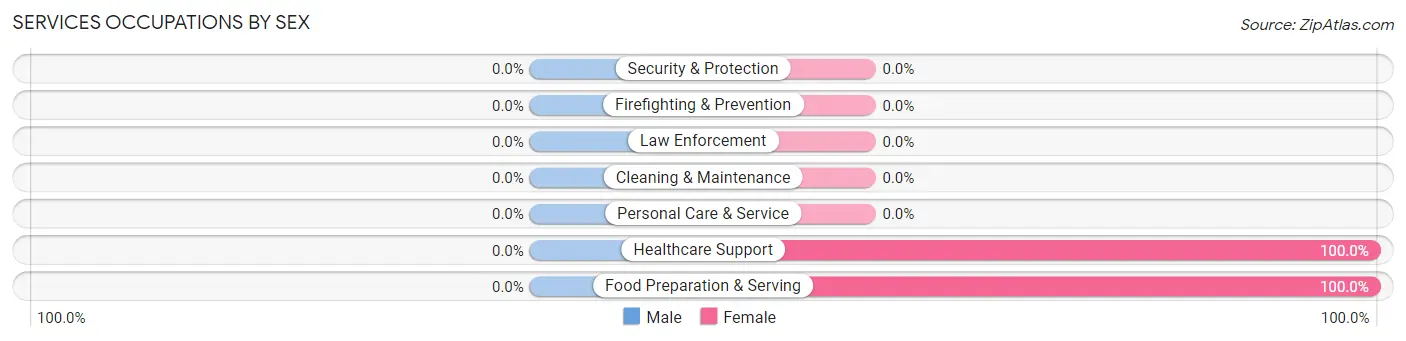
| Occupation | Male | Female |
| Healthcare Support | 0 (0.0%) | 8 (100.0%) |
| Security & Protection | 0 (0.0%) | 0 (0.0%) |
| Firefighting & Prevention | 0 (0.0%) | 0 (0.0%) |
| Law Enforcement | 0 (0.0%) | 0 (0.0%) |
| Food Preparation & Serving | 0 (0.0%) | 7 (100.0%) |
| Cleaning & Maintenance | 0 (0.0%) | 0 (0.0%) |
| Personal Care & Service | 0 (0.0%) | 0 (0.0%) |
| Total (Category) | 0 (0.0%) | 15 (100.0%) |
| Total (Overall) | 48 (56.5%) | 37 (43.5%) |
Sales and Office Occupations
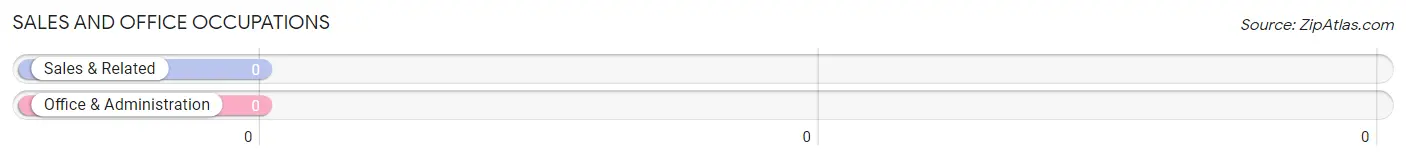
Sales and Office Occupations by Sex
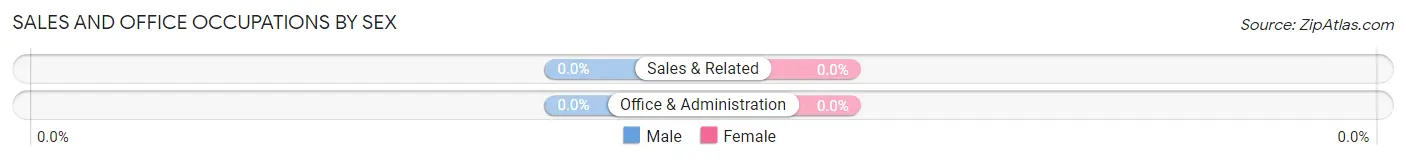
| Occupation | Male | Female |
| Sales & Related | 0 (0.0%) | 0 (0.0%) |
| Office & Administration | 0 (0.0%) | 0 (0.0%) |
| Total (Category) | 0 (0.0%) | 0 (0.0%) |
| Total (Overall) | 48 (56.5%) | 37 (43.5%) |
Natural Resources, Construction and Maintenance Occupations
The most common Natural Resources, Construction and Maintenance occupations in Saddle Butte are , and Construction & Extraction (16 | 18.8%).
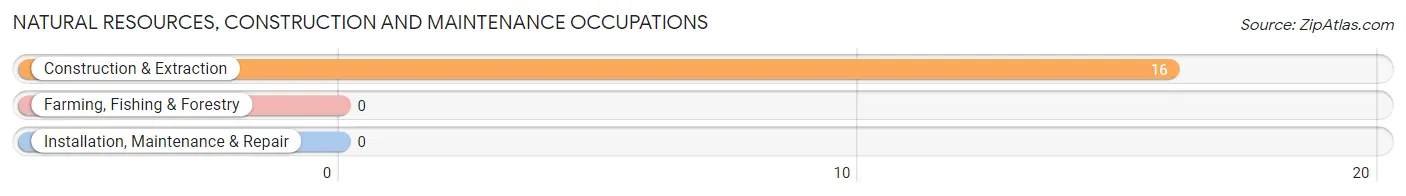
Natural Resources, Construction and Maintenance Occupations by Sex
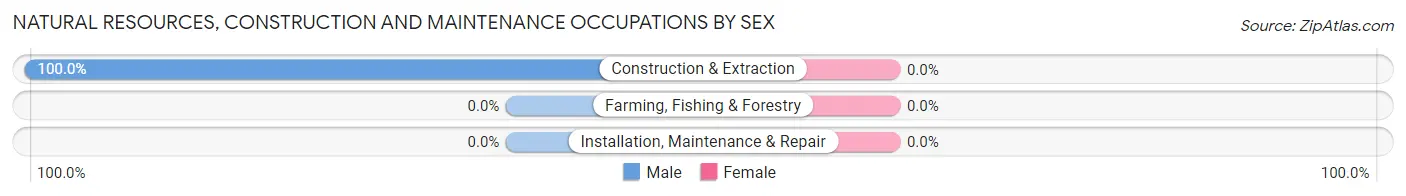
| Occupation | Male | Female |
| Farming, Fishing & Forestry | 0 (0.0%) | 0 (0.0%) |
| Construction & Extraction | 16 (100.0%) | 0 (0.0%) |
| Installation, Maintenance & Repair | 0 (0.0%) | 0 (0.0%) |
| Total (Category) | 16 (100.0%) | 0 (0.0%) |
| Total (Overall) | 48 (56.5%) | 37 (43.5%) |
Production, Transportation and Moving Occupations
The most common Production, Transportation and Moving occupations in Saddle Butte are Transportation (19 | 22.4%), Production (3 | 3.5%), and Material Moving (3 | 3.5%).
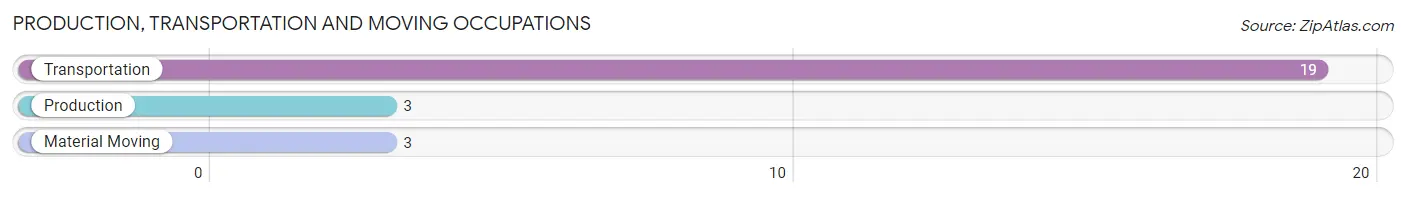
Production, Transportation and Moving Occupations by Sex
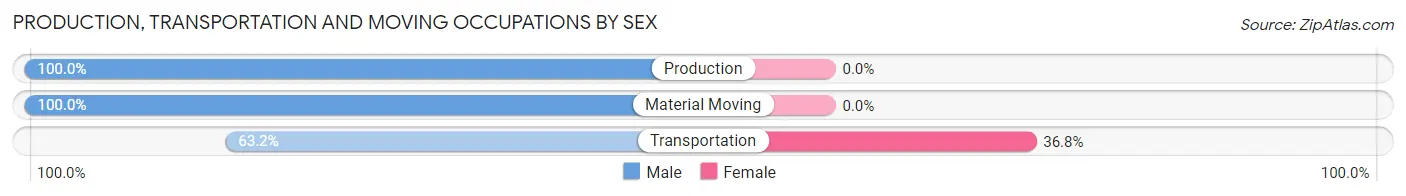
| Occupation | Male | Female |
| Production | 3 (100.0%) | 0 (0.0%) |
| Transportation | 12 (63.2%) | 7 (36.8%) |
| Material Moving | 3 (100.0%) | 0 (0.0%) |
| Total (Category) | 18 (72.0%) | 7 (28.0%) |
| Total (Overall) | 48 (56.5%) | 37 (43.5%) |
Employment Industries by Sex in Saddle Butte
Employment Industries in Saddle Butte
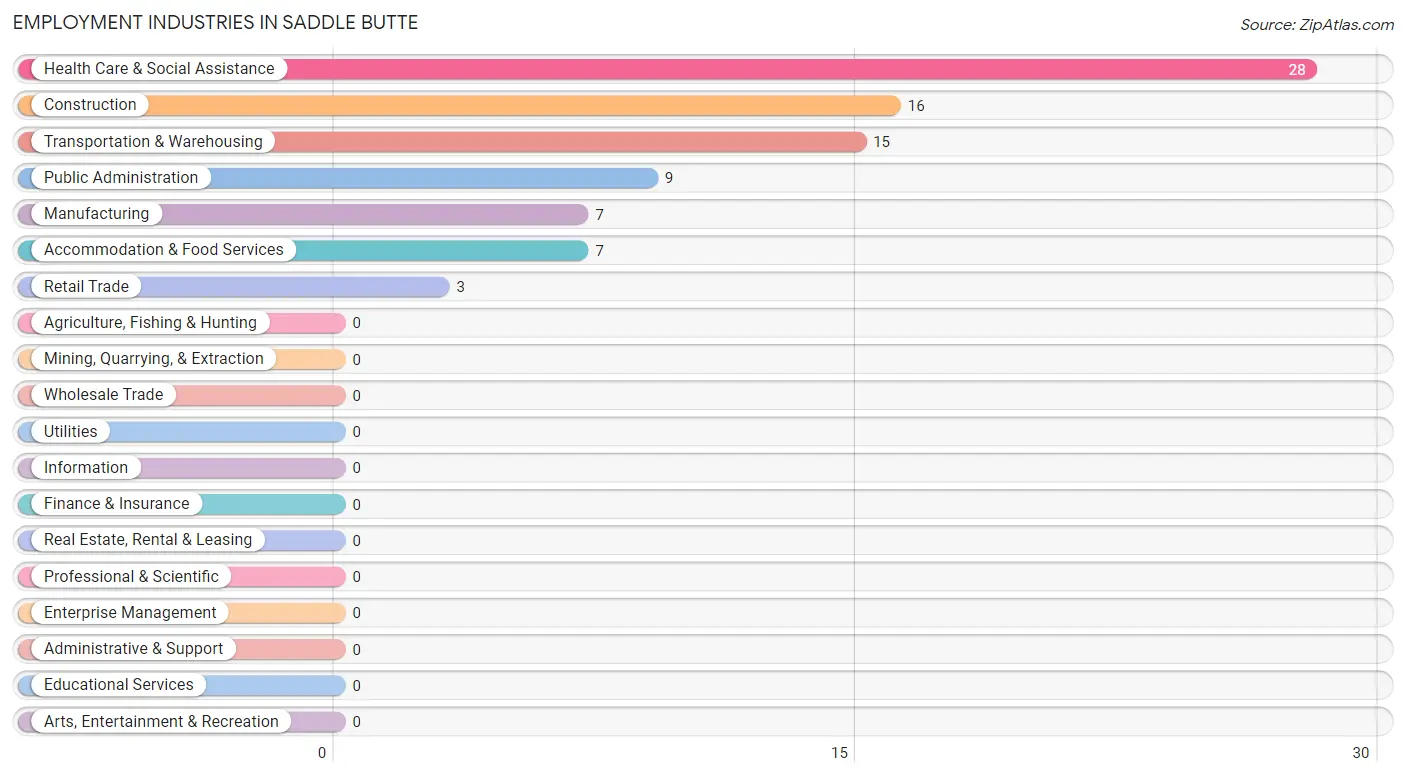
The major employment industries in Saddle Butte include Health Care & Social Assistance (28 | 32.9%), Construction (16 | 18.8%), Transportation & Warehousing (15 | 17.6%), Public Administration (9 | 10.6%), and Manufacturing (7 | 8.2%).
Employment Industries by Sex in Saddle Butte
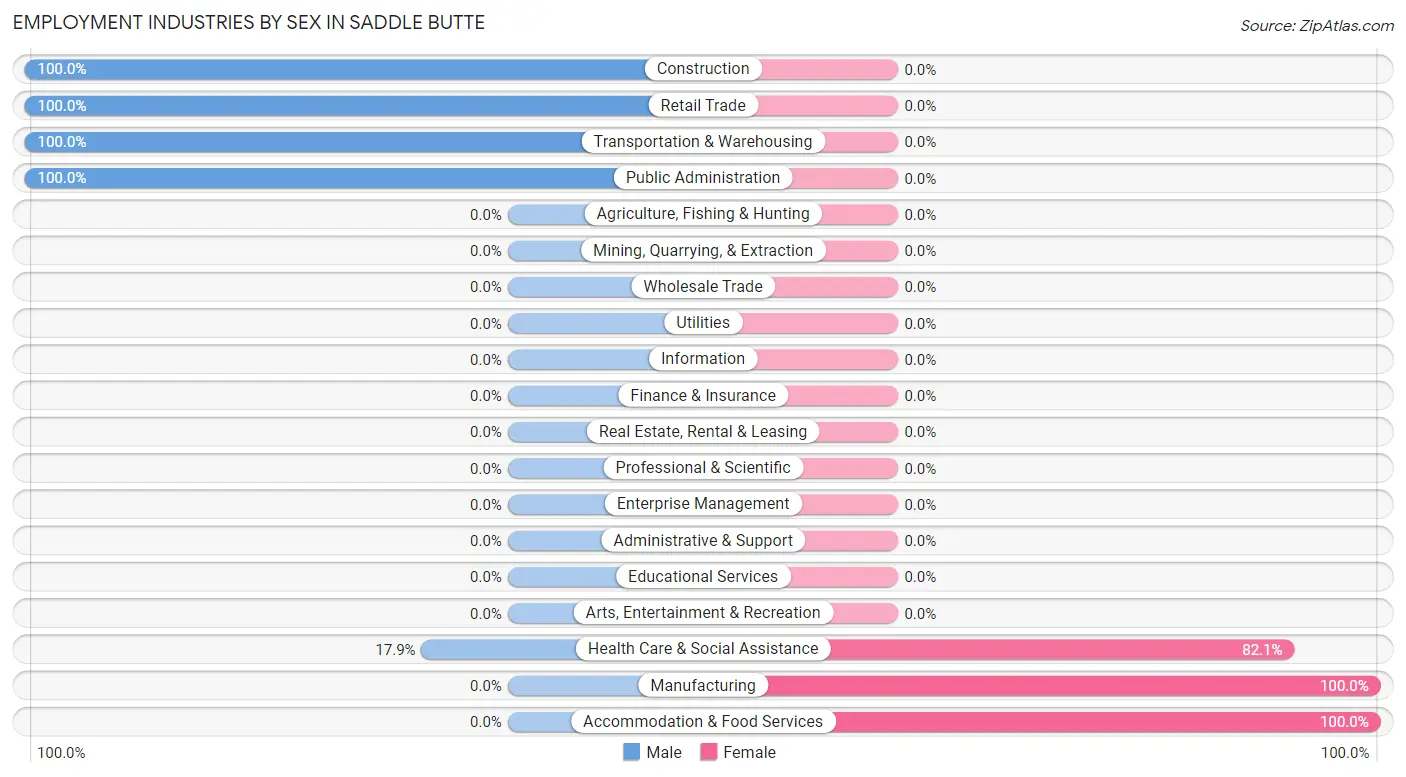
The Saddle Butte industries that see more men than women are Construction (100.0%), Retail Trade (100.0%), and Transportation & Warehousing (100.0%), whereas the industries that tend to have a higher number of women are Manufacturing (100.0%), Accommodation & Food Services (100.0%), and Health Care & Social Assistance (82.1%).
| Industry | Male | Female |
| Agriculture, Fishing & Hunting | 0 (0.0%) | 0 (0.0%) |
| Mining, Quarrying, & Extraction | 0 (0.0%) | 0 (0.0%) |
| Construction | 16 (100.0%) | 0 (0.0%) |
| Manufacturing | 0 (0.0%) | 7 (100.0%) |
| Wholesale Trade | 0 (0.0%) | 0 (0.0%) |
| Retail Trade | 3 (100.0%) | 0 (0.0%) |
| Transportation & Warehousing | 15 (100.0%) | 0 (0.0%) |
| Utilities | 0 (0.0%) | 0 (0.0%) |
| Information | 0 (0.0%) | 0 (0.0%) |
| Finance & Insurance | 0 (0.0%) | 0 (0.0%) |
| Real Estate, Rental & Leasing | 0 (0.0%) | 0 (0.0%) |
| Professional & Scientific | 0 (0.0%) | 0 (0.0%) |
| Enterprise Management | 0 (0.0%) | 0 (0.0%) |
| Administrative & Support | 0 (0.0%) | 0 (0.0%) |
| Educational Services | 0 (0.0%) | 0 (0.0%) |
| Health Care & Social Assistance | 5 (17.9%) | 23 (82.1%) |
| Arts, Entertainment & Recreation | 0 (0.0%) | 0 (0.0%) |
| Accommodation & Food Services | 0 (0.0%) | 7 (100.0%) |
| Public Administration | 9 (100.0%) | 0 (0.0%) |
| Total | 48 (56.5%) | 37 (43.5%) |
Education in Saddle Butte
School Enrollment in Saddle Butte
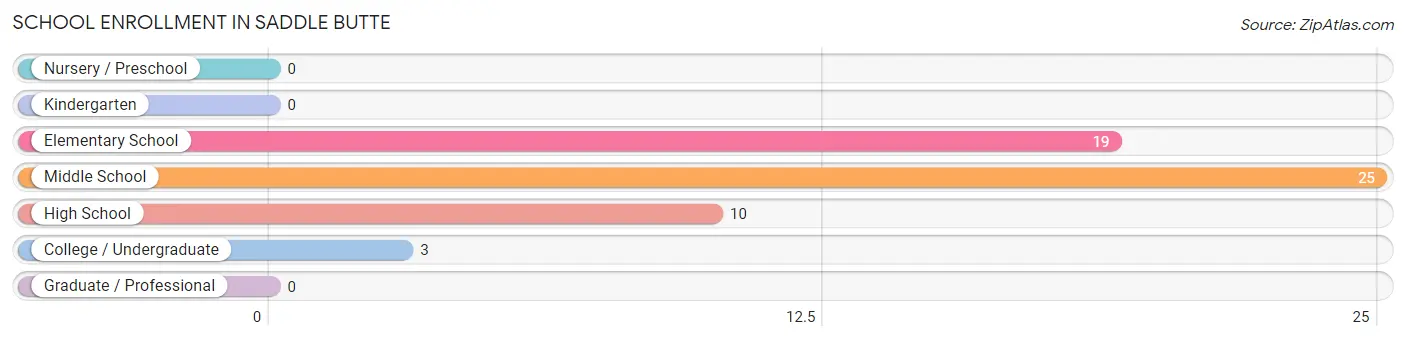
The most common levels of schooling among the 57 students in Saddle Butte are middle school (25 | 43.9%), elementary school (19 | 33.3%), and high school (10 | 17.5%).
| School Level | # Students | % Students |
| Nursery / Preschool | 0 | 0.0% |
| Kindergarten | 0 | 0.0% |
| Elementary School | 19 | 33.3% |
| Middle School | 25 | 43.9% |
| High School | 10 | 17.5% |
| College / Undergraduate | 3 | 5.3% |
| Graduate / Professional | 0 | 0.0% |
| Total | 57 | 100.0% |
School Enrollment by Age by Funding Source in Saddle Butte
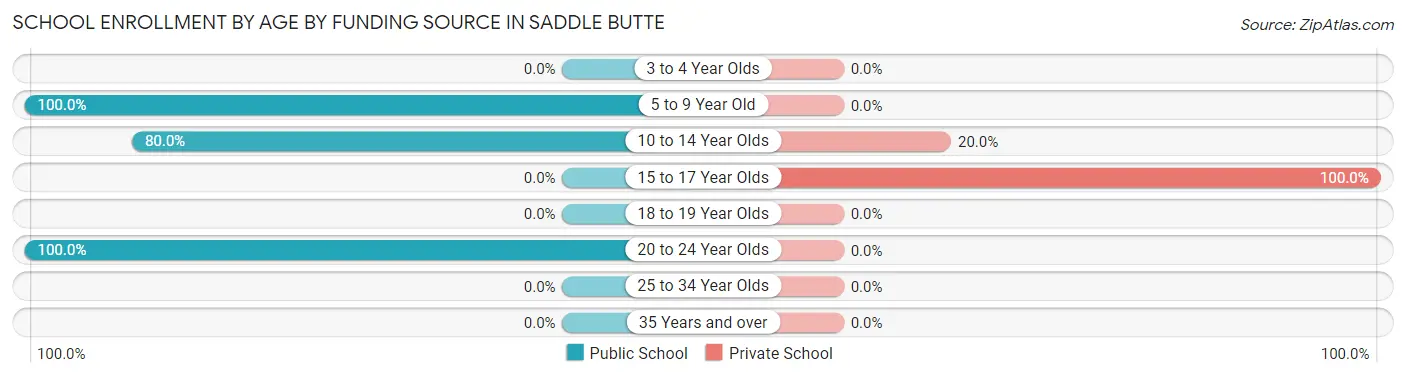
Out of a total of 57 students who are enrolled in schools in Saddle Butte, 15 (26.3%) attend a private institution, while the remaining 42 (73.7%) are enrolled in public schools. The age group of 15 to 17 year olds has the highest likelihood of being enrolled in private schools, with 10 (100.0% in the age bracket) enrolled. Conversely, the age group of 5 to 9 year old has the lowest likelihood of being enrolled in a private school, with 19 (100.0% in the age bracket) attending a public institution.
| Age Bracket | Public School | Private School |
| 3 to 4 Year Olds | 0 (0.0%) | 0 (0.0%) |
| 5 to 9 Year Old | 19 (100.0%) | 0 (0.0%) |
| 10 to 14 Year Olds | 20 (80.0%) | 5 (20.0%) |
| 15 to 17 Year Olds | 0 (0.0%) | 10 (100.0%) |
| 18 to 19 Year Olds | 0 (0.0%) | 0 (0.0%) |
| 20 to 24 Year Olds | 3 (100.0%) | 0 (0.0%) |
| 25 to 34 Year Olds | 0 (0.0%) | 0 (0.0%) |
| 35 Years and over | 0 (0.0%) | 0 (0.0%) |
| Total | 42 (73.7%) | 15 (26.3%) |
Educational Attainment by Field of Study in Saddle Butte
Multidisciplinary studies (5 | 35.7%), bio, nature & agricultural (3 | 21.4%), science & technology (3 | 21.4%), and arts & humanities (3 | 21.4%) are the most common fields of study among 14 individuals in Saddle Butte who have obtained a bachelor's degree or higher.
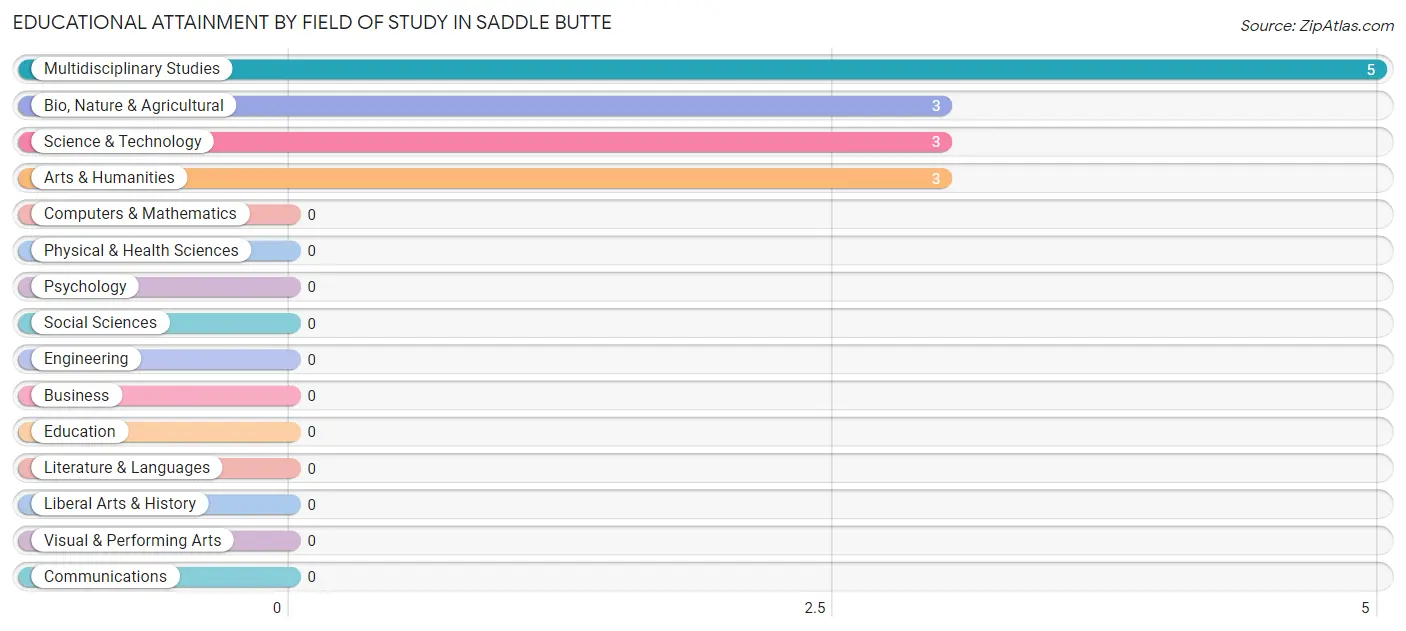
| Field of Study | # Graduates | % Graduates |
| Computers & Mathematics | 0 | 0.0% |
| Bio, Nature & Agricultural | 3 | 21.4% |
| Physical & Health Sciences | 0 | 0.0% |
| Psychology | 0 | 0.0% |
| Social Sciences | 0 | 0.0% |
| Engineering | 0 | 0.0% |
| Multidisciplinary Studies | 5 | 35.7% |
| Science & Technology | 3 | 21.4% |
| Business | 0 | 0.0% |
| Education | 0 | 0.0% |
| Literature & Languages | 0 | 0.0% |
| Liberal Arts & History | 0 | 0.0% |
| Visual & Performing Arts | 0 | 0.0% |
| Communications | 0 | 0.0% |
| Arts & Humanities | 3 | 21.4% |
| Total | 14 | 100.0% |
Transportation & Commute in Saddle Butte
Vehicle Availability by Sex in Saddle Butte
The most prevalent vehicle ownership categories in Saddle Butte are males with 5 or more vehicles (23, accounting for 47.9%) and females with 5 or more vehicles (23, making up 62.2%).
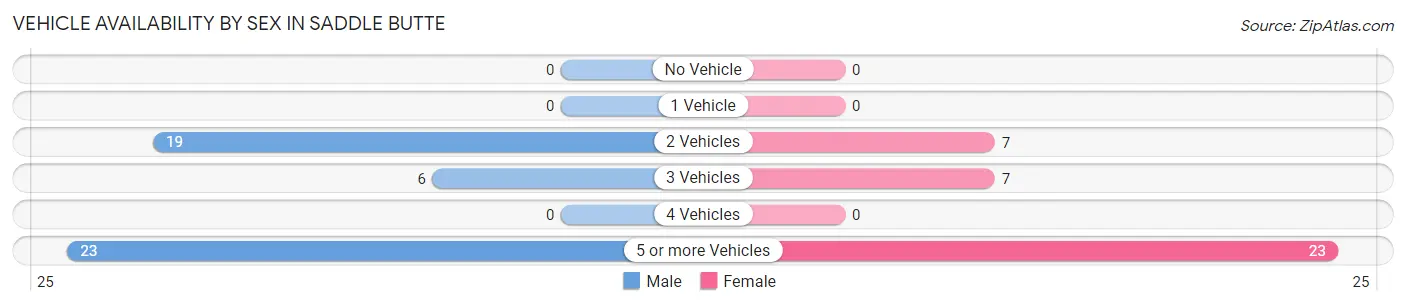
| Vehicles Available | Male | Female |
| No Vehicle | 0 (0.0%) | 0 (0.0%) |
| 1 Vehicle | 0 (0.0%) | 0 (0.0%) |
| 2 Vehicles | 19 (39.6%) | 7 (18.9%) |
| 3 Vehicles | 6 (12.5%) | 7 (18.9%) |
| 4 Vehicles | 0 (0.0%) | 0 (0.0%) |
| 5 or more Vehicles | 23 (47.9%) | 23 (62.2%) |
| Total | 48 (100.0%) | 37 (100.0%) |
Commute Time in Saddle Butte
The most frequently occuring commute durations in Saddle Butte are 10 to 14 minutes (35 commuters, 41.2%), 25 to 29 minutes (16 commuters, 18.8%), and less than 5 minutes (13 commuters, 15.3%).
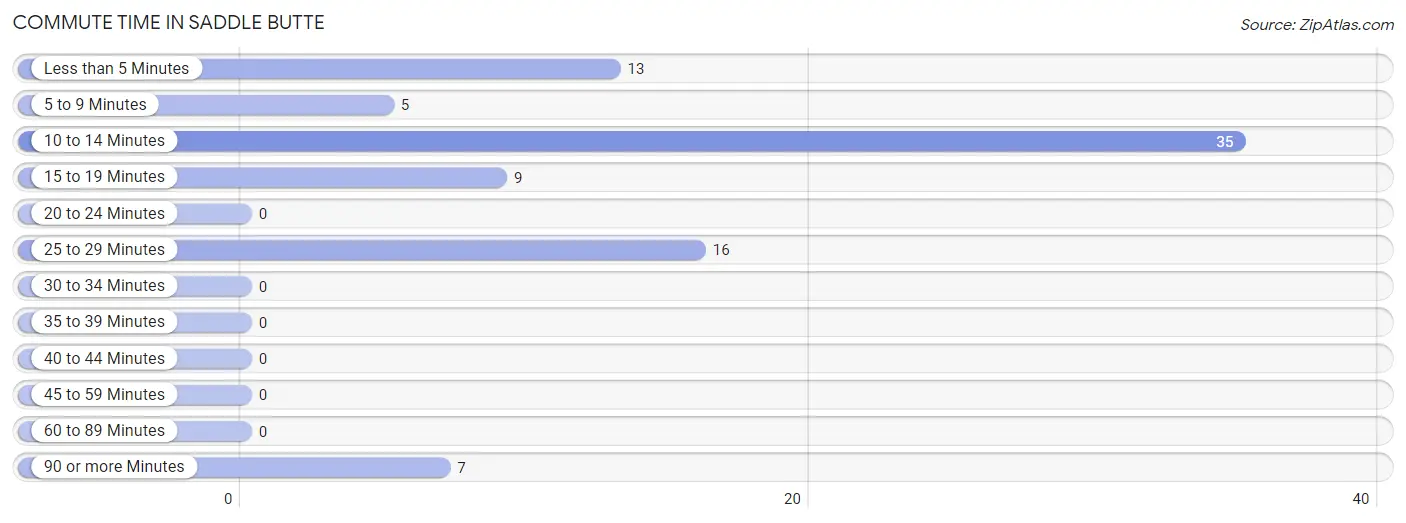
| Commute Time | # Commuters | % Commuters |
| Less than 5 Minutes | 13 | 15.3% |
| 5 to 9 Minutes | 5 | 5.9% |
| 10 to 14 Minutes | 35 | 41.2% |
| 15 to 19 Minutes | 9 | 10.6% |
| 20 to 24 Minutes | 0 | 0.0% |
| 25 to 29 Minutes | 16 | 18.8% |
| 30 to 34 Minutes | 0 | 0.0% |
| 35 to 39 Minutes | 0 | 0.0% |
| 40 to 44 Minutes | 0 | 0.0% |
| 45 to 59 Minutes | 0 | 0.0% |
| 60 to 89 Minutes | 0 | 0.0% |
| 90 or more Minutes | 7 | 8.2% |
Commute Time by Sex in Saddle Butte
The most common commute times in Saddle Butte are 10 to 14 minutes (17 commuters, 35.4%) for males and 10 to 14 minutes (18 commuters, 48.6%) for females.
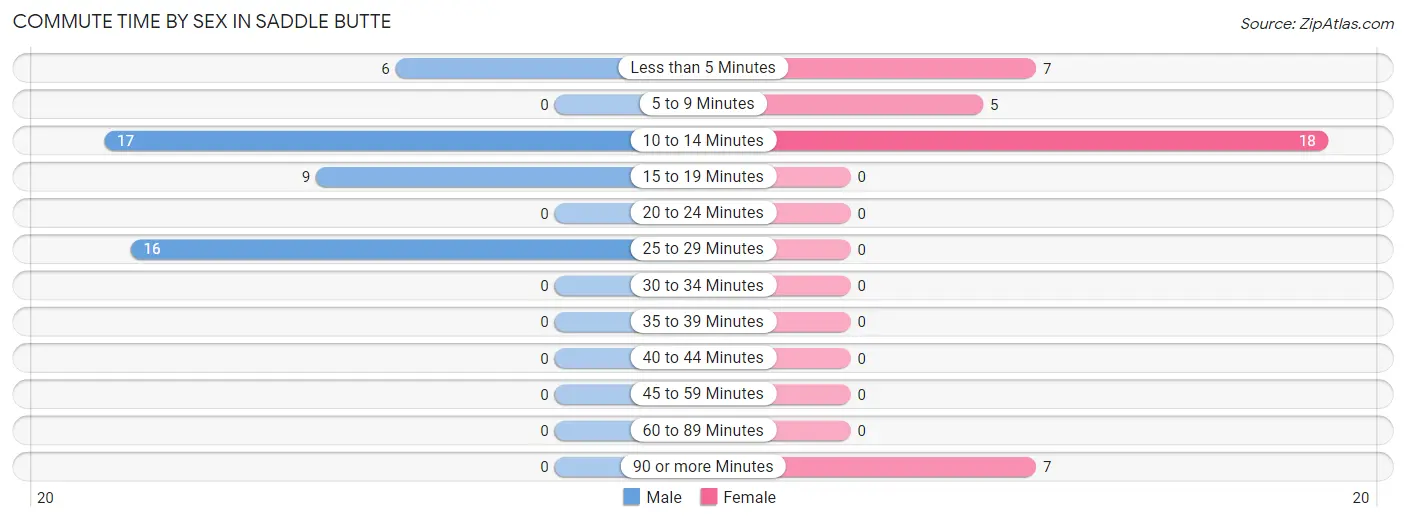
| Commute Time | Male | Female |
| Less than 5 Minutes | 6 (12.5%) | 7 (18.9%) |
| 5 to 9 Minutes | 0 (0.0%) | 5 (13.5%) |
| 10 to 14 Minutes | 17 (35.4%) | 18 (48.6%) |
| 15 to 19 Minutes | 9 (18.8%) | 0 (0.0%) |
| 20 to 24 Minutes | 0 (0.0%) | 0 (0.0%) |
| 25 to 29 Minutes | 16 (33.3%) | 0 (0.0%) |
| 30 to 34 Minutes | 0 (0.0%) | 0 (0.0%) |
| 35 to 39 Minutes | 0 (0.0%) | 0 (0.0%) |
| 40 to 44 Minutes | 0 (0.0%) | 0 (0.0%) |
| 45 to 59 Minutes | 0 (0.0%) | 0 (0.0%) |
| 60 to 89 Minutes | 0 (0.0%) | 0 (0.0%) |
| 90 or more Minutes | 0 (0.0%) | 7 (18.9%) |
Time of Departure to Work by Sex in Saddle Butte
The most frequent times of departure to work in Saddle Butte are 6:30 AM to 6:59 AM (24, 50.0%) for males and 6:30 AM to 6:59 AM (18, 48.6%) for females.
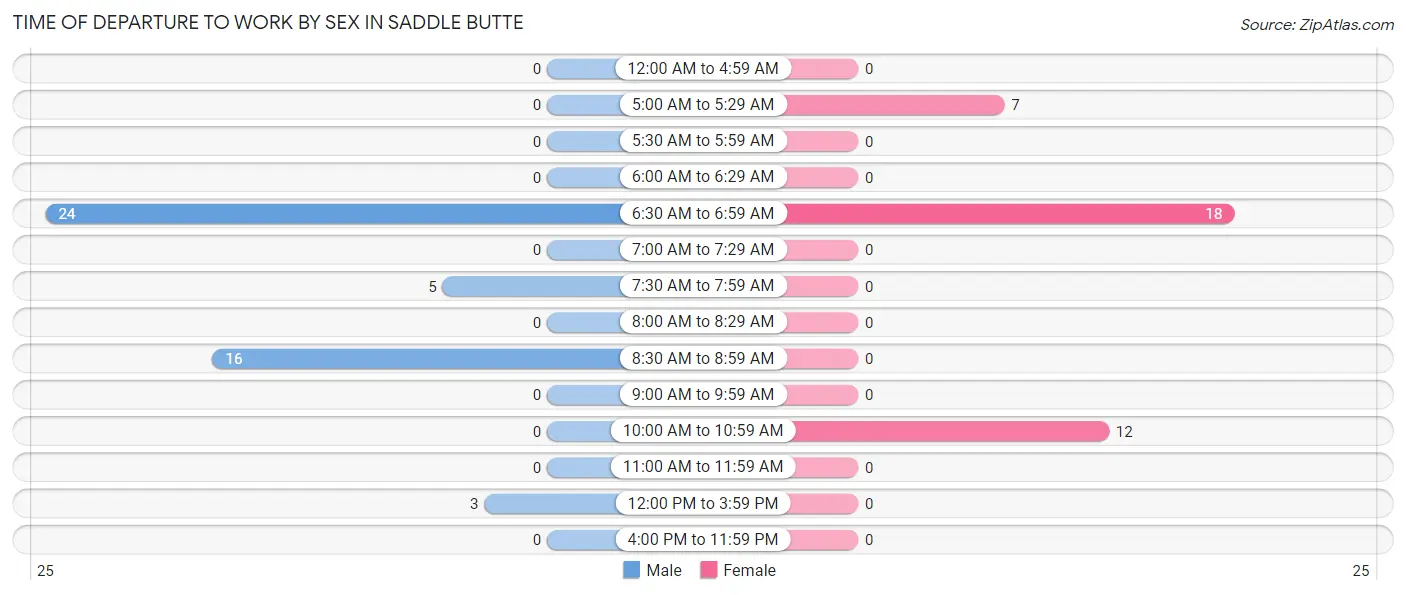
| Time of Departure | Male | Female |
| 12:00 AM to 4:59 AM | 0 (0.0%) | 0 (0.0%) |
| 5:00 AM to 5:29 AM | 0 (0.0%) | 7 (18.9%) |
| 5:30 AM to 5:59 AM | 0 (0.0%) | 0 (0.0%) |
| 6:00 AM to 6:29 AM | 0 (0.0%) | 0 (0.0%) |
| 6:30 AM to 6:59 AM | 24 (50.0%) | 18 (48.6%) |
| 7:00 AM to 7:29 AM | 0 (0.0%) | 0 (0.0%) |
| 7:30 AM to 7:59 AM | 5 (10.4%) | 0 (0.0%) |
| 8:00 AM to 8:29 AM | 0 (0.0%) | 0 (0.0%) |
| 8:30 AM to 8:59 AM | 16 (33.3%) | 0 (0.0%) |
| 9:00 AM to 9:59 AM | 0 (0.0%) | 0 (0.0%) |
| 10:00 AM to 10:59 AM | 0 (0.0%) | 12 (32.4%) |
| 11:00 AM to 11:59 AM | 0 (0.0%) | 0 (0.0%) |
| 12:00 PM to 3:59 PM | 3 (6.2%) | 0 (0.0%) |
| 4:00 PM to 11:59 PM | 0 (0.0%) | 0 (0.0%) |
| Total | 48 (100.0%) | 37 (100.0%) |
Housing Occupancy in Saddle Butte
Occupancy by Ownership in Saddle Butte
Of the total 63 dwellings in Saddle Butte, owner-occupied units account for 47 (74.6%), while renter-occupied units make up 16 (25.4%).
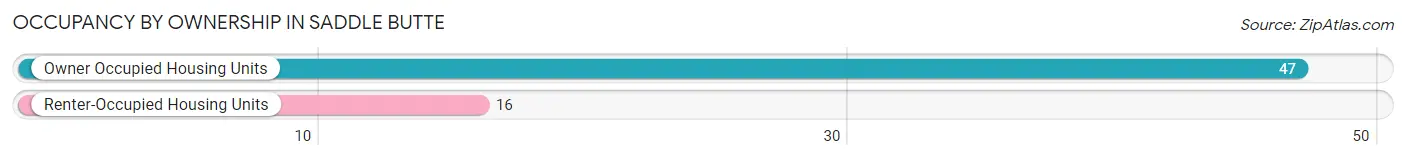
| Occupancy | # Housing Units | % Housing Units |
| Owner Occupied Housing Units | 47 | 74.6% |
| Renter-Occupied Housing Units | 16 | 25.4% |
| Total Occupied Housing Units | 63 | 100.0% |
Occupancy by Household Size in Saddle Butte
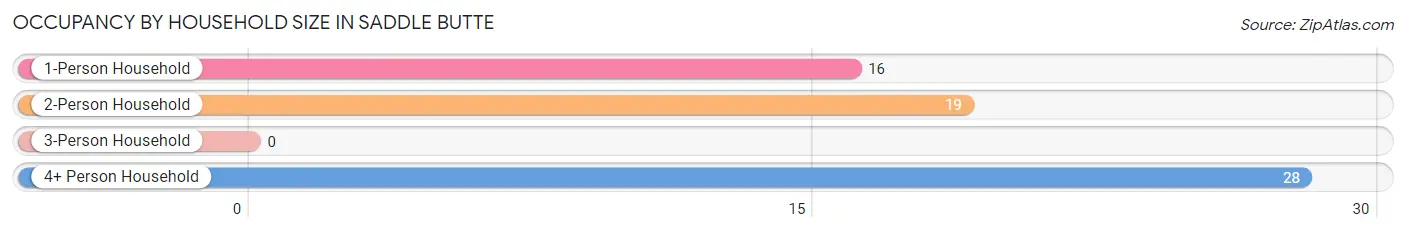
| Household Size | # Housing Units | % Housing Units |
| 1-Person Household | 16 | 25.4% |
| 2-Person Household | 19 | 30.2% |
| 3-Person Household | 0 | 0.0% |
| 4+ Person Household | 28 | 44.4% |
| Total Housing Units | 63 | 100.0% |
Occupancy by Ownership by Household Size in Saddle Butte
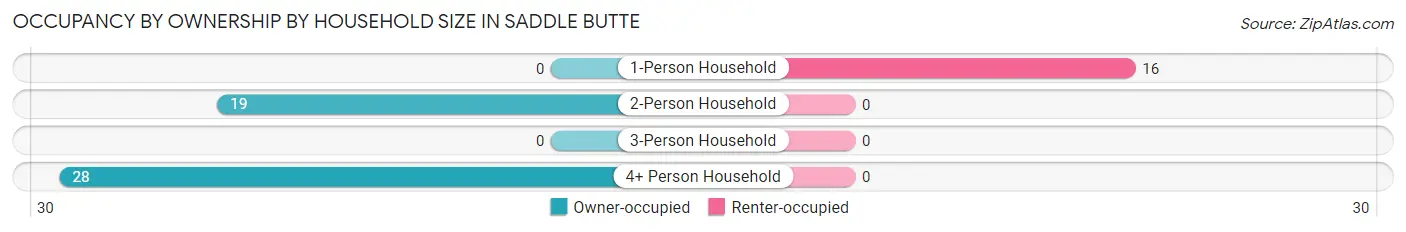
| Household Size | Owner-occupied | Renter-occupied |
| 1-Person Household | 0 (0.0%) | 16 (100.0%) |
| 2-Person Household | 19 (100.0%) | 0 (0.0%) |
| 3-Person Household | 0 (0.0%) | 0 (0.0%) |
| 4+ Person Household | 28 (100.0%) | 0 (0.0%) |
| Total Housing Units | 47 (74.6%) | 16 (25.4%) |
Occupancy by Educational Attainment in Saddle Butte
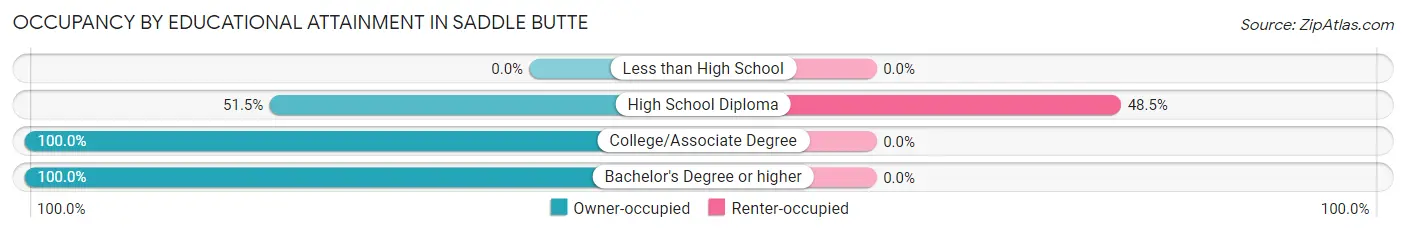
| Household Size | Owner-occupied | Renter-occupied |
| Less than High School | 0 (0.0%) | 0 (0.0%) |
| High School Diploma | 17 (51.5%) | 16 (48.5%) |
| College/Associate Degree | 25 (100.0%) | 0 (0.0%) |
| Bachelor's Degree or higher | 5 (100.0%) | 0 (0.0%) |
Occupancy by Age of Householder in Saddle Butte
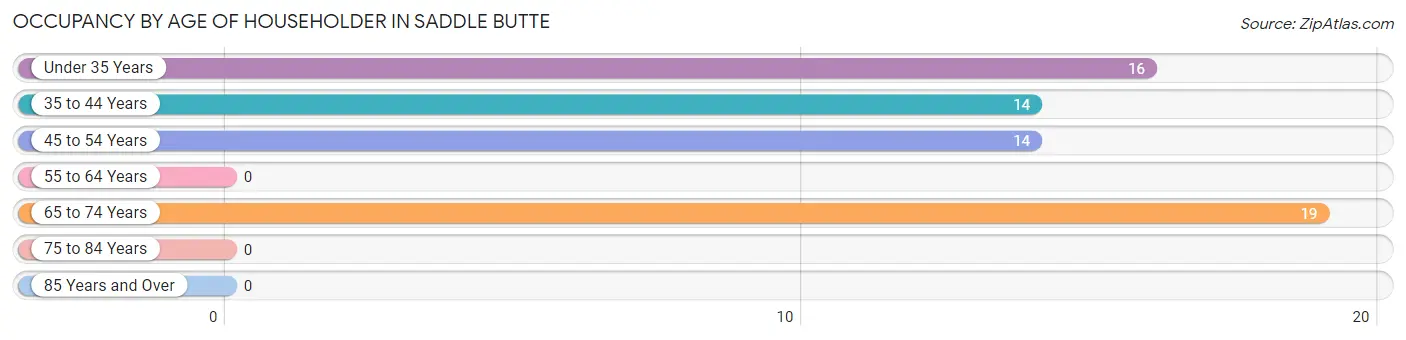
| Age Bracket | # Households | % Households |
| Under 35 Years | 16 | 25.4% |
| 35 to 44 Years | 14 | 22.2% |
| 45 to 54 Years | 14 | 22.2% |
| 55 to 64 Years | 0 | 0.0% |
| 65 to 74 Years | 19 | 30.2% |
| 75 to 84 Years | 0 | 0.0% |
| 85 Years and Over | 0 | 0.0% |
| Total | 63 | 100.0% |
Housing Finances in Saddle Butte
Median Income by Occupancy in Saddle Butte
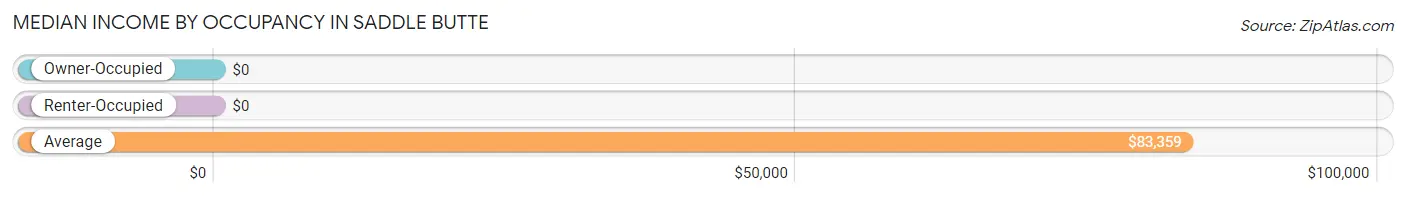
| Occupancy Type | # Households | Median Income |
| Owner-Occupied | 47 (74.6%) | $0 |
| Renter-Occupied | 16 (25.4%) | $0 |
| Average | 63 (100.0%) | $83,359 |
Occupancy by Householder Income Bracket in Saddle Butte
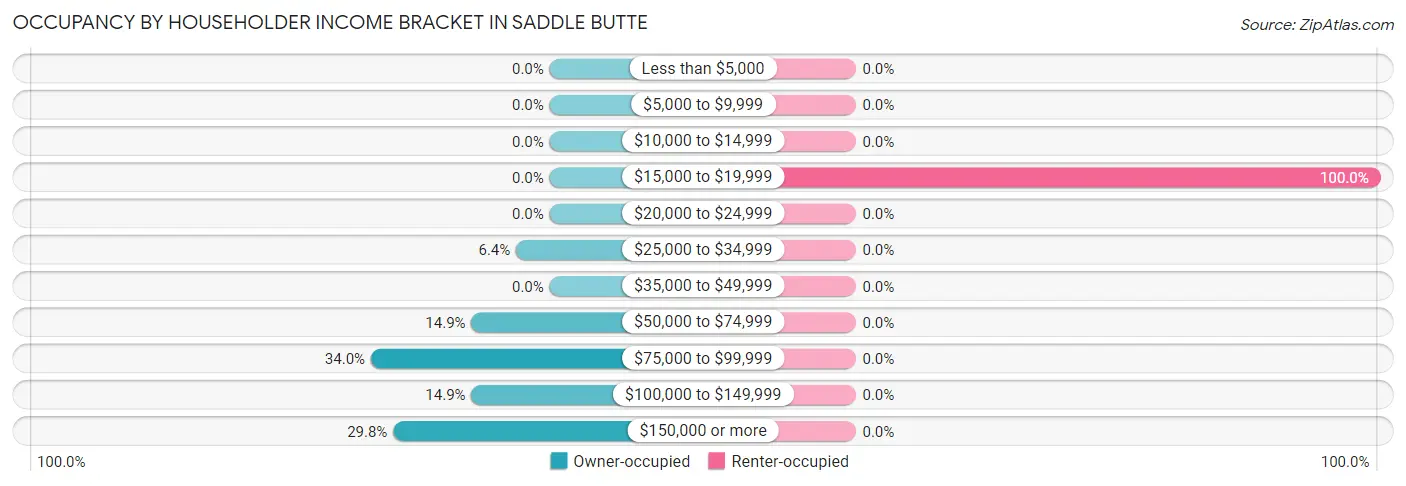
| Income Bracket | Owner-occupied | Renter-occupied |
| Less than $5,000 | 0 (0.0%) | 0 (0.0%) |
| $5,000 to $9,999 | 0 (0.0%) | 0 (0.0%) |
| $10,000 to $14,999 | 0 (0.0%) | 0 (0.0%) |
| $15,000 to $19,999 | 0 (0.0%) | 16 (100.0%) |
| $20,000 to $24,999 | 0 (0.0%) | 0 (0.0%) |
| $25,000 to $34,999 | 3 (6.4%) | 0 (0.0%) |
| $35,000 to $49,999 | 0 (0.0%) | 0 (0.0%) |
| $50,000 to $74,999 | 7 (14.9%) | 0 (0.0%) |
| $75,000 to $99,999 | 16 (34.0%) | 0 (0.0%) |
| $100,000 to $149,999 | 7 (14.9%) | 0 (0.0%) |
| $150,000 or more | 14 (29.8%) | 0 (0.0%) |
| Total | 47 (100.0%) | 16 (100.0%) |
Monthly Housing Cost Tiers in Saddle Butte
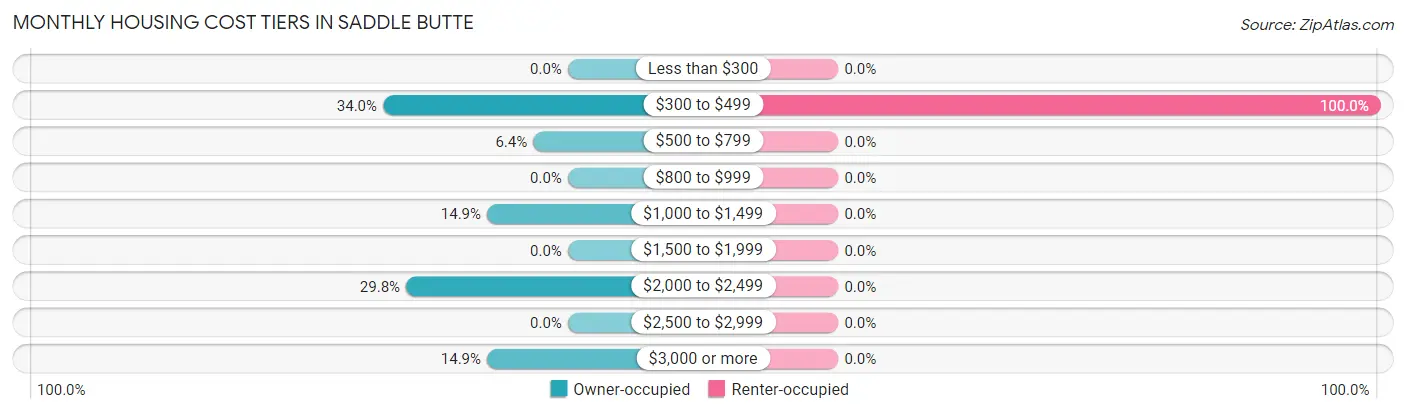
| Monthly Cost | Owner-occupied | Renter-occupied |
| Less than $300 | 0 (0.0%) | 0 (0.0%) |
| $300 to $499 | 16 (34.0%) | 16 (100.0%) |
| $500 to $799 | 3 (6.4%) | 0 (0.0%) |
| $800 to $999 | 0 (0.0%) | 0 (0.0%) |
| $1,000 to $1,499 | 7 (14.9%) | 0 (0.0%) |
| $1,500 to $1,999 | 0 (0.0%) | 0 (0.0%) |
| $2,000 to $2,499 | 14 (29.8%) | 0 (0.0%) |
| $2,500 to $2,999 | 0 (0.0%) | 0 (0.0%) |
| $3,000 or more | 7 (14.9%) | 0 (0.0%) |
| Total | 47 (100.0%) | 16 (100.0%) |
Physical Housing Characteristics in Saddle Butte
Housing Structures in Saddle Butte
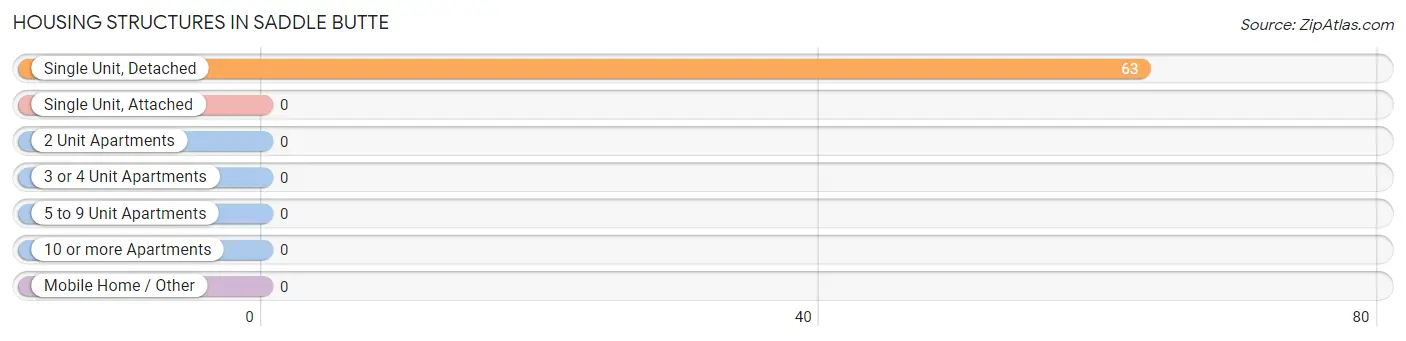
| Structure Type | # Housing Units | % Housing Units |
| Single Unit, Detached | 63 | 100.0% |
| Single Unit, Attached | 0 | 0.0% |
| 2 Unit Apartments | 0 | 0.0% |
| 3 or 4 Unit Apartments | 0 | 0.0% |
| 5 to 9 Unit Apartments | 0 | 0.0% |
| 10 or more Apartments | 0 | 0.0% |
| Mobile Home / Other | 0 | 0.0% |
| Total | 63 | 100.0% |
Housing Structures by Occupancy in Saddle Butte
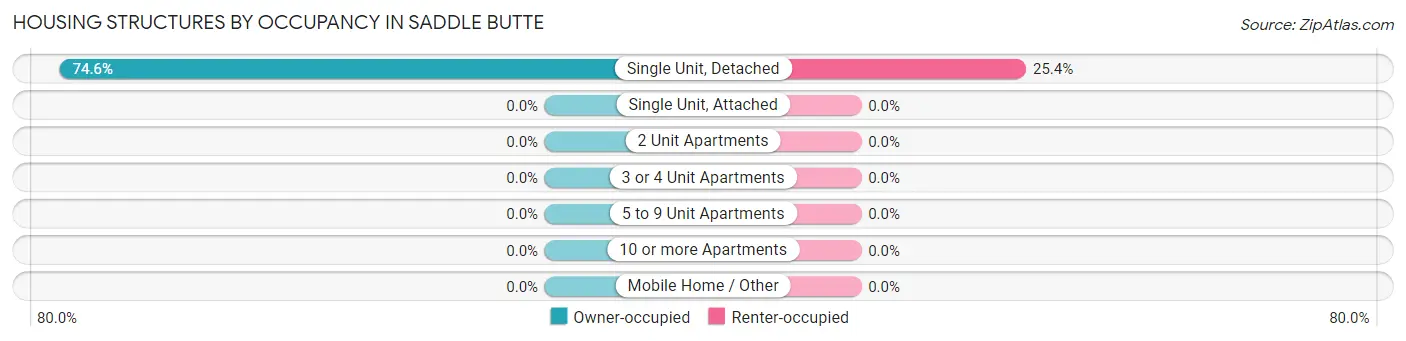
| Structure Type | Owner-occupied | Renter-occupied |
| Single Unit, Detached | 47 (74.6%) | 16 (25.4%) |
| Single Unit, Attached | 0 (0.0%) | 0 (0.0%) |
| 2 Unit Apartments | 0 (0.0%) | 0 (0.0%) |
| 3 or 4 Unit Apartments | 0 (0.0%) | 0 (0.0%) |
| 5 to 9 Unit Apartments | 0 (0.0%) | 0 (0.0%) |
| 10 or more Apartments | 0 (0.0%) | 0 (0.0%) |
| Mobile Home / Other | 0 (0.0%) | 0 (0.0%) |
| Total | 47 (74.6%) | 16 (25.4%) |
Housing Structures by Number of Rooms in Saddle Butte
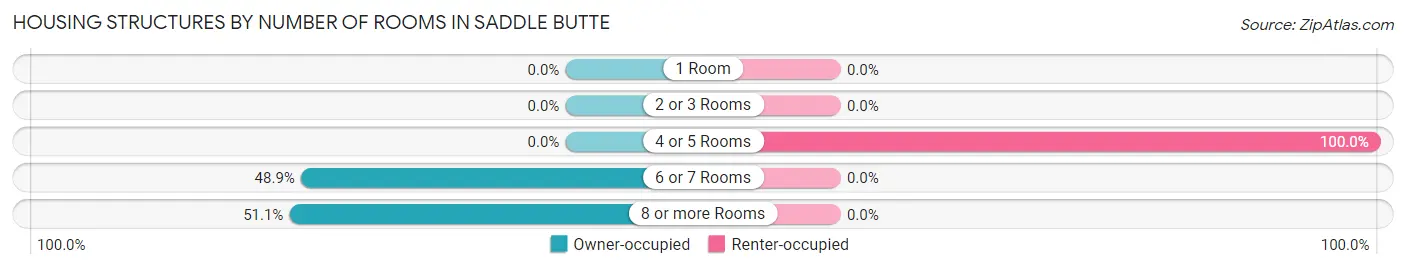
| Number of Rooms | Owner-occupied | Renter-occupied |
| 1 Room | 0 (0.0%) | 0 (0.0%) |
| 2 or 3 Rooms | 0 (0.0%) | 0 (0.0%) |
| 4 or 5 Rooms | 0 (0.0%) | 16 (100.0%) |
| 6 or 7 Rooms | 23 (48.9%) | 0 (0.0%) |
| 8 or more Rooms | 24 (51.1%) | 0 (0.0%) |
| Total | 47 (100.0%) | 16 (100.0%) |
Housing Structure by Heating Type in Saddle Butte
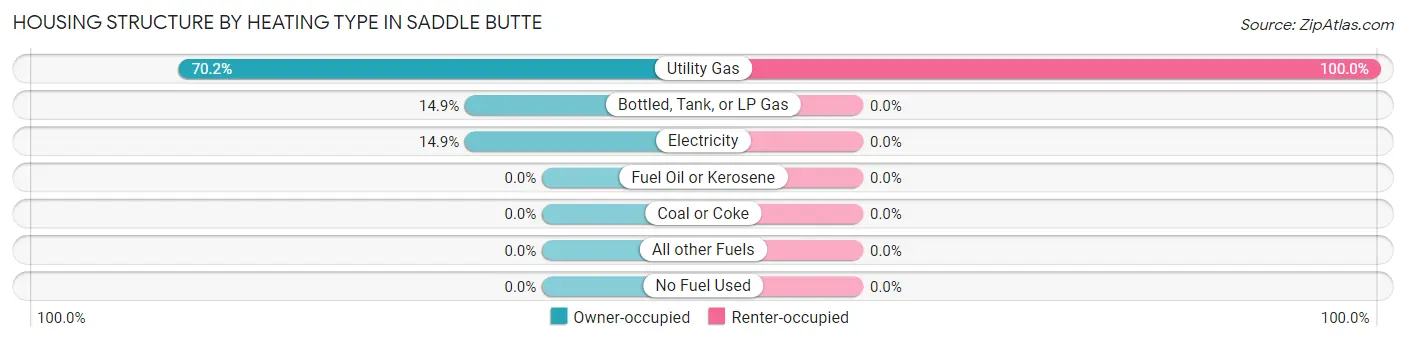
| Heating Type | Owner-occupied | Renter-occupied |
| Utility Gas | 33 (70.2%) | 16 (100.0%) |
| Bottled, Tank, or LP Gas | 7 (14.9%) | 0 (0.0%) |
| Electricity | 7 (14.9%) | 0 (0.0%) |
| Fuel Oil or Kerosene | 0 (0.0%) | 0 (0.0%) |
| Coal or Coke | 0 (0.0%) | 0 (0.0%) |
| All other Fuels | 0 (0.0%) | 0 (0.0%) |
| No Fuel Used | 0 (0.0%) | 0 (0.0%) |
| Total | 47 (100.0%) | 16 (100.0%) |
Household Vehicle Usage in Saddle Butte
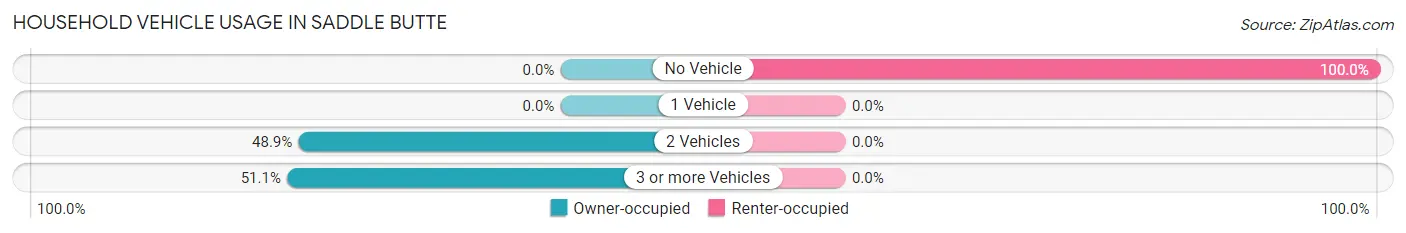
| Vehicles per Household | Owner-occupied | Renter-occupied |
| No Vehicle | 0 (0.0%) | 16 (100.0%) |
| 1 Vehicle | 0 (0.0%) | 0 (0.0%) |
| 2 Vehicles | 23 (48.9%) | 0 (0.0%) |
| 3 or more Vehicles | 24 (51.1%) | 0 (0.0%) |
| Total | 47 (100.0%) | 16 (100.0%) |
Real Estate & Mortgages in Saddle Butte
Real Estate and Mortgage Overview in Saddle Butte
| Characteristic | Without Mortgage | With Mortgage |
| Housing Units | 19 | 28 |
| Median Property Value | - | - |
| Median Household Income | - | - |
| Monthly Housing Costs | - | - |
| Real Estate Taxes | - | - |
Property Value by Mortgage Status in Saddle Butte
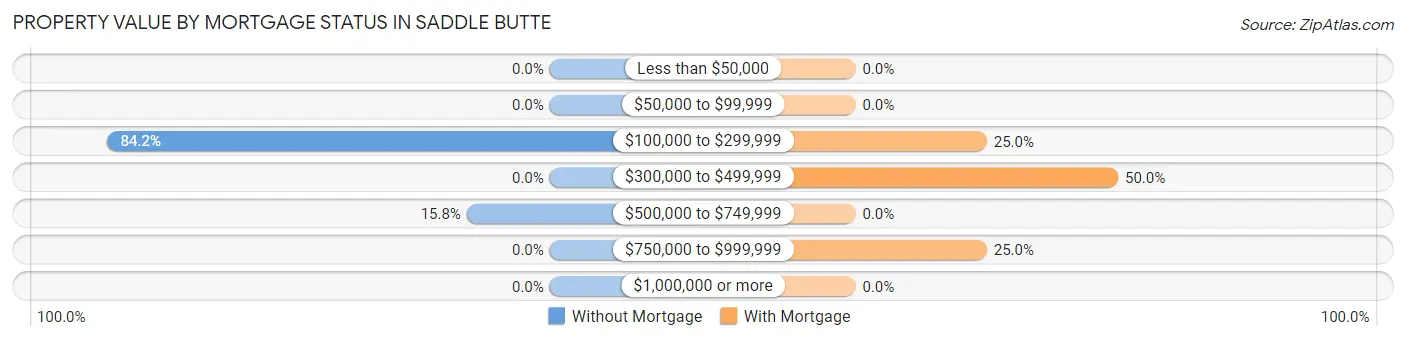
| Property Value | Without Mortgage | With Mortgage |
| Less than $50,000 | 0 (0.0%) | 0 (0.0%) |
| $50,000 to $99,999 | 0 (0.0%) | 0 (0.0%) |
| $100,000 to $299,999 | 16 (84.2%) | 7 (25.0%) |
| $300,000 to $499,999 | 0 (0.0%) | 14 (50.0%) |
| $500,000 to $749,999 | 3 (15.8%) | 0 (0.0%) |
| $750,000 to $999,999 | 0 (0.0%) | 7 (25.0%) |
| $1,000,000 or more | 0 (0.0%) | 0 (0.0%) |
| Total | 19 (100.0%) | 28 (100.0%) |
Household Income by Mortgage Status in Saddle Butte
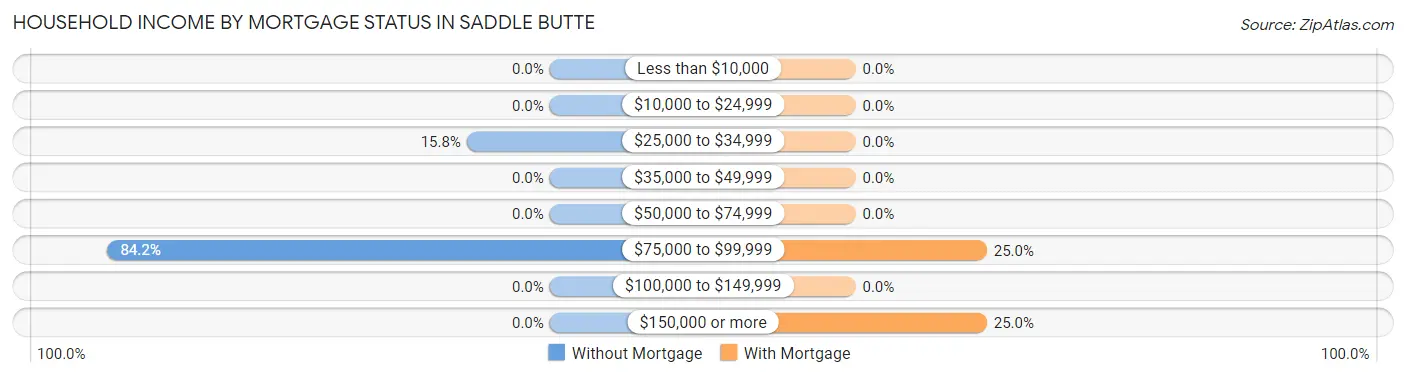
| Household Income | Without Mortgage | With Mortgage |
| Less than $10,000 | 0 (0.0%) | 0 (0.0%) |
| $10,000 to $24,999 | 0 (0.0%) | 0 (0.0%) |
| $25,000 to $34,999 | 3 (15.8%) | 0 (0.0%) |
| $35,000 to $49,999 | 0 (0.0%) | 0 (0.0%) |
| $50,000 to $74,999 | 0 (0.0%) | 0 (0.0%) |
| $75,000 to $99,999 | 16 (84.2%) | 7 (25.0%) |
| $100,000 to $149,999 | 0 (0.0%) | 0 (0.0%) |
| $150,000 or more | 0 (0.0%) | 7 (25.0%) |
| Total | 19 (100.0%) | 28 (100.0%) |
Property Value to Household Income Ratio in Saddle Butte
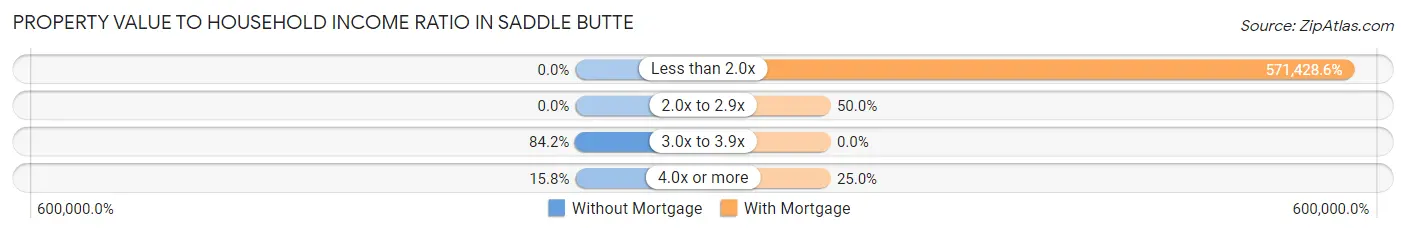
| Value-to-Income Ratio | Without Mortgage | With Mortgage |
| Less than 2.0x | 0 (0.0%) | 160,000 (571,428.6%) |
| 2.0x to 2.9x | 0 (0.0%) | 14 (50.0%) |
| 3.0x to 3.9x | 16 (84.2%) | 0 (0.0%) |
| 4.0x or more | 3 (15.8%) | 7 (25.0%) |
| Total | 19 (100.0%) | 28 (100.0%) |
Real Estate Taxes by Mortgage Status in Saddle Butte
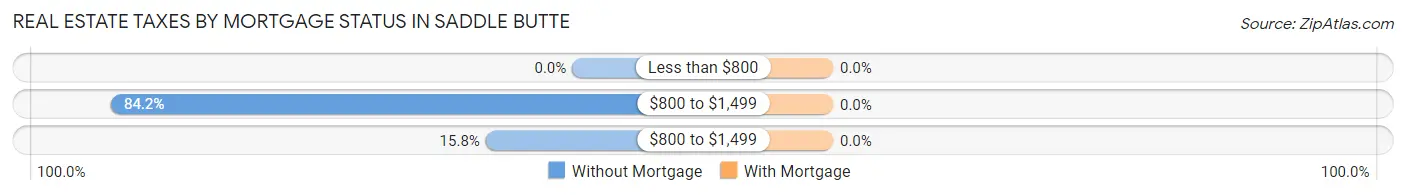
| Property Taxes | Without Mortgage | With Mortgage |
| Less than $800 | 0 (0.0%) | 0 (0.0%) |
| $800 to $1,499 | 16 (84.2%) | 0 (0.0%) |
| $800 to $1,499 | 3 (15.8%) | 0 (0.0%) |
| Total | 19 (100.0%) | 28 (100.0%) |
Health & Disability in Saddle Butte
Health Insurance Coverage by Age in Saddle Butte
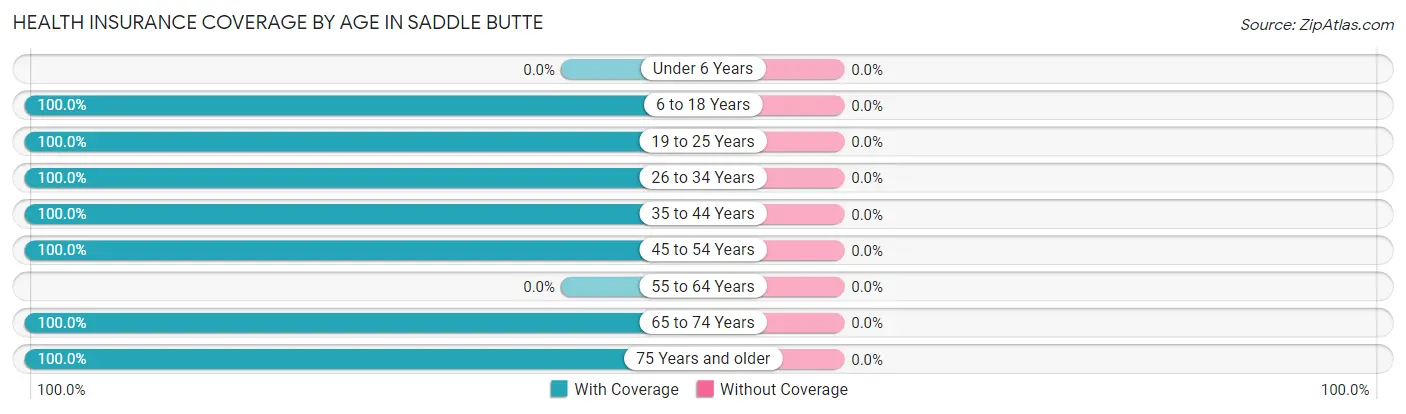
| Age Bracket | With Coverage | Without Coverage |
| Under 6 Years | 0 (0.0%) | 0 (0.0%) |
| 6 to 18 Years | 54 (100.0%) | 0 (0.0%) |
| 19 to 25 Years | 16 (100.0%) | 0 (0.0%) |
| 26 to 34 Years | 16 (100.0%) | 0 (0.0%) |
| 35 to 44 Years | 23 (100.0%) | 0 (0.0%) |
| 45 to 54 Years | 30 (100.0%) | 0 (0.0%) |
| 55 to 64 Years | 0 (0.0%) | 0 (0.0%) |
| 65 to 74 Years | 37 (100.0%) | 0 (0.0%) |
| 75 Years and older | 4 (100.0%) | 0 (0.0%) |
| Total | 180 (100.0%) | 0 (0.0%) |
Health Insurance Coverage by Citizenship Status in Saddle Butte
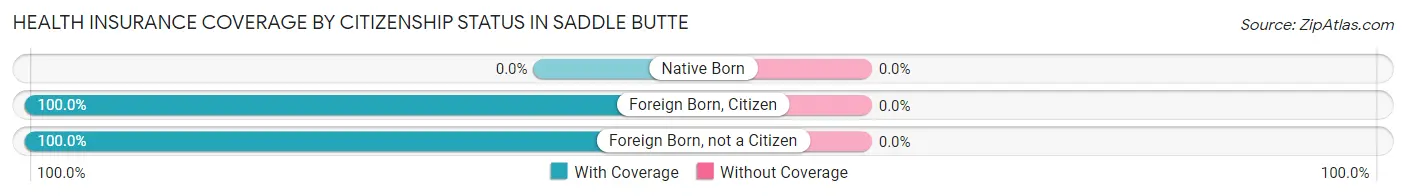
| Citizenship Status | With Coverage | Without Coverage |
| Native Born | 0 (0.0%) | 0 (0.0%) |
| Foreign Born, Citizen | 54 (100.0%) | 0 (0.0%) |
| Foreign Born, not a Citizen | 16 (100.0%) | 0 (0.0%) |
Health Insurance Coverage by Household Income in Saddle Butte
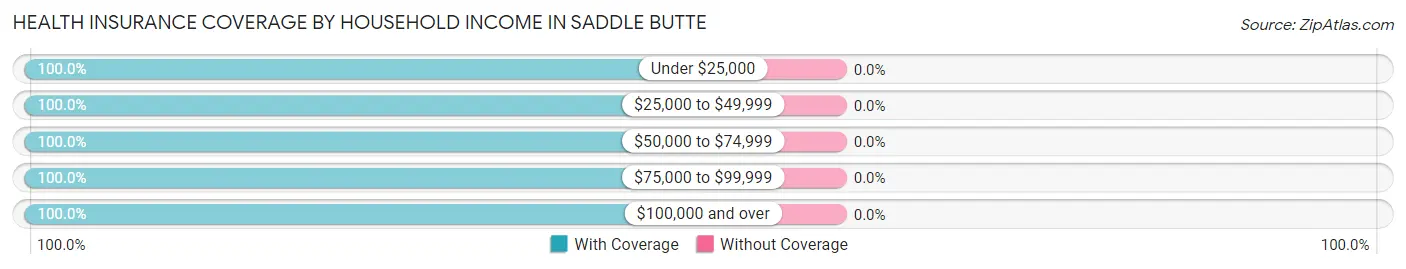
| Household Income | With Coverage | Without Coverage |
| Under $25,000 | 16 (100.0%) | 0 (0.0%) |
| $25,000 to $49,999 | 7 (100.0%) | 0 (0.0%) |
| $50,000 to $74,999 | 35 (100.0%) | 0 (0.0%) |
| $75,000 to $99,999 | 30 (100.0%) | 0 (0.0%) |
| $100,000 and over | 92 (100.0%) | 0 (0.0%) |
Public vs Private Health Insurance Coverage by Age in Saddle Butte
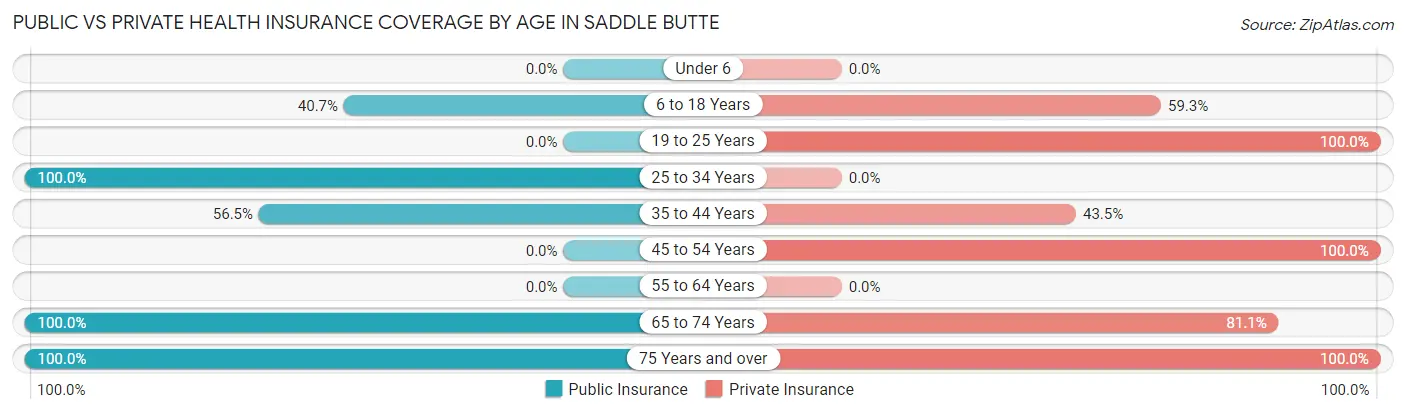
| Age Bracket | Public Insurance | Private Insurance |
| Under 6 | 0 (0.0%) | 0 (0.0%) |
| 6 to 18 Years | 22 (40.7%) | 32 (59.3%) |
| 19 to 25 Years | 0 (0.0%) | 16 (100.0%) |
| 25 to 34 Years | 16 (100.0%) | 0 (0.0%) |
| 35 to 44 Years | 13 (56.5%) | 10 (43.5%) |
| 45 to 54 Years | 0 (0.0%) | 30 (100.0%) |
| 55 to 64 Years | 0 (0.0%) | 0 (0.0%) |
| 65 to 74 Years | 37 (100.0%) | 30 (81.1%) |
| 75 Years and over | 4 (100.0%) | 4 (100.0%) |
| Total | 92 (51.1%) | 122 (67.8%) |
Disability Status by Sex by Age in Saddle Butte
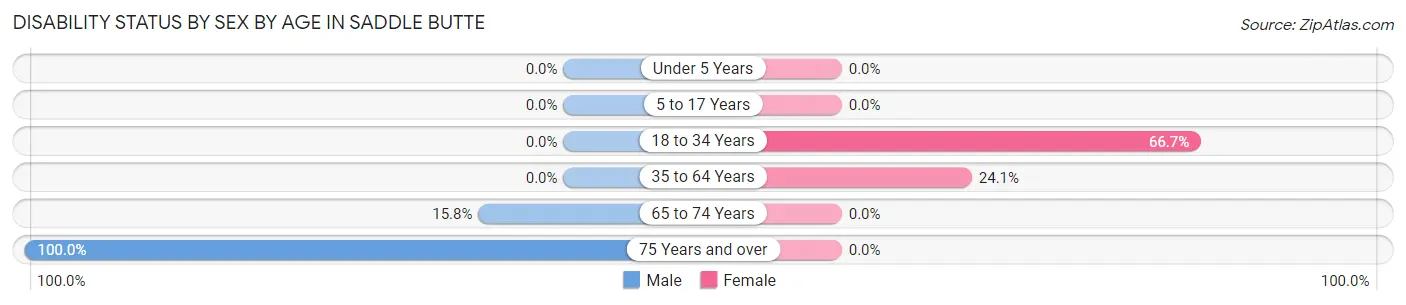
| Age Bracket | Male | Female |
| Under 5 Years | 0 (0.0%) | 0 (0.0%) |
| 5 to 17 Years | 0 (0.0%) | 0 (0.0%) |
| 18 to 34 Years | 0 (0.0%) | 16 (66.7%) |
| 35 to 64 Years | 0 (0.0%) | 7 (24.1%) |
| 65 to 74 Years | 3 (15.8%) | 0 (0.0%) |
| 75 Years and over | 4 (100.0%) | 0 (0.0%) |
Disability Class by Sex by Age in Saddle Butte
Disability Class: Hearing Difficulty
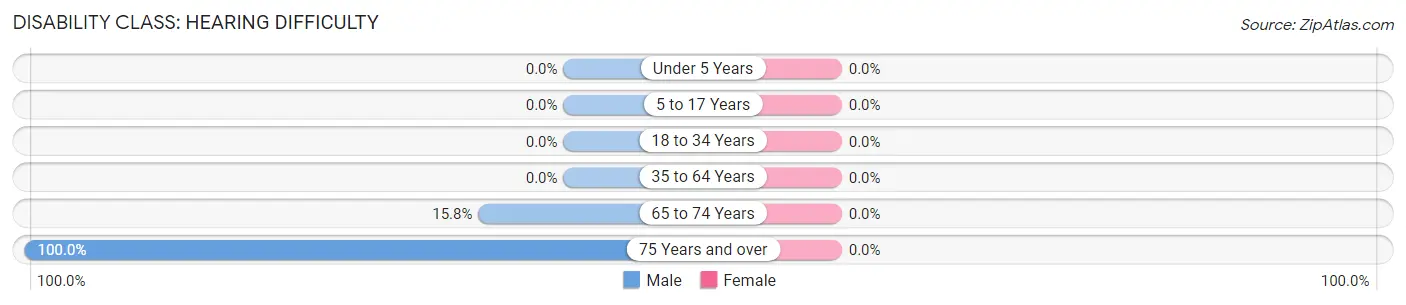
| Age Bracket | Male | Female |
| Under 5 Years | 0 (0.0%) | 0 (0.0%) |
| 5 to 17 Years | 0 (0.0%) | 0 (0.0%) |
| 18 to 34 Years | 0 (0.0%) | 0 (0.0%) |
| 35 to 64 Years | 0 (0.0%) | 0 (0.0%) |
| 65 to 74 Years | 3 (15.8%) | 0 (0.0%) |
| 75 Years and over | 4 (100.0%) | 0 (0.0%) |
Disability Class: Vision Difficulty
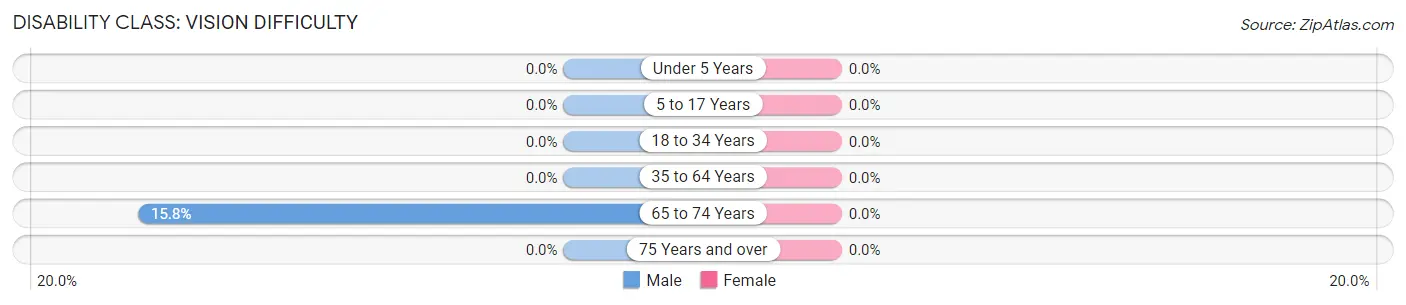
| Age Bracket | Male | Female |
| Under 5 Years | 0 (0.0%) | 0 (0.0%) |
| 5 to 17 Years | 0 (0.0%) | 0 (0.0%) |
| 18 to 34 Years | 0 (0.0%) | 0 (0.0%) |
| 35 to 64 Years | 0 (0.0%) | 0 (0.0%) |
| 65 to 74 Years | 3 (15.8%) | 0 (0.0%) |
| 75 Years and over | 0 (0.0%) | 0 (0.0%) |
Disability Class: Cognitive Difficulty
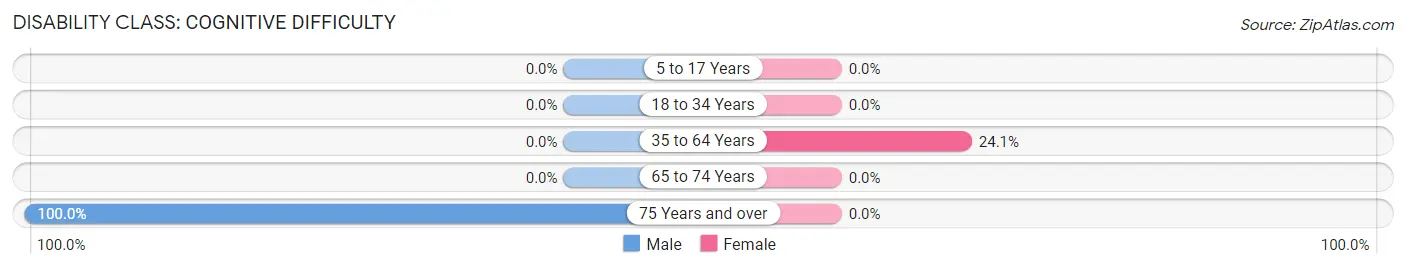
| Age Bracket | Male | Female |
| 5 to 17 Years | 0 (0.0%) | 0 (0.0%) |
| 18 to 34 Years | 0 (0.0%) | 0 (0.0%) |
| 35 to 64 Years | 0 (0.0%) | 7 (24.1%) |
| 65 to 74 Years | 0 (0.0%) | 0 (0.0%) |
| 75 Years and over | 4 (100.0%) | 0 (0.0%) |
Disability Class: Ambulatory Difficulty
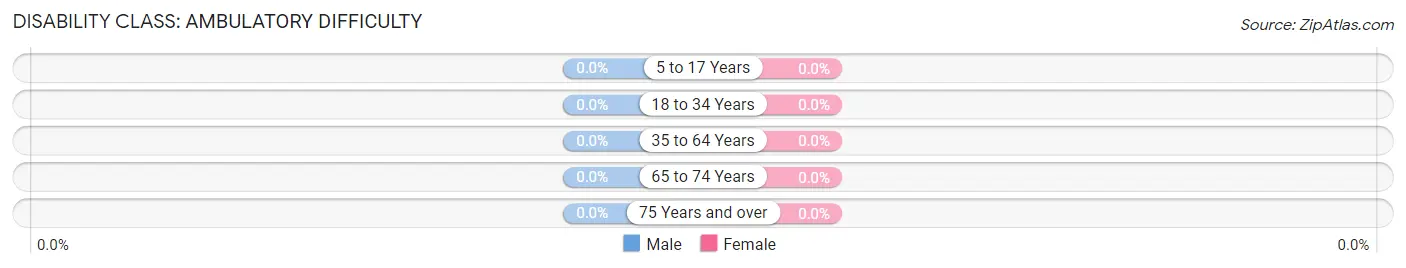
| Age Bracket | Male | Female |
| 5 to 17 Years | 0 (0.0%) | 0 (0.0%) |
| 18 to 34 Years | 0 (0.0%) | 0 (0.0%) |
| 35 to 64 Years | 0 (0.0%) | 0 (0.0%) |
| 65 to 74 Years | 0 (0.0%) | 0 (0.0%) |
| 75 Years and over | 0 (0.0%) | 0 (0.0%) |
Disability Class: Self-Care Difficulty
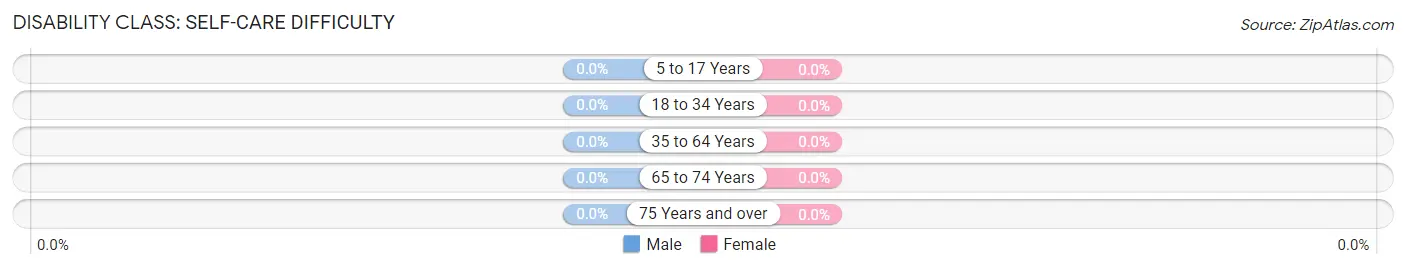
| Age Bracket | Male | Female |
| 5 to 17 Years | 0 (0.0%) | 0 (0.0%) |
| 18 to 34 Years | 0 (0.0%) | 0 (0.0%) |
| 35 to 64 Years | 0 (0.0%) | 0 (0.0%) |
| 65 to 74 Years | 0 (0.0%) | 0 (0.0%) |
| 75 Years and over | 0 (0.0%) | 0 (0.0%) |
Technology Access in Saddle Butte
Computing Device Access in Saddle Butte
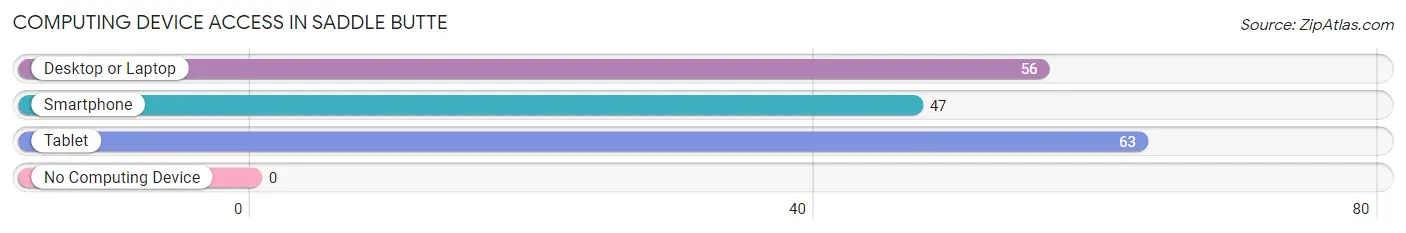
| Device Type | # Households | % Households |
| Desktop or Laptop | 56 | 88.9% |
| Smartphone | 47 | 74.6% |
| Tablet | 63 | 100.0% |
| No Computing Device | 0 | 0.0% |
| Total | 63 | 100.0% |
Internet Access in Saddle Butte
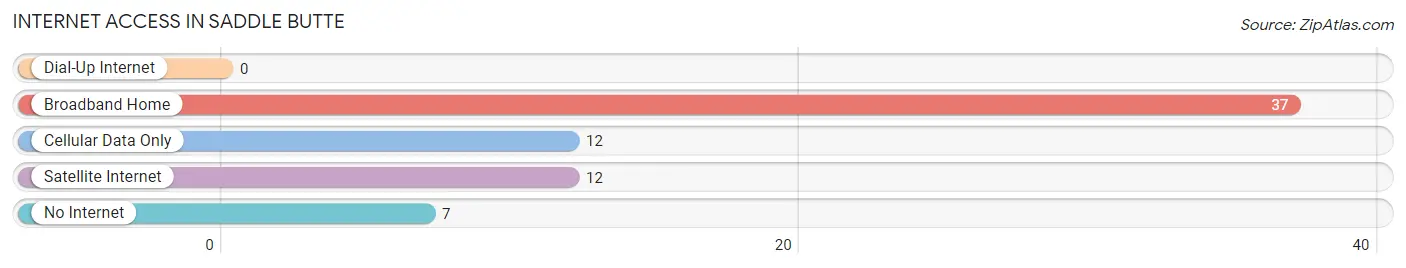
| Internet Type | # Households | % Households |
| Dial-Up Internet | 0 | 0.0% |
| Broadband Home | 37 | 58.7% |
| Cellular Data Only | 12 | 19.1% |
| Satellite Internet | 12 | 19.1% |
| No Internet | 7 | 11.1% |
| Total | 63 | 100.0% |
Saddle Butte Summary
Saddle Butte is a small unincorporated community located in the northern part of Montana, in the United States. It is situated in the foothills of the Rocky Mountains, and is part of the larger Flathead Valley region. The area is known for its stunning natural beauty, and is home to a variety of wildlife, including elk, deer, and bighorn sheep.
History
The area that is now Saddle Butte was first inhabited by the Kootenai and Salish Native American tribes. The Kootenai were the first to settle in the area, and they used the area for hunting and gathering. The Salish arrived later, and they used the area for fishing and trading.
The first non-Native American settlers arrived in the area in the late 1800s. These settlers were mostly ranchers and farmers, and they established small homesteads in the area. The area was also used for logging, and the timber industry was a major source of income for the area.
In the early 1900s, the area was officially named Saddle Butte. The name was derived from the nearby mountain, which was shaped like a saddle. The area was primarily used for ranching and farming, and the population remained small until the 1950s.
Geography
Saddle Butte is located in the northern part of Montana, in the Flathead Valley region. The area is situated in the foothills of the Rocky Mountains, and is surrounded by stunning natural beauty. The area is known for its rolling hills, lush forests, and crystal clear lakes.
The climate in Saddle Butte is generally mild, with warm summers and cold winters. The average temperature in the summer is around 70 degrees Fahrenheit, and the average temperature in the winter is around 20 degrees Fahrenheit.
Economy
The economy of Saddle Butte is primarily based on agriculture and tourism. The area is known for its stunning natural beauty, and it is a popular destination for outdoor enthusiasts. The area is also home to a variety of wildlife, including elk, deer, and bighorn sheep.
Agriculture is also an important part of the economy. The area is home to several farms, and the main crops grown in the area are hay, wheat, and barley. The area is also home to several wineries, and the local wines are popular with tourists.
Demographics
As of the 2010 census, the population of Saddle Butte was 1,093. The population is primarily white, with a small percentage of Native American and Hispanic residents. The median age of the population is 44.7 years, and the median household income is $45,000.
The area is served by the Flathead Valley School District, and there are several schools in the area. The area is also home to a variety of churches, and the main religion is Christianity.
Conclusion
Saddle Butte is a small unincorporated community located in the northern part of Montana, in the United States. The area is known for its stunning natural beauty, and is home to a variety of wildlife. The economy of Saddle Butte is primarily based on agriculture and tourism, and the population is primarily white. The area is served by the Flathead Valley School District, and there are several churches in the area. Saddle Butte is a beautiful area with a rich history and culture, and it is a great place to visit or live.
Common Questions
What is Per Capita Income in Saddle Butte?
Per Capita income in Saddle Butte is $31,228.
What is the Median Household income in Saddle Butte?
Median Household Income in Saddle Butte is $83,359.
What is Inequality or Gini Index in Saddle Butte?
Inequality or Gini Index in Saddle Butte is 0.40.
What is the Total Population of Saddle Butte?
Total Population of Saddle Butte is 180.
What is the Total Male Population of Saddle Butte?
Total Male Population of Saddle Butte is 90.
What is the Total Female Population of Saddle Butte?
Total Female Population of Saddle Butte is 90.
What is the Ratio of Males per 100 Females in Saddle Butte?
There are 100.00 Males per 100 Females in Saddle Butte.
What is the Ratio of Females per 100 Males in Saddle Butte?
There are 100.00 Females per 100 Males in Saddle Butte.
What is the Median Population Age in Saddle Butte?
Median Population Age in Saddle Butte is 35.6 Years.
What is the Average Family Size in Saddle Butte
Average Family Size in Saddle Butte is 3.5 People.
What is the Average Household Size in Saddle Butte
Average Household Size in Saddle Butte is 2.9 People.
How Large is the Labor Force in Saddle Butte?
There are 99 People in the Labor Forcein in Saddle Butte.
What is the Percentage of People in the Labor Force in Saddle Butte?
72.8% of People are in the Labor Force in Saddle Butte.
What is the Unemployment Rate in Saddle Butte?
Unemployment Rate in Saddle Butte is 14.1%.