Zip Codes with the Highest Percentage of Population Employed in Computer, Engineering & Science in Missoula, MT
RELATED REPORTS & OPTIONS
Computer, Engineering & Science
Missoula
Compare Zip Codes
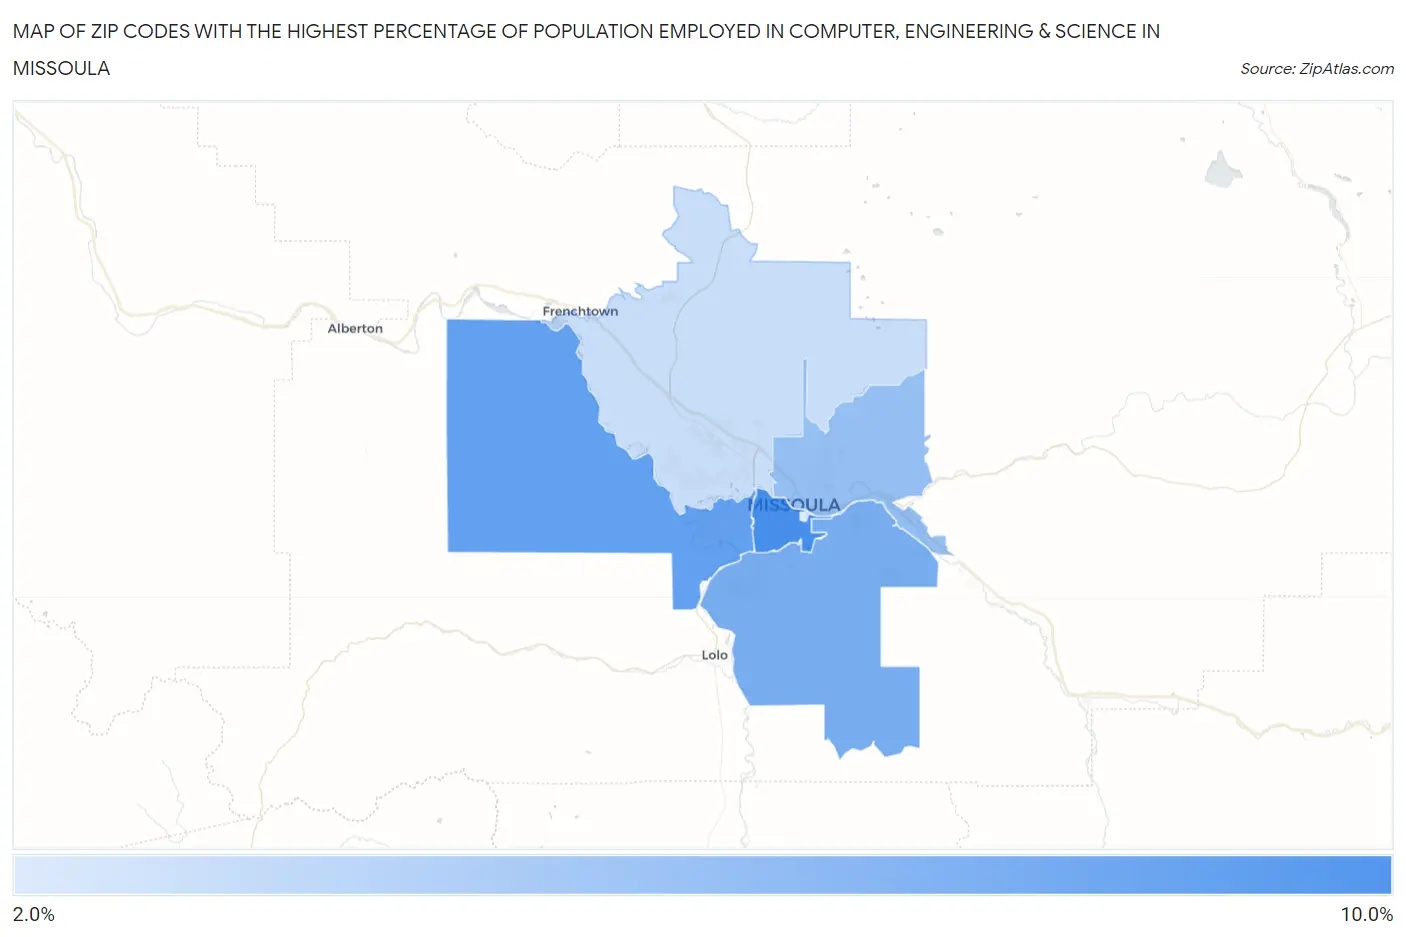
Map of Zip Codes with the Highest Percentage of Population Employed in Computer, Engineering & Science in Missoula
2.1%
8.4%
Zip Codes with the Highest Percentage of Population Employed in Computer, Engineering & Science in Missoula, MT
| Zip Code | % Employed | vs State | vs National | |
| 1. | 59801 | 8.4% | 5.4%(+2.98)#33 | 6.8%(+1.62)#4,727 |
| 2. | 59804 | 7.2% | 5.4%(+1.76)#46 | 6.8%(+0.400)#6,510 |
| 3. | 59803 | 6.3% | 5.4%(+0.871)#52 | 6.8%(-0.485)#8,178 |
| 4. | 59802 | 5.0% | 5.4%(-0.391)#86 | 6.8%(-1.75)#11,310 |
| 5. | 59808 | 2.9% | 5.4%(-2.49)#143 | 6.8%(-3.84)#18,400 |
| 6. | 59812 | 2.1% | 5.4%(-3.31)#172 | 6.8%(-4.67)#21,491 |
1
Common Questions
What are the Top 5 Zip Codes with the Highest Percentage of Population Employed in Computer, Engineering & Science in Missoula, MT?
Top 5 Zip Codes with the Highest Percentage of Population Employed in Computer, Engineering & Science in Missoula, MT are:
What zip code has the Highest Percentage of Population Employed in Computer, Engineering & Science in Missoula, MT?
59801 has the Highest Percentage of Population Employed in Computer, Engineering & Science in Missoula, MT with 8.4%.
What is the Percentage of Population Employed in Computer, Engineering & Science in Missoula, MT?
Percentage of Population Employed in Computer, Engineering & Science in Missoula is 6.5%.
What is the Percentage of Population Employed in Computer, Engineering & Science in Montana?
Percentage of Population Employed in Computer, Engineering & Science in Montana is 5.4%.
What is the Percentage of Population Employed in Computer, Engineering & Science in the United States?
Percentage of Population Employed in Computer, Engineering & Science in the United States is 6.8%.