Lake Annette, MO Map & Demographics
Lake Annette Map
Lake Annette Overview
$24,788
PER CAPITA INCOME
$34,583
AVG HOUSEHOLD INCOME
73.9%
WAGE / INCOME GAP [ % ]
26.1¢/ $1
WAGE / INCOME GAP [ $ ]
0.38
INEQUALITY / GINI INDEX
88
TOTAL POPULATION
52
MALE POPULATION
36
FEMALE POPULATION
144.44
MALES / 100 FEMALES
69.23
FEMALES / 100 MALES
47.6
MEDIAN AGE
2.2
AVG FAMILY SIZE
1.7
AVG HOUSEHOLD SIZE
51
LABOR FORCE [ PEOPLE ]
62.2%
PERCENT IN LABOR FORCE
17.6%
UNEMPLOYMENT RATE
Lake Annette Area Codes
Income in Lake Annette
Income Overview in Lake Annette
| Characteristic | Number | Measure |
| Per Capita Income | 88 | $24,788 |
| Median Family Income | 15 | $0 |
| Mean Family Income | 15 | $46,760 |
| Median Household Income | 53 | $34,583 |
| Mean Household Income | 53 | $43,242 |
| Income Deficit | 15 | $0 |
| Wage / Income Gap (%) | 88 | 73.92% |
| Wage / Income Gap ($) | 88 | 26.08¢ per $1 |
| Gini / Inequality Index | 88 | 0.38 |
Earnings by Sex in Lake Annette
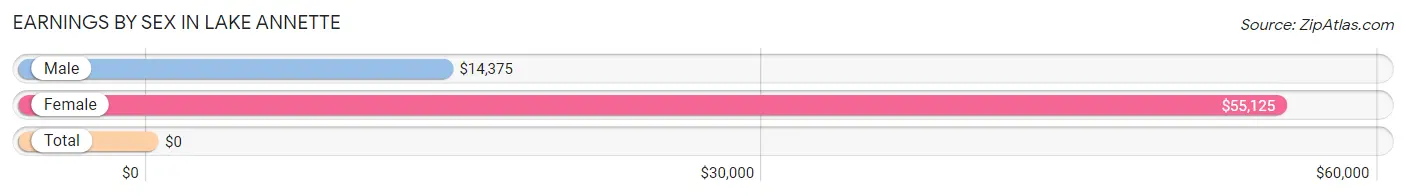
| Sex | Number | Average Earnings |
| Male | 33 (61.1%) | $14,375 |
| Female | 21 (38.9%) | $55,125 |
| Total | 54 (100.0%) | $0 |
Earnings by Sex by Income Bracket in Lake Annette
The most common earnings brackets in Lake Annette are $10,000 to $12,499 for men (9 | 27.3%) and $55,000 to $64,999 for women (10 | 47.6%).
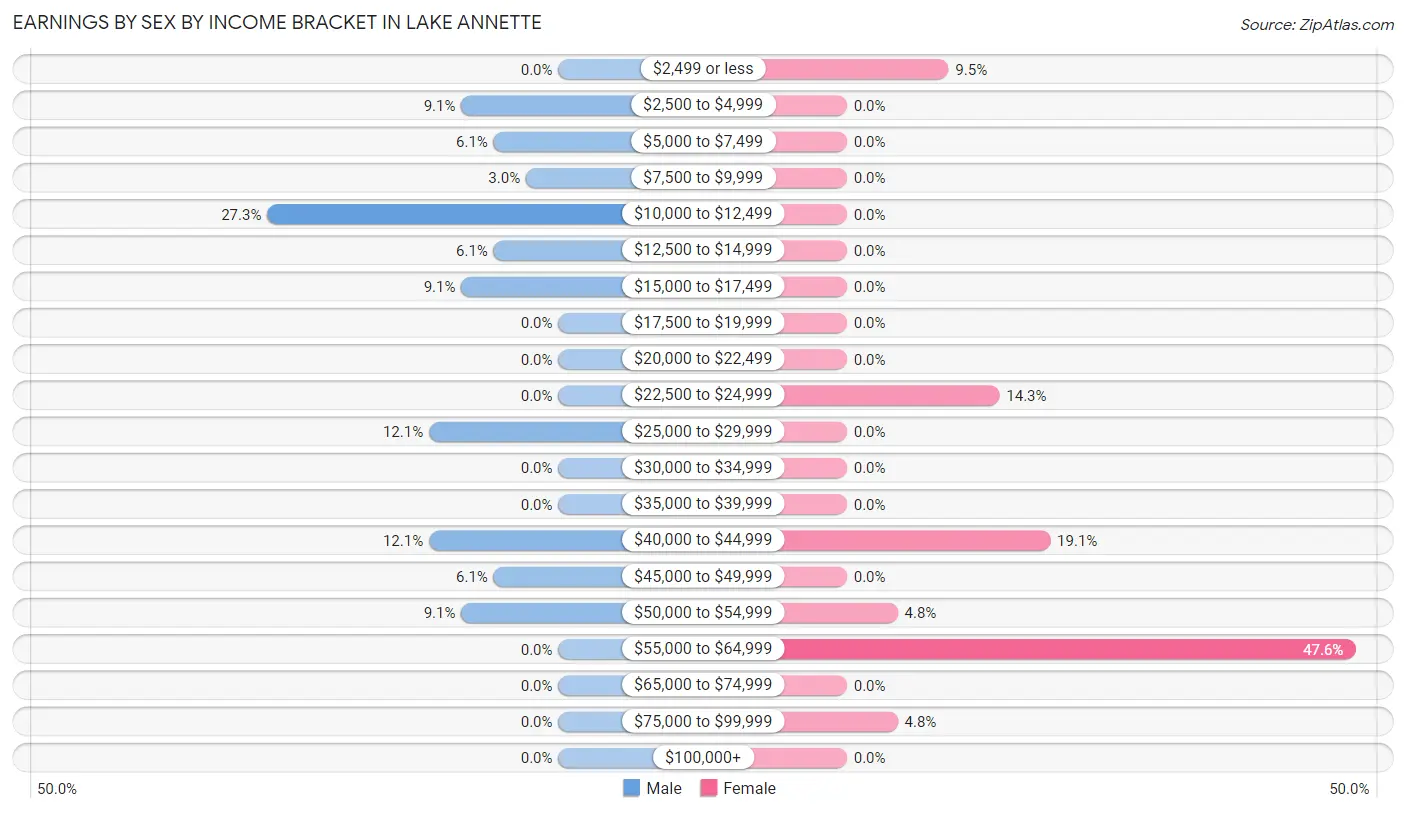
| Income | Male | Female |
| $2,499 or less | 0 (0.0%) | 2 (9.5%) |
| $2,500 to $4,999 | 3 (9.1%) | 0 (0.0%) |
| $5,000 to $7,499 | 2 (6.1%) | 0 (0.0%) |
| $7,500 to $9,999 | 1 (3.0%) | 0 (0.0%) |
| $10,000 to $12,499 | 9 (27.3%) | 0 (0.0%) |
| $12,500 to $14,999 | 2 (6.1%) | 0 (0.0%) |
| $15,000 to $17,499 | 3 (9.1%) | 0 (0.0%) |
| $17,500 to $19,999 | 0 (0.0%) | 0 (0.0%) |
| $20,000 to $22,499 | 0 (0.0%) | 0 (0.0%) |
| $22,500 to $24,999 | 0 (0.0%) | 3 (14.3%) |
| $25,000 to $29,999 | 4 (12.1%) | 0 (0.0%) |
| $30,000 to $34,999 | 0 (0.0%) | 0 (0.0%) |
| $35,000 to $39,999 | 0 (0.0%) | 0 (0.0%) |
| $40,000 to $44,999 | 4 (12.1%) | 4 (19.1%) |
| $45,000 to $49,999 | 2 (6.1%) | 0 (0.0%) |
| $50,000 to $54,999 | 3 (9.1%) | 1 (4.8%) |
| $55,000 to $64,999 | 0 (0.0%) | 10 (47.6%) |
| $65,000 to $74,999 | 0 (0.0%) | 0 (0.0%) |
| $75,000 to $99,999 | 0 (0.0%) | 1 (4.8%) |
| $100,000+ | 0 (0.0%) | 0 (0.0%) |
| Total | 33 (100.0%) | 21 (100.0%) |
Earnings by Sex by Educational Attainment in Lake Annette
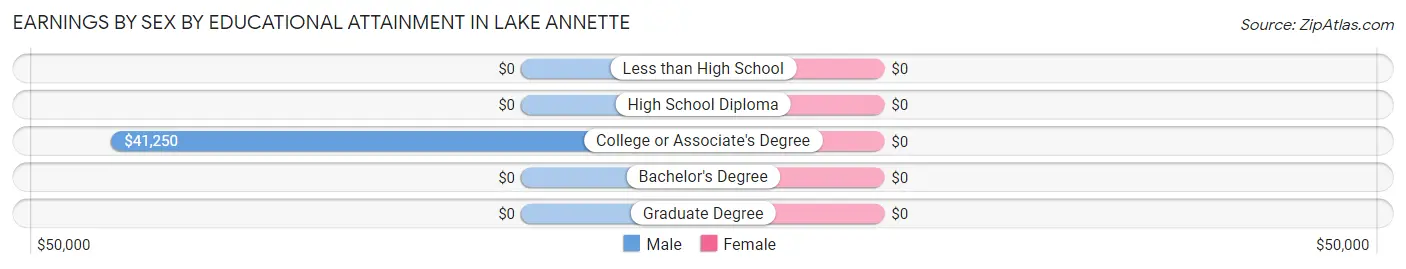
| Educational Attainment | Male Income | Female Income |
| Less than High School | - | - |
| High School Diploma | - | - |
| College or Associate's Degree | $41,250 | $0 |
| Bachelor's Degree | - | - |
| Graduate Degree | - | - |
| Total | $12,361 | $55,625 |
Family Income in Lake Annette
Family Income Brackets in Lake Annette
According to the Lake Annette family income data, there are 9 families falling into the $25,000 to $34,999 income range, which is the most common income bracket and makes up 60.0% of all families.
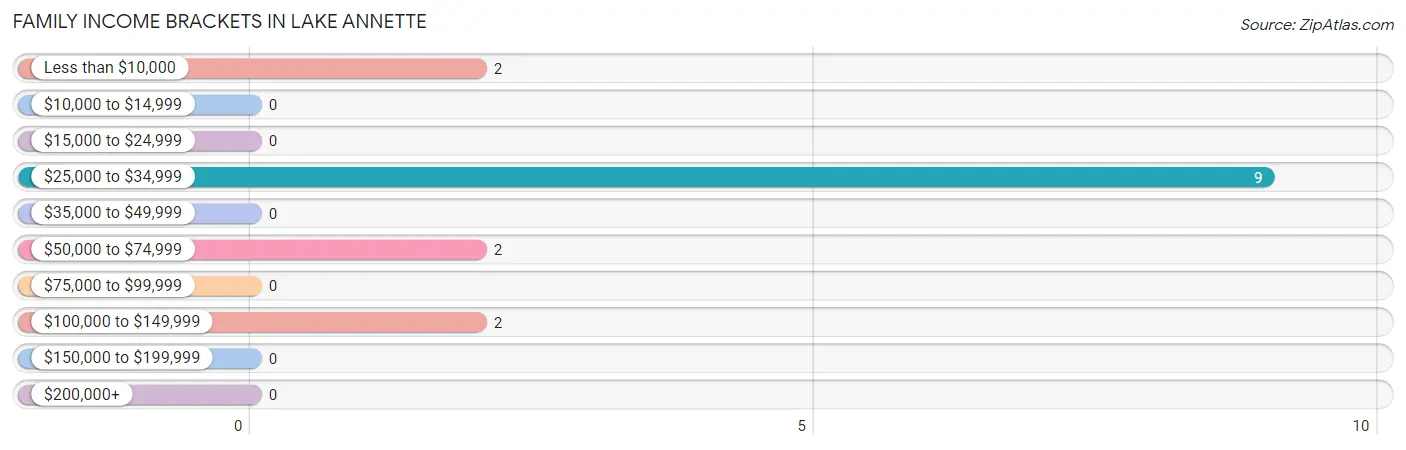
| Income Bracket | # Families | % Families |
| Less than $10,000 | 2 | 13.3% |
| $10,000 to $14,999 | 0 | 0.0% |
| $15,000 to $24,999 | 0 | 0.0% |
| $25,000 to $34,999 | 9 | 60.0% |
| $35,000 to $49,999 | 0 | 0.0% |
| $50,000 to $74,999 | 2 | 13.3% |
| $75,000 to $99,999 | 0 | 0.0% |
| $100,000 to $149,999 | 2 | 13.3% |
| $150,000 to $199,999 | 0 | 0.0% |
| $200,000+ | 0 | 0.0% |
Family Income by Famaliy Size in Lake Annette
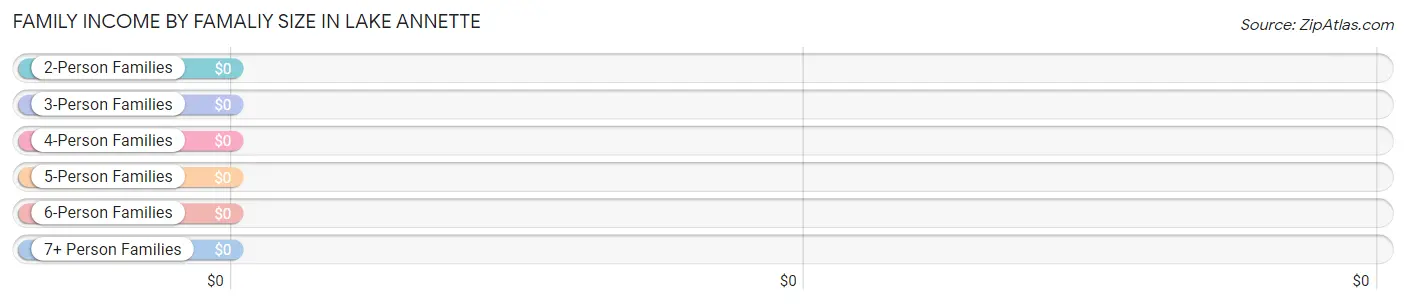
| Income Bracket | # Families | Median Income |
| 2-Person Families | 10 (66.7%) | $0 |
| 3-Person Families | 4 (26.7%) | $0 |
| 4-Person Families | 0 (0.0%) | $0 |
| 5-Person Families | 0 (0.0%) | $0 |
| 6-Person Families | 1 (6.7%) | $0 |
| 7+ Person Families | 0 (0.0%) | $0 |
| Total | 15 (100.0%) | $0 |
Family Income by Number of Earners in Lake Annette
| Number of Earners | # Families | Median Income |
| No Earners | 2 (13.3%) | $0 |
| 1 Earner | 2 (13.3%) | $0 |
| 2 Earners | 11 (73.3%) | $0 |
| 3+ Earners | 0 (0.0%) | $0 |
| Total | 15 (100.0%) | $0 |
Household Income in Lake Annette
Household Income Brackets in Lake Annette
With 16 households falling in the category, the $50,000 to $74,999 income range is the most frequent in Lake Annette, accounting for 30.2% of all households.
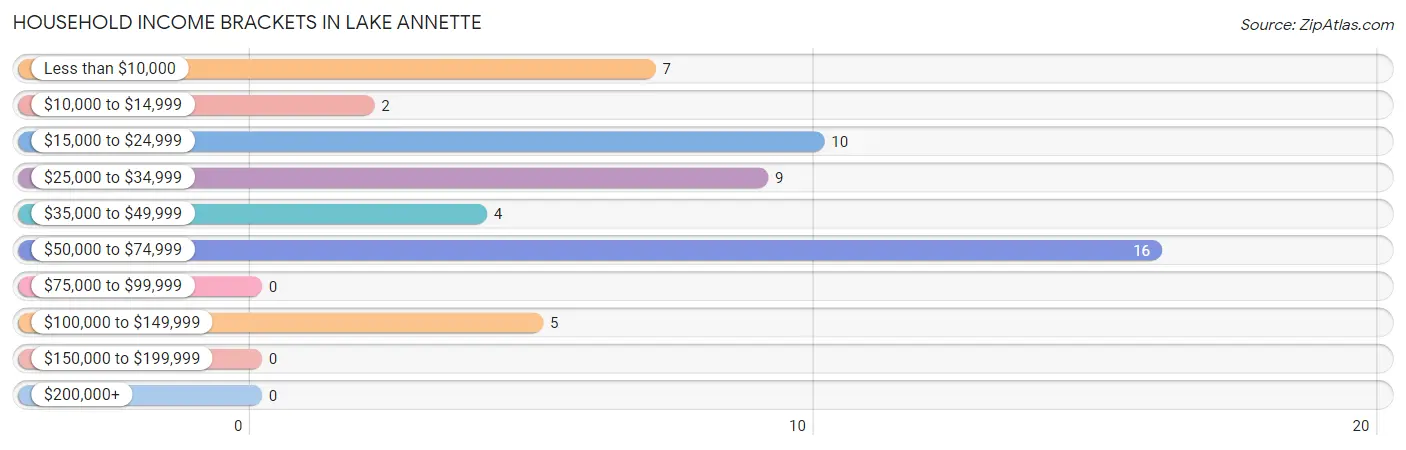
| Income Bracket | # Households | % Households |
| Less than $10,000 | 7 | 13.2% |
| $10,000 to $14,999 | 2 | 3.8% |
| $15,000 to $24,999 | 10 | 18.9% |
| $25,000 to $34,999 | 9 | 17.0% |
| $35,000 to $49,999 | 4 | 7.5% |
| $50,000 to $74,999 | 16 | 30.2% |
| $75,000 to $99,999 | 0 | 0.0% |
| $100,000 to $149,999 | 5 | 9.4% |
| $150,000 to $199,999 | 0 | 0.0% |
| $200,000+ | 0 | 0.0% |
Household Income by Householder Age in Lake Annette
The median household income in Lake Annette is $34,583, with the highest median household income of $34,861 found in the 45 to 64 years age bracket for the primary householder. A total of 37 households (69.8%) fall into this category.
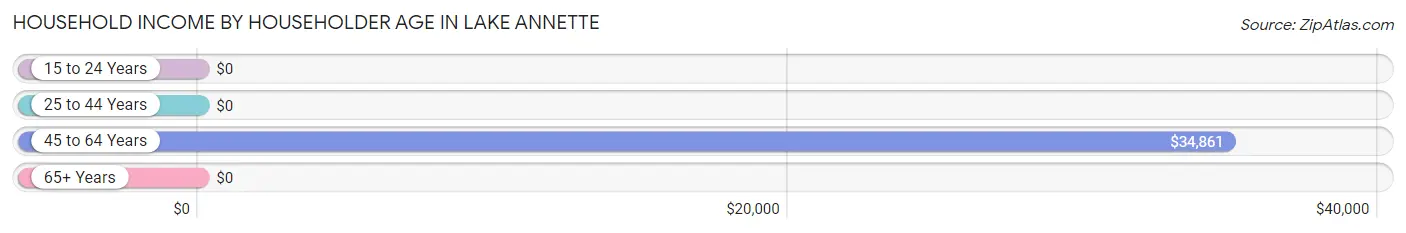
| Income Bracket | # Households | Median Income |
| 15 to 24 Years | 0 (0.0%) | $0 |
| 25 to 44 Years | 9 (17.0%) | $0 |
| 45 to 64 Years | 37 (69.8%) | $34,861 |
| 65+ Years | 7 (13.2%) | $0 |
| Total | 53 (100.0%) | $34,583 |
Poverty in Lake Annette
Income Below Poverty by Sex and Age in Lake Annette
With 17.3% poverty level for males and 25.0% for females among the residents of Lake Annette, 65 to 74 year old males and 45 to 54 year old females are the most vulnerable to poverty, with 2 males (66.7%) and 7 females (77.8%) in their respective age groups living below the poverty level.
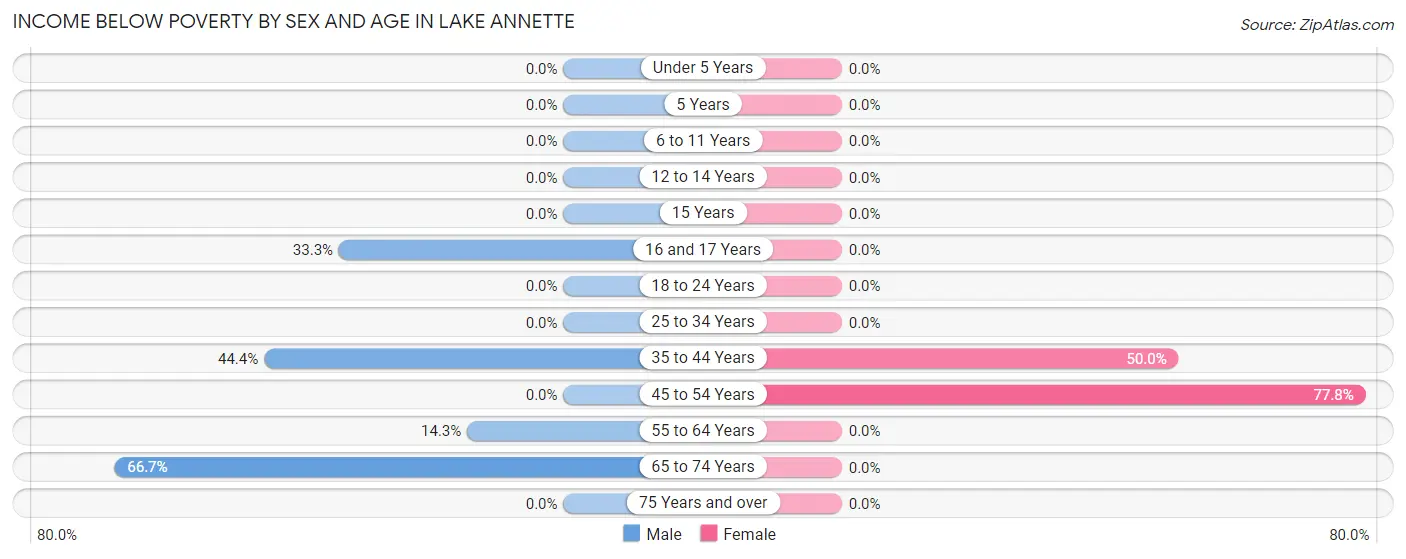
| Age Bracket | Male | Female |
| Under 5 Years | 0 (0.0%) | 0 (0.0%) |
| 5 Years | 0 (0.0%) | 0 (0.0%) |
| 6 to 11 Years | 0 (0.0%) | 0 (0.0%) |
| 12 to 14 Years | 0 (0.0%) | 0 (0.0%) |
| 15 Years | 0 (0.0%) | 0 (0.0%) |
| 16 and 17 Years | 1 (33.3%) | 0 (0.0%) |
| 18 to 24 Years | 0 (0.0%) | 0 (0.0%) |
| 25 to 34 Years | 0 (0.0%) | 0 (0.0%) |
| 35 to 44 Years | 4 (44.4%) | 2 (50.0%) |
| 45 to 54 Years | 0 (0.0%) | 7 (77.8%) |
| 55 to 64 Years | 2 (14.3%) | 0 (0.0%) |
| 65 to 74 Years | 2 (66.7%) | 0 (0.0%) |
| 75 Years and over | 0 (0.0%) | 0 (0.0%) |
| Total | 9 (17.3%) | 9 (25.0%) |
Income Above Poverty by Sex and Age in Lake Annette
According to the poverty statistics in Lake Annette, males aged 12 to 14 years and females aged 18 to 24 years are the age groups that are most secure financially, with 100.0% of males and 100.0% of females in these age groups living above the poverty line.
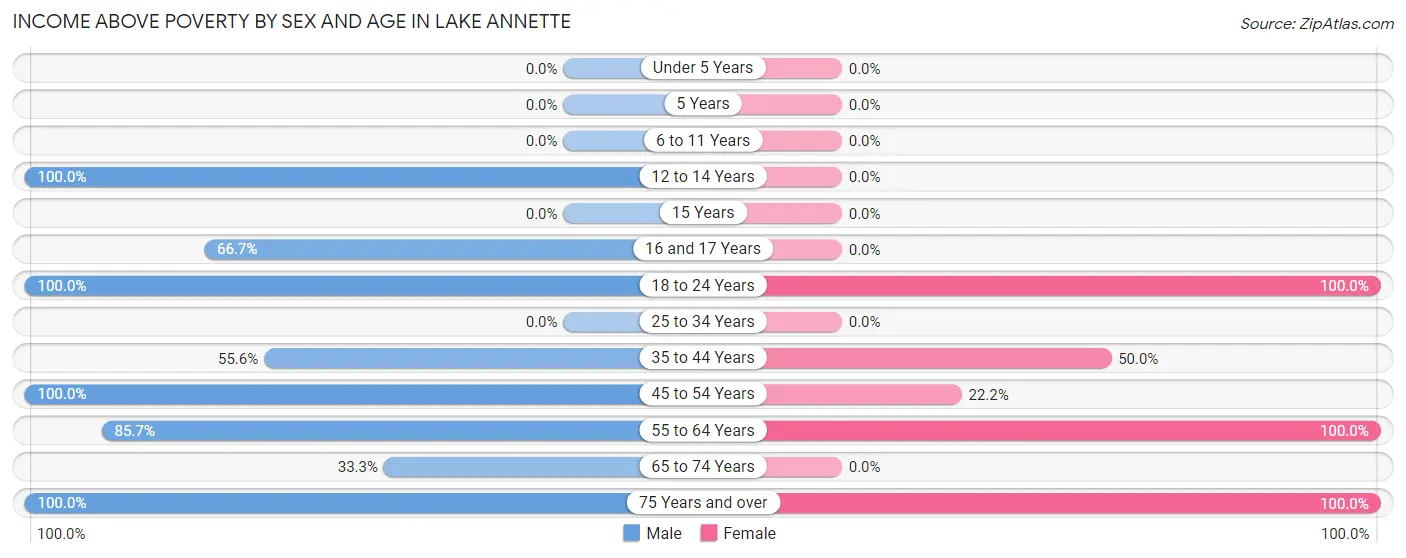
| Age Bracket | Male | Female |
| Under 5 Years | 0 (0.0%) | 0 (0.0%) |
| 5 Years | 0 (0.0%) | 0 (0.0%) |
| 6 to 11 Years | 0 (0.0%) | 0 (0.0%) |
| 12 to 14 Years | 6 (100.0%) | 0 (0.0%) |
| 15 Years | 0 (0.0%) | 0 (0.0%) |
| 16 and 17 Years | 2 (66.7%) | 0 (0.0%) |
| 18 to 24 Years | 4 (100.0%) | 6 (100.0%) |
| 25 to 34 Years | 0 (0.0%) | 0 (0.0%) |
| 35 to 44 Years | 5 (55.6%) | 2 (50.0%) |
| 45 to 54 Years | 11 (100.0%) | 2 (22.2%) |
| 55 to 64 Years | 12 (85.7%) | 15 (100.0%) |
| 65 to 74 Years | 1 (33.3%) | 0 (0.0%) |
| 75 Years and over | 2 (100.0%) | 2 (100.0%) |
| Total | 43 (82.7%) | 27 (75.0%) |
Income Below Poverty Among Married-Couple Families in Lake Annette
The poverty statistics for married-couple families in Lake Annette show that 13.3% or 2 of the total 15 families live below the poverty line. Families with 1 or 2 children have the highest poverty rate of 50.0%, comprising of 2 families. On the other hand, families with no children have the lowest poverty rate of 0.0%, which includes 0 families.
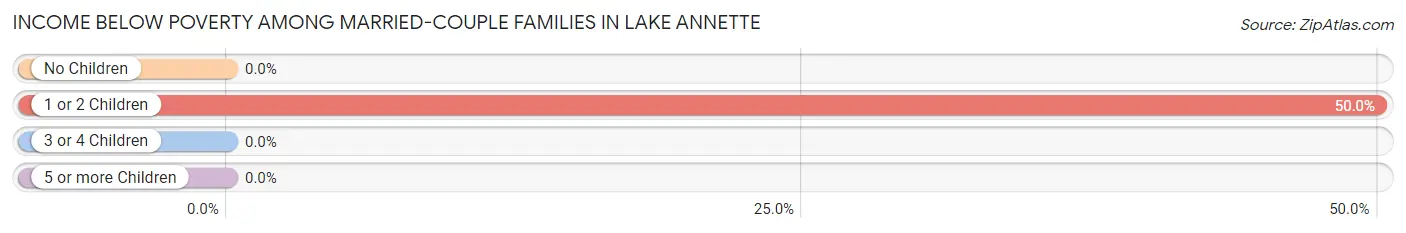
| Children | Above Poverty | Below Poverty |
| No Children | 10 (100.0%) | 0 (0.0%) |
| 1 or 2 Children | 2 (50.0%) | 2 (50.0%) |
| 3 or 4 Children | 1 (100.0%) | 0 (0.0%) |
| 5 or more Children | 0 (0.0%) | 0 (0.0%) |
| Total | 13 (86.7%) | 2 (13.3%) |
Income Below Poverty Among Single-Parent Households in Lake Annette
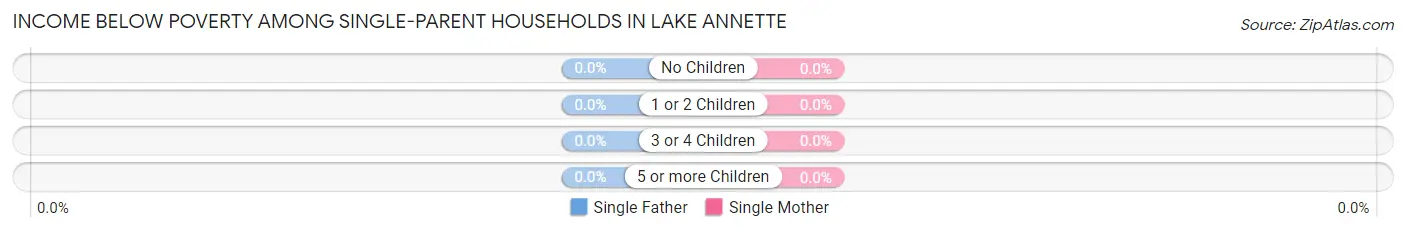
| Children | Single Father | Single Mother |
| No Children | 0 (0.0%) | 0 (0.0%) |
| 1 or 2 Children | 0 (0.0%) | 0 (0.0%) |
| 3 or 4 Children | 0 (0.0%) | 0 (0.0%) |
| 5 or more Children | 0 (0.0%) | 0 (0.0%) |
| Total | 0 (0.0%) | 0 (0.0%) |
Income Below Poverty Among Married-Couple vs Single-Parent Households in Lake Annette
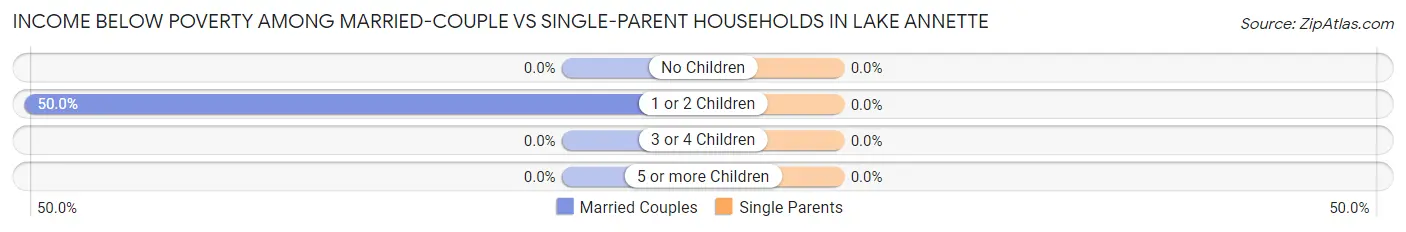
| Children | Married-Couple Families | Single-Parent Households |
| No Children | 0 (0.0%) | 0 (0.0%) |
| 1 or 2 Children | 2 (50.0%) | 0 (0.0%) |
| 3 or 4 Children | 0 (0.0%) | 0 (0.0%) |
| 5 or more Children | 0 (0.0%) | 0 (0.0%) |
| Total | 2 (13.3%) | 0 (0.0%) |
Race in Lake Annette
The most populous races in Lake Annette are White / Caucasian (71 | 80.7%), Asian (9 | 10.2%), and Native / Alaskan (4 | 4.5%).
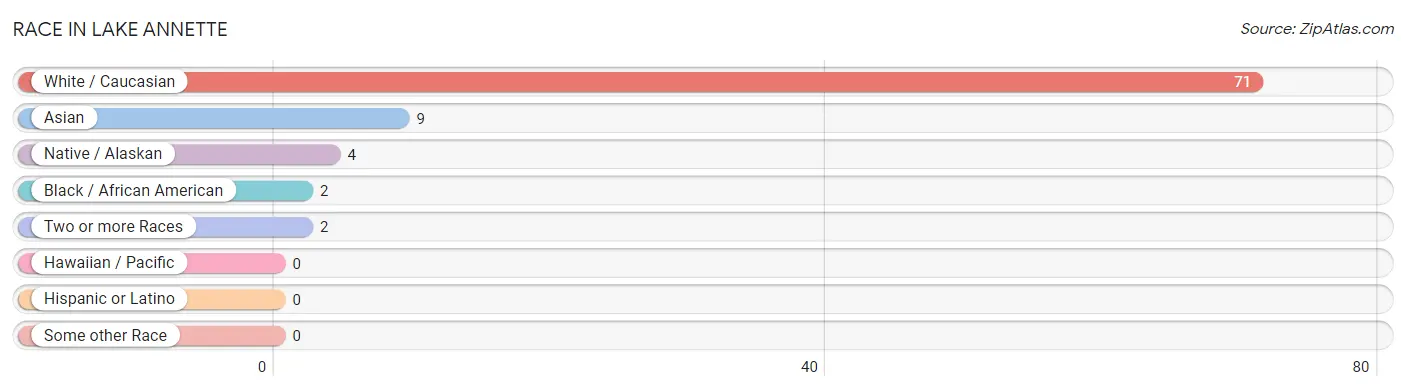
| Race | # Population | % Population |
| Asian | 9 | 10.2% |
| Black / African American | 2 | 2.3% |
| Hawaiian / Pacific | 0 | 0.0% |
| Hispanic or Latino | 0 | 0.0% |
| Native / Alaskan | 4 | 4.5% |
| White / Caucasian | 71 | 80.7% |
| Two or more Races | 2 | 2.3% |
| Some other Race | 0 | 0.0% |
| Total | 88 | 100.0% |
Ancestry in Lake Annette
The most populous ancestries reported in Lake Annette are German (15 | 17.1%), Burmese (9 | 10.2%), English (9 | 10.2%), Irish (9 | 10.2%), and Scottish (9 | 10.2%), together accounting for 58.0% of all Lake Annette residents.
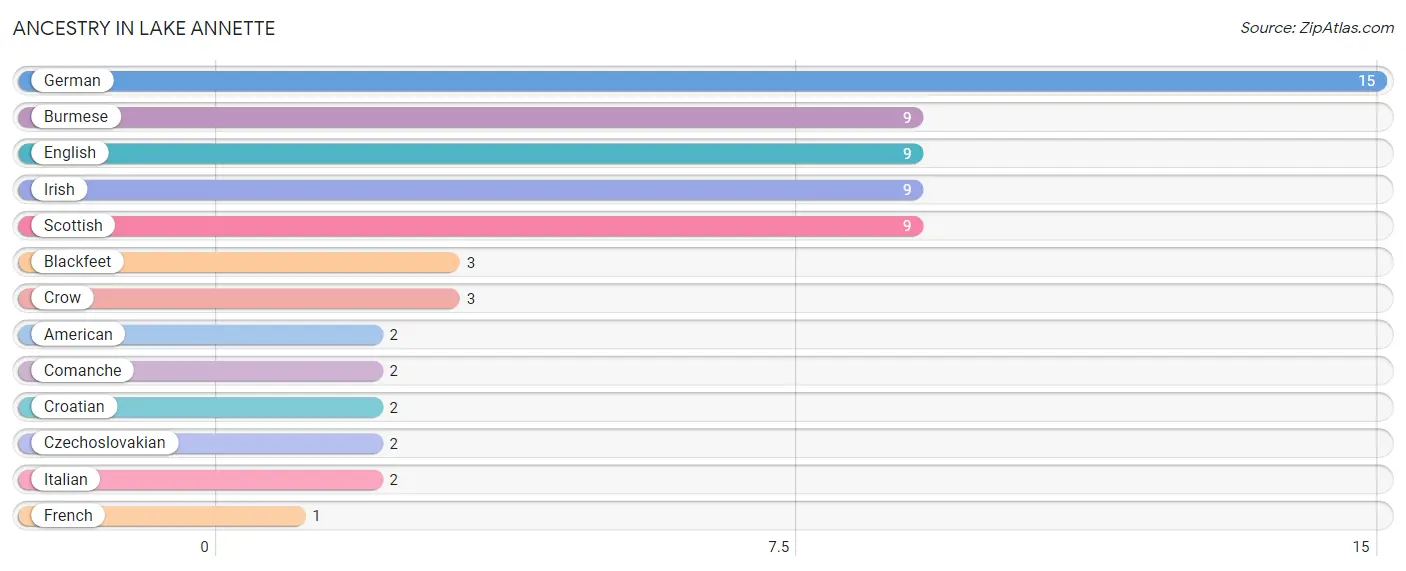
| Ancestry | # Population | % Population |
| American | 2 | 2.3% |
| Blackfeet | 3 | 3.4% |
| Burmese | 9 | 10.2% |
| Comanche | 2 | 2.3% |
| Croatian | 2 | 2.3% |
| Crow | 3 | 3.4% |
| Czechoslovakian | 2 | 2.3% |
| English | 9 | 10.2% |
| French | 1 | 1.1% |
| German | 15 | 17.1% |
| Irish | 9 | 10.2% |
| Italian | 2 | 2.3% |
| Scottish | 9 | 10.2% | View All 13 Rows |
Immigrants in Lake Annette
The most numerous immigrant groups reported in Lake Annette came from Asia (9 | 10.2%), Eastern Asia (9 | 10.2%), and Korea (9 | 10.2%), together accounting for 30.7% of all Lake Annette residents.
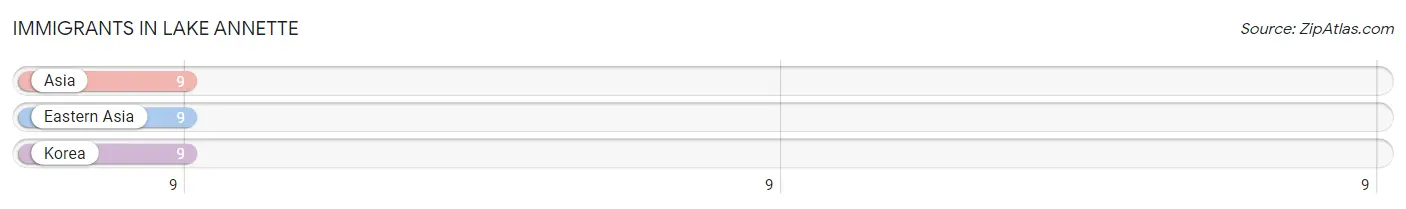
| Immigration Origin | # Population | % Population |
| Asia | 9 | 10.2% |
| Eastern Asia | 9 | 10.2% |
| Korea | 9 | 10.2% | View All 3 Rows |
Sex and Age in Lake Annette
Sex and Age in Lake Annette
The most populous age groups in Lake Annette are 60 to 64 Years (10 | 19.2%) for men and 55 to 59 Years (11 | 30.6%) for women.
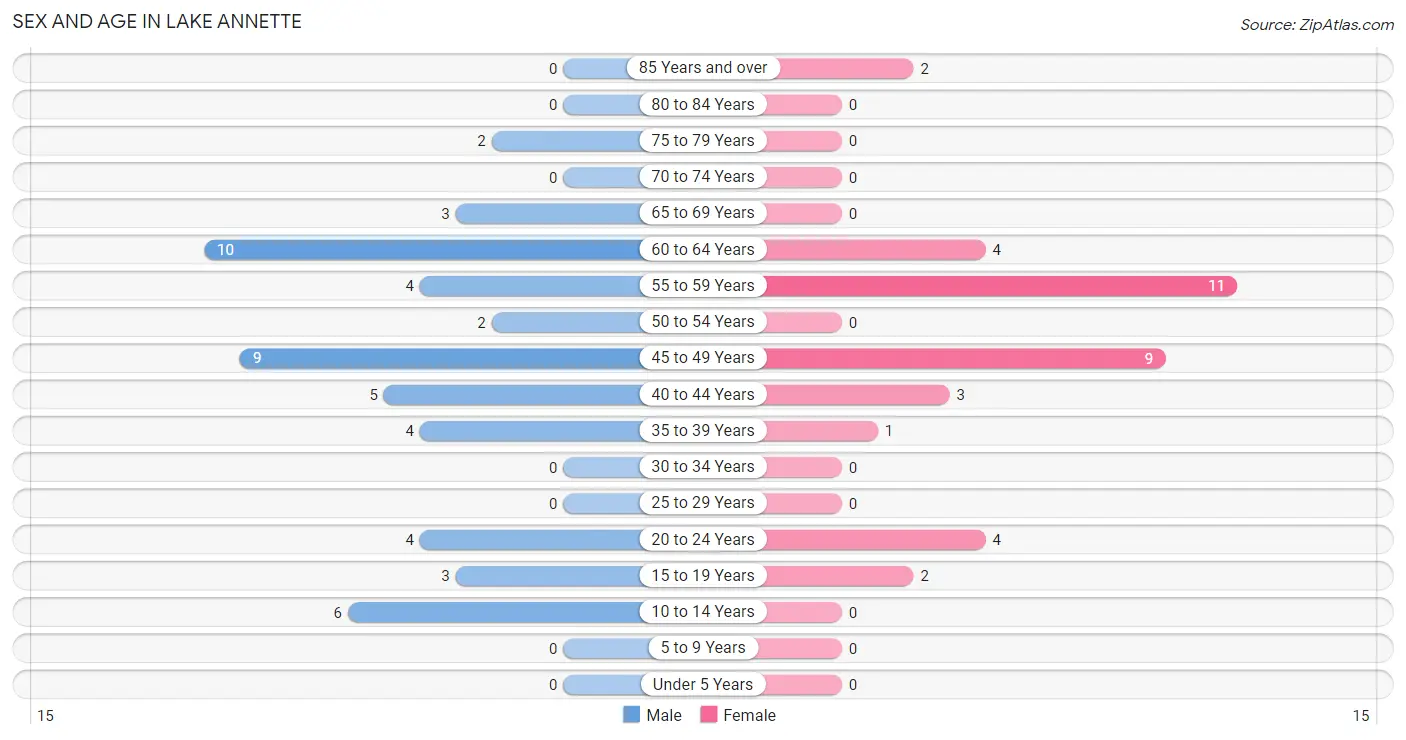
| Age Bracket | Male | Female |
| Under 5 Years | 0 (0.0%) | 0 (0.0%) |
| 5 to 9 Years | 0 (0.0%) | 0 (0.0%) |
| 10 to 14 Years | 6 (11.5%) | 0 (0.0%) |
| 15 to 19 Years | 3 (5.8%) | 2 (5.6%) |
| 20 to 24 Years | 4 (7.7%) | 4 (11.1%) |
| 25 to 29 Years | 0 (0.0%) | 0 (0.0%) |
| 30 to 34 Years | 0 (0.0%) | 0 (0.0%) |
| 35 to 39 Years | 4 (7.7%) | 1 (2.8%) |
| 40 to 44 Years | 5 (9.6%) | 3 (8.3%) |
| 45 to 49 Years | 9 (17.3%) | 9 (25.0%) |
| 50 to 54 Years | 2 (3.8%) | 0 (0.0%) |
| 55 to 59 Years | 4 (7.7%) | 11 (30.6%) |
| 60 to 64 Years | 10 (19.2%) | 4 (11.1%) |
| 65 to 69 Years | 3 (5.8%) | 0 (0.0%) |
| 70 to 74 Years | 0 (0.0%) | 0 (0.0%) |
| 75 to 79 Years | 2 (3.8%) | 0 (0.0%) |
| 80 to 84 Years | 0 (0.0%) | 0 (0.0%) |
| 85 Years and over | 0 (0.0%) | 2 (5.6%) |
| Total | 52 (100.0%) | 36 (100.0%) |
Families and Households in Lake Annette
Median Family Size in Lake Annette
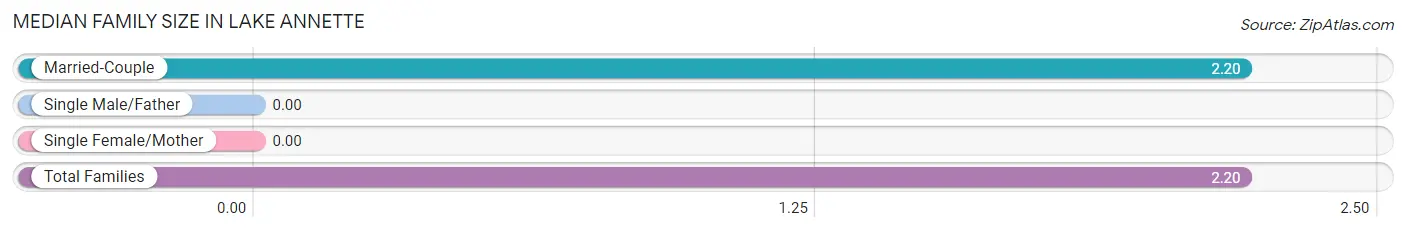
| Family Type | # Families | Family Size |
| Married-Couple | 15 (100.0%) | 2.20 |
| Single Male/Father | 0 (0.0%) | - |
| Single Female/Mother | 0 (0.0%) | - |
| Total Families | 15 (100.0%) | 2.20 |
Median Household Size in Lake Annette
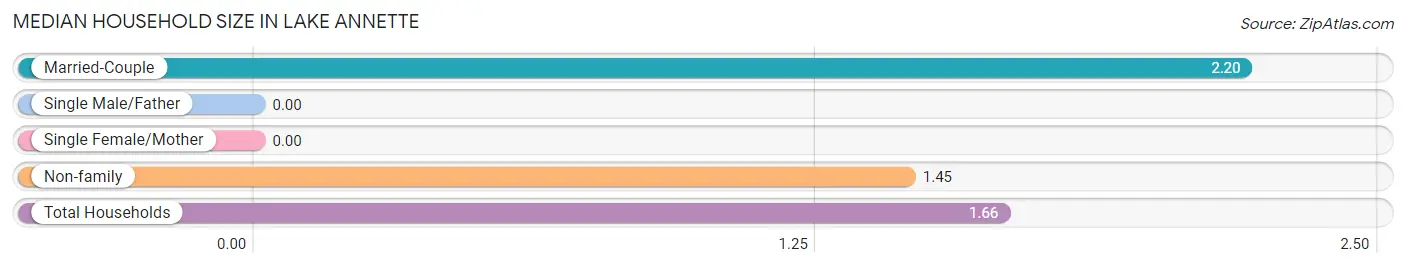
| Household Type | # Households | Household Size |
| Married-Couple | 15 (28.3%) | 2.20 |
| Single Male/Father | 0 (0.0%) | - |
| Single Female/Mother | 0 (0.0%) | - |
| Non-family | 38 (71.7%) | 1.45 |
| Total Households | 53 (100.0%) | 1.66 |
Household Size by Marriage Status in Lake Annette
Out of a total of 53 households in Lake Annette, 15 (28.3%) are family households, while 38 (71.7%) are nonfamily households. The most numerous type of family households are 2-person households, comprising 10, and the most common type of nonfamily households are 1-person households, comprising 31.
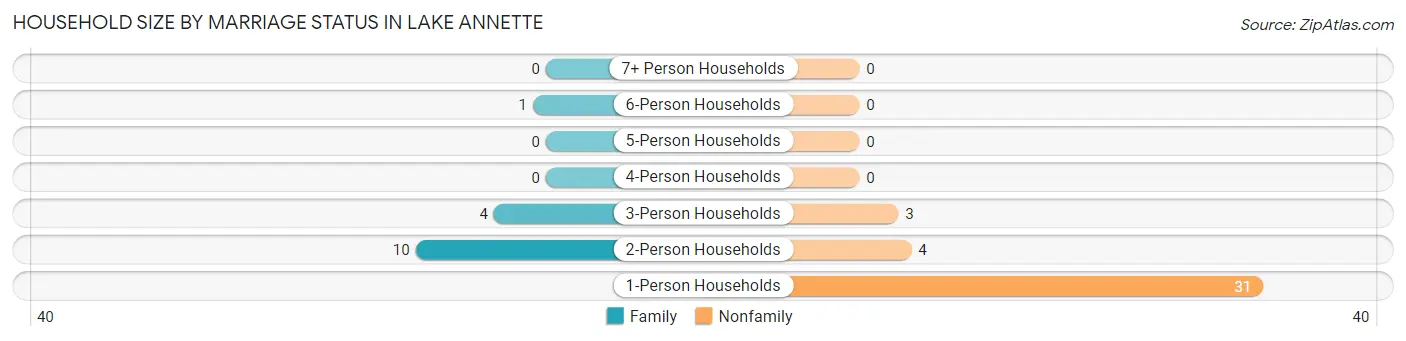
| Household Size | Family Households | Nonfamily Households |
| 1-Person Households | - | 31 (58.5%) |
| 2-Person Households | 10 (18.9%) | 4 (7.5%) |
| 3-Person Households | 4 (7.5%) | 3 (5.7%) |
| 4-Person Households | 0 (0.0%) | 0 (0.0%) |
| 5-Person Households | 0 (0.0%) | 0 (0.0%) |
| 6-Person Households | 1 (1.9%) | 0 (0.0%) |
| 7+ Person Households | 0 (0.0%) | 0 (0.0%) |
| Total | 15 (28.3%) | 38 (71.7%) |
Female Fertility in Lake Annette
Fertility by Age in Lake Annette
| Age Bracket | Women with Births | Births / 1,000 Women |
| 15 to 19 years | 0 (0.0%) | 0.0 |
| 20 to 34 years | 0 (0.0%) | 0.0 |
| 35 to 50 years | 0 (0.0%) | 0.0 |
| Total | 0 (0.0%) | 0.0 |
Fertility by Age by Marriage Status in Lake Annette
| Age Bracket | Married | Unmarried |
| 15 to 19 years | 0 (0.0%) | 0 (0.0%) |
| 20 to 34 years | 0 (0.0%) | 0 (0.0%) |
| 35 to 50 years | 0 (0.0%) | 0 (0.0%) |
| Total | 0 (0.0%) | 0 (0.0%) |
Fertility by Education in Lake Annette
| Educational Attainment | Women with Births | Births / 1,000 Women |
| Less than High School | 0 (0.0%) | 0.0 |
| High School Diploma | 0 (0.0%) | 0.0 |
| College or Associate's Degree | 0 (0.0%) | 0.0 |
| Bachelor's Degree | 0 (0.0%) | 0.0 |
| Graduate Degree | 0 (0.0%) | 0.0 |
| Total | 0 (0.0%) | 0.0 |
Fertility by Education by Marriage Status in Lake Annette
| Educational Attainment | Married | Unmarried |
| Less than High School | 0 (0.0%) | 0 (0.0%) |
| High School Diploma | 0 (0.0%) | 0 (0.0%) |
| College or Associate's Degree | 0 (0.0%) | 0 (0.0%) |
| Bachelor's Degree | 0 (0.0%) | 0 (0.0%) |
| Graduate Degree | 0 (0.0%) | 0 (0.0%) |
| Total | 0 (0.0%) | 0 (0.0%) |
Employment Characteristics in Lake Annette
Employment by Class of Employer in Lake Annette
Among the 40 employed individuals in Lake Annette, private company employees (28 | 70.0%), not-for-profit organizations (4 | 10.0%), and local government employees (4 | 10.0%) make up the most common classes of employment.
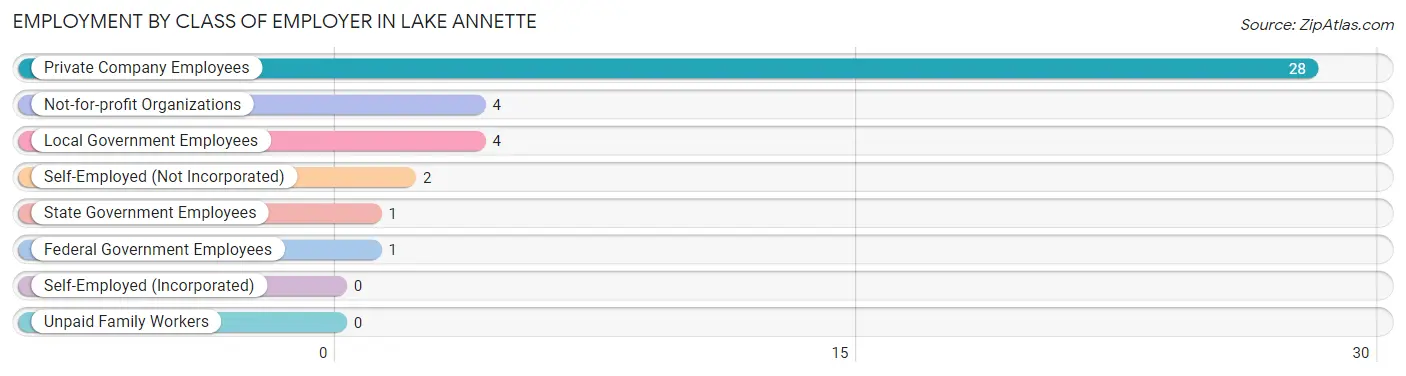
| Employer Class | # Employees | % Employees |
| Private Company Employees | 28 | 70.0% |
| Self-Employed (Incorporated) | 0 | 0.0% |
| Self-Employed (Not Incorporated) | 2 | 5.0% |
| Not-for-profit Organizations | 4 | 10.0% |
| Local Government Employees | 4 | 10.0% |
| State Government Employees | 1 | 2.5% |
| Federal Government Employees | 1 | 2.5% |
| Unpaid Family Workers | 0 | 0.0% |
| Total | 40 | 100.0% |
Employment Status by Age in Lake Annette
According to the labor force statistics for Lake Annette, out of the total population over 16 years of age (82), 62.2% or 51 individuals are in the labor force, with 17.6% or 9 of them unemployed. The age group with the highest labor force participation rate is 20 to 24 years, with 100.0% or 8 individuals in the labor force. Within the labor force, the 45 to 54 years age range has the highest percentage of unemployed individuals, with 69.2% or 9 of them being unemployed.
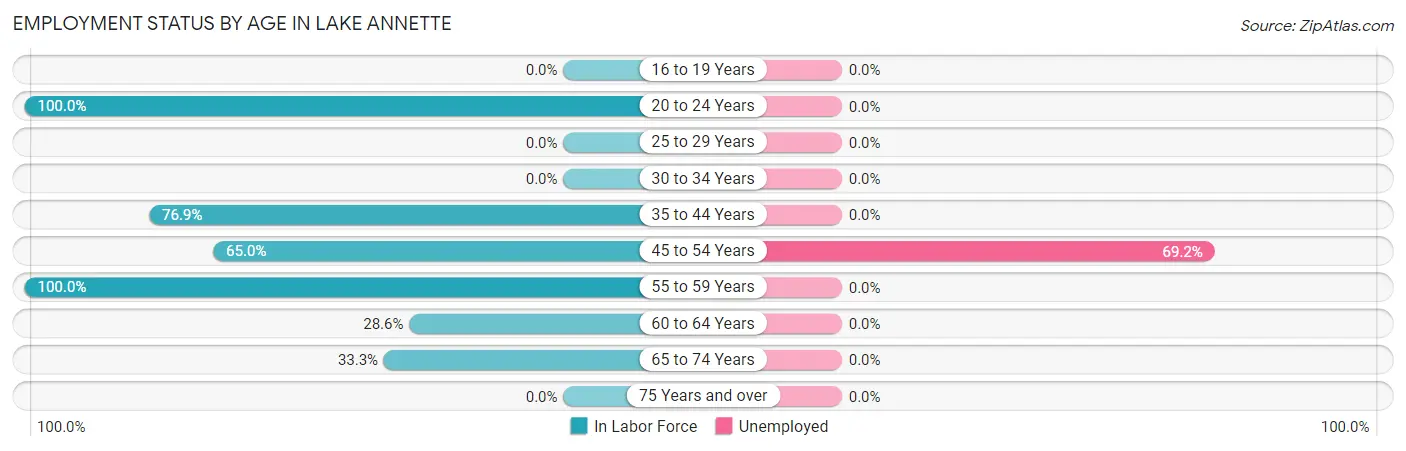
| Age Bracket | In Labor Force | Unemployed |
| 16 to 19 Years | 0 (0.0%) | 0 (0.0%) |
| 20 to 24 Years | 8 (100.0%) | 0 (0.0%) |
| 25 to 29 Years | 0 (0.0%) | 0 (0.0%) |
| 30 to 34 Years | 0 (0.0%) | 0 (0.0%) |
| 35 to 44 Years | 10 (76.9%) | 0 (0.0%) |
| 45 to 54 Years | 13 (65.0%) | 9 (69.2%) |
| 55 to 59 Years | 15 (100.0%) | 0 (0.0%) |
| 60 to 64 Years | 4 (28.6%) | 0 (0.0%) |
| 65 to 74 Years | 1 (33.3%) | 0 (0.0%) |
| 75 Years and over | 0 (0.0%) | 0 (0.0%) |
| Total | 51 (62.2%) | 9 (17.6%) |
Employment Status by Educational Attainment in Lake Annette
According to labor force statistics for Lake Annette, 67.7% of individuals (42) out of the total population between 25 and 64 years of age (62) are in the labor force, with 21.4% or 9 of them being unemployed. The group with the highest labor force participation rate are those with the educational attainment of bachelor's degree or higher, with 90.5% or 19 individuals in the labor force. Within the labor force, individuals with bachelor's degree or higher education have the highest percentage of unemployment, with 47.4% or 9 of them being unemployed.
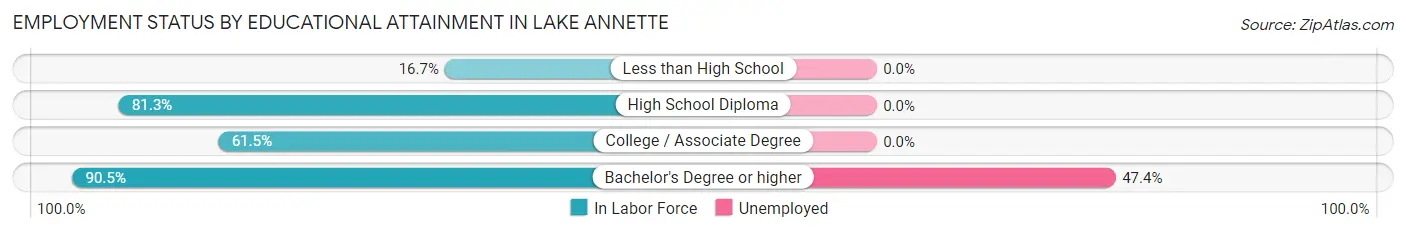
| Educational Attainment | In Labor Force | Unemployed |
| Less than High School | 2 (16.7%) | 0 (0.0%) |
| High School Diploma | 13 (81.3%) | 0 (0.0%) |
| College / Associate Degree | 8 (61.5%) | 0 (0.0%) |
| Bachelor's Degree or higher | 19 (90.5%) | 10 (47.4%) |
| Total | 42 (67.7%) | 13 (21.4%) |
Employment Occupations by Sex in Lake Annette
Management, Business, Science and Arts Occupations
Management, Business, Science and Arts Occupations by Sex
| Occupation | Male | Female |
| Management | 0 (0.0%) | 0 (0.0%) |
| Business & Financial | 0 (0.0%) | 0 (0.0%) |
| Computers, Engineering & Science | 0 (0.0%) | 0 (0.0%) |
| Computers & Mathematics | 0 (0.0%) | 0 (0.0%) |
| Architecture & Engineering | 0 (0.0%) | 0 (0.0%) |
| Life, Physical & Social Science | 0 (0.0%) | 0 (0.0%) |
| Community & Social Service | 0 (0.0%) | 0 (0.0%) |
| Education, Arts & Media | 0 (0.0%) | 0 (0.0%) |
| Legal Services & Support | 0 (0.0%) | 0 (0.0%) |
| Education Instruction & Library | 0 (0.0%) | 0 (0.0%) |
| Arts, Media & Entertainment | 0 (0.0%) | 0 (0.0%) |
| Health Diagnosing & Treating | 0 (0.0%) | 0 (0.0%) |
| Health Technologists | 0 (0.0%) | 0 (0.0%) |
| Total (Category) | 0 (0.0%) | 0 (0.0%) |
| Total (Overall) | 23 (54.8%) | 19 (45.2%) |
Services Occupations
The most common Services occupations in Lake Annette are Healthcare Support (9 | 21.4%), Cleaning & Maintenance (2 | 4.8%), and Personal Care & Service (1 | 2.4%).
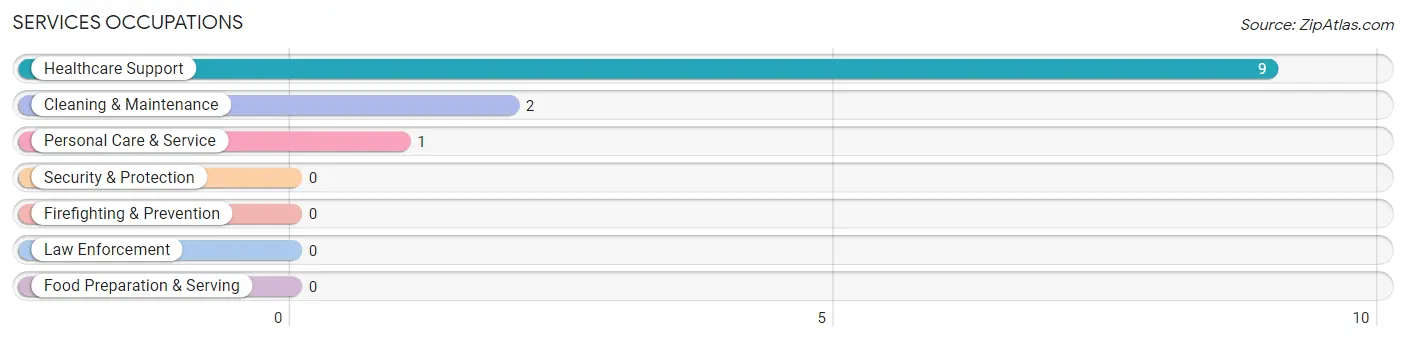
Services Occupations by Sex
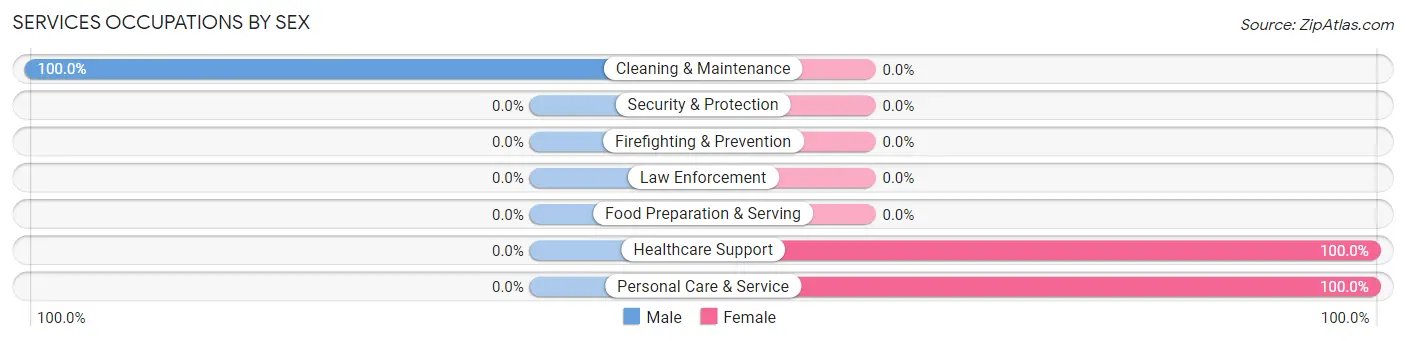
| Occupation | Male | Female |
| Healthcare Support | 0 (0.0%) | 9 (100.0%) |
| Security & Protection | 0 (0.0%) | 0 (0.0%) |
| Firefighting & Prevention | 0 (0.0%) | 0 (0.0%) |
| Law Enforcement | 0 (0.0%) | 0 (0.0%) |
| Food Preparation & Serving | 0 (0.0%) | 0 (0.0%) |
| Cleaning & Maintenance | 2 (100.0%) | 0 (0.0%) |
| Personal Care & Service | 0 (0.0%) | 1 (100.0%) |
| Total (Category) | 2 (16.7%) | 10 (83.3%) |
| Total (Overall) | 23 (54.8%) | 19 (45.2%) |
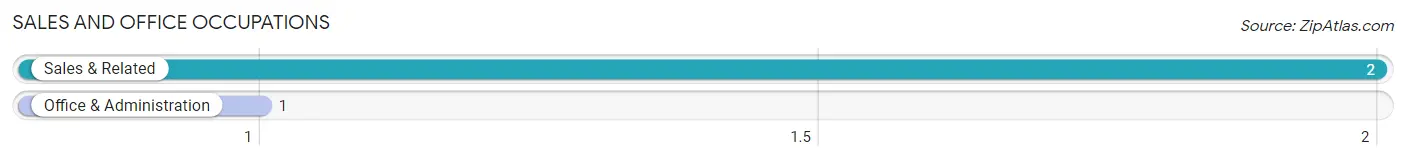
Sales and Office Occupations
The most common Sales and Office occupations in Lake Annette are Sales & Related (2 | 4.8%), and Office & Administration (1 | 2.4%).
Sales and Office Occupations by Sex
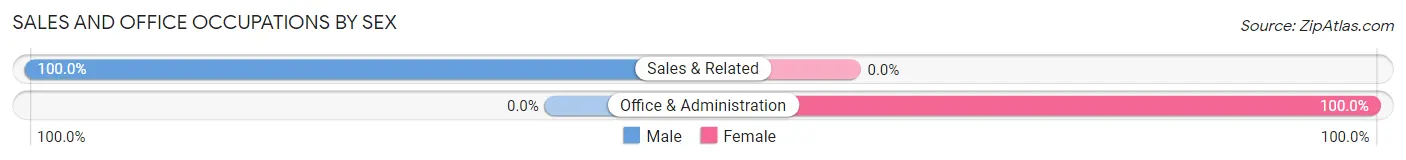
| Occupation | Male | Female |
| Sales & Related | 2 (100.0%) | 0 (0.0%) |
| Office & Administration | 0 (0.0%) | 1 (100.0%) |
| Total (Category) | 2 (66.7%) | 1 (33.3%) |
| Total (Overall) | 23 (54.8%) | 19 (45.2%) |
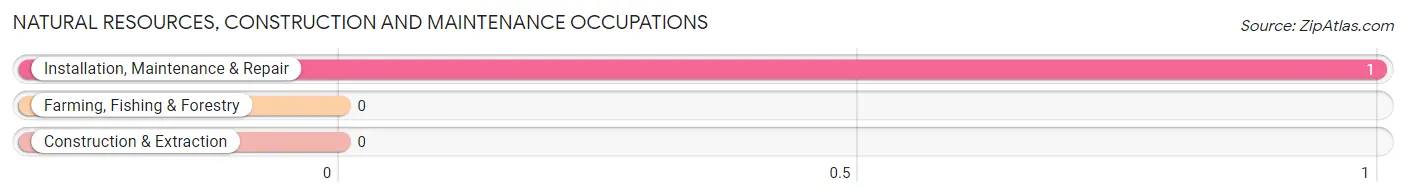
Natural Resources, Construction and Maintenance Occupations
The most common Natural Resources, Construction and Maintenance occupations in Lake Annette are , and Installation, Maintenance & Repair (1 | 2.4%).
Natural Resources, Construction and Maintenance Occupations by Sex
| Occupation | Male | Female |
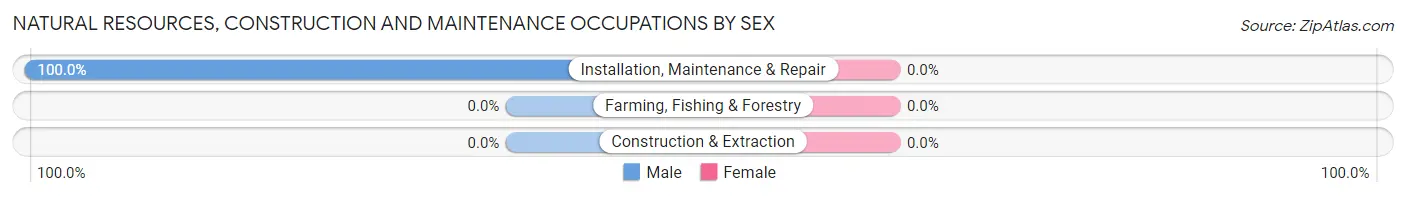
| Farming, Fishing & Forestry | 0 (0.0%) | 0 (0.0%) |
| Construction & Extraction | 0 (0.0%) | 0 (0.0%) |
| Installation, Maintenance & Repair | 1 (100.0%) | 0 (0.0%) |
| Total (Category) | 1 (100.0%) | 0 (0.0%) |
| Total (Overall) | 23 (54.8%) | 19 (45.2%) |
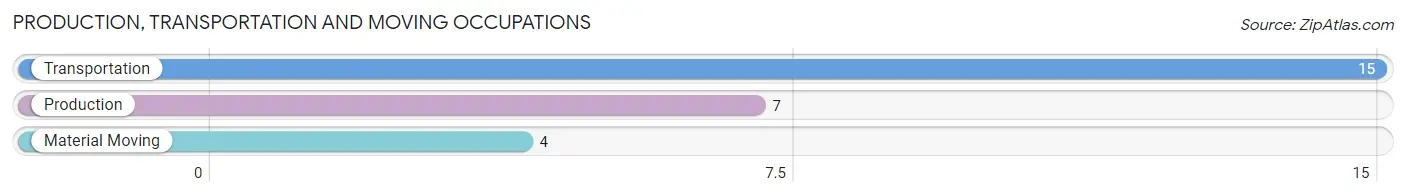
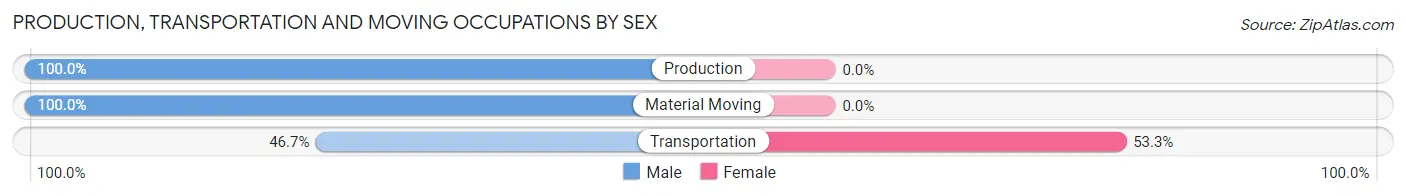
Production, Transportation and Moving Occupations
The most common Production, Transportation and Moving occupations in Lake Annette are Transportation (15 | 35.7%), Production (7 | 16.7%), and Material Moving (4 | 9.5%).
Production, Transportation and Moving Occupations by Sex
| Occupation | Male | Female |
| Production | 7 (100.0%) | 0 (0.0%) |
| Transportation | 7 (46.7%) | 8 (53.3%) |
| Material Moving | 4 (100.0%) | 0 (0.0%) |
| Total (Category) | 18 (69.2%) | 8 (30.8%) |
| Total (Overall) | 23 (54.8%) | 19 (45.2%) |
Employment Industries by Sex in Lake Annette
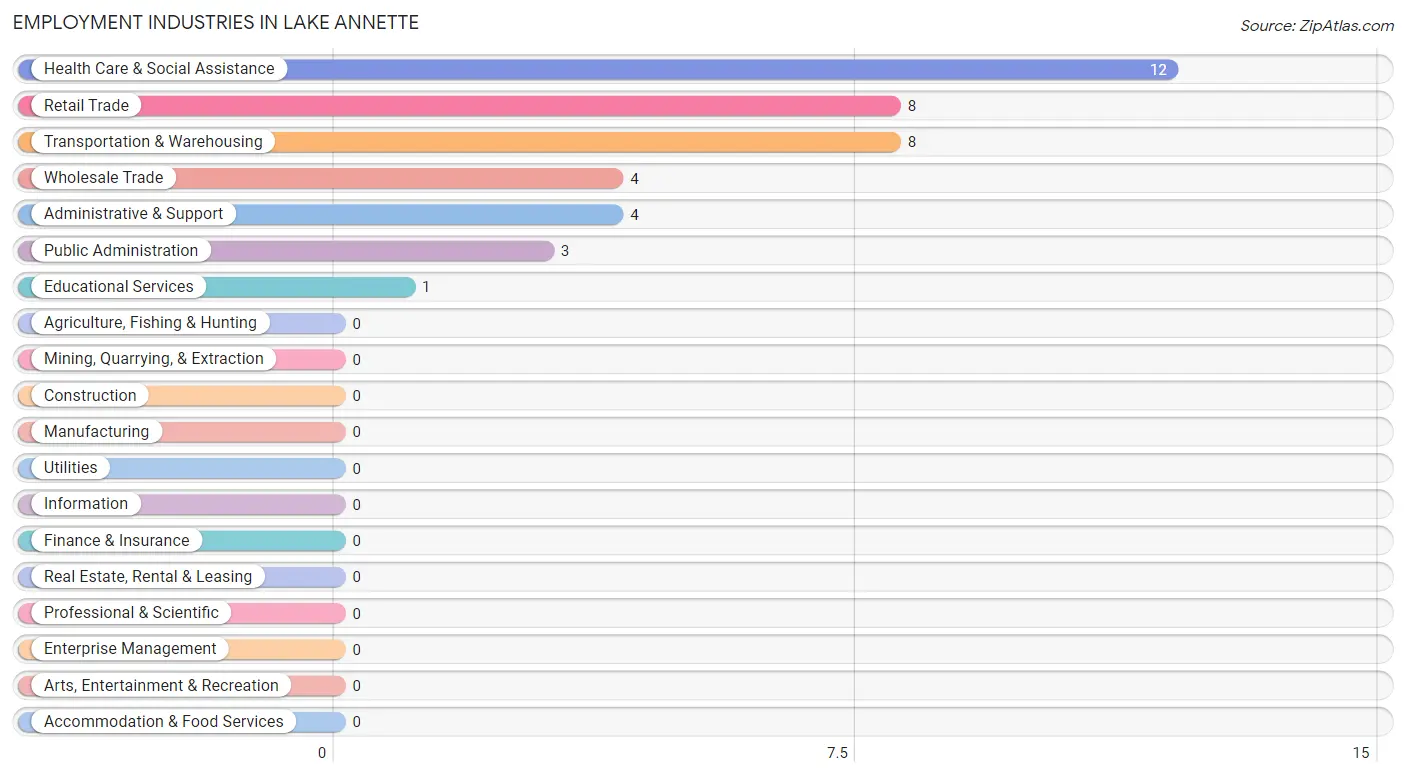
Employment Industries in Lake Annette
The major employment industries in Lake Annette include Health Care & Social Assistance (12 | 28.6%), Retail Trade (8 | 19.1%), Transportation & Warehousing (8 | 19.1%), Wholesale Trade (4 | 9.5%), and Administrative & Support (4 | 9.5%).
Employment Industries by Sex in Lake Annette
The Lake Annette industries that see more men than women are Retail Trade (100.0%), Administrative & Support (100.0%), and Public Administration (66.7%), whereas the industries that tend to have a higher number of women are Wholesale Trade (100.0%), Educational Services (100.0%), and Health Care & Social Assistance (75.0%).
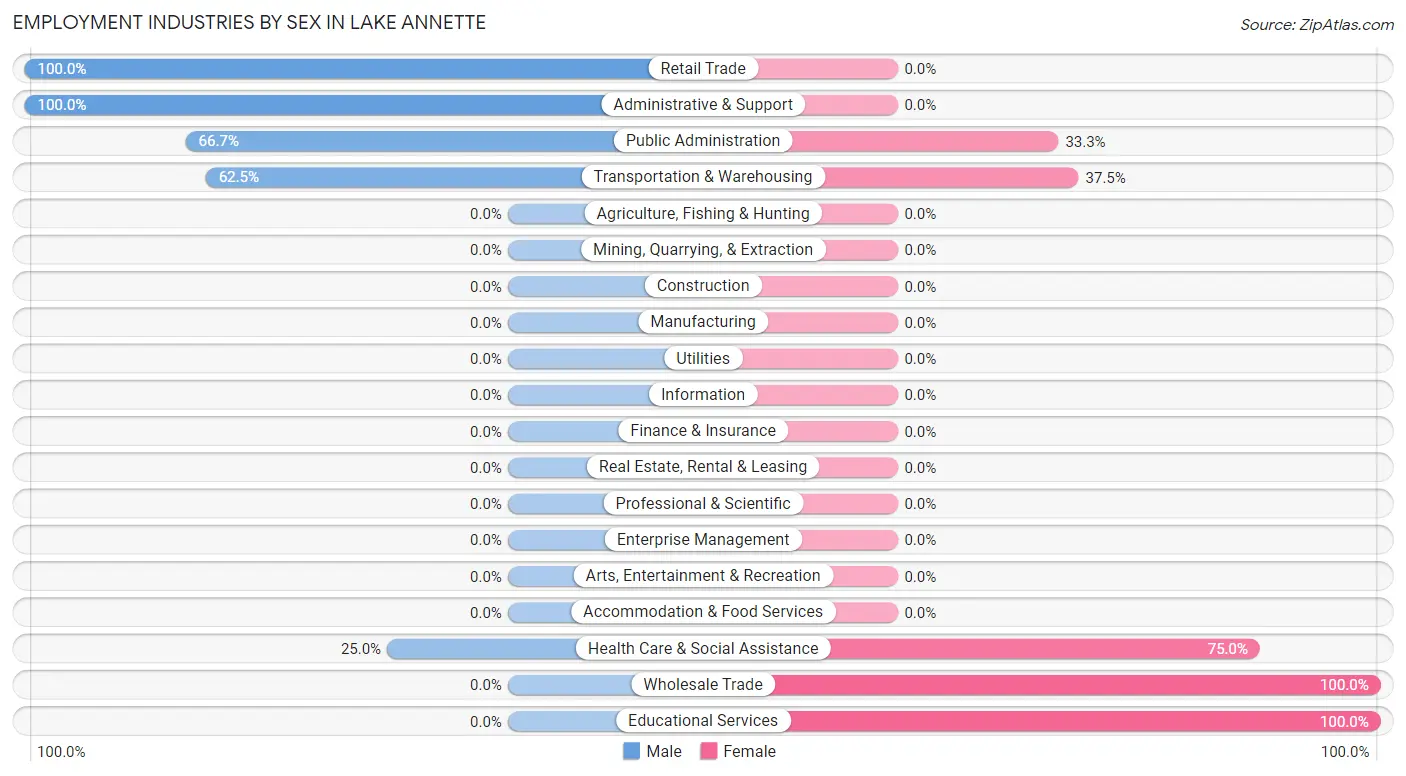
| Industry | Male | Female |
| Agriculture, Fishing & Hunting | 0 (0.0%) | 0 (0.0%) |
| Mining, Quarrying, & Extraction | 0 (0.0%) | 0 (0.0%) |
| Construction | 0 (0.0%) | 0 (0.0%) |
| Manufacturing | 0 (0.0%) | 0 (0.0%) |
| Wholesale Trade | 0 (0.0%) | 4 (100.0%) |
| Retail Trade | 8 (100.0%) | 0 (0.0%) |
| Transportation & Warehousing | 5 (62.5%) | 3 (37.5%) |
| Utilities | 0 (0.0%) | 0 (0.0%) |
| Information | 0 (0.0%) | 0 (0.0%) |
| Finance & Insurance | 0 (0.0%) | 0 (0.0%) |
| Real Estate, Rental & Leasing | 0 (0.0%) | 0 (0.0%) |
| Professional & Scientific | 0 (0.0%) | 0 (0.0%) |
| Enterprise Management | 0 (0.0%) | 0 (0.0%) |
| Administrative & Support | 4 (100.0%) | 0 (0.0%) |
| Educational Services | 0 (0.0%) | 1 (100.0%) |
| Health Care & Social Assistance | 3 (25.0%) | 9 (75.0%) |
| Arts, Entertainment & Recreation | 0 (0.0%) | 0 (0.0%) |
| Accommodation & Food Services | 0 (0.0%) | 0 (0.0%) |
| Public Administration | 2 (66.7%) | 1 (33.3%) |
| Total | 23 (54.8%) | 19 (45.2%) |
Education in Lake Annette
School Enrollment in Lake Annette
The most common levels of schooling among the 13 students in Lake Annette are high school (7 | 53.8%), middle school (4 | 30.8%), and college / undergraduate (2 | 15.4%).
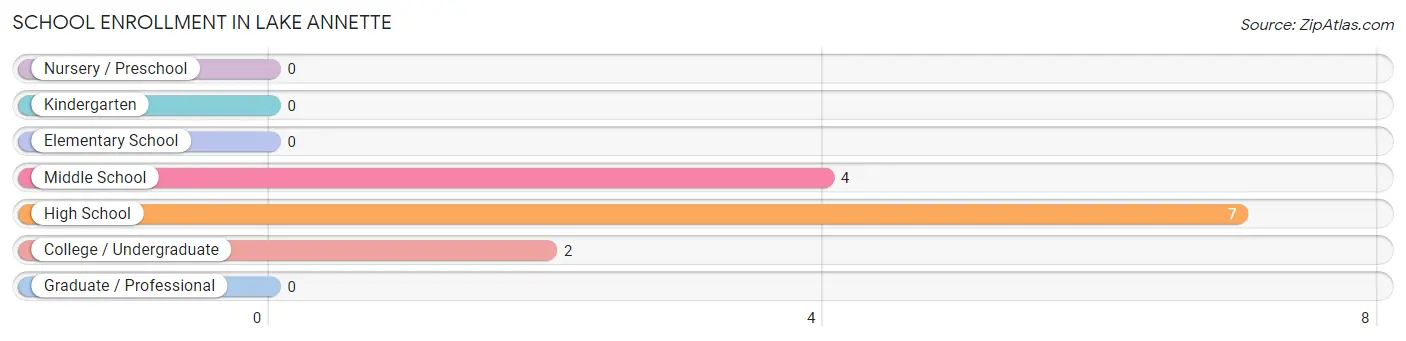
| School Level | # Students | % Students |
| Nursery / Preschool | 0 | 0.0% |
| Kindergarten | 0 | 0.0% |
| Elementary School | 0 | 0.0% |
| Middle School | 4 | 30.8% |
| High School | 7 | 53.8% |
| College / Undergraduate | 2 | 15.4% |
| Graduate / Professional | 0 | 0.0% |
| Total | 13 | 100.0% |
School Enrollment by Age by Funding Source in Lake Annette
Out of a total of 13 students who are enrolled in schools in Lake Annette, 2 (15.4%) attend a private institution, while the remaining 11 (84.6%) are enrolled in public schools. The age group of 35 years and over has the highest likelihood of being enrolled in private schools, with 2 (100.0% in the age bracket) enrolled. Conversely, the age group of 10 to 14 year olds has the lowest likelihood of being enrolled in a private school, with 6 (100.0% in the age bracket) attending a public institution.
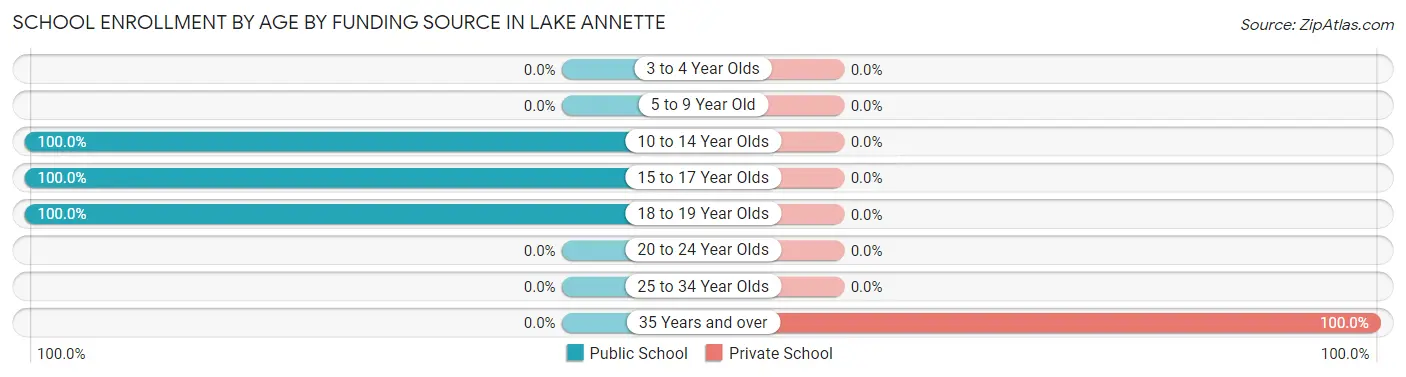
| Age Bracket | Public School | Private School |
| 3 to 4 Year Olds | 0 (0.0%) | 0 (0.0%) |
| 5 to 9 Year Old | 0 (0.0%) | 0 (0.0%) |
| 10 to 14 Year Olds | 6 (100.0%) | 0 (0.0%) |
| 15 to 17 Year Olds | 3 (100.0%) | 0 (0.0%) |
| 18 to 19 Year Olds | 2 (100.0%) | 0 (0.0%) |
| 20 to 24 Year Olds | 0 (0.0%) | 0 (0.0%) |
| 25 to 34 Year Olds | 0 (0.0%) | 0 (0.0%) |
| 35 Years and over | 0 (0.0%) | 2 (100.0%) |
| Total | 11 (84.6%) | 2 (15.4%) |
Educational Attainment by Field of Study in Lake Annette
Bio, nature & agricultural (18 | 85.7%), business (2 | 9.5%), and arts & humanities (1 | 4.8%) are the most common fields of study among 21 individuals in Lake Annette who have obtained a bachelor's degree or higher.
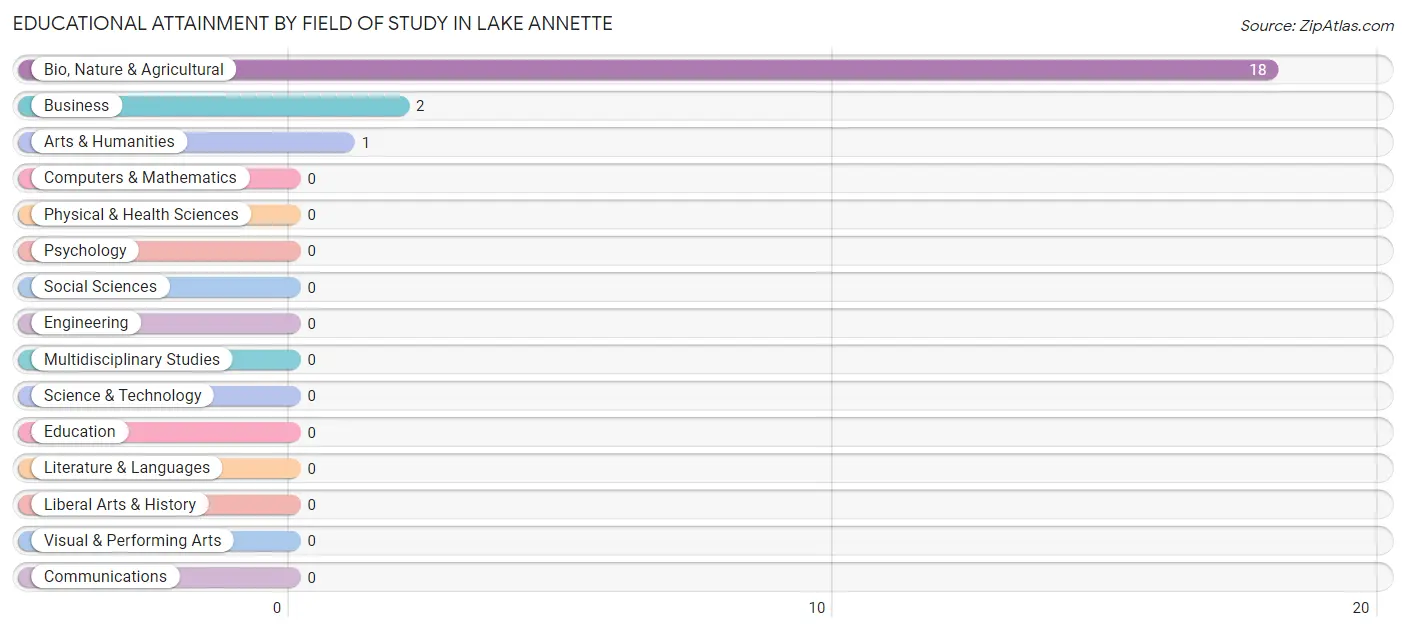
| Field of Study | # Graduates | % Graduates |
| Computers & Mathematics | 0 | 0.0% |
| Bio, Nature & Agricultural | 18 | 85.7% |
| Physical & Health Sciences | 0 | 0.0% |
| Psychology | 0 | 0.0% |
| Social Sciences | 0 | 0.0% |
| Engineering | 0 | 0.0% |
| Multidisciplinary Studies | 0 | 0.0% |
| Science & Technology | 0 | 0.0% |
| Business | 2 | 9.5% |
| Education | 0 | 0.0% |
| Literature & Languages | 0 | 0.0% |
| Liberal Arts & History | 0 | 0.0% |
| Visual & Performing Arts | 0 | 0.0% |
| Communications | 0 | 0.0% |
| Arts & Humanities | 1 | 4.8% |
| Total | 21 | 100.0% |
Transportation & Commute in Lake Annette
Vehicle Availability by Sex in Lake Annette
The most prevalent vehicle ownership categories in Lake Annette are males with 2 vehicles (11, accounting for 52.4%) and females with 2 vehicles (7, making up 57.9%).
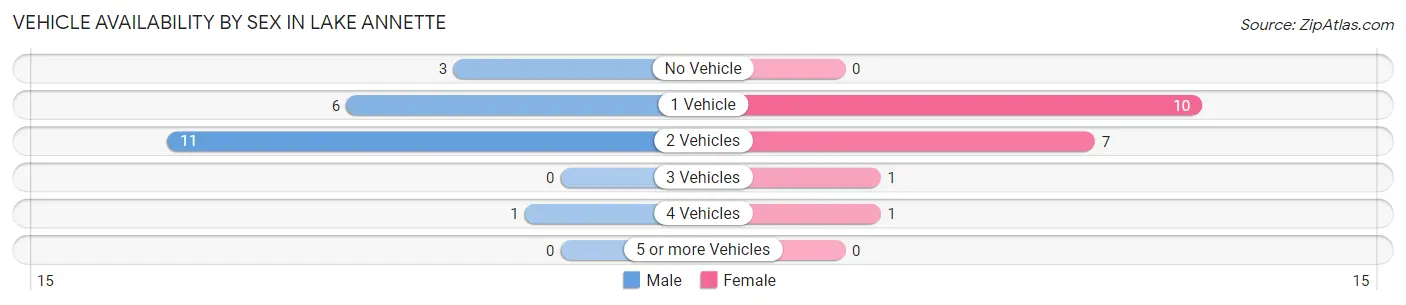
| Vehicles Available | Male | Female |
| No Vehicle | 3 (14.3%) | 0 (0.0%) |
| 1 Vehicle | 6 (28.6%) | 10 (52.6%) |
| 2 Vehicles | 11 (52.4%) | 7 (36.8%) |
| 3 Vehicles | 0 (0.0%) | 1 (5.3%) |
| 4 Vehicles | 1 (4.8%) | 1 (5.3%) |
| 5 or more Vehicles | 0 (0.0%) | 0 (0.0%) |
| Total | 21 (100.0%) | 19 (100.0%) |
Commute Time in Lake Annette
The most frequently occuring commute durations in Lake Annette are 45 to 59 minutes (13 commuters, 33.3%), 60 to 89 minutes (9 commuters, 23.1%), and 20 to 24 minutes (7 commuters, 17.9%).
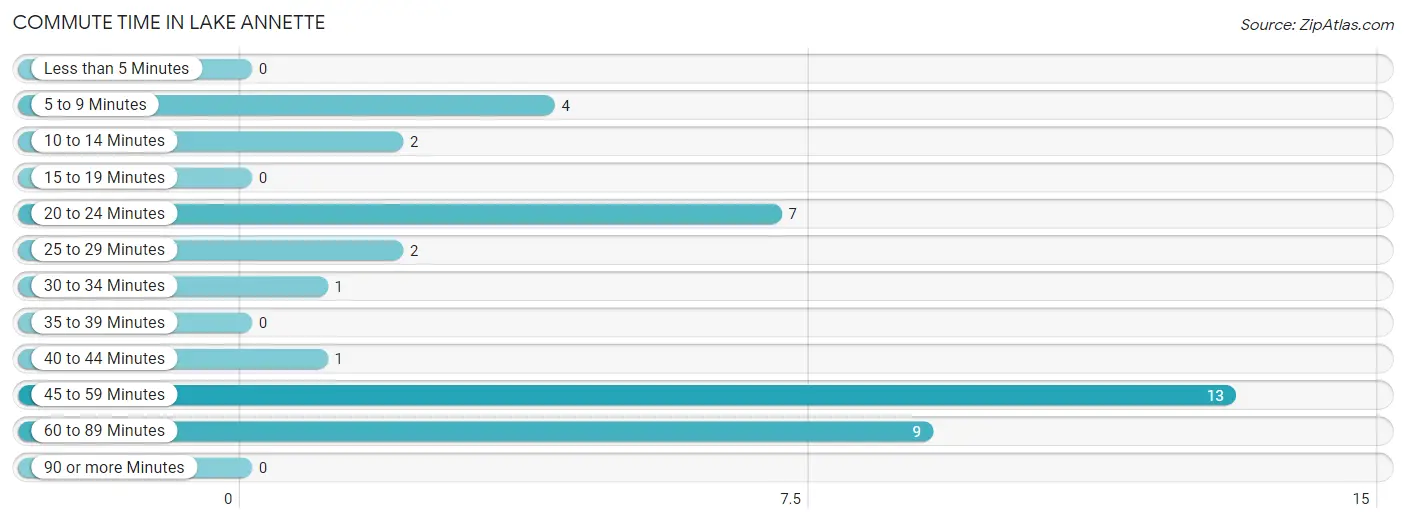
| Commute Time | # Commuters | % Commuters |
| Less than 5 Minutes | 0 | 0.0% |
| 5 to 9 Minutes | 4 | 10.3% |
| 10 to 14 Minutes | 2 | 5.1% |
| 15 to 19 Minutes | 0 | 0.0% |
| 20 to 24 Minutes | 7 | 17.9% |
| 25 to 29 Minutes | 2 | 5.1% |
| 30 to 34 Minutes | 1 | 2.6% |
| 35 to 39 Minutes | 0 | 0.0% |
| 40 to 44 Minutes | 1 | 2.6% |
| 45 to 59 Minutes | 13 | 33.3% |
| 60 to 89 Minutes | 9 | 23.1% |
| 90 or more Minutes | 0 | 0.0% |
Commute Time by Sex in Lake Annette
The most common commute times in Lake Annette are 20 to 24 minutes (7 commuters, 33.3%) for males and 60 to 89 minutes (9 commuters, 50.0%) for females.
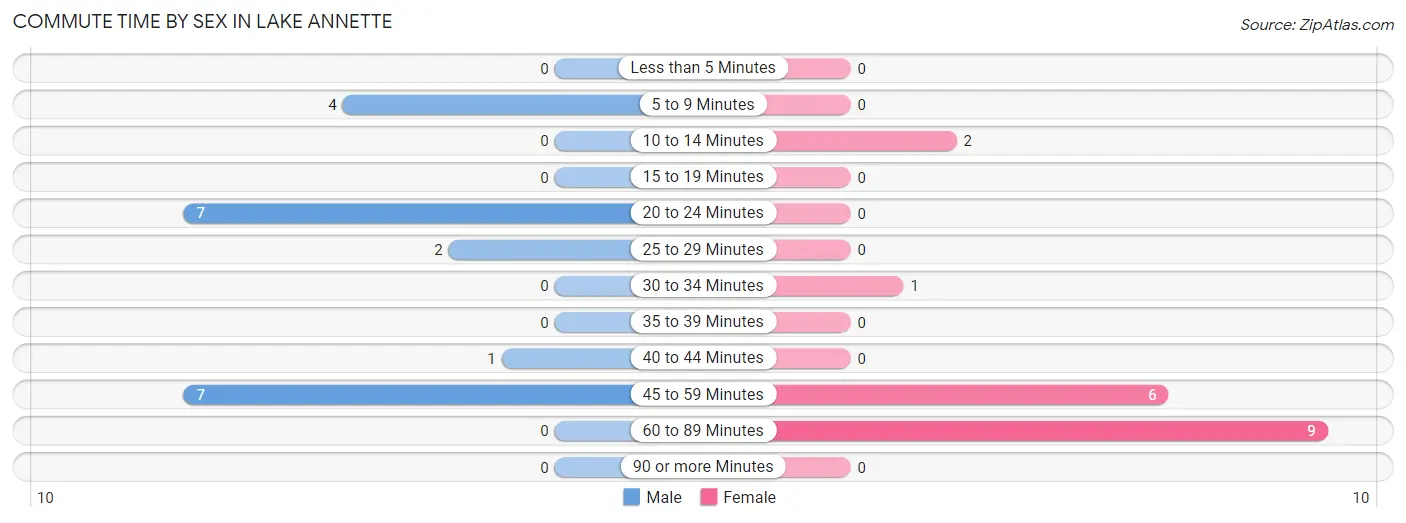
| Commute Time | Male | Female |
| Less than 5 Minutes | 0 (0.0%) | 0 (0.0%) |
| 5 to 9 Minutes | 4 (19.1%) | 0 (0.0%) |
| 10 to 14 Minutes | 0 (0.0%) | 2 (11.1%) |
| 15 to 19 Minutes | 0 (0.0%) | 0 (0.0%) |
| 20 to 24 Minutes | 7 (33.3%) | 0 (0.0%) |
| 25 to 29 Minutes | 2 (9.5%) | 0 (0.0%) |
| 30 to 34 Minutes | 0 (0.0%) | 1 (5.6%) |
| 35 to 39 Minutes | 0 (0.0%) | 0 (0.0%) |
| 40 to 44 Minutes | 1 (4.8%) | 0 (0.0%) |
| 45 to 59 Minutes | 7 (33.3%) | 6 (33.3%) |
| 60 to 89 Minutes | 0 (0.0%) | 9 (50.0%) |
| 90 or more Minutes | 0 (0.0%) | 0 (0.0%) |
Time of Departure to Work by Sex in Lake Annette
The most frequent times of departure to work in Lake Annette are 6:00 AM to 6:29 AM (13, 61.9%) for males and 6:00 AM to 6:29 AM (13, 72.2%) for females.
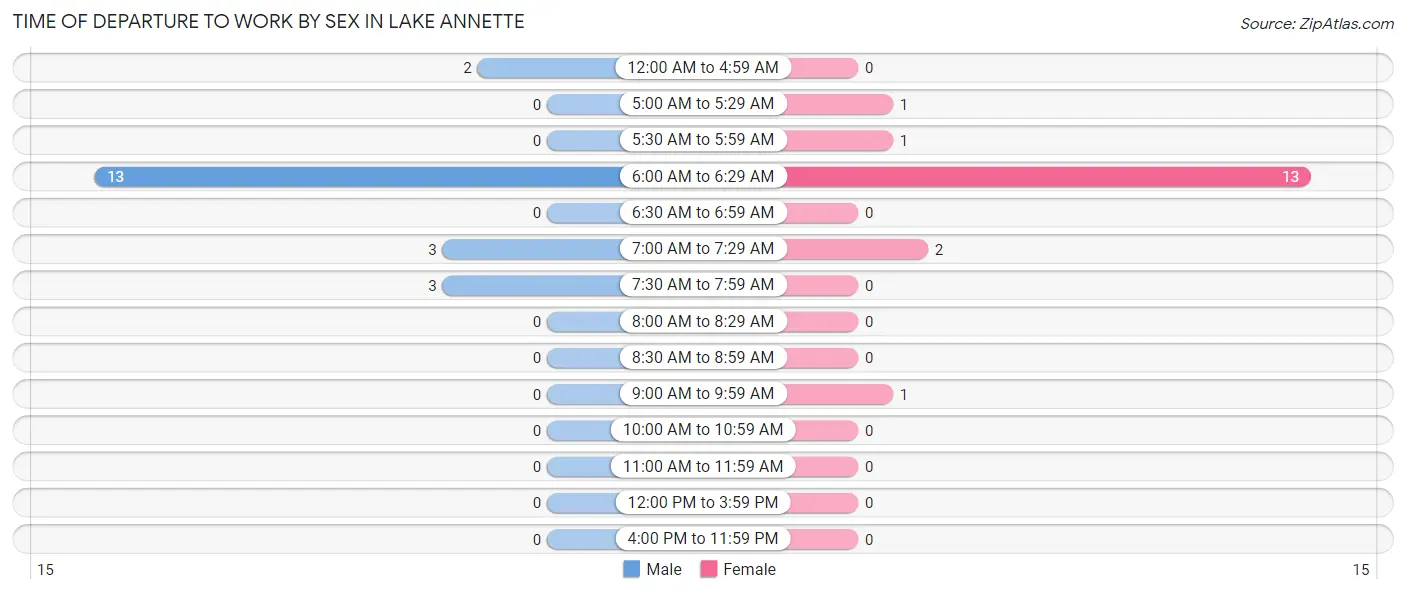
| Time of Departure | Male | Female |
| 12:00 AM to 4:59 AM | 2 (9.5%) | 0 (0.0%) |
| 5:00 AM to 5:29 AM | 0 (0.0%) | 1 (5.6%) |
| 5:30 AM to 5:59 AM | 0 (0.0%) | 1 (5.6%) |
| 6:00 AM to 6:29 AM | 13 (61.9%) | 13 (72.2%) |
| 6:30 AM to 6:59 AM | 0 (0.0%) | 0 (0.0%) |
| 7:00 AM to 7:29 AM | 3 (14.3%) | 2 (11.1%) |
| 7:30 AM to 7:59 AM | 3 (14.3%) | 0 (0.0%) |
| 8:00 AM to 8:29 AM | 0 (0.0%) | 0 (0.0%) |
| 8:30 AM to 8:59 AM | 0 (0.0%) | 0 (0.0%) |
| 9:00 AM to 9:59 AM | 0 (0.0%) | 1 (5.6%) |
| 10:00 AM to 10:59 AM | 0 (0.0%) | 0 (0.0%) |
| 11:00 AM to 11:59 AM | 0 (0.0%) | 0 (0.0%) |
| 12:00 PM to 3:59 PM | 0 (0.0%) | 0 (0.0%) |
| 4:00 PM to 11:59 PM | 0 (0.0%) | 0 (0.0%) |
| Total | 21 (100.0%) | 18 (100.0%) |
Housing Occupancy in Lake Annette
Occupancy by Ownership in Lake Annette
Of the total 53 dwellings in Lake Annette, owner-occupied units account for 46 (86.8%), while renter-occupied units make up 7 (13.2%).
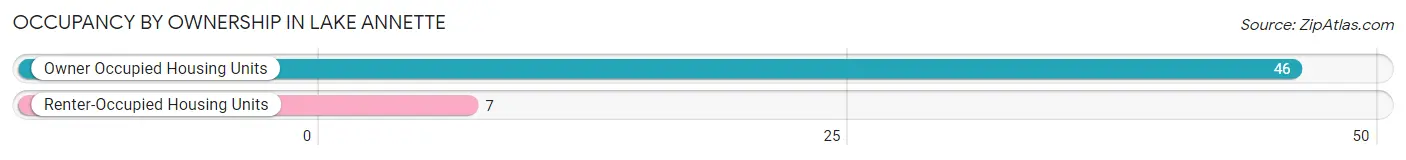
| Occupancy | # Housing Units | % Housing Units |
| Owner Occupied Housing Units | 46 | 86.8% |
| Renter-Occupied Housing Units | 7 | 13.2% |
| Total Occupied Housing Units | 53 | 100.0% |
Occupancy by Household Size in Lake Annette
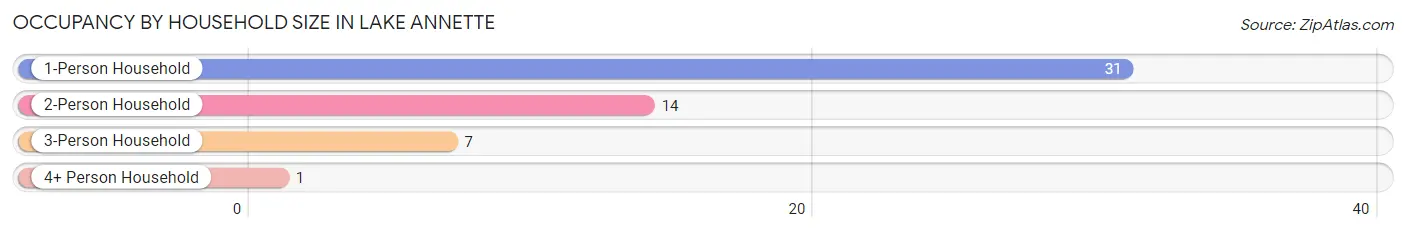
| Household Size | # Housing Units | % Housing Units |
| 1-Person Household | 31 | 58.5% |
| 2-Person Household | 14 | 26.4% |
| 3-Person Household | 7 | 13.2% |
| 4+ Person Household | 1 | 1.9% |
| Total Housing Units | 53 | 100.0% |
Occupancy by Ownership by Household Size in Lake Annette
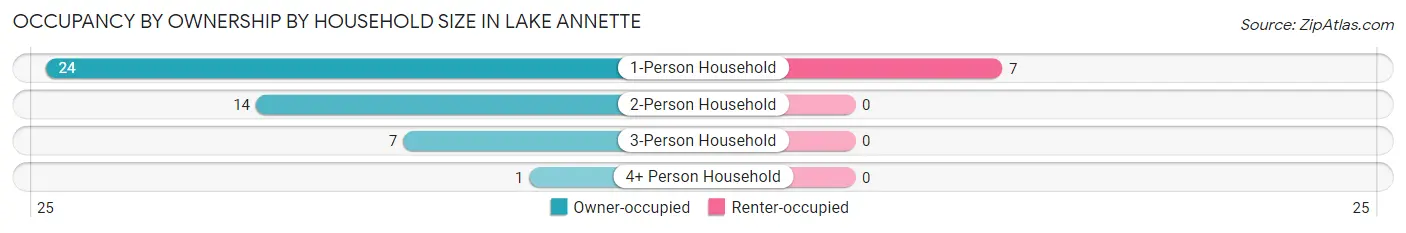
| Household Size | Owner-occupied | Renter-occupied |
| 1-Person Household | 24 (77.4%) | 7 (22.6%) |
| 2-Person Household | 14 (100.0%) | 0 (0.0%) |
| 3-Person Household | 7 (100.0%) | 0 (0.0%) |
| 4+ Person Household | 1 (100.0%) | 0 (0.0%) |
| Total Housing Units | 46 (86.8%) | 7 (13.2%) |
Occupancy by Educational Attainment in Lake Annette
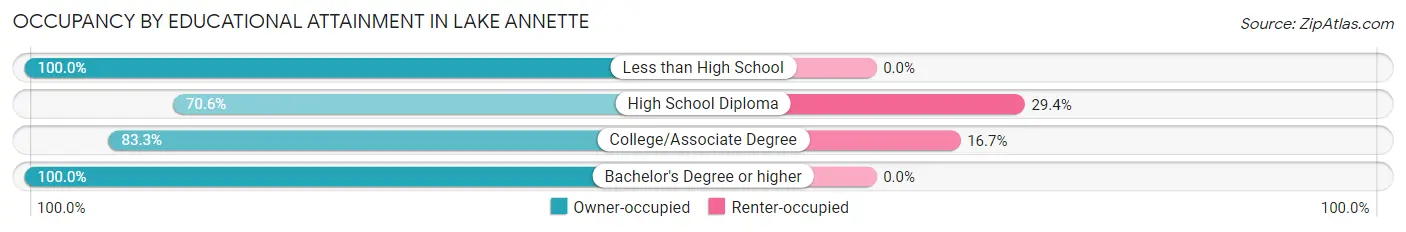
| Household Size | Owner-occupied | Renter-occupied |
| Less than High School | 3 (100.0%) | 0 (0.0%) |
| High School Diploma | 12 (70.6%) | 5 (29.4%) |
| College/Associate Degree | 10 (83.3%) | 2 (16.7%) |
| Bachelor's Degree or higher | 21 (100.0%) | 0 (0.0%) |
Occupancy by Age of Householder in Lake Annette
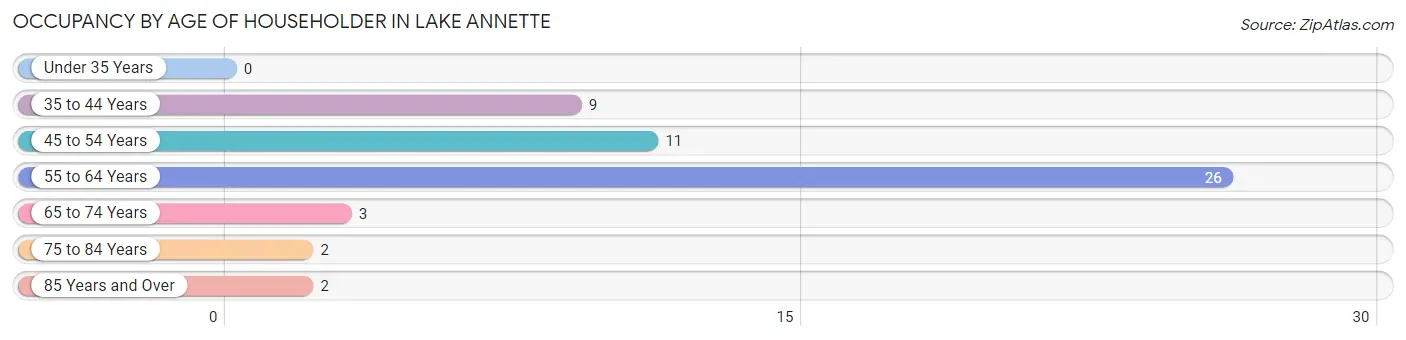
| Age Bracket | # Households | % Households |
| Under 35 Years | 0 | 0.0% |
| 35 to 44 Years | 9 | 17.0% |
| 45 to 54 Years | 11 | 20.7% |
| 55 to 64 Years | 26 | 49.1% |
| 65 to 74 Years | 3 | 5.7% |
| 75 to 84 Years | 2 | 3.8% |
| 85 Years and Over | 2 | 3.8% |
| Total | 53 | 100.0% |
Housing Finances in Lake Annette
Median Income by Occupancy in Lake Annette
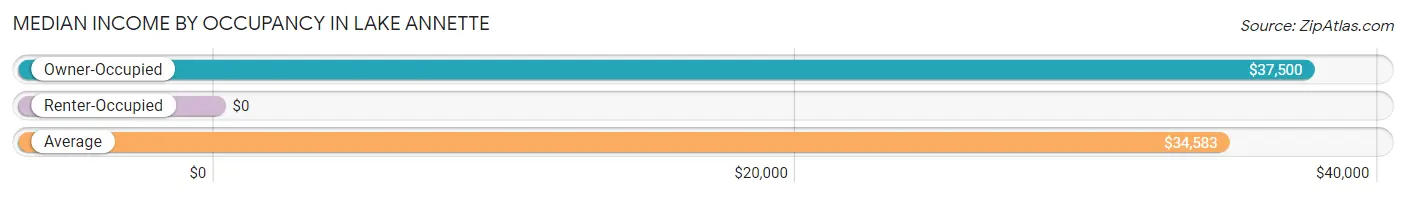
| Occupancy Type | # Households | Median Income |
| Owner-Occupied | 46 (86.8%) | $37,500 |
| Renter-Occupied | 7 (13.2%) | $0 |
| Average | 53 (100.0%) | $34,583 |
Occupancy by Householder Income Bracket in Lake Annette
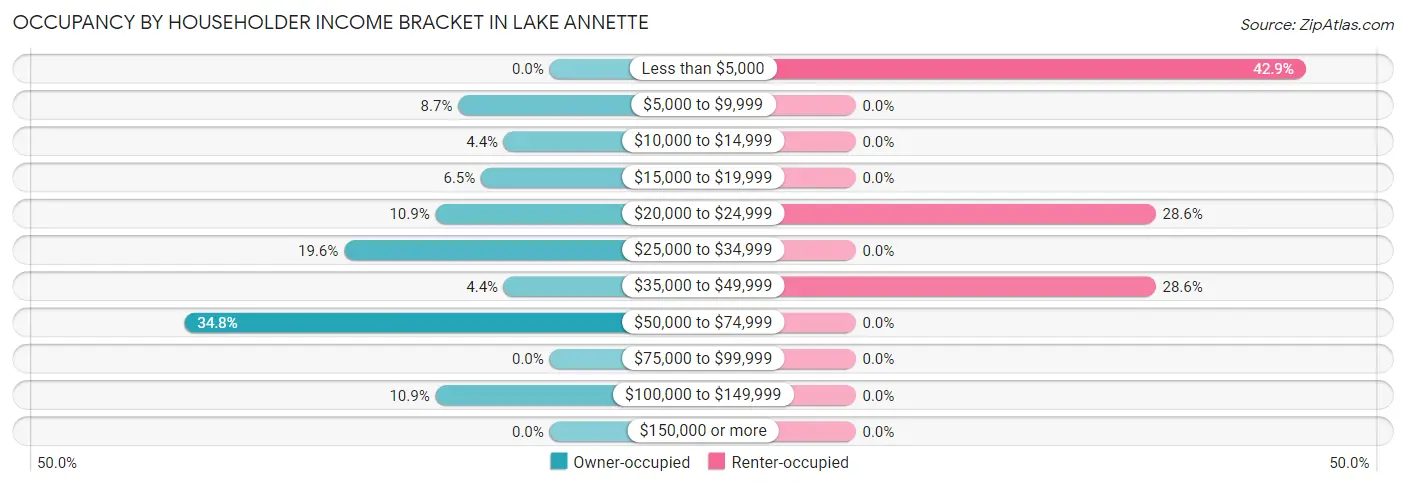
| Income Bracket | Owner-occupied | Renter-occupied |
| Less than $5,000 | 0 (0.0%) | 3 (42.9%) |
| $5,000 to $9,999 | 4 (8.7%) | 0 (0.0%) |
| $10,000 to $14,999 | 2 (4.3%) | 0 (0.0%) |
| $15,000 to $19,999 | 3 (6.5%) | 0 (0.0%) |
| $20,000 to $24,999 | 5 (10.9%) | 2 (28.6%) |
| $25,000 to $34,999 | 9 (19.6%) | 0 (0.0%) |
| $35,000 to $49,999 | 2 (4.3%) | 2 (28.6%) |
| $50,000 to $74,999 | 16 (34.8%) | 0 (0.0%) |
| $75,000 to $99,999 | 0 (0.0%) | 0 (0.0%) |
| $100,000 to $149,999 | 5 (10.9%) | 0 (0.0%) |
| $150,000 or more | 0 (0.0%) | 0 (0.0%) |
| Total | 46 (100.0%) | 7 (100.0%) |
Monthly Housing Cost Tiers in Lake Annette
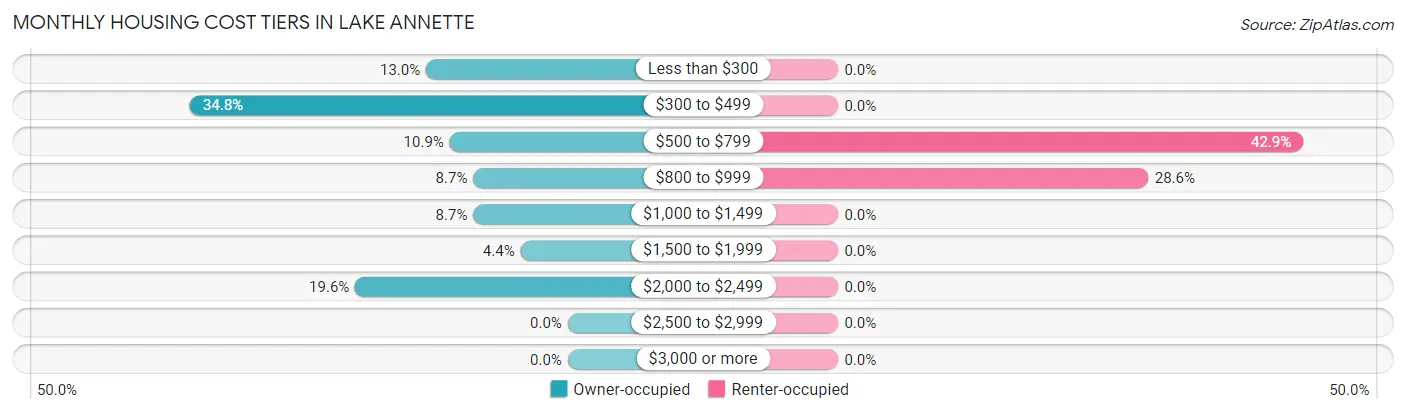
| Monthly Cost | Owner-occupied | Renter-occupied |
| Less than $300 | 6 (13.0%) | 0 (0.0%) |
| $300 to $499 | 16 (34.8%) | 0 (0.0%) |
| $500 to $799 | 5 (10.9%) | 3 (42.9%) |
| $800 to $999 | 4 (8.7%) | 2 (28.6%) |
| $1,000 to $1,499 | 4 (8.7%) | 0 (0.0%) |
| $1,500 to $1,999 | 2 (4.3%) | 0 (0.0%) |
| $2,000 to $2,499 | 9 (19.6%) | 0 (0.0%) |
| $2,500 to $2,999 | 0 (0.0%) | 0 (0.0%) |
| $3,000 or more | 0 (0.0%) | 0 (0.0%) |
| Total | 46 (100.0%) | 7 (100.0%) |
Physical Housing Characteristics in Lake Annette
Housing Structures in Lake Annette
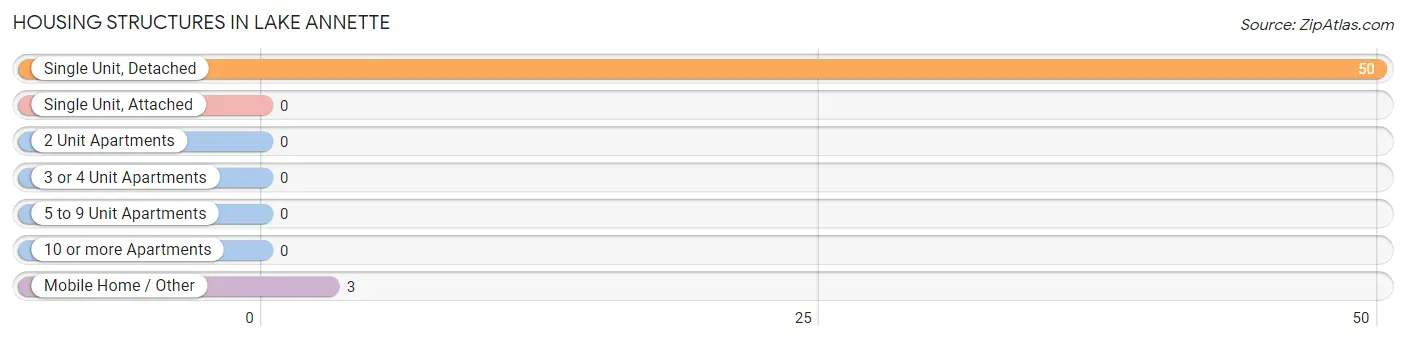
| Structure Type | # Housing Units | % Housing Units |
| Single Unit, Detached | 50 | 94.3% |
| Single Unit, Attached | 0 | 0.0% |
| 2 Unit Apartments | 0 | 0.0% |
| 3 or 4 Unit Apartments | 0 | 0.0% |
| 5 to 9 Unit Apartments | 0 | 0.0% |
| 10 or more Apartments | 0 | 0.0% |
| Mobile Home / Other | 3 | 5.7% |
| Total | 53 | 100.0% |
Housing Structures by Occupancy in Lake Annette
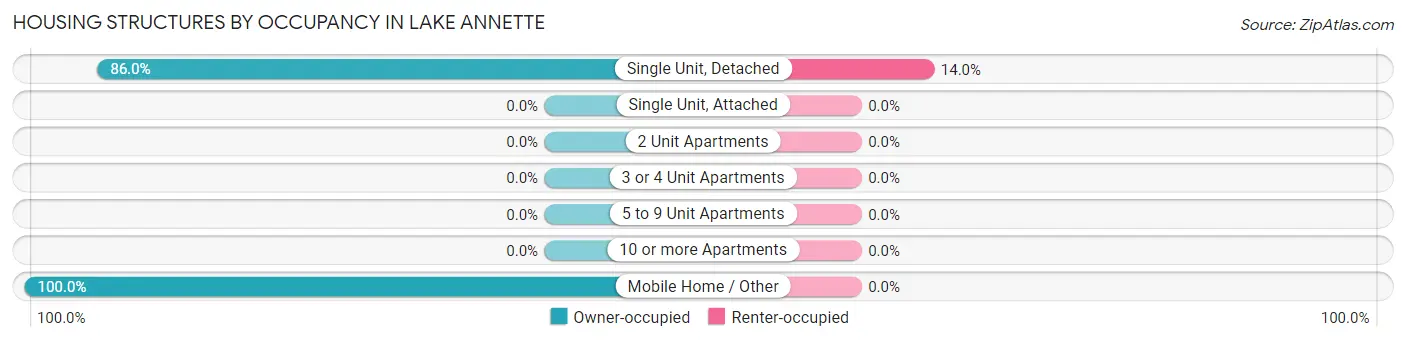
| Structure Type | Owner-occupied | Renter-occupied |
| Single Unit, Detached | 43 (86.0%) | 7 (14.0%) |
| Single Unit, Attached | 0 (0.0%) | 0 (0.0%) |
| 2 Unit Apartments | 0 (0.0%) | 0 (0.0%) |
| 3 or 4 Unit Apartments | 0 (0.0%) | 0 (0.0%) |
| 5 to 9 Unit Apartments | 0 (0.0%) | 0 (0.0%) |
| 10 or more Apartments | 0 (0.0%) | 0 (0.0%) |
| Mobile Home / Other | 3 (100.0%) | 0 (0.0%) |
| Total | 46 (86.8%) | 7 (13.2%) |
Housing Structures by Number of Rooms in Lake Annette
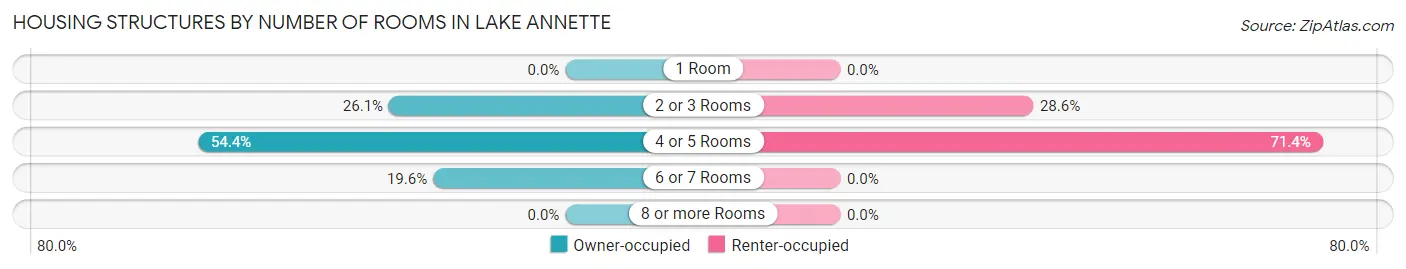
| Number of Rooms | Owner-occupied | Renter-occupied |
| 1 Room | 0 (0.0%) | 0 (0.0%) |
| 2 or 3 Rooms | 12 (26.1%) | 2 (28.6%) |
| 4 or 5 Rooms | 25 (54.3%) | 5 (71.4%) |
| 6 or 7 Rooms | 9 (19.6%) | 0 (0.0%) |
| 8 or more Rooms | 0 (0.0%) | 0 (0.0%) |
| Total | 46 (100.0%) | 7 (100.0%) |
Housing Structure by Heating Type in Lake Annette
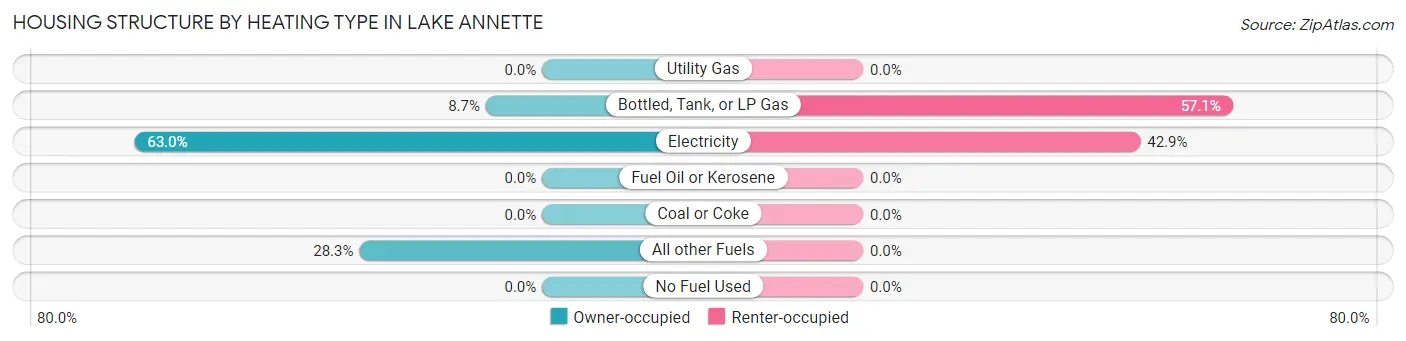
| Heating Type | Owner-occupied | Renter-occupied |
| Utility Gas | 0 (0.0%) | 0 (0.0%) |
| Bottled, Tank, or LP Gas | 4 (8.7%) | 4 (57.1%) |
| Electricity | 29 (63.0%) | 3 (42.9%) |
| Fuel Oil or Kerosene | 0 (0.0%) | 0 (0.0%) |
| Coal or Coke | 0 (0.0%) | 0 (0.0%) |
| All other Fuels | 13 (28.3%) | 0 (0.0%) |
| No Fuel Used | 0 (0.0%) | 0 (0.0%) |
| Total | 46 (100.0%) | 7 (100.0%) |
Household Vehicle Usage in Lake Annette
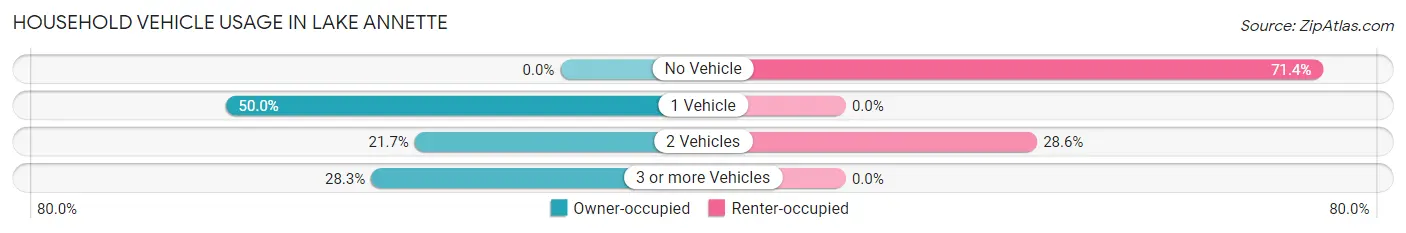
| Vehicles per Household | Owner-occupied | Renter-occupied |
| No Vehicle | 0 (0.0%) | 5 (71.4%) |
| 1 Vehicle | 23 (50.0%) | 0 (0.0%) |
| 2 Vehicles | 10 (21.7%) | 2 (28.6%) |
| 3 or more Vehicles | 13 (28.3%) | 0 (0.0%) |
| Total | 46 (100.0%) | 7 (100.0%) |
Real Estate & Mortgages in Lake Annette
Real Estate and Mortgage Overview in Lake Annette
| Characteristic | Without Mortgage | With Mortgage |
| Housing Units | 26 | 20 |
| Median Property Value | $129,500 | $0 |
| Median Household Income | - | - |
| Monthly Housing Costs | $410 | $0 |
| Real Estate Taxes | $529 | $0 |
Property Value by Mortgage Status in Lake Annette
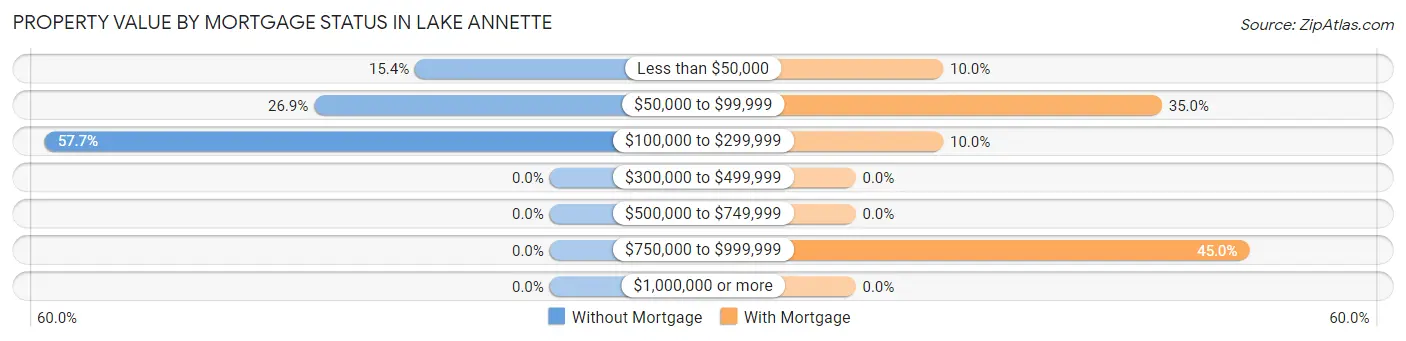
| Property Value | Without Mortgage | With Mortgage |
| Less than $50,000 | 4 (15.4%) | 2 (10.0%) |
| $50,000 to $99,999 | 7 (26.9%) | 7 (35.0%) |
| $100,000 to $299,999 | 15 (57.7%) | 2 (10.0%) |
| $300,000 to $499,999 | 0 (0.0%) | 0 (0.0%) |
| $500,000 to $749,999 | 0 (0.0%) | 0 (0.0%) |
| $750,000 to $999,999 | 0 (0.0%) | 9 (45.0%) |
| $1,000,000 or more | 0 (0.0%) | 0 (0.0%) |
| Total | 26 (100.0%) | 20 (100.0%) |
Household Income by Mortgage Status in Lake Annette
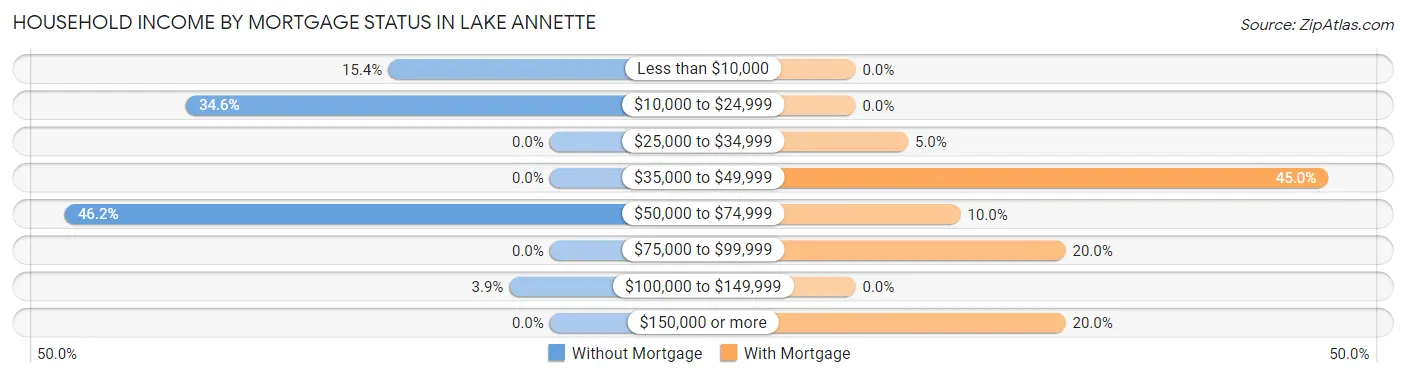
| Household Income | Without Mortgage | With Mortgage |
| Less than $10,000 | 4 (15.4%) | 0 (0.0%) |
| $10,000 to $24,999 | 9 (34.6%) | 0 (0.0%) |
| $25,000 to $34,999 | 0 (0.0%) | 1 (5.0%) |
| $35,000 to $49,999 | 0 (0.0%) | 9 (45.0%) |
| $50,000 to $74,999 | 12 (46.2%) | 2 (10.0%) |
| $75,000 to $99,999 | 0 (0.0%) | 4 (20.0%) |
| $100,000 to $149,999 | 1 (3.8%) | 0 (0.0%) |
| $150,000 or more | 0 (0.0%) | 4 (20.0%) |
| Total | 26 (100.0%) | 20 (100.0%) |
Property Value to Household Income Ratio in Lake Annette
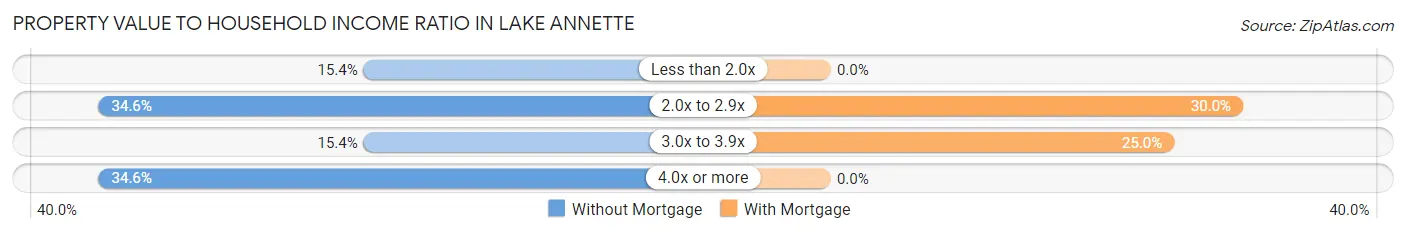
| Value-to-Income Ratio | Without Mortgage | With Mortgage |
| Less than 2.0x | 4 (15.4%) | 0 (0.0%) |
| 2.0x to 2.9x | 9 (34.6%) | 6 (30.0%) |
| 3.0x to 3.9x | 4 (15.4%) | 5 (25.0%) |
| 4.0x or more | 9 (34.6%) | 0 (0.0%) |
| Total | 26 (100.0%) | 20 (100.0%) |
Real Estate Taxes by Mortgage Status in Lake Annette
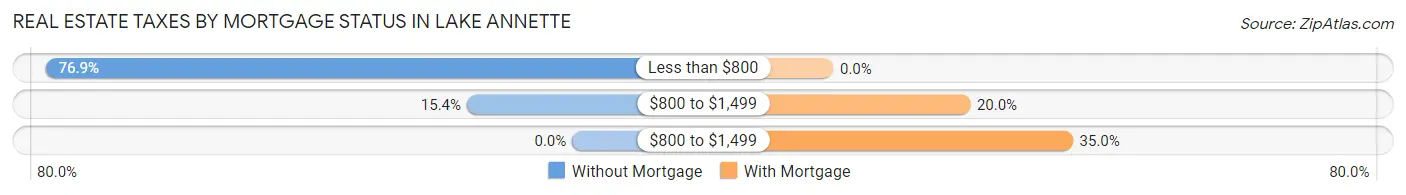
| Property Taxes | Without Mortgage | With Mortgage |
| Less than $800 | 20 (76.9%) | 0 (0.0%) |
| $800 to $1,499 | 4 (15.4%) | 4 (20.0%) |
| $800 to $1,499 | 0 (0.0%) | 7 (35.0%) |
| Total | 26 (100.0%) | 20 (100.0%) |
Health & Disability in Lake Annette
Health Insurance Coverage by Age in Lake Annette
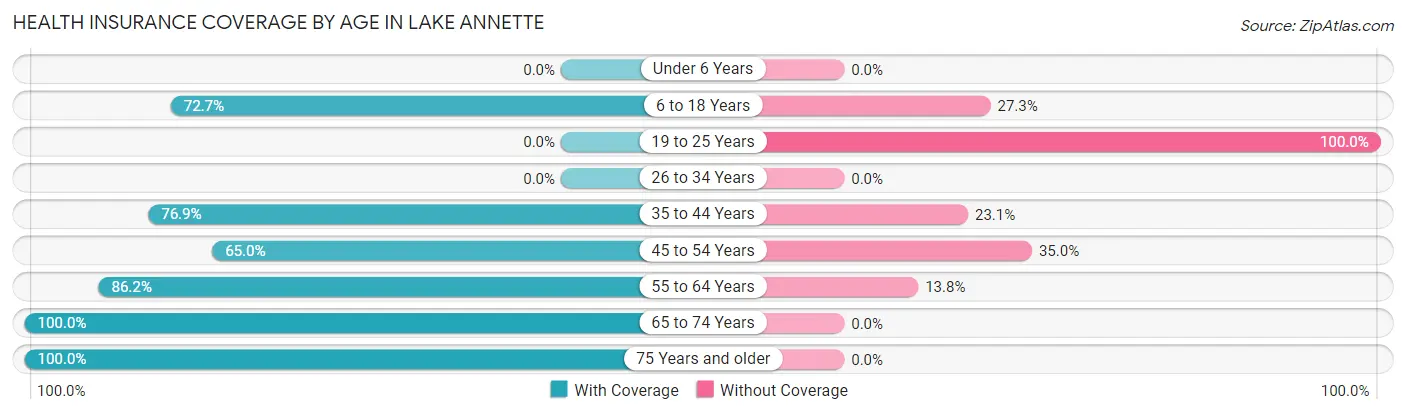
| Age Bracket | With Coverage | Without Coverage |
| Under 6 Years | 0 (0.0%) | 0 (0.0%) |
| 6 to 18 Years | 8 (72.7%) | 3 (27.3%) |
| 19 to 25 Years | 0 (0.0%) | 8 (100.0%) |
| 26 to 34 Years | 0 (0.0%) | 0 (0.0%) |
| 35 to 44 Years | 10 (76.9%) | 3 (23.1%) |
| 45 to 54 Years | 13 (65.0%) | 7 (35.0%) |
| 55 to 64 Years | 25 (86.2%) | 4 (13.8%) |
| 65 to 74 Years | 3 (100.0%) | 0 (0.0%) |
| 75 Years and older | 4 (100.0%) | 0 (0.0%) |
| Total | 63 (71.6%) | 25 (28.4%) |
Health Insurance Coverage by Citizenship Status in Lake Annette
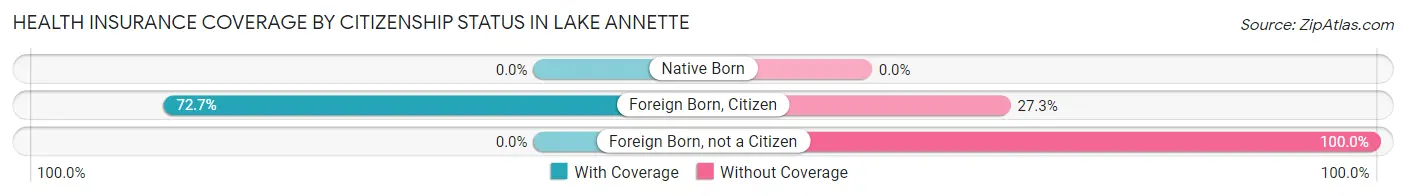
| Citizenship Status | With Coverage | Without Coverage |
| Native Born | 0 (0.0%) | 0 (0.0%) |
| Foreign Born, Citizen | 8 (72.7%) | 3 (27.3%) |
| Foreign Born, not a Citizen | 0 (0.0%) | 8 (100.0%) |
Health Insurance Coverage by Household Income in Lake Annette
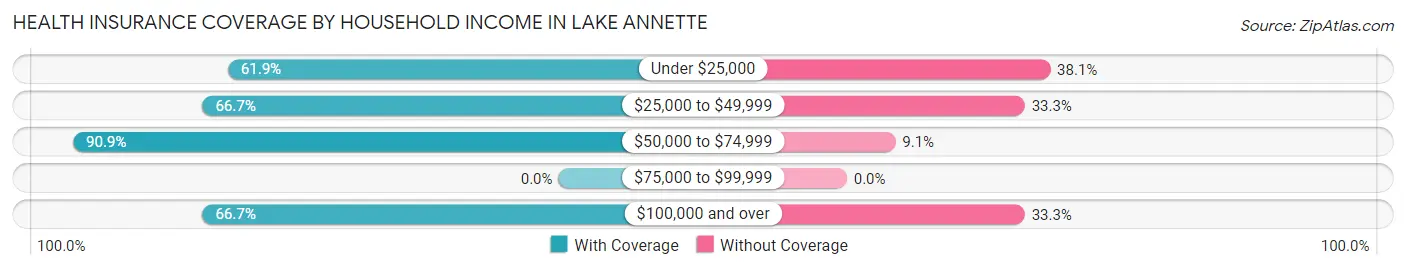
| Household Income | With Coverage | Without Coverage |
| Under $25,000 | 13 (61.9%) | 8 (38.1%) |
| $25,000 to $49,999 | 14 (66.7%) | 7 (33.3%) |
| $50,000 to $74,999 | 20 (90.9%) | 2 (9.1%) |
| $75,000 to $99,999 | 0 (0.0%) | 0 (0.0%) |
| $100,000 and over | 16 (66.7%) | 8 (33.3%) |
Public vs Private Health Insurance Coverage by Age in Lake Annette
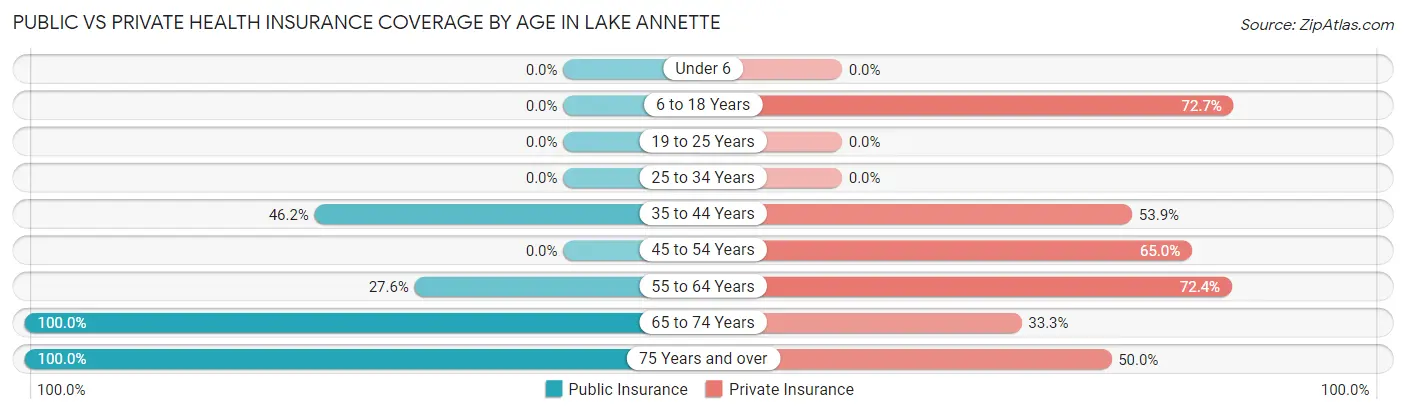
| Age Bracket | Public Insurance | Private Insurance |
| Under 6 | 0 (0.0%) | 0 (0.0%) |
| 6 to 18 Years | 0 (0.0%) | 8 (72.7%) |
| 19 to 25 Years | 0 (0.0%) | 0 (0.0%) |
| 25 to 34 Years | 0 (0.0%) | 0 (0.0%) |
| 35 to 44 Years | 6 (46.2%) | 7 (53.8%) |
| 45 to 54 Years | 0 (0.0%) | 13 (65.0%) |
| 55 to 64 Years | 8 (27.6%) | 21 (72.4%) |
| 65 to 74 Years | 3 (100.0%) | 1 (33.3%) |
| 75 Years and over | 4 (100.0%) | 2 (50.0%) |
| Total | 21 (23.9%) | 52 (59.1%) |
Disability Status by Sex by Age in Lake Annette
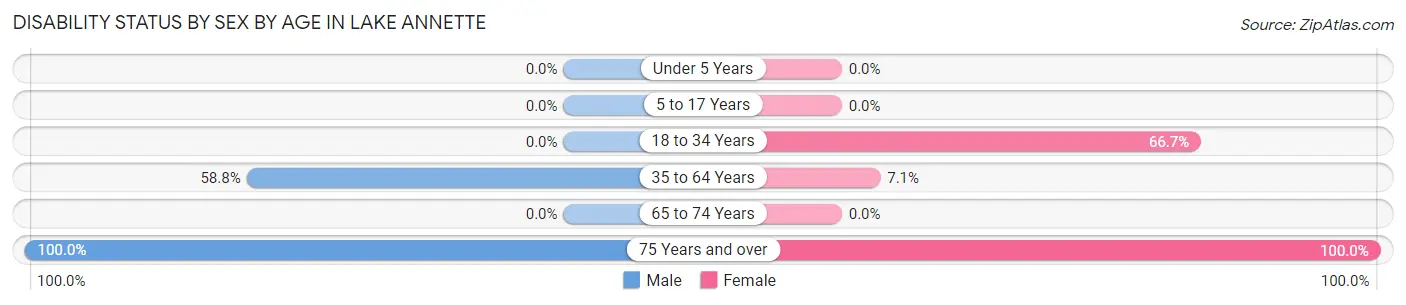
| Age Bracket | Male | Female |
| Under 5 Years | 0 (0.0%) | 0 (0.0%) |
| 5 to 17 Years | 0 (0.0%) | 0 (0.0%) |
| 18 to 34 Years | 0 (0.0%) | 4 (66.7%) |
| 35 to 64 Years | 20 (58.8%) | 2 (7.1%) |
| 65 to 74 Years | 0 (0.0%) | 0 (0.0%) |
| 75 Years and over | 2 (100.0%) | 2 (100.0%) |
Disability Class by Sex by Age in Lake Annette
Disability Class: Hearing Difficulty
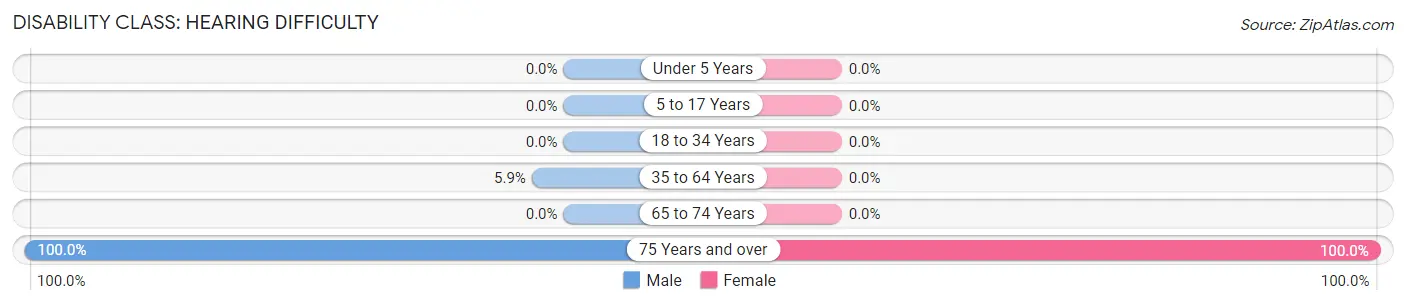
| Age Bracket | Male | Female |
| Under 5 Years | 0 (0.0%) | 0 (0.0%) |
| 5 to 17 Years | 0 (0.0%) | 0 (0.0%) |
| 18 to 34 Years | 0 (0.0%) | 0 (0.0%) |
| 35 to 64 Years | 2 (5.9%) | 0 (0.0%) |
| 65 to 74 Years | 0 (0.0%) | 0 (0.0%) |
| 75 Years and over | 2 (100.0%) | 2 (100.0%) |
Disability Class: Vision Difficulty
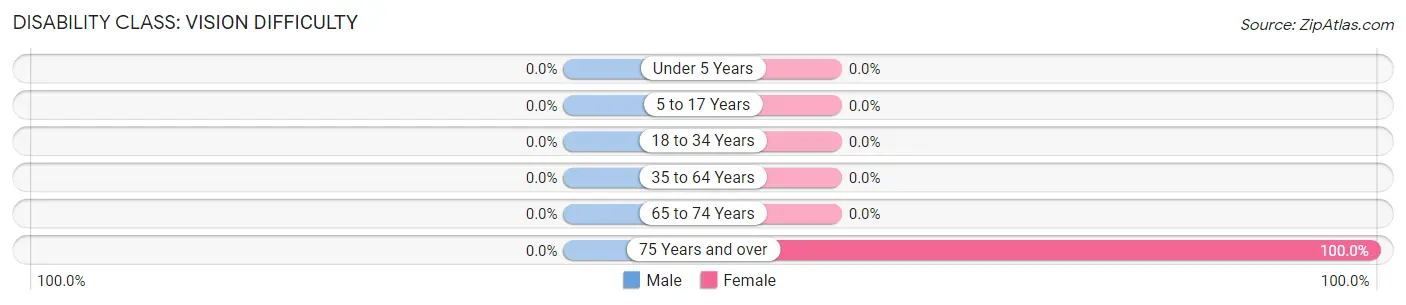
| Age Bracket | Male | Female |
| Under 5 Years | 0 (0.0%) | 0 (0.0%) |
| 5 to 17 Years | 0 (0.0%) | 0 (0.0%) |
| 18 to 34 Years | 0 (0.0%) | 0 (0.0%) |
| 35 to 64 Years | 0 (0.0%) | 0 (0.0%) |
| 65 to 74 Years | 0 (0.0%) | 0 (0.0%) |
| 75 Years and over | 0 (0.0%) | 2 (100.0%) |
Disability Class: Cognitive Difficulty
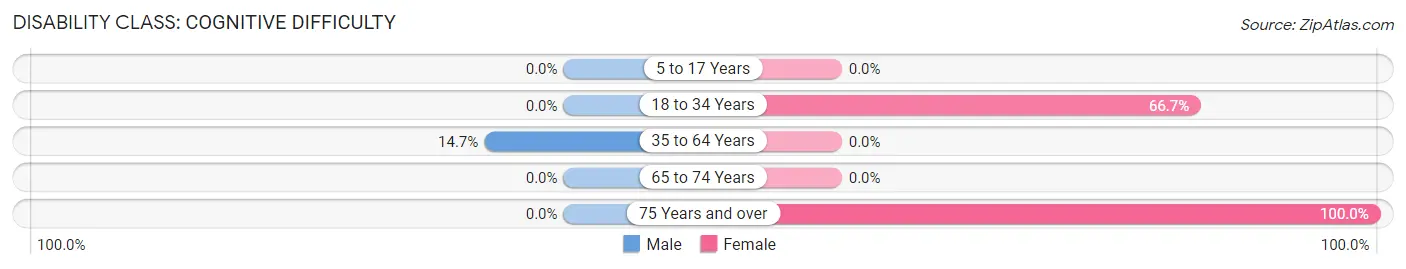
| Age Bracket | Male | Female |
| 5 to 17 Years | 0 (0.0%) | 0 (0.0%) |
| 18 to 34 Years | 0 (0.0%) | 4 (66.7%) |
| 35 to 64 Years | 5 (14.7%) | 0 (0.0%) |
| 65 to 74 Years | 0 (0.0%) | 0 (0.0%) |
| 75 Years and over | 0 (0.0%) | 2 (100.0%) |
Disability Class: Ambulatory Difficulty
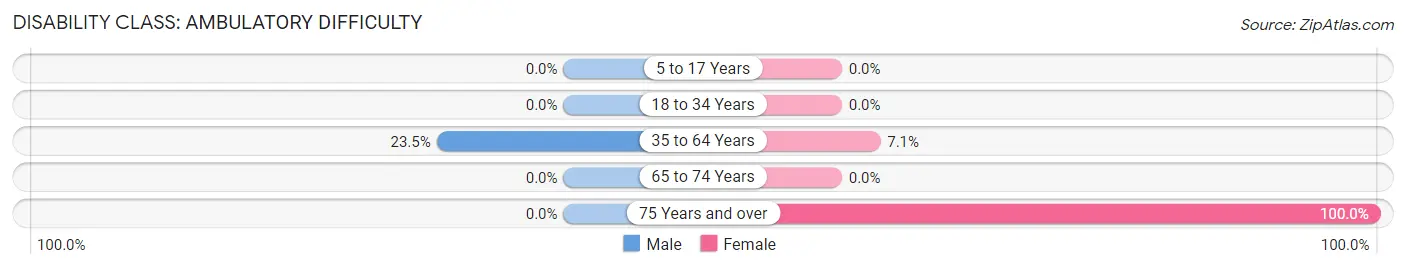
| Age Bracket | Male | Female |
| 5 to 17 Years | 0 (0.0%) | 0 (0.0%) |
| 18 to 34 Years | 0 (0.0%) | 0 (0.0%) |
| 35 to 64 Years | 8 (23.5%) | 2 (7.1%) |
| 65 to 74 Years | 0 (0.0%) | 0 (0.0%) |
| 75 Years and over | 0 (0.0%) | 2 (100.0%) |
Disability Class: Self-Care Difficulty
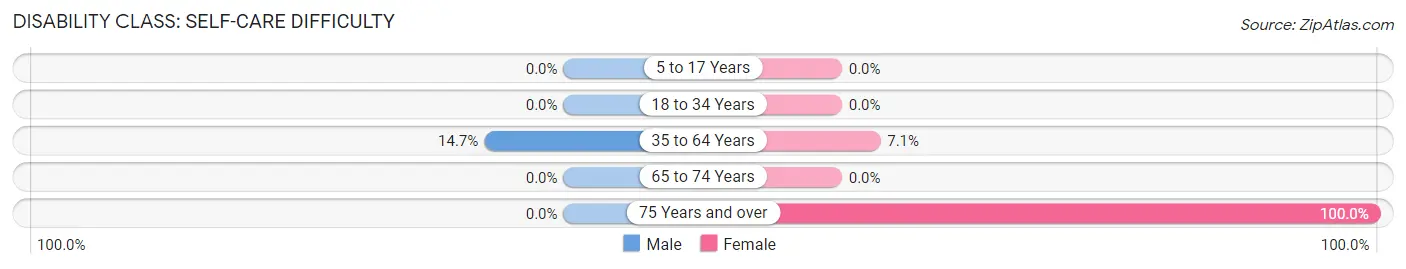
| Age Bracket | Male | Female |
| 5 to 17 Years | 0 (0.0%) | 0 (0.0%) |
| 18 to 34 Years | 0 (0.0%) | 0 (0.0%) |
| 35 to 64 Years | 5 (14.7%) | 2 (7.1%) |
| 65 to 74 Years | 0 (0.0%) | 0 (0.0%) |
| 75 Years and over | 0 (0.0%) | 2 (100.0%) |
Technology Access in Lake Annette
Computing Device Access in Lake Annette
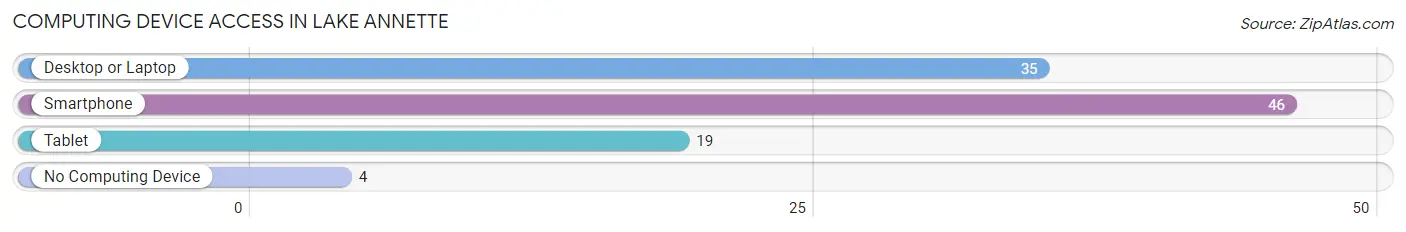
| Device Type | # Households | % Households |
| Desktop or Laptop | 35 | 66.0% |
| Smartphone | 46 | 86.8% |
| Tablet | 19 | 35.8% |
| No Computing Device | 4 | 7.5% |
| Total | 53 | 100.0% |
Internet Access in Lake Annette
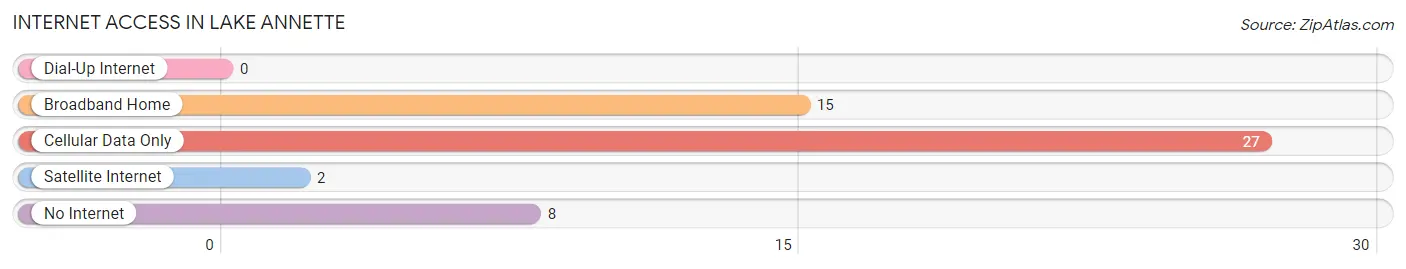
| Internet Type | # Households | % Households |
| Dial-Up Internet | 0 | 0.0% |
| Broadband Home | 15 | 28.3% |
| Cellular Data Only | 27 | 50.9% |
| Satellite Internet | 2 | 3.8% |
| No Internet | 8 | 15.1% |
| Total | 53 | 100.0% |
Lake Annette Summary
Lake Annette is a small unincorporated community located in the Ozark Mountains of Missouri. It is situated in the southeastern corner of the state, near the Arkansas border. The community is located in Stone County, and is part of the Branson, Missouri Metropolitan Statistical Area.
History
The area around Lake Annette was first settled in the early 1800s by settlers from the Ozark Mountains. The first settlers were mostly farmers and loggers, and the area was known for its abundance of timber. In the late 1800s, the area was developed as a resort destination, and the lake was named after Annette, the daughter of one of the first settlers.
The area around Lake Annette was also home to a number of Native American tribes, including the Osage, Quapaw, and Cherokee. The area was also home to a number of Civil War battles, including the Battle of Pea Ridge in 1862.
Geography
Lake Annette is located in the Ozark Mountains of Missouri, in the southeastern corner of the state. The community is situated in Stone County, and is part of the Branson, Missouri Metropolitan Statistical Area. The area is characterized by rolling hills, dense forests, and numerous lakes and streams. The lake itself is a man-made reservoir, created in the early 1900s to provide water for the area.
The climate in the area is humid subtropical, with hot, humid summers and mild winters. The average annual temperature is around 60 degrees Fahrenheit, and the average annual precipitation is around 40 inches.
Economy
The economy of Lake Annette is largely based on tourism. The area is home to a number of resorts, campgrounds, and other recreational facilities. The area is also home to a number of wineries, and is a popular destination for wine tasting.
The area is also home to a number of small businesses, including restaurants, retail stores, and other services. The area is also home to a number of manufacturing and industrial businesses, including a paper mill and a furniture factory.
Demographics
As of the 2010 census, the population of Lake Annette was 1,845. The racial makeup of the community was 97.3% White, 0.7% African American, 0.3% Native American, 0.2% Asian, and 1.5% from other races. The median household income was $37,917, and the median family income was $45,938.
The population of Lake Annette is largely rural, with most of the population living in small towns and rural areas. The area is also home to a number of retirees, as well as a number of seasonal residents. The area is also home to a number of churches, and is a popular destination for religious retreats and conferences.
Common Questions
What is Per Capita Income in Lake Annette?
Per Capita income in Lake Annette is $24,788.
What is the Median Household income in Lake Annette?
Median Household Income in Lake Annette is $34,583.
What is Income or Wage Gap in Lake Annette?
Income or Wage Gap in Lake Annette is 73.9%.
Women in Lake Annette earn 26.1 cents for every dollar earned by a man.
What is Inequality or Gini Index in Lake Annette?
Inequality or Gini Index in Lake Annette is 0.38.
What is the Total Population of Lake Annette?
Total Population of Lake Annette is 88.
What is the Total Male Population of Lake Annette?
Total Male Population of Lake Annette is 52.
What is the Total Female Population of Lake Annette?
Total Female Population of Lake Annette is 36.
What is the Ratio of Males per 100 Females in Lake Annette?
There are 144.44 Males per 100 Females in Lake Annette.
What is the Ratio of Females per 100 Males in Lake Annette?
There are 69.23 Females per 100 Males in Lake Annette.
What is the Median Population Age in Lake Annette?
Median Population Age in Lake Annette is 47.6 Years.
What is the Average Family Size in Lake Annette
Average Family Size in Lake Annette is 2.2 People.
What is the Average Household Size in Lake Annette
Average Household Size in Lake Annette is 1.7 People.
How Large is the Labor Force in Lake Annette?
There are 51 People in the Labor Forcein in Lake Annette.
What is the Percentage of People in the Labor Force in Lake Annette?
62.2% of People are in the Labor Force in Lake Annette.
What is the Unemployment Rate in Lake Annette?
Unemployment Rate in Lake Annette is 17.6%.