Zip Codes with the Highest Percentage of Households Heated by Fuel Oil / Kerosene in Minnesota
RELATED REPORTS & OPTIONS
Fuel Oil Heating
Minnesota
Compare Zip Codes
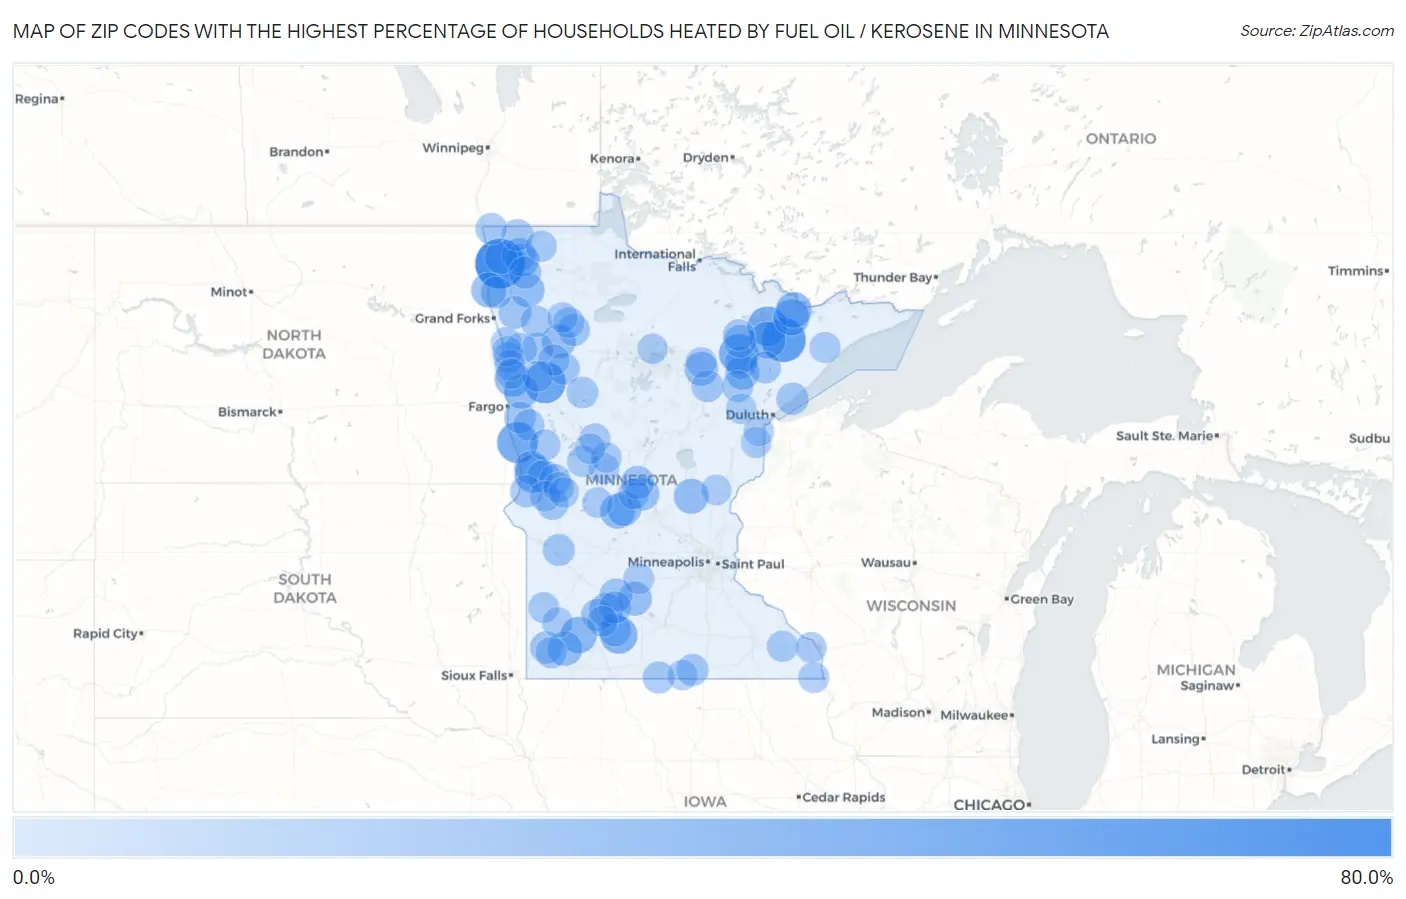
Map of Zip Codes with the Highest Percentage of Households Heated by Fuel Oil / Kerosene in Minnesota
0.0%
80.0%
Zip Codes with the Highest Percentage of Households Heated by Fuel Oil / Kerosene in Minnesota
| Zip Code | Fuel Oil Heating | vs State | vs National | |
| 1. | 56720 | 66.7% | 1.4%(+65.3)#1 | 4.2%(+62.5)#701 |
| 2. | 55706 | 50.6% | 1.4%(+49.2)#2 | 4.2%(+46.4)#1,796 |
| 3. | 56541 | 43.5% | 1.4%(+42.1)#3 | 4.2%(+39.3)#2,299 |
| 4. | 56553 | 41.3% | 1.4%(+39.9)#4 | 4.2%(+37.1)#2,462 |
| 5. | 55782 | 37.8% | 1.4%(+36.4)#5 | 4.2%(+33.6)#2,735 |
| 6. | 55758 | 36.9% | 1.4%(+35.5)#6 | 4.2%(+32.7)#2,806 |
| 7. | 56565 | 34.1% | 1.4%(+32.7)#7 | 4.2%(+29.9)#3,034 |
| 8. | 56022 | 31.1% | 1.4%(+29.7)#8 | 4.2%(+26.9)#3,252 |
| 9. | 55732 | 29.3% | 1.4%(+27.9)#9 | 4.2%(+25.1)#3,388 |
| 10. | 56125 | 28.6% | 1.4%(+27.2)#10 | 4.2%(+24.4)#3,448 |
| 11. | 55796 | 27.6% | 1.4%(+26.2)#11 | 4.2%(+23.4)#3,549 |
| 12. | 56574 | 27.0% | 1.4%(+25.6)#12 | 4.2%(+22.8)#3,592 |
| 13. | 55731 | 26.9% | 1.4%(+25.5)#13 | 4.2%(+22.7)#3,596 |
| 14. | 56744 | 24.5% | 1.4%(+23.1)#14 | 4.2%(+20.3)#3,825 |
| 15. | 56335 | 24.1% | 1.4%(+22.7)#15 | 4.2%(+19.9)#3,857 |
| 16. | 56313 | 24.0% | 1.4%(+22.6)#16 | 4.2%(+19.8)#3,868 |
| 17. | 56536 | 23.3% | 1.4%(+21.9)#17 | 4.2%(+19.1)#3,946 |
| 18. | 56141 | 23.3% | 1.4%(+21.9)#18 | 4.2%(+19.1)#3,947 |
| 19. | 56356 | 23.0% | 1.4%(+21.6)#19 | 4.2%(+18.8)#3,984 |
| 20. | 56760 | 22.2% | 1.4%(+20.8)#20 | 4.2%(+18.0)#4,048 |
| 21. | 55738 | 22.0% | 1.4%(+20.6)#21 | 4.2%(+17.8)#4,073 |
| 22. | 56224 | 21.3% | 1.4%(+19.9)#22 | 4.2%(+17.1)#4,147 |
| 23. | 55335 | 21.2% | 1.4%(+19.8)#23 | 4.2%(+17.0)#4,157 |
| 24. | 56556 | 21.1% | 1.4%(+19.7)#24 | 4.2%(+16.9)#4,164 |
| 25. | 55786 | 21.1% | 1.4%(+19.7)#25 | 4.2%(+16.9)#4,169 |
| 26. | 56729 | 20.8% | 1.4%(+19.4)#26 | 4.2%(+16.6)#4,204 |
| 27. | 56314 | 20.2% | 1.4%(+18.8)#27 | 4.2%(+16.0)#4,256 |
| 28. | 56522 | 20.2% | 1.4%(+18.8)#28 | 4.2%(+16.0)#4,261 |
| 29. | 56732 | 19.7% | 1.4%(+18.3)#29 | 4.2%(+15.5)#4,327 |
| 30. | 56328 | 19.5% | 1.4%(+18.1)#30 | 4.2%(+15.3)#4,349 |
| 31. | 55333 | 18.6% | 1.4%(+17.2)#31 | 4.2%(+14.4)#4,446 |
| 32. | 56019 | 18.5% | 1.4%(+17.1)#32 | 4.2%(+14.3)#4,458 |
| 33. | 56733 | 18.5% | 1.4%(+17.1)#33 | 4.2%(+14.3)#4,459 |
| 34. | 55751 | 18.1% | 1.4%(+16.7)#34 | 4.2%(+13.9)#4,500 |
| 35. | 56722 | 18.1% | 1.4%(+16.7)#35 | 4.2%(+13.9)#4,507 |
| 36. | 56590 | 18.0% | 1.4%(+16.6)#36 | 4.2%(+13.8)#4,521 |
| 37. | 55710 | 17.6% | 1.4%(+16.2)#37 | 4.2%(+13.4)#4,573 |
| 38. | 56294 | 17.4% | 1.4%(+16.0)#38 | 4.2%(+13.2)#4,616 |
| 39. | 56758 | 17.2% | 1.4%(+15.8)#39 | 4.2%(+13.0)#4,648 |
| 40. | 56128 | 17.1% | 1.4%(+15.7)#40 | 4.2%(+12.9)#4,658 |
| 41. | 56266 | 17.1% | 1.4%(+15.7)#41 | 4.2%(+12.9)#4,659 |
| 42. | 55609 | 16.9% | 1.4%(+15.5)#42 | 4.2%(+12.7)#4,696 |
| 43. | 56646 | 16.8% | 1.4%(+15.4)#43 | 4.2%(+12.6)#4,711 |
| 44. | 56296 | 16.5% | 1.4%(+15.1)#44 | 4.2%(+12.3)#4,758 |
| 45. | 56020 | 16.2% | 1.4%(+14.8)#45 | 4.2%(+12.0)#4,805 |
| 46. | 56262 | 15.9% | 1.4%(+14.5)#46 | 4.2%(+11.7)#4,851 |
| 47. | 56235 | 15.9% | 1.4%(+14.5)#47 | 4.2%(+11.7)#4,855 |
| 48. | 55793 | 15.8% | 1.4%(+14.4)#48 | 4.2%(+11.6)#4,872 |
| 49. | 56540 | 15.7% | 1.4%(+14.3)#49 | 4.2%(+11.5)#4,887 |
| 50. | 55763 | 15.7% | 1.4%(+14.3)#50 | 4.2%(+11.5)#4,892 |
| 51. | 56557 | 15.6% | 1.4%(+14.2)#51 | 4.2%(+11.4)#4,901 |
| 52. | 56027 | 15.6% | 1.4%(+14.2)#52 | 4.2%(+11.4)#4,906 |
| 53. | 56580 | 15.5% | 1.4%(+14.1)#53 | 4.2%(+11.3)#4,918 |
| 54. | 56710 | 15.4% | 1.4%(+14.0)#54 | 4.2%(+11.2)#4,939 |
| 55. | 56531 | 15.2% | 1.4%(+13.8)#55 | 4.2%(+11.0)#4,962 |
| 56. | 56735 | 15.1% | 1.4%(+13.7)#56 | 4.2%(+10.9)#4,980 |
| 57. | 56517 | 15.0% | 1.4%(+13.6)#57 | 4.2%(+10.8)#4,996 |
| 58. | 56575 | 14.7% | 1.4%(+13.3)#58 | 4.2%(+10.5)#5,055 |
| 59. | 56755 | 14.7% | 1.4%(+13.3)#59 | 4.2%(+10.5)#5,061 |
| 60. | 56514 | 14.6% | 1.4%(+13.2)#60 | 4.2%(+10.4)#5,070 |
| 61. | 56153 | 14.5% | 1.4%(+13.1)#61 | 4.2%(+10.3)#5,096 |
| 62. | 56516 | 14.4% | 1.4%(+13.0)#62 | 4.2%(+10.2)#5,111 |
| 63. | 55765 | 14.3% | 1.4%(+12.9)#63 | 4.2%(+10.1)#5,128 |
| 64. | 55703 | 14.2% | 1.4%(+12.8)#64 | 4.2%(+10.00)#5,144 |
| 65. | 56750 | 13.9% | 1.4%(+12.5)#65 | 4.2%(+9.70)#5,198 |
| 66. | 55979 | 13.8% | 1.4%(+12.4)#66 | 4.2%(+9.60)#5,220 |
| 67. | 56384 | 13.7% | 1.4%(+12.3)#67 | 4.2%(+9.50)#5,232 |
| 68. | 56684 | 13.6% | 1.4%(+12.2)#68 | 4.2%(+9.40)#5,247 |
| 69. | 56726 | 13.5% | 1.4%(+12.1)#69 | 4.2%(+9.30)#5,262 |
| 70. | 56588 | 13.5% | 1.4%(+12.1)#70 | 4.2%(+9.30)#5,266 |
| 71. | 56533 | 13.3% | 1.4%(+11.9)#71 | 4.2%(+9.10)#5,291 |
| 72. | 56518 | 13.0% | 1.4%(+11.6)#72 | 4.2%(+8.80)#5,355 |
| 73. | 56113 | 13.0% | 1.4%(+11.6)#73 | 4.2%(+8.80)#5,357 |
| 74. | 56584 | 12.9% | 1.4%(+11.5)#74 | 4.2%(+8.70)#5,372 |
| 75. | 55385 | 12.9% | 1.4%(+11.5)#75 | 4.2%(+8.70)#5,375 |
| 76. | 55603 | 12.9% | 1.4%(+11.5)#76 | 4.2%(+8.70)#5,384 |
| 77. | 56083 | 12.7% | 1.4%(+11.3)#77 | 4.2%(+8.50)#5,421 |
| 78. | 56446 | 12.6% | 1.4%(+11.2)#78 | 4.2%(+8.40)#5,443 |
| 79. | 55925 | 12.6% | 1.4%(+11.2)#79 | 4.2%(+8.40)#5,444 |
| 80. | 55931 | 12.6% | 1.4%(+11.2)#80 | 4.2%(+8.40)#5,447 |
| 81. | 56248 | 12.5% | 1.4%(+11.1)#81 | 4.2%(+8.30)#5,471 |
| 82. | 56581 | 12.5% | 1.4%(+11.1)#82 | 4.2%(+8.30)#5,474 |
| 83. | 56311 | 12.4% | 1.4%(+11.0)#83 | 4.2%(+8.20)#5,497 |
| 84. | 56437 | 12.3% | 1.4%(+10.9)#84 | 4.2%(+8.10)#5,510 |
| 85. | 55709 | 12.2% | 1.4%(+10.8)#85 | 4.2%(+8.00)#5,525 |
| 86. | 56527 | 12.2% | 1.4%(+10.8)#86 | 4.2%(+8.00)#5,532 |
| 87. | 56385 | 12.2% | 1.4%(+10.8)#87 | 4.2%(+8.00)#5,533 |
| 88. | 56523 | 12.1% | 1.4%(+10.7)#88 | 4.2%(+7.90)#5,556 |
| 89. | 56115 | 12.0% | 1.4%(+10.6)#89 | 4.2%(+7.80)#5,580 |
| 90. | 56548 | 11.9% | 1.4%(+10.5)#90 | 4.2%(+7.70)#5,601 |
| 91. | 55749 | 11.9% | 1.4%(+10.5)#91 | 4.2%(+7.70)#5,603 |
| 92. | 56568 | 11.9% | 1.4%(+10.5)#92 | 4.2%(+7.70)#5,605 |
| 93. | 55711 | 11.8% | 1.4%(+10.4)#93 | 4.2%(+7.60)#5,630 |
| 94. | 55797 | 11.7% | 1.4%(+10.3)#94 | 4.2%(+7.50)#5,650 |
| 95. | 56742 | 11.7% | 1.4%(+10.3)#95 | 4.2%(+7.50)#5,652 |
| 96. | 56550 | 11.7% | 1.4%(+10.3)#96 | 4.2%(+7.50)#5,659 |
| 97. | 55030 | 11.6% | 1.4%(+10.2)#97 | 4.2%(+7.40)#5,677 |
| 98. | 56339 | 11.6% | 1.4%(+10.2)#98 | 4.2%(+7.40)#5,680 |
| 99. | 56051 | 11.6% | 1.4%(+10.2)#99 | 4.2%(+7.40)#5,682 |
| 100. | 56681 | 11.3% | 1.4%(+9.90)#100 | 4.2%(+7.10)#5,754 |
Common Questions
What are the Top 10 Zip Codes with the Highest Percentage of Households Heated by Fuel Oil / Kerosene in Minnesota?
Top 10 Zip Codes with the Highest Percentage of Households Heated by Fuel Oil / Kerosene in Minnesota are:
What zip code has the Highest Percentage of Households Heated by Fuel Oil / Kerosene in Minnesota?
56720 has the Highest Percentage of Households Heated by Fuel Oil / Kerosene in Minnesota with 66.7%.
What is the Percentage of Households Heated by Fuel Oil / Kerosene in the State of Minnesota?
Percentage of Households Heated by Fuel Oil / Kerosene in Minnesota is 1.4%.
What is the Percentage of Households Heated by Fuel Oil / Kerosene in the United States?
Percentage of Households Heated by Fuel Oil / Kerosene in the United States is 4.2%.