Zip Codes with the Most Immigrants from El Salvador in Kentucky
RELATED REPORTS & OPTIONS
El Salvador
Kentucky
Compare Zip Codes
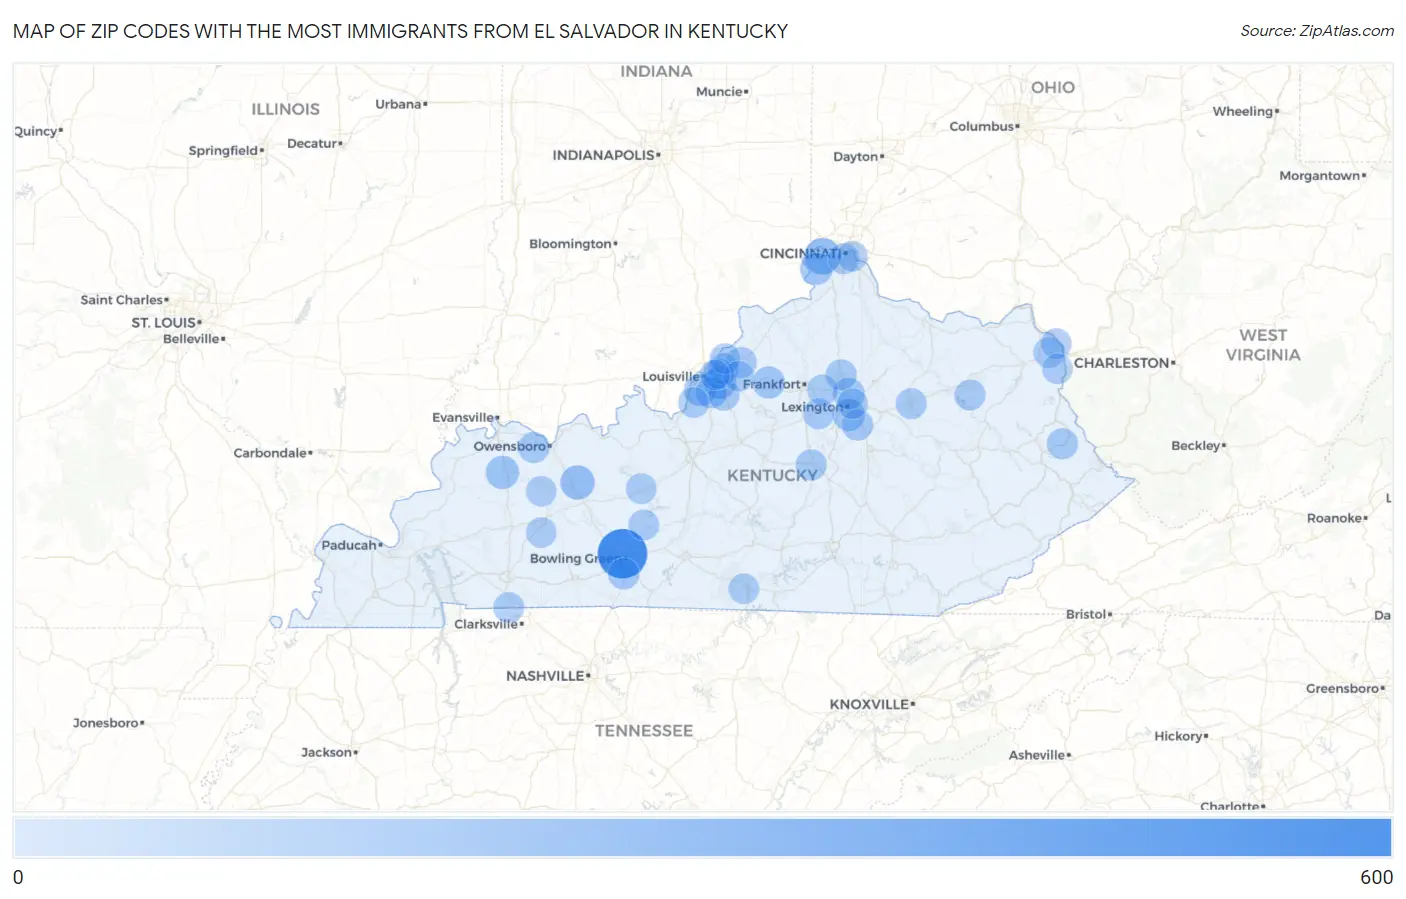
Map of Zip Codes with the Most Immigrants from El Salvador in Kentucky
0
600
Zip Codes with the Most Immigrants from El Salvador in Kentucky
| Zip Code | El Salvador | vs State | vs National | |
| 1. | 42101 | 565 | 1,652(34.20%)#1 | 1,408,349(0.04%)#548 |
| 2. | 41048 | 175 | 1,652(10.59%)#2 | 1,408,349(0.01%)#1,509 |
| 3. | 42347 | 112 | 1,652(6.78%)#3 | 1,408,349(0.01%)#2,073 |
| 4. | 42455 | 84 | 1,652(5.08%)#4 | 1,408,349(0.01%)#2,487 |
| 5. | 40220 | 66 | 1,652(4.00%)#5 | 1,408,349(0.00%)#2,839 |
| 6. | 41005 | 55 | 1,652(3.33%)#6 | 1,408,349(0.00%)#3,112 |
| 7. | 40517 | 53 | 1,652(3.21%)#7 | 1,408,349(0.00%)#3,165 |
| 8. | 40065 | 51 | 1,652(3.09%)#8 | 1,408,349(0.00%)#3,229 |
| 9. | 40214 | 47 | 1,652(2.85%)#9 | 1,408,349(0.00%)#3,340 |
| 10. | 40511 | 41 | 1,652(2.48%)#10 | 1,408,349(0.00%)#3,546 |
| 11. | 40219 | 32 | 1,652(1.94%)#11 | 1,408,349(0.00%)#3,918 |
| 12. | 42104 | 30 | 1,652(1.82%)#12 | 1,408,349(0.00%)#4,009 |
| 13. | 40291 | 27 | 1,652(1.63%)#13 | 1,408,349(0.00%)#4,151 |
| 14. | 40515 | 23 | 1,652(1.39%)#14 | 1,408,349(0.00%)#4,377 |
| 15. | 42301 | 22 | 1,652(1.33%)#15 | 1,408,349(0.00%)#4,446 |
| 16. | 40324 | 21 | 1,652(1.27%)#16 | 1,408,349(0.00%)#4,514 |
| 17. | 41214 | 20 | 1,652(1.21%)#17 | 1,408,349(0.00%)#4,658 |
| 18. | 40422 | 18 | 1,652(1.09%)#18 | 1,408,349(0.00%)#4,763 |
| 19. | 41011 | 17 | 1,652(1.03%)#19 | 1,408,349(0.00%)#4,839 |
| 20. | 40014 | 16 | 1,652(0.97%)#20 | 1,408,349(0.00%)#4,919 |
| 21. | 40353 | 15 | 1,652(0.91%)#21 | 1,408,349(0.00%)#5,014 |
| 22. | 40313 | 15 | 1,652(0.91%)#22 | 1,408,349(0.00%)#5,062 |
| 23. | 40241 | 14 | 1,652(0.85%)#23 | 1,408,349(0.00%)#5,091 |
| 24. | 40383 | 13 | 1,652(0.79%)#24 | 1,408,349(0.00%)#5,187 |
| 25. | 40347 | 13 | 1,652(0.79%)#25 | 1,408,349(0.00%)#5,237 |
| 26. | 40505 | 12 | 1,652(0.73%)#26 | 1,408,349(0.00%)#5,281 |
| 27. | 42210 | 11 | 1,652(0.67%)#27 | 1,408,349(0.00%)#5,432 |
| 28. | 40272 | 10 | 1,652(0.61%)#28 | 1,408,349(0.00%)#5,460 |
| 29. | 40222 | 9 | 1,652(0.54%)#29 | 1,408,349(0.00%)#5,618 |
| 30. | 41102 | 9 | 1,652(0.54%)#30 | 1,408,349(0.00%)#5,619 |
| 31. | 42223 | 9 | 1,652(0.54%)#31 | 1,408,349(0.00%)#5,626 |
| 32. | 41101 | 9 | 1,652(0.54%)#32 | 1,408,349(0.00%)#5,630 |
| 33. | 40059 | 7 | 1,652(0.42%)#33 | 1,408,349(0.00%)#5,874 |
| 34. | 42754 | 7 | 1,652(0.42%)#34 | 1,408,349(0.00%)#5,889 |
| 35. | 42717 | 6 | 1,652(0.36%)#35 | 1,408,349(0.00%)#6,039 |
| 36. | 41129 | 5 | 1,652(0.30%)#36 | 1,408,349(0.00%)#6,152 |
| 37. | 40245 | 4 | 1,652(0.24%)#37 | 1,408,349(0.00%)#6,221 |
| 38. | 42345 | 4 | 1,652(0.24%)#38 | 1,408,349(0.00%)#6,257 |
| 39. | 42350 | 3 | 1,652(0.18%)#39 | 1,408,349(0.00%)#6,400 |
| 40. | 40207 | 1 | 1,652(0.06%)#40 | 1,408,349(0.00%)#6,518 |
| 41. | 41075 | 1 | 1,652(0.06%)#41 | 1,408,349(0.00%)#6,535 |
Common Questions
What are the Top 10 Zip Codes with the Most Immigrants from El Salvador in Kentucky?
Top 10 Zip Codes with the Most Immigrants from El Salvador in Kentucky are:
What zip code has the Most Immigrants from El Salvador in Kentucky?
42101 has the Most Immigrants from El Salvador in Kentucky with 565.
What is the Total Immigrants from El Salvador in the State of Kentucky?
Total Immigrants from El Salvador in Kentucky is 1,652.
What is the Total Immigrants from El Salvador in the United States?
Total Immigrants from El Salvador in the United States is 1,408,349.