Zip Codes with the Highest Percentage of Families with Income Above $100,000 in Leawood, KS
RELATED REPORTS & OPTIONS
Family Income | $100k+
Leawood
Compare Zip Codes
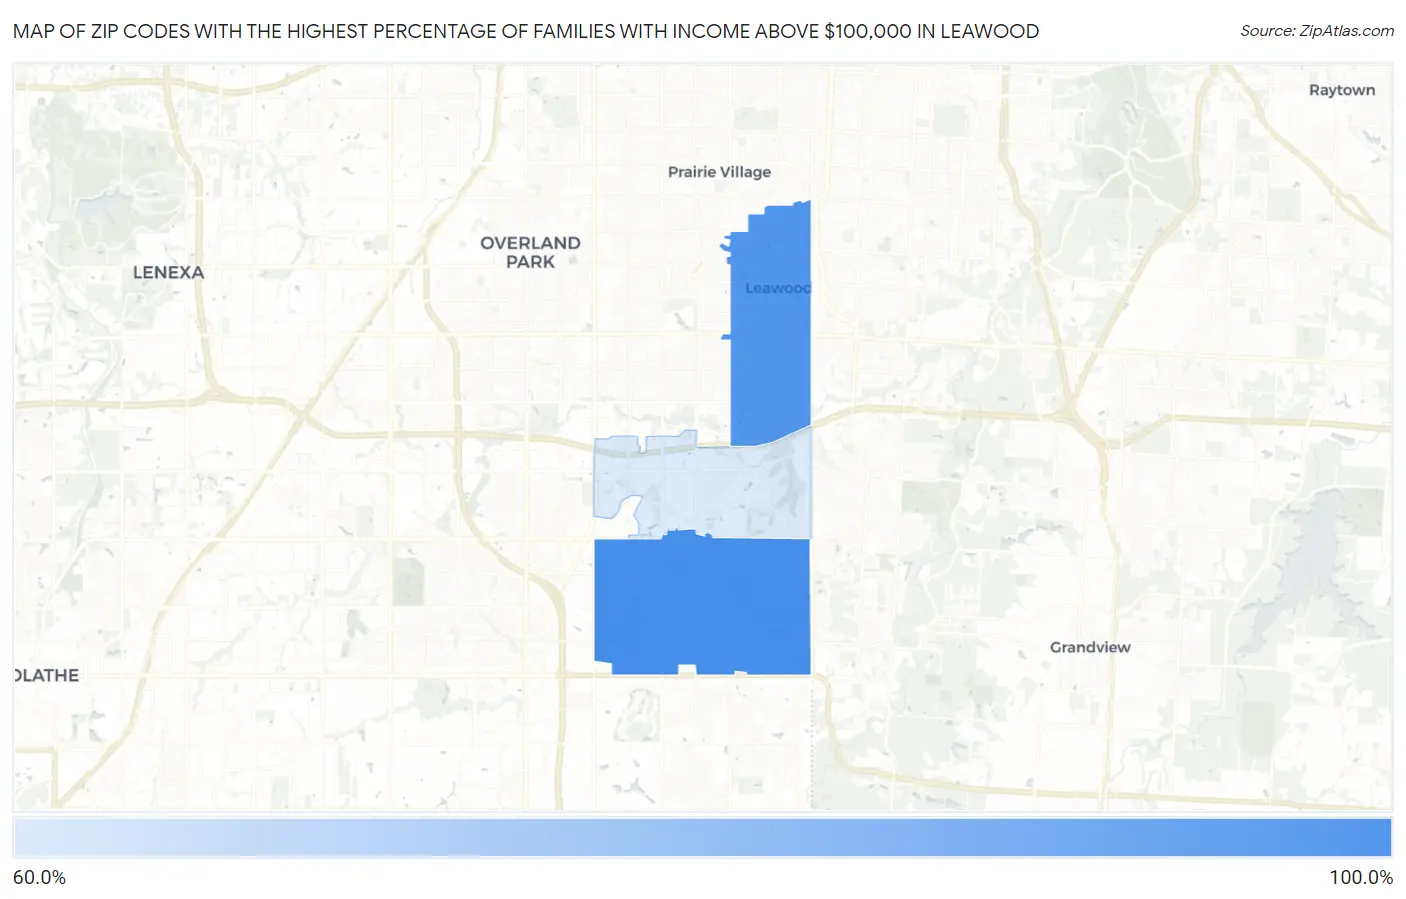
Map of Zip Codes with the Highest Percentage of Families with Income Above $100,000 in Leawood
63.7%
80.8%
Zip Codes with the Highest Percentage of Families with Income Above $100,000 in Leawood, KS
| Zip Code | Families with Income > $100k | vs State | vs National | |
| 1. | 66209 | 80.8% | 43.8%(+37.0)#9 | 46.1%(+34.7)#937 |
| 2. | 66206 | 79.4% | 43.8%(+35.6)#13 | 46.1%(+33.3)#1,091 |
| 3. | 66211 | 63.7% | 43.8%(+19.9)#41 | 46.1%(+17.6)#4,102 |
1
Common Questions
What are the Top Zip Codes with the Highest Percentage of Families with Income Above $100,000 in Leawood, KS?
Top Zip Codes with the Highest Percentage of Families with Income Above $100,000 in Leawood, KS are:
What zip code has the Highest Percentage of Families with Income Above $100,000 in Leawood, KS?
66209 has the Highest Percentage of Families with Income Above $100,000 in Leawood, KS with 80.8%.
What is the Percentage of Families with Income Above $100,000 in Leawood, KS?
Percentage of Families with Income Above $100,000 in Leawood is 83.7%.
What is the Percentage of Families with Income Above $100,000 in Kansas?
Percentage of Families with Income Above $100,000 in Kansas is 43.8%.
What is the Percentage of Families with Income Above $100,000 in the United States?
Percentage of Families with Income Above $100,000 in the United States is 46.1%.