Zip Codes with the Highest Percentage of Families with Income Above $100,000 in Lenexa, KS
RELATED REPORTS & OPTIONS
Family Income | $100k+
Lenexa
Compare Zip Codes
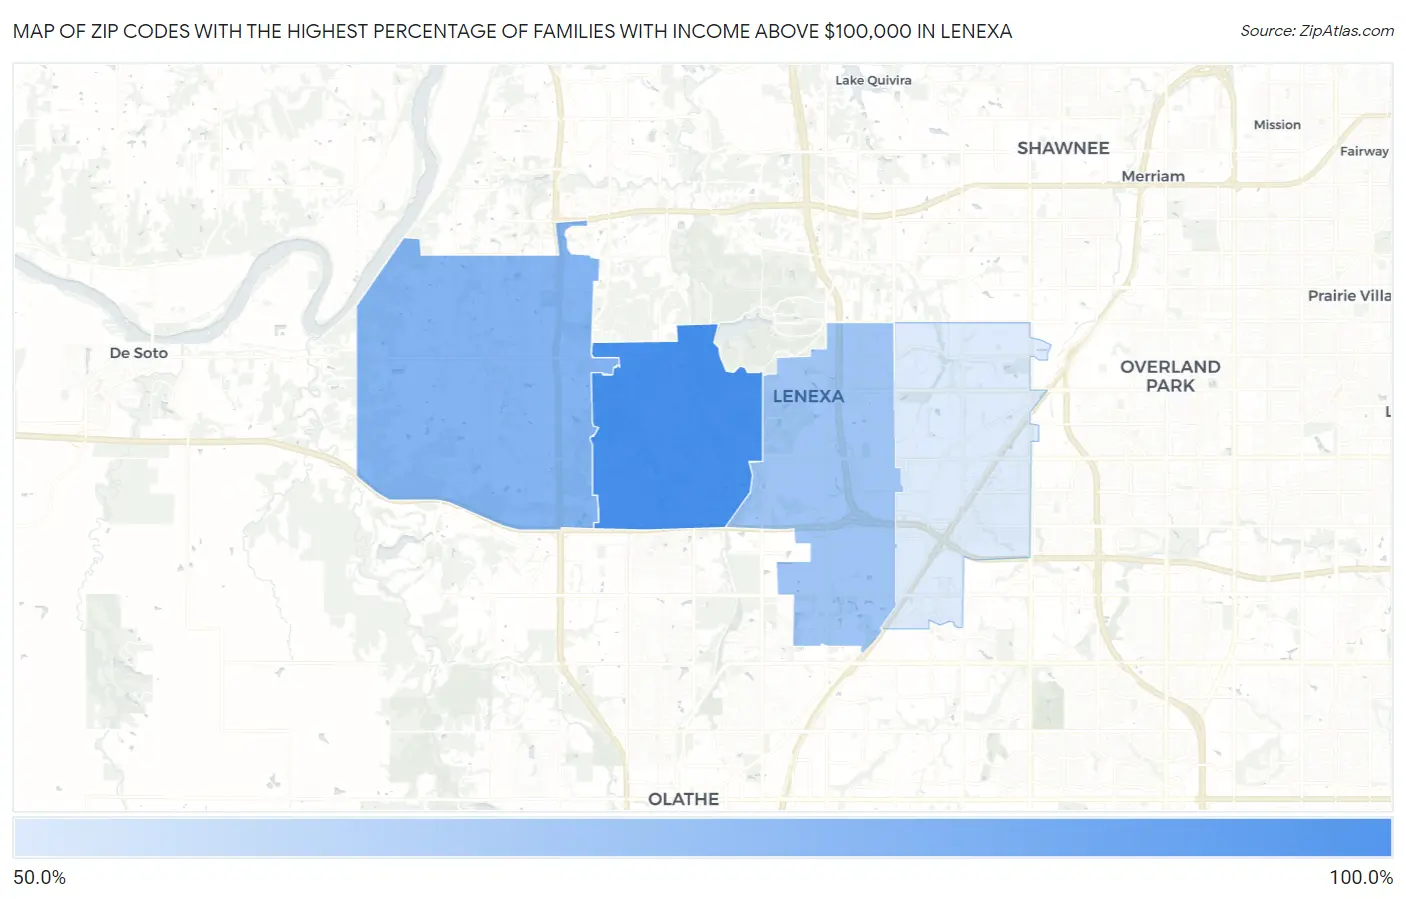
Map of Zip Codes with the Highest Percentage of Families with Income Above $100,000 in Lenexa
54.0%
84.1%
Zip Codes with the Highest Percentage of Families with Income Above $100,000 in Lenexa, KS
| Zip Code | Families with Income > $100k | vs State | vs National | |
| 1. | 66220 | 84.1% | 43.8%(+40.3)#7 | 46.1%(+38.0)#660 |
| 2. | 66227 | 71.3% | 43.8%(+27.5)#22 | 46.1%(+25.2)#2,349 |
| 3. | 66219 | 65.8% | 43.8%(+22.0)#33 | 46.1%(+19.7)#3,540 |
| 4. | 66215 | 54.0% | 43.8%(+10.2)#91 | 46.1%(+7.90)#7,155 |
1
Common Questions
What are the Top 3 Zip Codes with the Highest Percentage of Families with Income Above $100,000 in Lenexa, KS?
Top 3 Zip Codes with the Highest Percentage of Families with Income Above $100,000 in Lenexa, KS are:
What zip code has the Highest Percentage of Families with Income Above $100,000 in Lenexa, KS?
66220 has the Highest Percentage of Families with Income Above $100,000 in Lenexa, KS with 84.1%.
What is the Percentage of Families with Income Above $100,000 in Lenexa, KS?
Percentage of Families with Income Above $100,000 in Lenexa is 64.6%.
What is the Percentage of Families with Income Above $100,000 in Kansas?
Percentage of Families with Income Above $100,000 in Kansas is 43.8%.
What is the Percentage of Families with Income Above $100,000 in the United States?
Percentage of Families with Income Above $100,000 in the United States is 46.1%.