Cities with the Highest Percentage of Population Employed in Agriculture, Fishing & Hunting in Georgia
RELATED REPORTS & OPTIONS
Agriculture, Fishing & Hunting
Georgia
Compare Cities
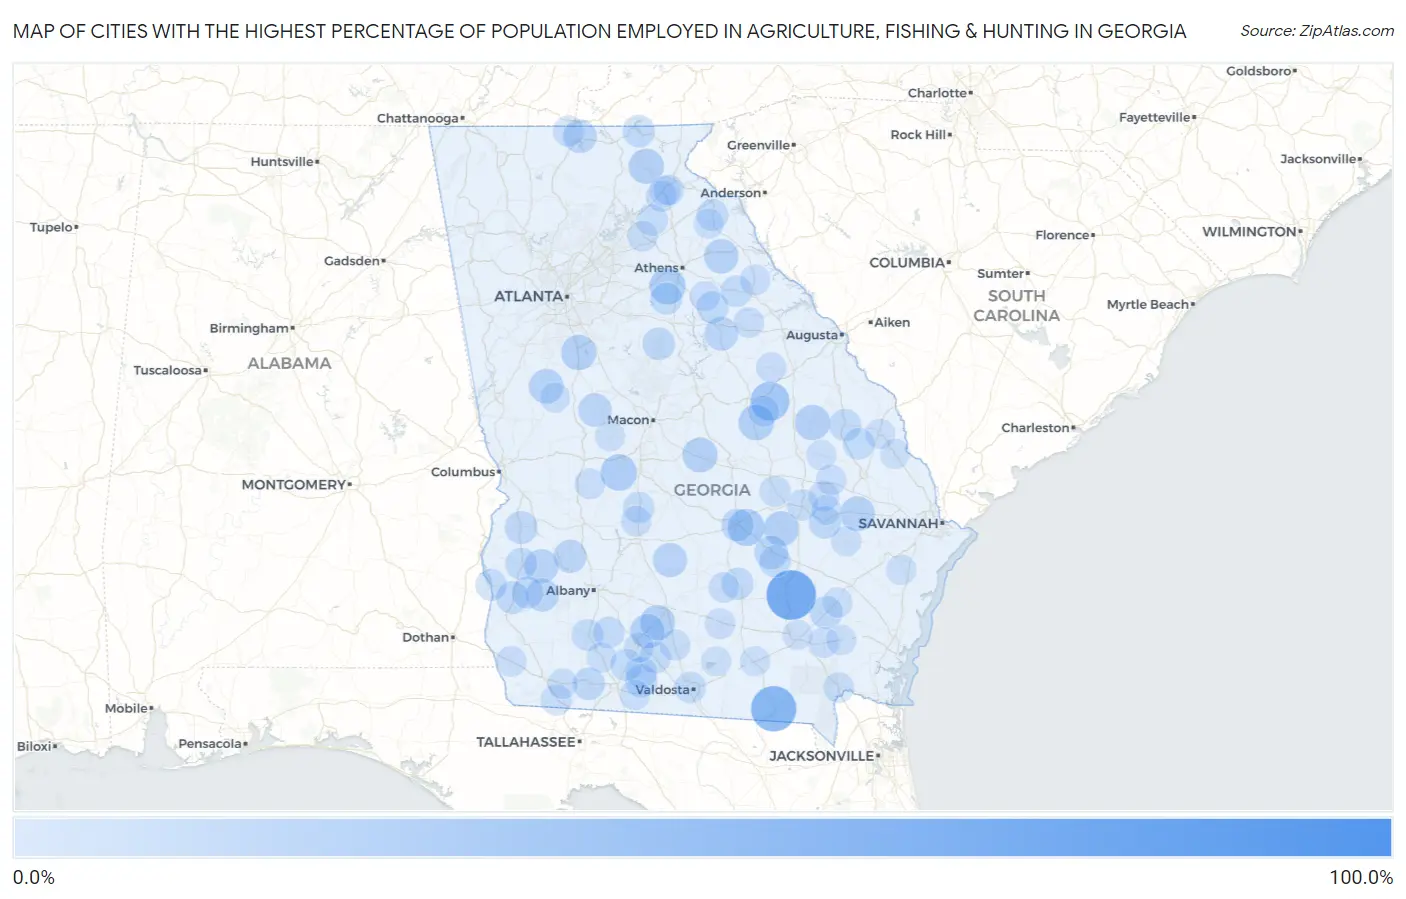
Map of Cities with the Highest Percentage of Population Employed in Agriculture, Fishing & Hunting in Georgia
0.0%
100.0%
Cities with the Highest Percentage of Population Employed in Agriculture, Fishing & Hunting in Georgia
| City | % Employed | vs State | vs National | |
| 1. | Cogdell | 100.0% | 0.91%(+99.1)#1 | 1.2%(+98.8)#42 |
| 2. | Rockingham | 67.5% | 0.91%(+66.6)#2 | 1.2%(+66.3)#108 |
| 3. | Fargo | 53.6% | 0.91%(+52.7)#3 | 1.2%(+52.4)#178 |
| 4. | Davisboro | 32.1% | 0.91%(+31.2)#4 | 1.2%(+30.9)#456 |
| 5. | Scotland | 26.1% | 0.91%(+25.2)#5 | 1.2%(+24.9)#678 |
| 6. | Marshallville | 24.0% | 0.91%(+23.1)#6 | 1.2%(+22.8)#768 |
| 7. | North High Shoals | 23.6% | 0.91%(+22.7)#7 | 1.2%(+22.4)#787 |
| 8. | Harrison | 21.4% | 0.91%(+20.5)#8 | 1.2%(+20.2)#907 |
| 9. | Midville | 20.3% | 0.91%(+19.4)#9 | 1.2%(+19.1)#982 |
| 10. | Sunny Side | 20.3% | 0.91%(+19.4)#10 | 1.2%(+19.1)#985 |
| 11. | Uvalda | 20.0% | 0.91%(+19.1)#11 | 1.2%(+18.8)#1,002 |
| 12. | Sautee Nacoochee | 19.8% | 0.91%(+18.9)#12 | 1.2%(+18.6)#1,025 |
| 13. | Omega | 19.5% | 0.91%(+18.6)#13 | 1.2%(+18.3)#1,049 |
| 14. | Allentown | 19.4% | 0.91%(+18.4)#14 | 1.2%(+18.2)#1,060 |
| 15. | Daisy | 19.2% | 0.91%(+18.3)#15 | 1.2%(+18.0)#1,075 |
| 16. | Gay | 18.5% | 0.91%(+17.6)#16 | 1.2%(+17.3)#1,124 |
| 17. | Dixie | 18.4% | 0.91%(+17.5)#17 | 1.2%(+17.2)#1,129 |
| 18. | Carlton | 17.9% | 0.91%(+17.0)#18 | 1.2%(+16.7)#1,174 |
| 19. | Norman Park | 17.7% | 0.91%(+16.8)#19 | 1.2%(+16.5)#1,194 |
| 20. | Rebecca | 16.9% | 0.91%(+16.0)#20 | 1.2%(+15.7)#1,275 |
| 21. | Shellman | 16.5% | 0.91%(+15.6)#21 | 1.2%(+15.3)#1,320 |
| 22. | White Plains | 15.2% | 0.91%(+14.3)#22 | 1.2%(+14.0)#1,460 |
| 23. | Hazlehurst | 14.7% | 0.91%(+13.8)#23 | 1.2%(+13.5)#1,515 |
| 24. | Mineral Bluff | 14.6% | 0.91%(+13.7)#24 | 1.2%(+13.4)#1,524 |
| 25. | Yatesville | 14.4% | 0.91%(+13.5)#25 | 1.2%(+13.2)#1,559 |
| 26. | Morgan | 14.0% | 0.91%(+13.1)#26 | 1.2%(+12.8)#1,604 |
| 27. | Bronwood | 13.6% | 0.91%(+12.7)#27 | 1.2%(+12.4)#1,660 |
| 28. | Echols County Consolidated Government | 13.3% | 0.91%(+12.3)#28 | 1.2%(+12.1)#1,707 |
| 29. | Lumpkin | 12.8% | 0.91%(+11.9)#29 | 1.2%(+11.6)#1,781 |
| 30. | Offerman | 12.1% | 0.91%(+11.2)#30 | 1.2%(+10.9)#1,896 |
| 31. | Shady Dale | 12.0% | 0.91%(+11.1)#31 | 1.2%(+10.8)#1,911 |
| 32. | Mcrae Helena | 11.8% | 0.91%(+10.9)#32 | 1.2%(+10.6)#1,948 |
| 33. | Bluffton | 11.7% | 0.91%(+10.8)#33 | 1.2%(+10.5)#1,978 |
| 34. | Cairo | 11.4% | 0.91%(+10.5)#34 | 1.2%(+10.2)#2,047 |
| 35. | Reidsville | 11.2% | 0.91%(+10.3)#35 | 1.2%(+10.0)#2,087 |
| 36. | Hiawassee | 11.2% | 0.91%(+10.3)#36 | 1.2%(+10.0)#2,092 |
| 37. | Barwick | 11.0% | 0.91%(+10.1)#37 | 1.2%(+9.80)#2,149 |
| 38. | Broxton | 10.4% | 0.91%(+9.51)#38 | 1.2%(+9.22)#2,299 |
| 39. | Woodville | 10.3% | 0.91%(+9.35)#39 | 1.2%(+9.06)#2,360 |
| 40. | Millen | 10.2% | 0.91%(+9.34)#40 | 1.2%(+9.05)#2,369 |
| 41. | Bostwick | 10.1% | 0.91%(+9.22)#41 | 1.2%(+8.93)#2,399 |
| 42. | Cuthbert | 9.8% | 0.91%(+8.89)#42 | 1.2%(+8.60)#2,491 |
| 43. | Edison | 9.7% | 0.91%(+8.81)#43 | 1.2%(+8.52)#2,517 |
| 44. | Coolidge | 9.7% | 0.91%(+8.78)#44 | 1.2%(+8.49)#2,524 |
| 45. | Canon | 9.7% | 0.91%(+8.76)#45 | 1.2%(+8.47)#2,531 |
| 46. | Berlin | 9.5% | 0.91%(+8.56)#46 | 1.2%(+8.27)#2,599 |
| 47. | Camilla | 9.5% | 0.91%(+8.55)#47 | 1.2%(+8.26)#2,603 |
| 48. | Faceville | 9.2% | 0.91%(+8.32)#48 | 1.2%(+8.03)#2,684 |
| 49. | Satilla | 9.1% | 0.91%(+8.18)#49 | 1.2%(+7.89)#2,720 |
| 50. | Rayle | 9.1% | 0.91%(+8.18)#50 | 1.2%(+7.89)#2,733 |
| 51. | Fort Gaines | 8.7% | 0.91%(+7.76)#51 | 1.2%(+7.47)#2,888 |
| 52. | Remerton | 8.6% | 0.91%(+7.70)#52 | 1.2%(+7.41)#2,916 |
| 53. | Rocky Ford | 8.5% | 0.91%(+7.63)#53 | 1.2%(+7.34)#2,938 |
| 54. | Pinehurst | 8.2% | 0.91%(+7.34)#54 | 1.2%(+7.05)#3,051 |
| 55. | Sale City | 8.2% | 0.91%(+7.32)#55 | 1.2%(+7.03)#3,057 |
| 56. | Pavo | 7.7% | 0.91%(+6.81)#56 | 1.2%(+6.52)#3,245 |
| 57. | Webster County Unified Government | 7.6% | 0.91%(+6.64)#57 | 1.2%(+6.35)#3,332 |
| 58. | Epworth | 7.5% | 0.91%(+6.58)#58 | 1.2%(+6.29)#3,366 |
| 59. | Lyons | 7.5% | 0.91%(+6.57)#59 | 1.2%(+6.28)#3,372 |
| 60. | Gillsville | 7.5% | 0.91%(+6.55)#60 | 1.2%(+6.26)#3,381 |
| 61. | Godfrey | 7.1% | 0.91%(+6.23)#61 | 1.2%(+5.94)#3,523 |
| 62. | Tarrytown | 7.1% | 0.91%(+6.23)#62 | 1.2%(+5.94)#3,527 |
| 63. | Attapulgus | 7.0% | 0.91%(+6.11)#63 | 1.2%(+5.82)#3,583 |
| 64. | Sparks | 6.5% | 0.91%(+5.63)#64 | 1.2%(+5.34)#3,829 |
| 65. | Baldwin | 6.4% | 0.91%(+5.48)#65 | 1.2%(+5.19)#3,896 |
| 66. | Ideal | 6.4% | 0.91%(+5.46)#66 | 1.2%(+5.17)#3,909 |
| 67. | Cornelia | 6.2% | 0.91%(+5.34)#67 | 1.2%(+5.05)#3,980 |
| 68. | Tignall | 6.1% | 0.91%(+5.20)#68 | 1.2%(+4.91)#4,051 |
| 69. | Willacoochee | 6.1% | 0.91%(+5.17)#69 | 1.2%(+4.88)#4,072 |
| 70. | Riddleville | 6.1% | 0.91%(+5.15)#70 | 1.2%(+4.86)#4,087 |
| 71. | Cobbtown | 6.0% | 0.91%(+5.08)#71 | 1.2%(+4.79)#4,120 |
| 72. | Folkston | 5.9% | 0.91%(+5.03)#72 | 1.2%(+4.74)#4,151 |
| 73. | Talmo | 5.9% | 0.91%(+5.02)#73 | 1.2%(+4.73)#4,159 |
| 74. | Hoboken | 5.8% | 0.91%(+4.87)#74 | 1.2%(+4.58)#4,249 |
| 75. | Sharon | 5.6% | 0.91%(+4.65)#75 | 1.2%(+4.36)#4,438 |
| 76. | Donalsonville | 5.4% | 0.91%(+4.48)#76 | 1.2%(+4.19)#4,545 |
| 77. | Vienna | 5.3% | 0.91%(+4.41)#77 | 1.2%(+4.12)#4,595 |
| 78. | Ambrose | 5.3% | 0.91%(+4.41)#78 | 1.2%(+4.12)#4,596 |
| 79. | Mount Airy | 5.2% | 0.91%(+4.32)#79 | 1.2%(+4.03)#4,660 |
| 80. | Metter | 5.1% | 0.91%(+4.23)#80 | 1.2%(+3.94)#4,734 |
| 81. | Maxeys | 4.9% | 0.91%(+4.02)#81 | 1.2%(+3.73)#4,886 |
| 82. | Climax | 4.8% | 0.91%(+3.93)#82 | 1.2%(+3.64)#4,970 |
| 83. | Gibson | 4.8% | 0.91%(+3.91)#83 | 1.2%(+3.62)#4,983 |
| 84. | Nahunta | 4.8% | 0.91%(+3.90)#84 | 1.2%(+3.61)#5,000 |
| 85. | Roberta | 4.7% | 0.91%(+3.79)#85 | 1.2%(+3.50)#5,086 |
| 86. | Deenwood | 4.7% | 0.91%(+3.76)#86 | 1.2%(+3.47)#5,106 |
| 87. | Riceboro | 4.5% | 0.91%(+3.64)#87 | 1.2%(+3.35)#5,203 |
| 88. | Screven | 4.5% | 0.91%(+3.62)#88 | 1.2%(+3.33)#5,232 |
| 89. | Twin City | 4.5% | 0.91%(+3.61)#89 | 1.2%(+3.32)#5,239 |
| 90. | Franklin Springs | 4.4% | 0.91%(+3.54)#90 | 1.2%(+3.25)#5,307 |
| 91. | Glennville | 4.4% | 0.91%(+3.44)#91 | 1.2%(+3.15)#5,403 |
| 92. | Homerville | 4.3% | 0.91%(+3.44)#92 | 1.2%(+3.15)#5,406 |
| 93. | Molena | 4.3% | 0.91%(+3.40)#93 | 1.2%(+3.11)#5,468 |
| 94. | Boston | 4.3% | 0.91%(+3.34)#94 | 1.2%(+3.05)#5,513 |
| 95. | Meigs | 4.2% | 0.91%(+3.29)#95 | 1.2%(+3.00)#5,544 |
| 96. | Collins | 4.2% | 0.91%(+3.29)#96 | 1.2%(+3.00)#5,545 |
| 97. | Sylvania | 4.1% | 0.91%(+3.19)#97 | 1.2%(+2.90)#5,676 |
| 98. | Lakeland | 4.1% | 0.91%(+3.18)#98 | 1.2%(+2.89)#5,681 |
| 99. | Newington | 4.0% | 0.91%(+3.13)#99 | 1.2%(+2.84)#5,717 |
| 100. | Moultrie | 4.0% | 0.91%(+3.10)#100 | 1.2%(+2.81)#5,753 |
Common Questions
What are the Top 10 Cities with the Highest Percentage of Population Employed in Agriculture, Fishing & Hunting in Georgia?
Top 10 Cities with the Highest Percentage of Population Employed in Agriculture, Fishing & Hunting in Georgia are:
#1
67.5%
#2
53.6%
#3
32.1%
#4
26.1%
#5
24.0%
#6
23.6%
#7
21.4%
#8
20.3%
#9
20.3%
#10
20.0%
What city has the Highest Percentage of Population Employed in Agriculture, Fishing & Hunting in Georgia?
Rockingham has the Highest Percentage of Population Employed in Agriculture, Fishing & Hunting in Georgia with 67.5%.
What is the Percentage of Population Employed in Agriculture, Fishing & Hunting in the State of Georgia?
Percentage of Population Employed in Agriculture, Fishing & Hunting in Georgia is 0.91%.
What is the Percentage of Population Employed in Agriculture, Fishing & Hunting in the United States?
Percentage of Population Employed in Agriculture, Fishing & Hunting in the United States is 1.2%.