Zip Codes with the Highest Percentage of Population Employed in Agriculture, Fishing & Hunting in Warner Robins, GA
RELATED REPORTS & OPTIONS
Agriculture, Fishing & Hunting
Warner Robins
Compare Zip Codes
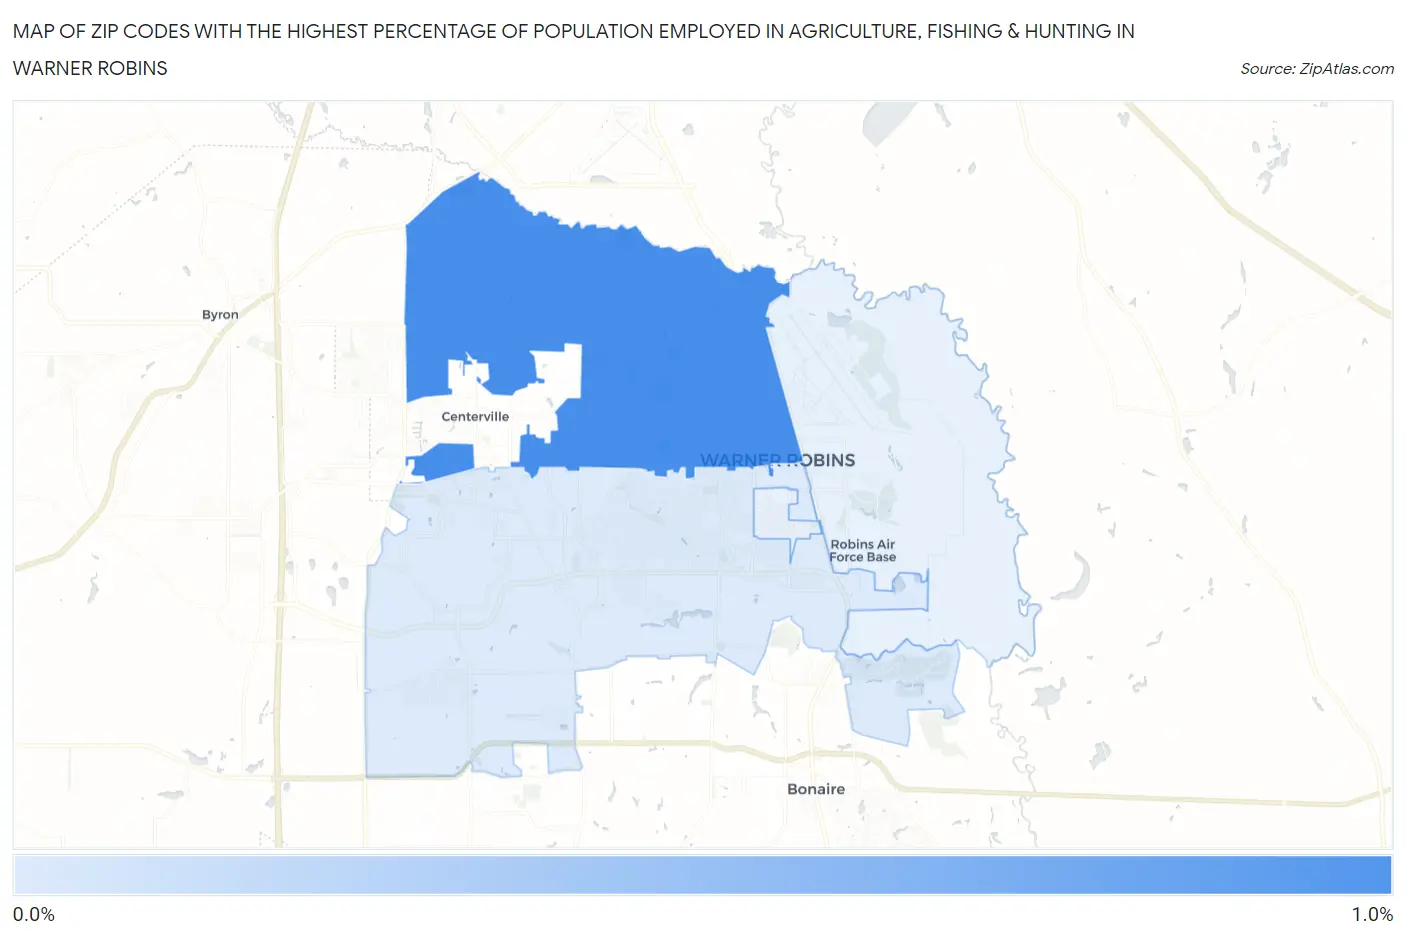
Map of Zip Codes with the Highest Percentage of Population Employed in Agriculture, Fishing & Hunting in Warner Robins
0.17%
0.90%
Zip Codes with the Highest Percentage of Population Employed in Agriculture, Fishing & Hunting in Warner Robins, GA
| Zip Code | % Employed | vs State | vs National | |
| 1. | 31093 | 0.90% | 0.91%(-0.005)#352 | 1.2%(-0.295)#16,686 |
| 2. | 31088 | 0.17% | 0.91%(-0.737)#500 | 1.2%(-1.03)#22,690 |
1
Common Questions
What are the Top Zip Codes with the Highest Percentage of Population Employed in Agriculture, Fishing & Hunting in Warner Robins, GA?
Top Zip Codes with the Highest Percentage of Population Employed in Agriculture, Fishing & Hunting in Warner Robins, GA are:
What zip code has the Highest Percentage of Population Employed in Agriculture, Fishing & Hunting in Warner Robins, GA?
31093 has the Highest Percentage of Population Employed in Agriculture, Fishing & Hunting in Warner Robins, GA with 0.90%.
What is the Percentage of Population Employed in Agriculture, Fishing & Hunting in Warner Robins, GA?
Percentage of Population Employed in Agriculture, Fishing & Hunting in Warner Robins is 0.18%.
What is the Percentage of Population Employed in Agriculture, Fishing & Hunting in Georgia?
Percentage of Population Employed in Agriculture, Fishing & Hunting in Georgia is 0.91%.
What is the Percentage of Population Employed in Agriculture, Fishing & Hunting in the United States?
Percentage of Population Employed in Agriculture, Fishing & Hunting in the United States is 1.2%.